Abstract
In Europe, the qualification of injection anchors in masonry under static and quasi-static actions is based on an assessment of tests performed in undamaged masonry. Nevertheless, in seismic prone countries like Italy the influences deriving from earthquake actions cannot be disregarded. Masonry elements are very sensitive to cyclic/seismic action and research on the behavior of anchors in damaged masonry is rather limited. The paper presents the results of an experimental campaign aimed at evaluating the residual tensile strength of adhesive anchors installed into undamaged walls that were subsequently subjected to cyclic in-plane loading to simulate seismic actions before. Consequently, the anchors experienced different stresses depending on their location within the walls. Overall, 29 tests were performed with anchors placed both, in undamaged and damaged areas. The results showed that there is a correlation between residual tensile strength and masonry initial conditions, and therefore the installation of anchors in masonry elements should be carefully planned avoiding areas that could be heavily damaged during seismic events or considering redundant connections in critical areas. In particular, it seems that the width of the crack (created by cyclic actions) that passes nearby/into the anchor borehole is the main parameter that affects the ultimate resistance of the anchors.
1. Introduction
It is well-known that masonry structures are highly vulnerable to seismic actions, since they have great mass, low tensile strength, and ductility. In addition, in many cases the geometrical and/or mechanical irregularities increase the vulnerability of masonry structures [1,2].
In the past decades, many efforts have been made to assess the vulnerability of existing structures by developing assessment techniques [1,2,3,4,5,6,7,8] and to evaluate the effect of the different strengthening techniques by performing experimental research [9,10,11,12].
It is well-known that the improvement of the “box like effect” could be achieved in several ways, but one very common technique is the use of steel connections [11,12]. Among them, post-installed anchors are very popular, because of their flexibility and easiness of installation. In addition, in Europe the qualification and design of post-installed injection anchors for use in masonry are regulated according to EOTA provisions [13,14] and thus the reliability of the application is guaranteed. Nevertheless, the existing approach—being developed for static and quasi-static actions—only considers the assessment of performances in uncracked masonry, while it is well-known that, especially under seismic events, masonry develops a more or less diffused crack pattern [2,3,4,5,6,7,8,9,10,11,12,13,14,15].
The assessment of post-installed bonded anchors in concrete [16] clearly distinguishes between non-cracked/cracked concrete and, depending on different parameters (type of adhesive, bar diameter; crack width…) the reduction of load, between the two conditions (non-cracked/cracked) could easily reach 50%. The designers of reinforced concrete (RC) structures must distinguish, on the basis of structure characteristics, between non-cracked/cracked condition, and avoid installing anchors in critical areas (e.g., plastic hinges) [17]. For anchor applications in concrete under seismic actions, the base material is always assumed to be cracked.
As the current concept for masonry anchors only considers predominantly static and quasi-static actions on the anchors and thus implies the same conditions for the masonry structures, there is no distinction in the assessment between cracked and non-cracked masonry, and qualification testing is performed in the non-cracked condition [13]. Uncertainties coming from e.g., cracking, are regarded to be covered in the design by a higher partial safety factor for the base material vs. concrete [14]. Furthermore, as additional parameter for the anchor resistance the concept considers its position within the masonry (e.g., in a mortar joint, in the brick, close to the edge…). Basic investigations under quasi-static loading are reported in [18,19,20], but due to the complexity of masonry injection anchor performance assessment is still mainly based on experimental testing [13] and only few predictive equations are used in design [14].
In the past decades, many efforts have been made to evaluate the behavior of post-installed anchors in concrete [21,22,23,24,25,26,27,28,29,30] under different conditions (i.e., concrete strength, cracked/non cracked), leading to a well-defined standard framework that allows designers to rely on equations or testing procedures that consider the determination of the performance of a fastener even under critical conditions such as seismic action. Recently, some researchers paid attention to the behavior of anchors in masonry or stone [11,18,19,20,31,32,33,34,35,36,37], but some specific aspects such as the behavior in real structures under seismic influences including damaged and cracked masonry, to the knowledge of authors, are still not investigated [33]. Ref. [20] reports a mean resistance reduction due to cracking of up to 70% for shallow injection anchors installed in solid clay or calcium silicate single bricks and tested under monotonic tension loading and adverse conditions.
In this paper, the results of monotonic tensile tests to failure on anchors installed in uncracked masonry members that had been subjected to cyclic loads prior to the anchor tests are presented. The anchors were placed in areas that underwent different damage levels and featured different residual crack widths. It is shown that there is a correlation between the damage (recognizable with the crack width) and the residual load, although in some cases unexpected high carrying capacities of anchors were found. Finally, a comparison with some equations available in literature is presented, and highlights that additional research are need in this field.
2. Experimental Research
2.1. Specimen Geometry and Materials
The tensile tests on post-installed adhesive anchors were performed in masonry elements previously damaged in in-plane cyclic tests.
Overall, 5 masonry walls (1.29 m × 1.30 m, three with thickness of 250 mm and two with thickness of 380 mm, English bond pattern) were considered (average compressive brick strength about 25 MPa and mortar M5).
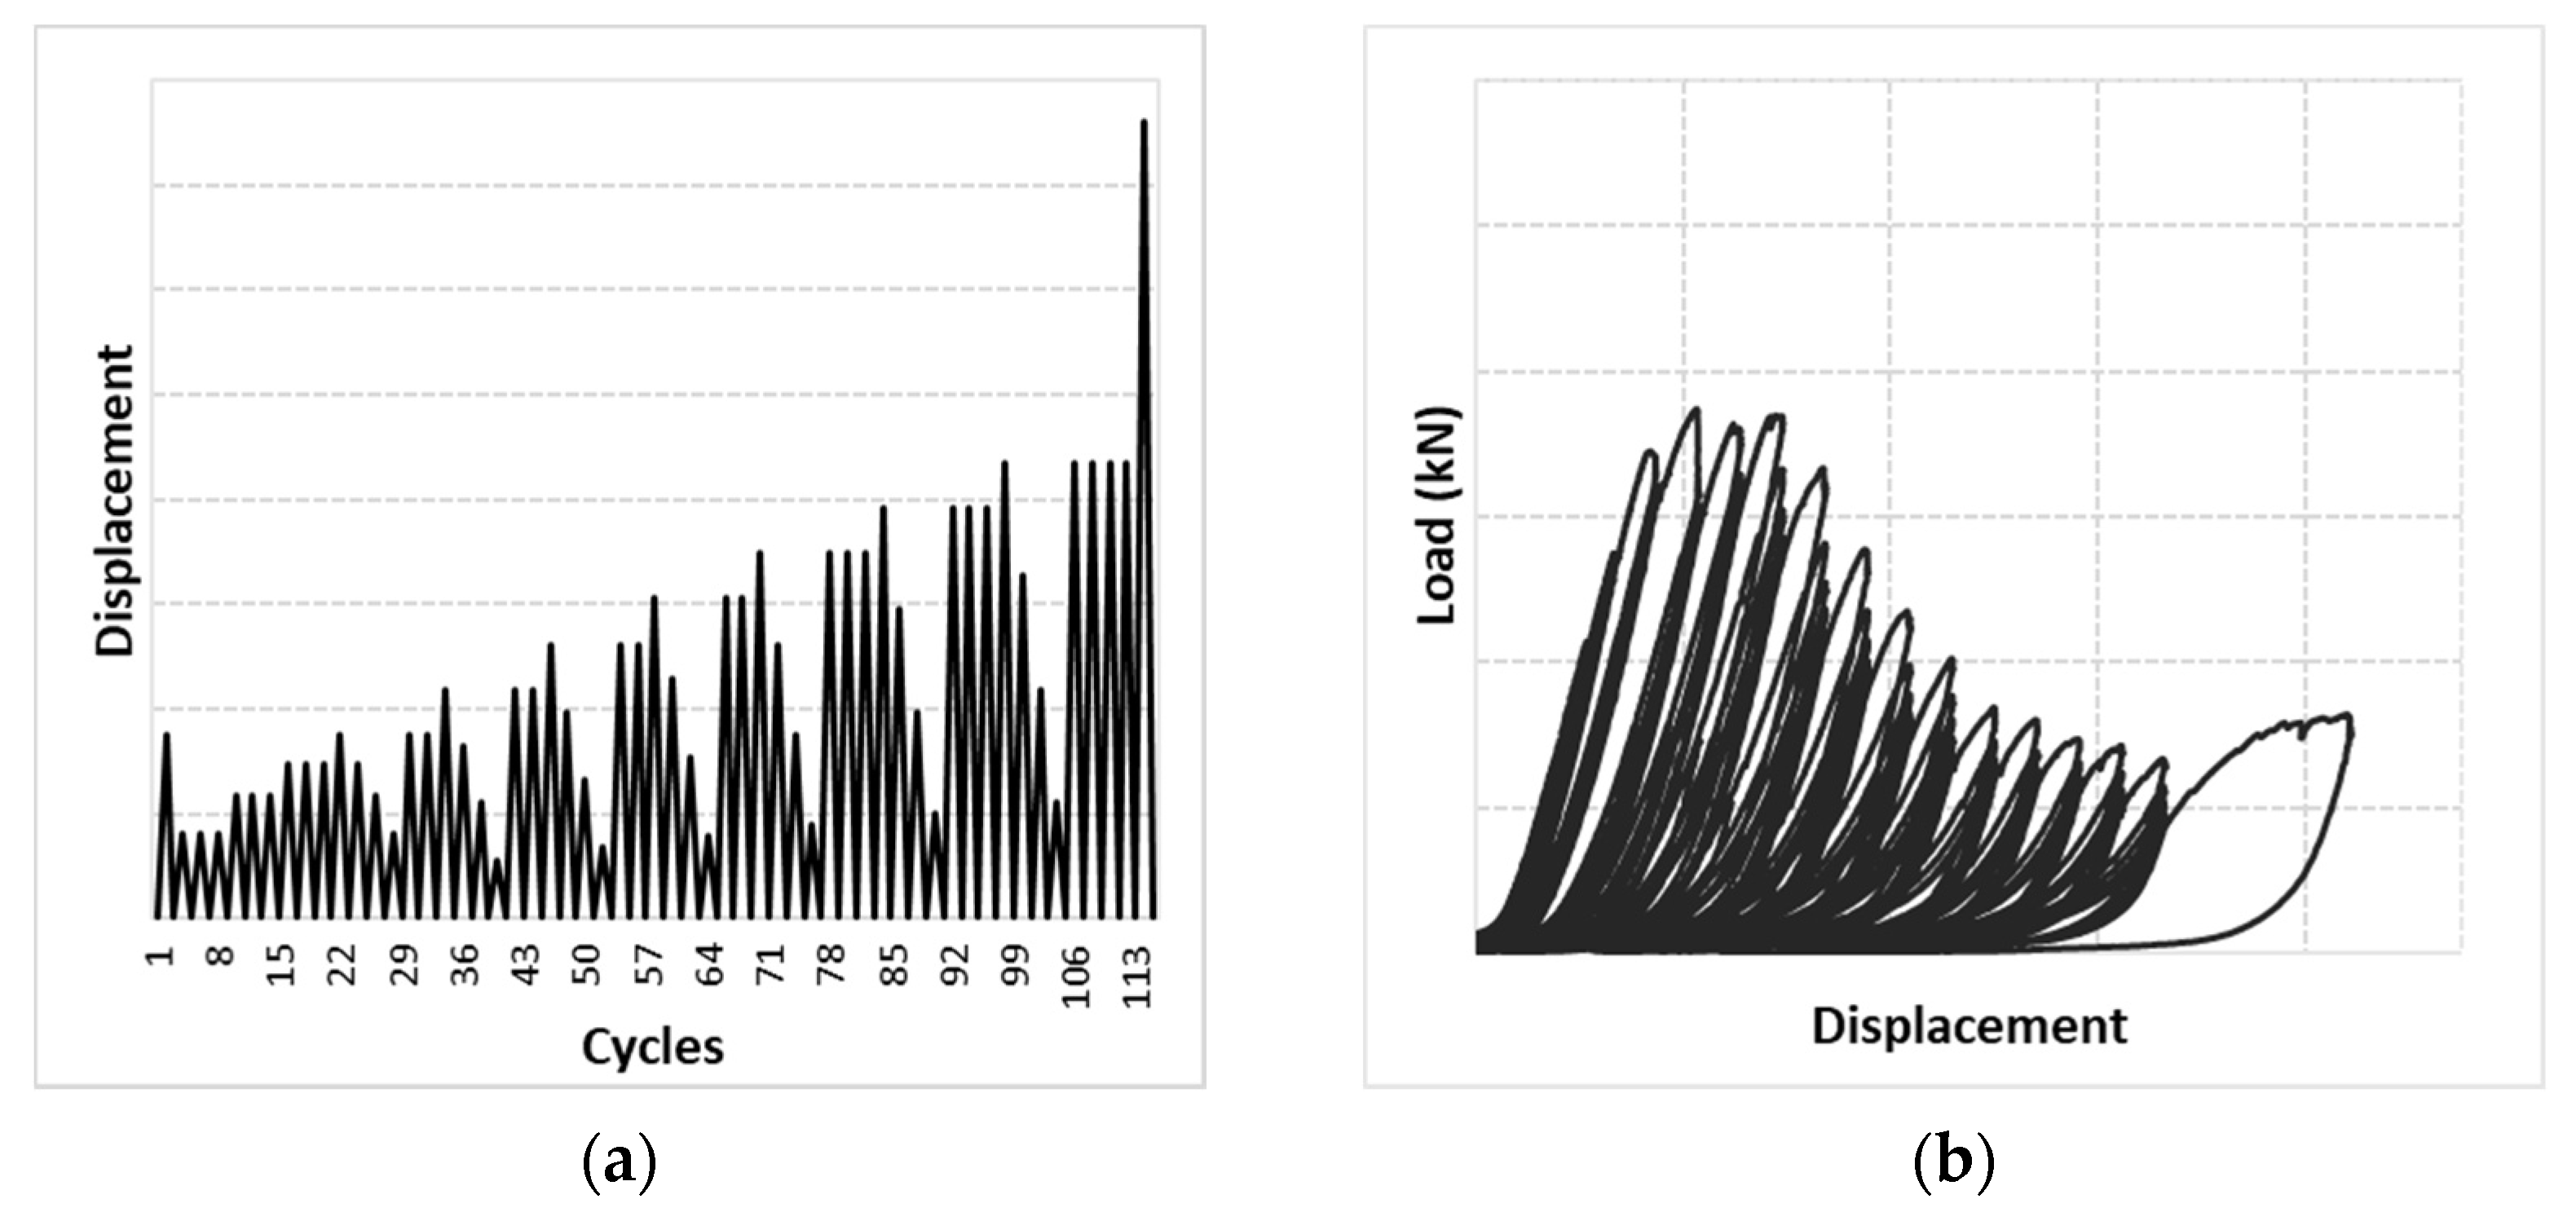
The anchors consisted in a φ 8 rebar (borehole 10 mm, embedment length 200 mm) installed with a hybrid adhesive in undamaged masonry with the pattern as shown in Figure 1. The adhesive characteristic tensile load given by the producer is 7 kN for an embedment length of 100 mm. Assuming a linear increase, for an embedment depth of 200 mm a doubling in resistance can be expected. The anchors had a 90-degree hook at the outside end to sustain the steel mesh of a reinforced concrete plaster layer that was placed on both sides of the wall. Before the anchor tension tests, the specimens had been subjected to diagonal shear tests according to ASTM E519 [38] but with an increasing cyclic load protocol according to the sequential phased displacement (SPD) procedure [39] and damaged until it was not possible to increase the displacement further. Overall, each wall underwent about 90 cycles. Figure 2 shows the applied test protocol, which did not consider reversal load, to be able to maintain the ASTM E519 [38] loading scheme. This approach allowed to load the specimen as shown in Figure 2b, where the behavior (load-displacement curve based on actuator displacement) observed in one wall is reported exemplarily. As a consequence, the wall is mainly damaged along the compressed diagonal, and thus the anchors were subjected to different stresses depending on the location within the wall.
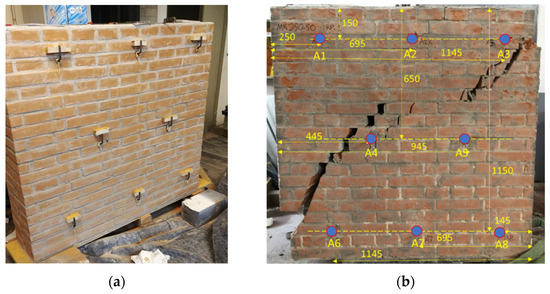
Figure 1.
Anchor position within the wall after installation (a) and after damage (b) (dimensions in mm).

Figure 2.
(a) Test protocol and (b) example of load-displacement curve of the actuator response of a wall (b).
At the end of the wall tests the reinforced plaster was detached, and the masonry showed several major cracks along the diagonal. For the anchor tests, each anchor had a code (A1, A2 … A8) depending on the position within the wall (Figure 1).
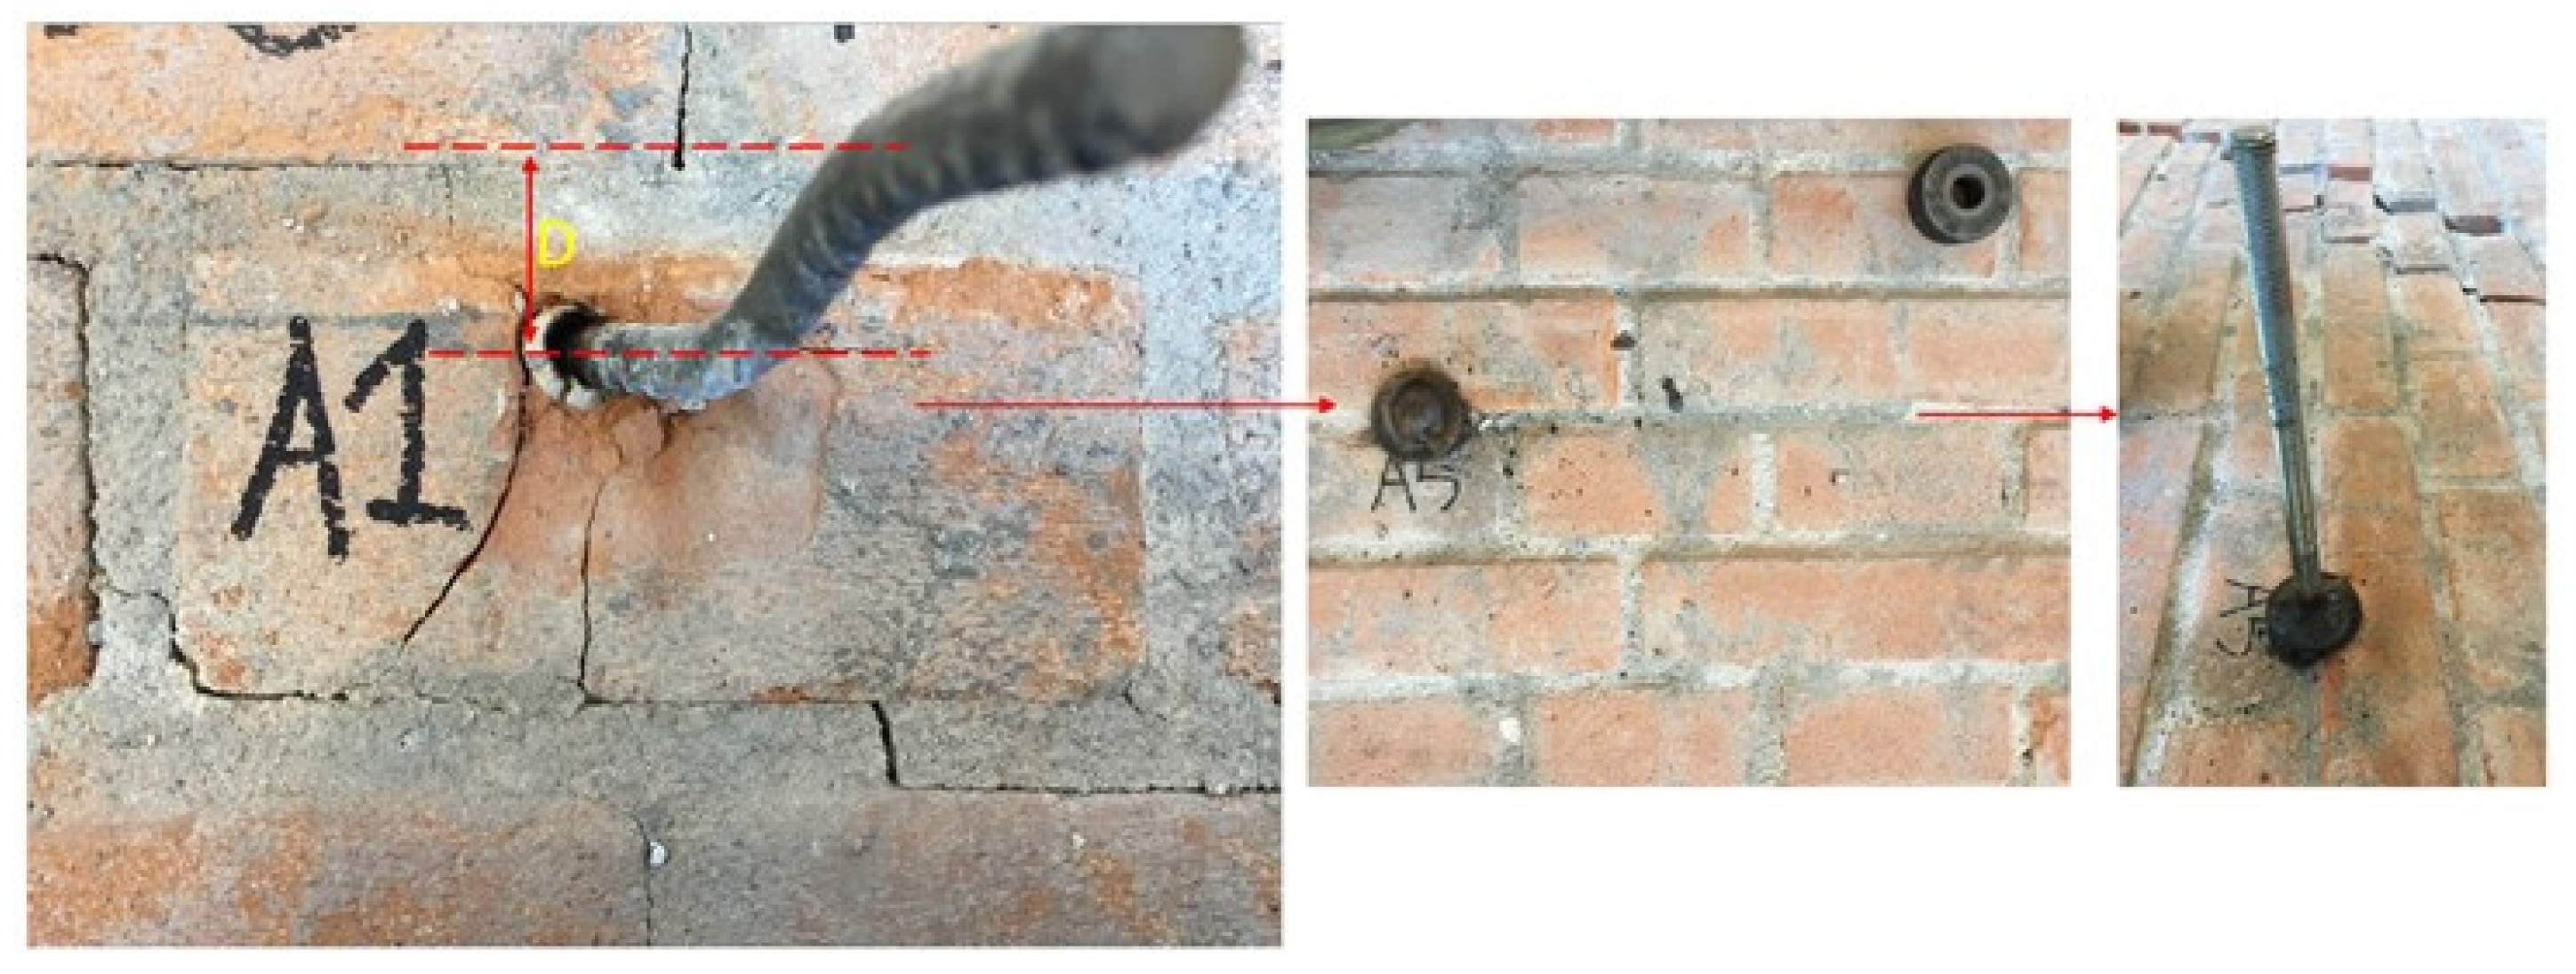
Details of the positioning with respect to the brick/joint are exemplarily shown in Figure 3. After the wall testing phase, most of the anchors were bent (Figure 4) which required additional measures to perform a tension test. In these cases, the anchors were cut just 6 mm above the surface of the masonry and a steel washer and a new bar were welded at the top of the existing bar to be able to perform the anchor pull-out test (Figure 4). In some cases, anchor testing was not possible, because the bent part was too close to or below the masonry surface and welding could not be executed. In other cases, the anchor was already loose because the crack was too large (e.g., along the diagonal of some walls in positions A4 and A6).
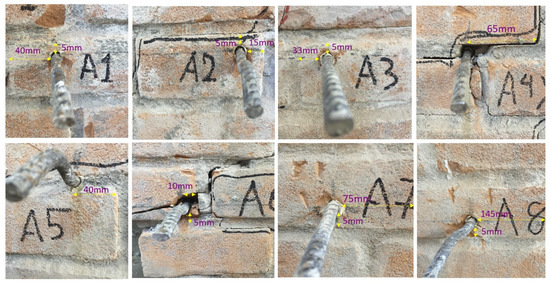
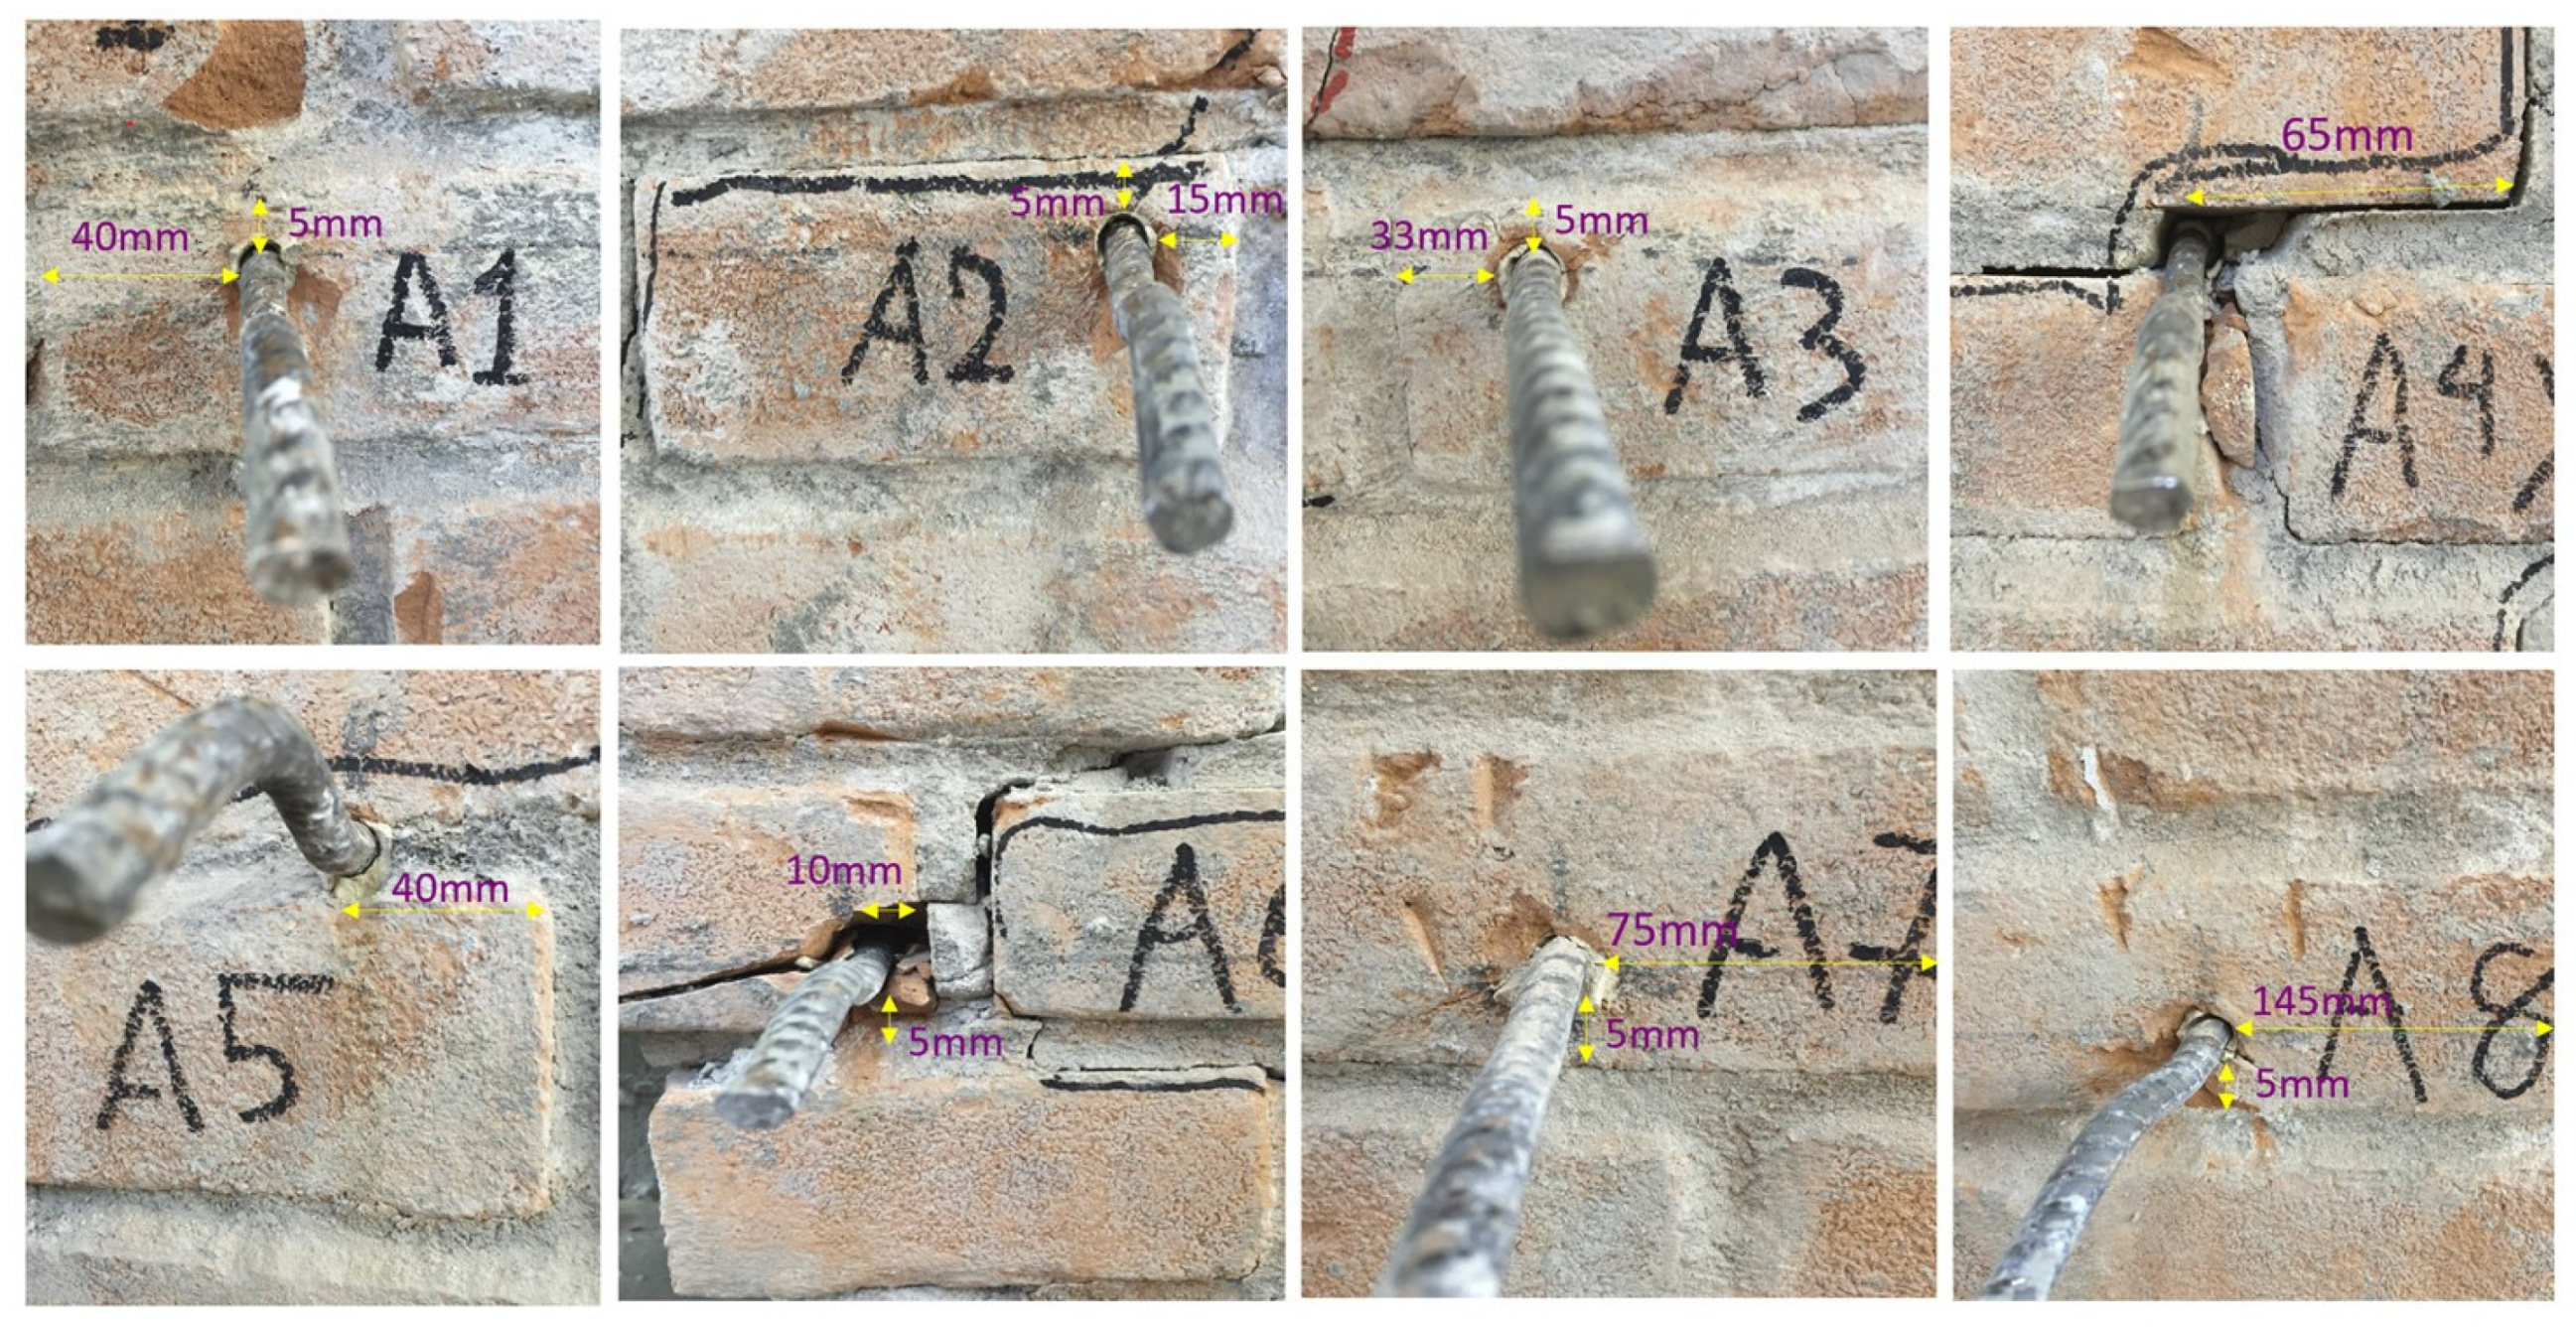
Figure 3.
Examples of anchor positions.

Figure 4.
Anchor preparation for testing.
2.2. Test Set-Up and Execution
To evaluate the residual tensile load of the anchors, unconfined tension tests to failure were performed.
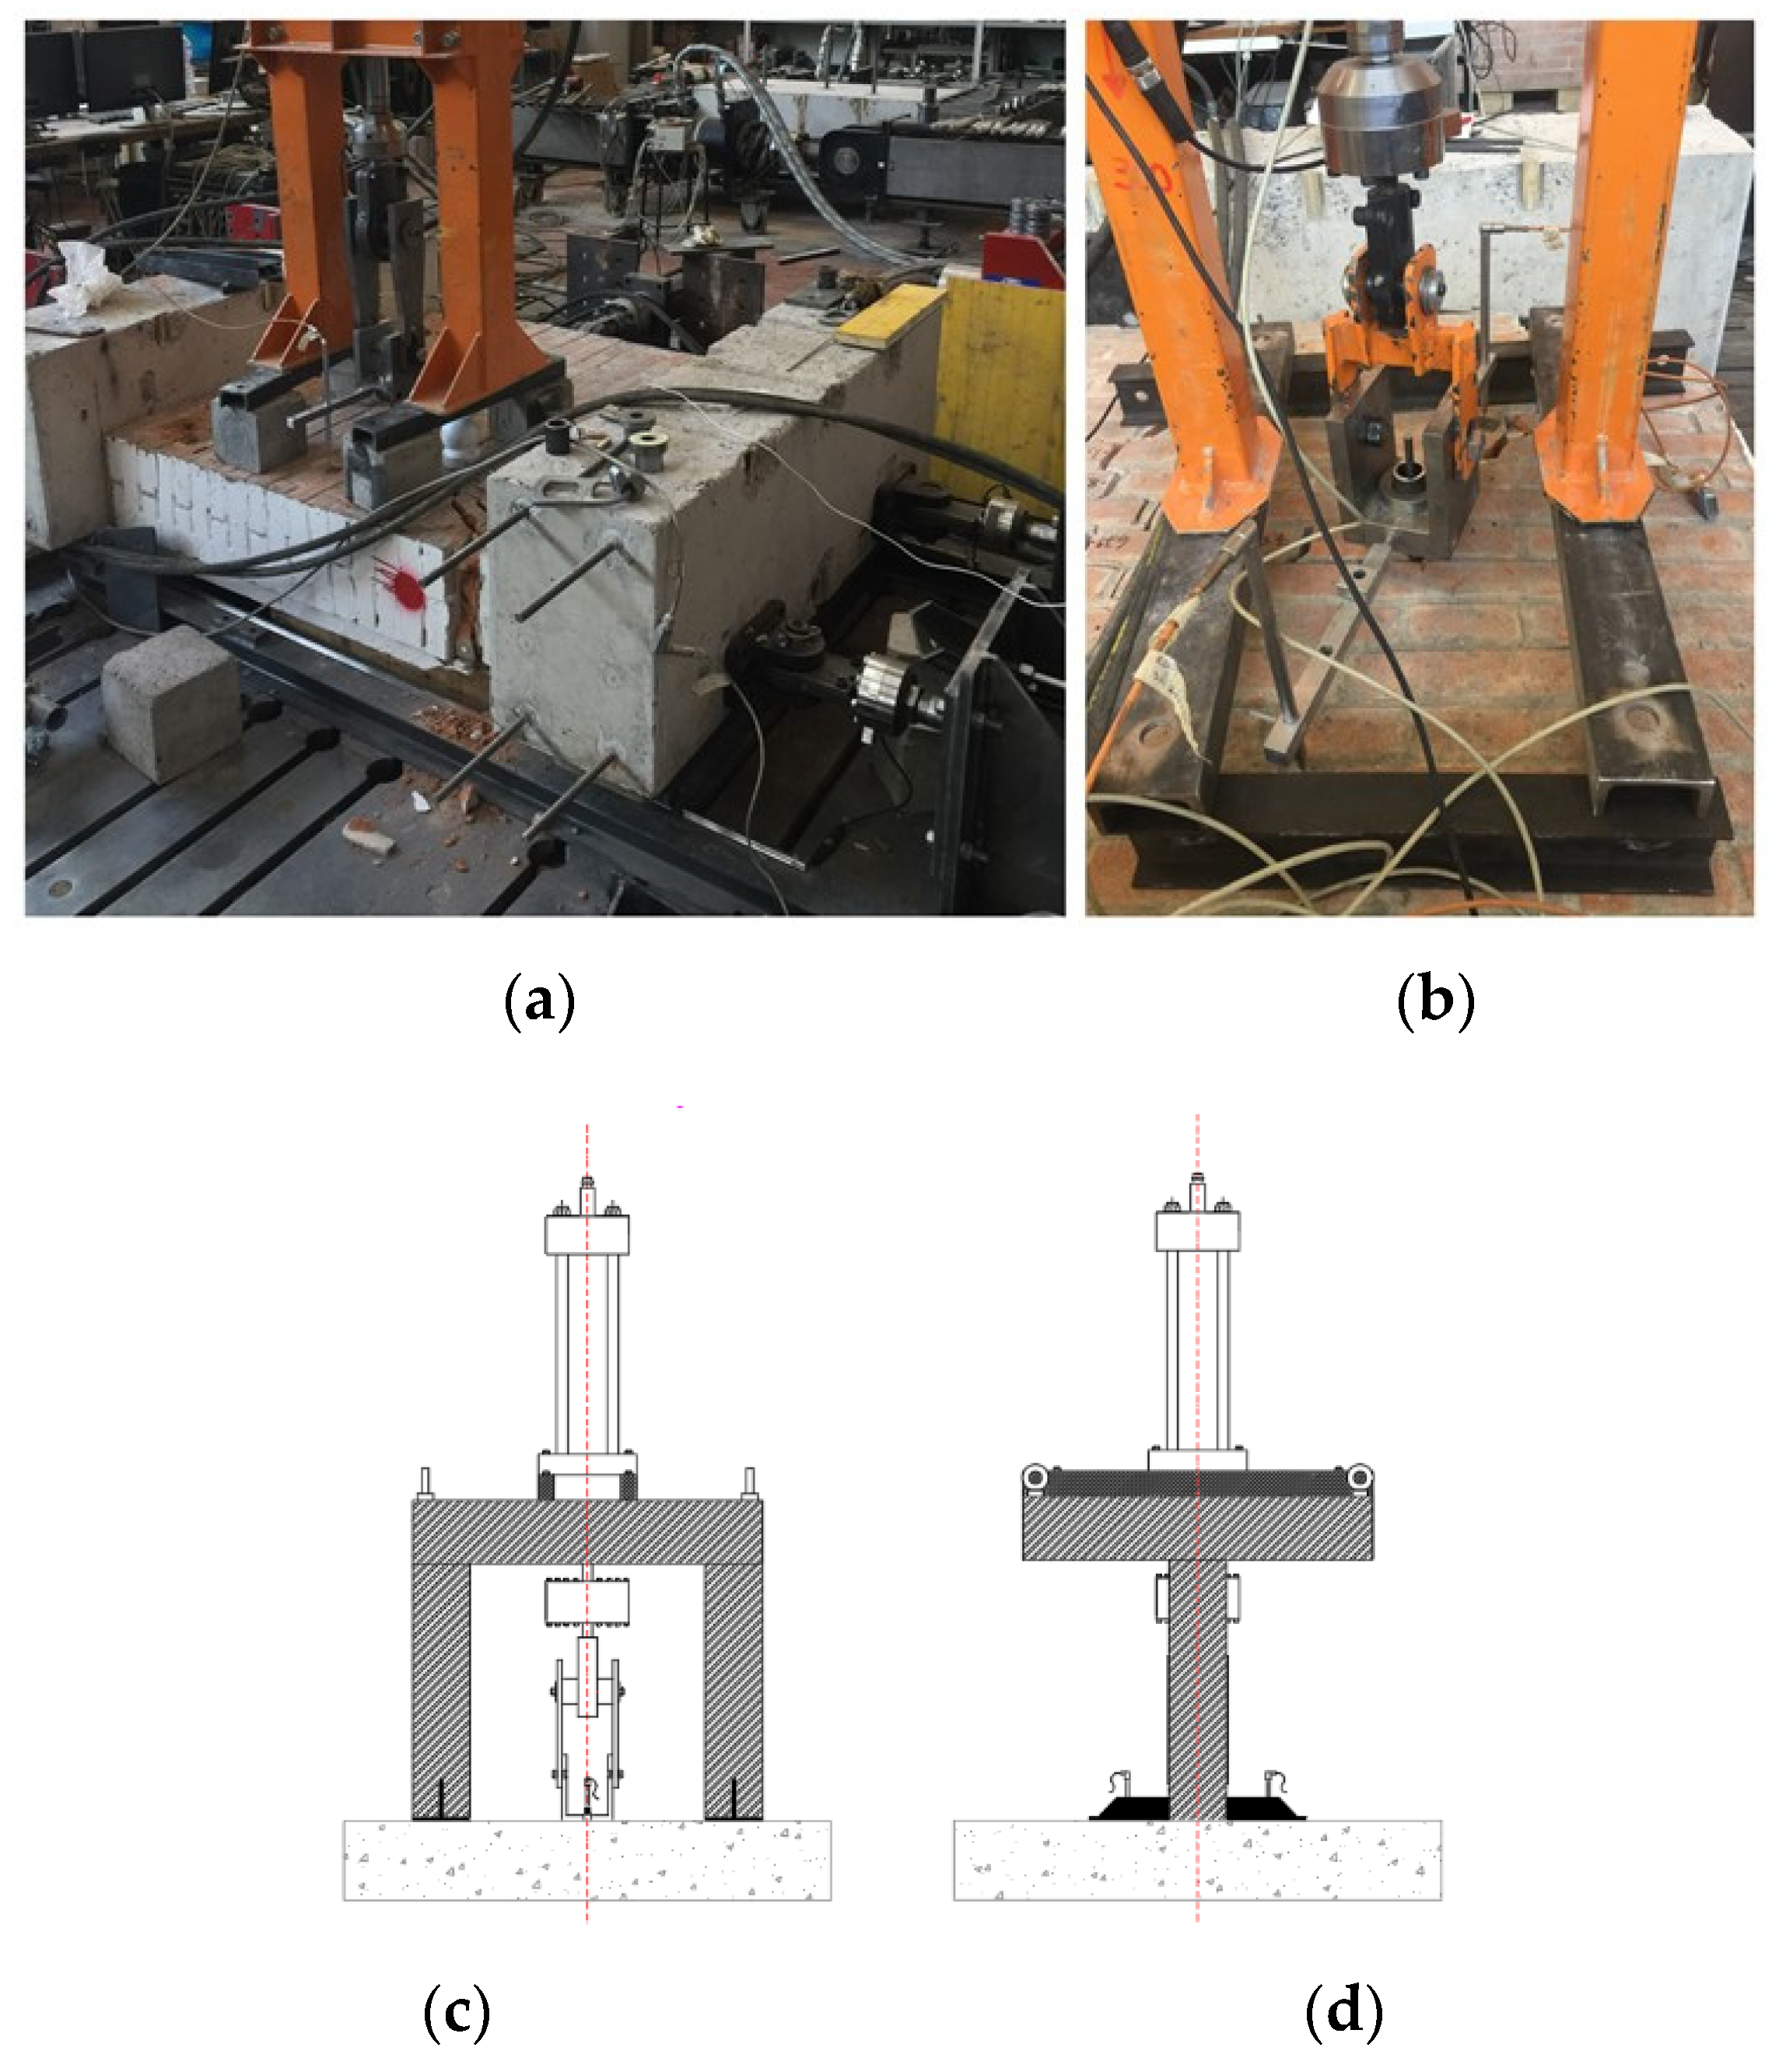
Each masonry wall was placed horizontally and positioned between two concrete beams, one of them was fixed and the other one could move over a free-friction support, which was attached to steel rails over an I section steel beam (Figure 5). To simulate upload, the wall was subjected to a compressive stress equal to 0.2 MPa applied with two hydraulic jacks with 50 kN load-carrying capacity each. The unconfined test set-up is shown in Figure 5. The tensile load was applied with a hydraulic jack with carrying capacity of 50 kN and measured with a load cell of 50 kN. The displacement was measured with two LVDTs symmetrically positioned on the right and left side of the anchor (at a distance of about 30 cm from the anchor) capturing the relative displacement between the anchor and the wall.
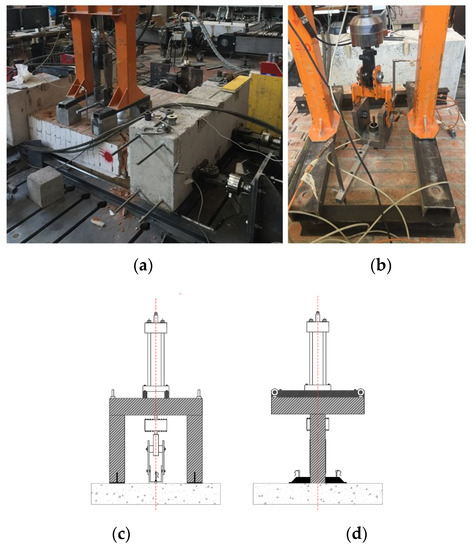
Figure 5.
(a) Test set-up (b) unconfined pull-out test (c) sketch of unconfined pull-out test front view (d) side view.
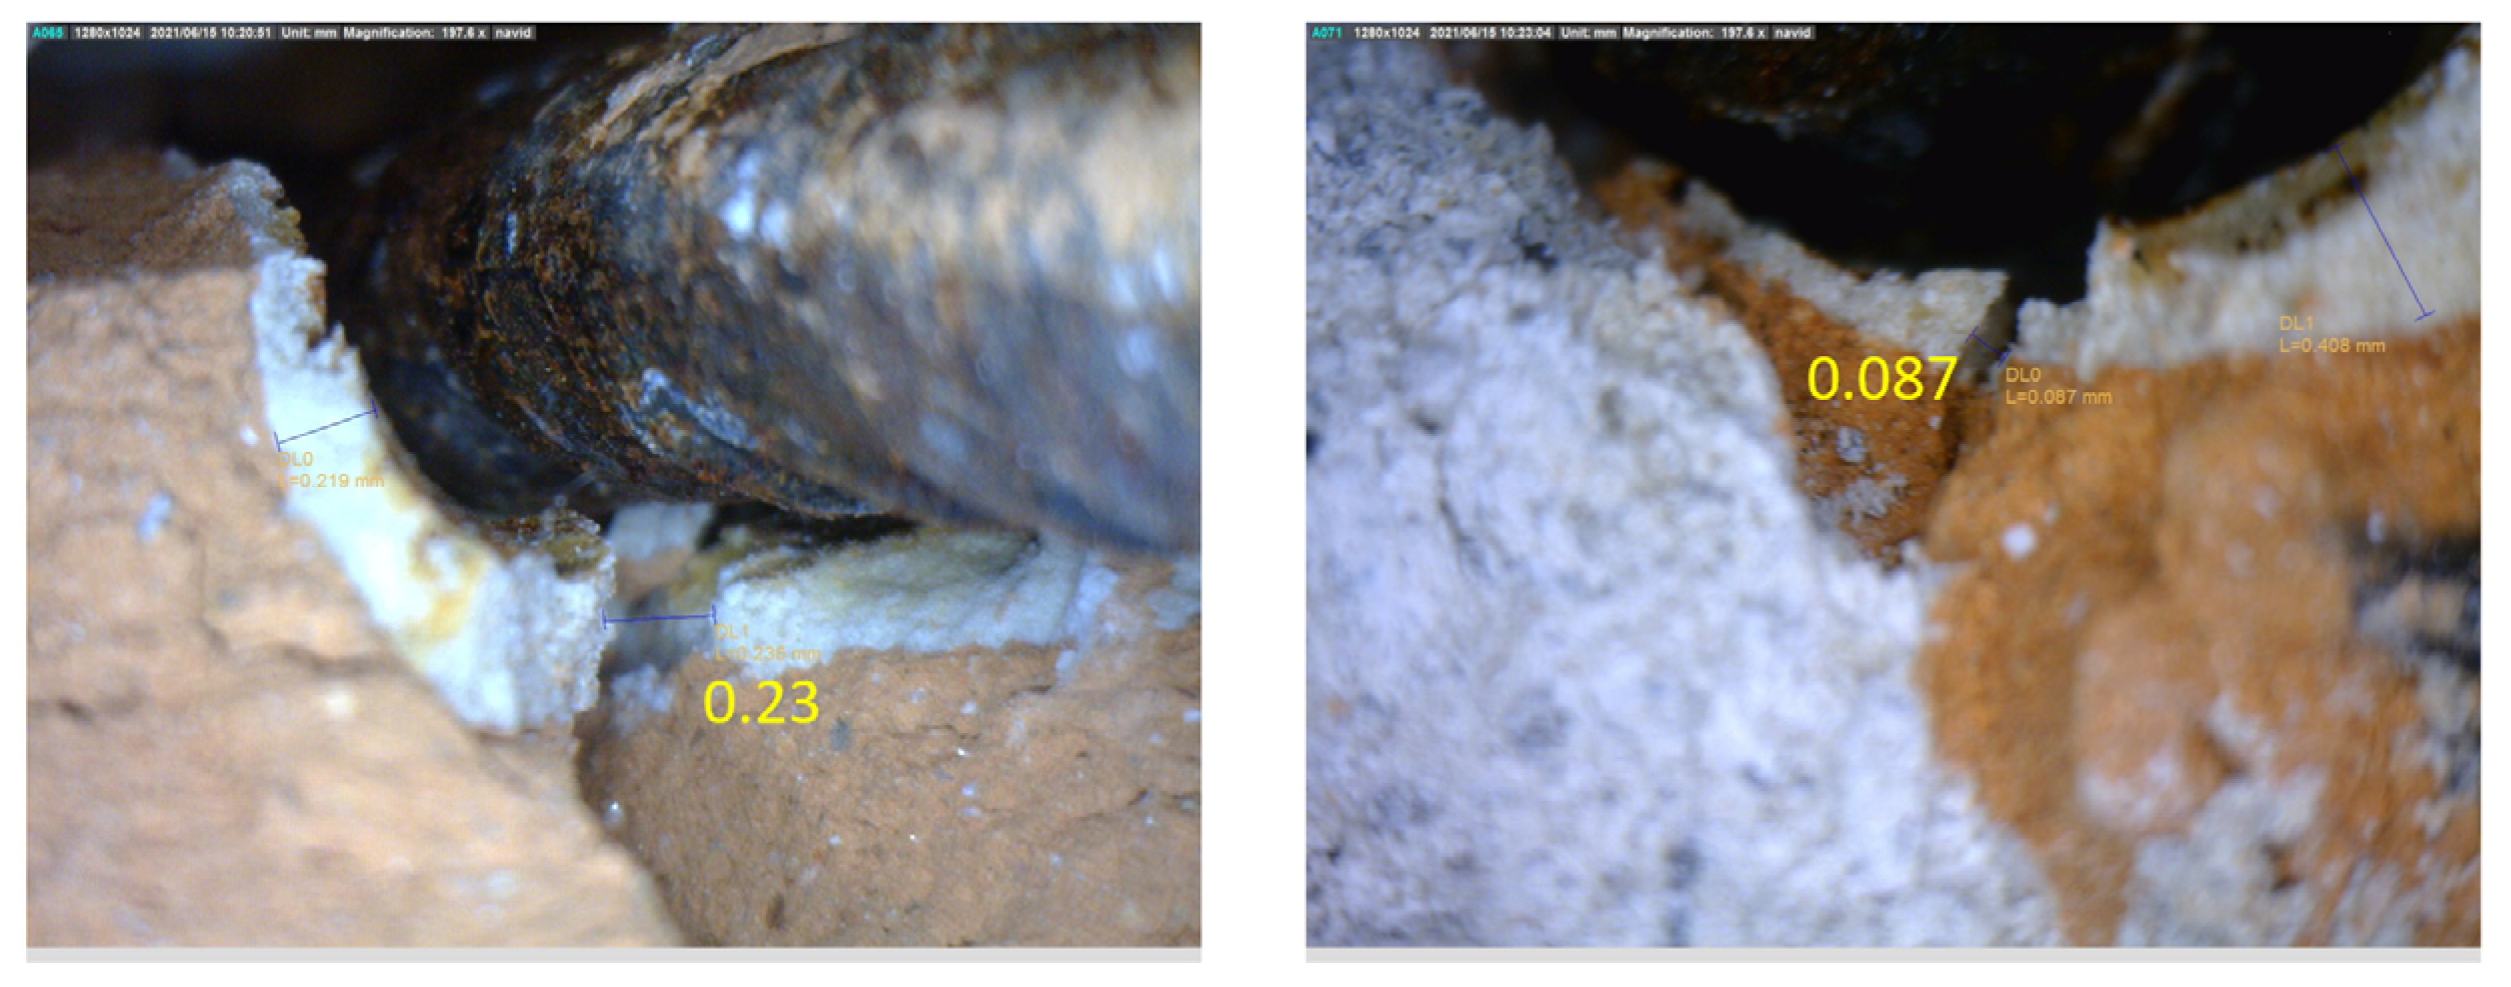
After the cyclic loading phase of the walls, all installed anchors were affected by cracks in their vicinity. The crack width was measured with a digital microscope.
3. Results
Table 1 summarizes the test results in terms of: maximum load, average load, and coefficient of variation (v) of each wall, failure mode, crack width at the beginning of the test, displacement at the peak load, at 50% of the peak load and at a load of 5 kN and the average load and the coefficient of variation of all tests. The data are grouped for each wall, each test has a code that includes the number of the wall (e.g., W1) and the position within the wall (e.g., A2) according to Figure 1.

Table 1.
Test results.
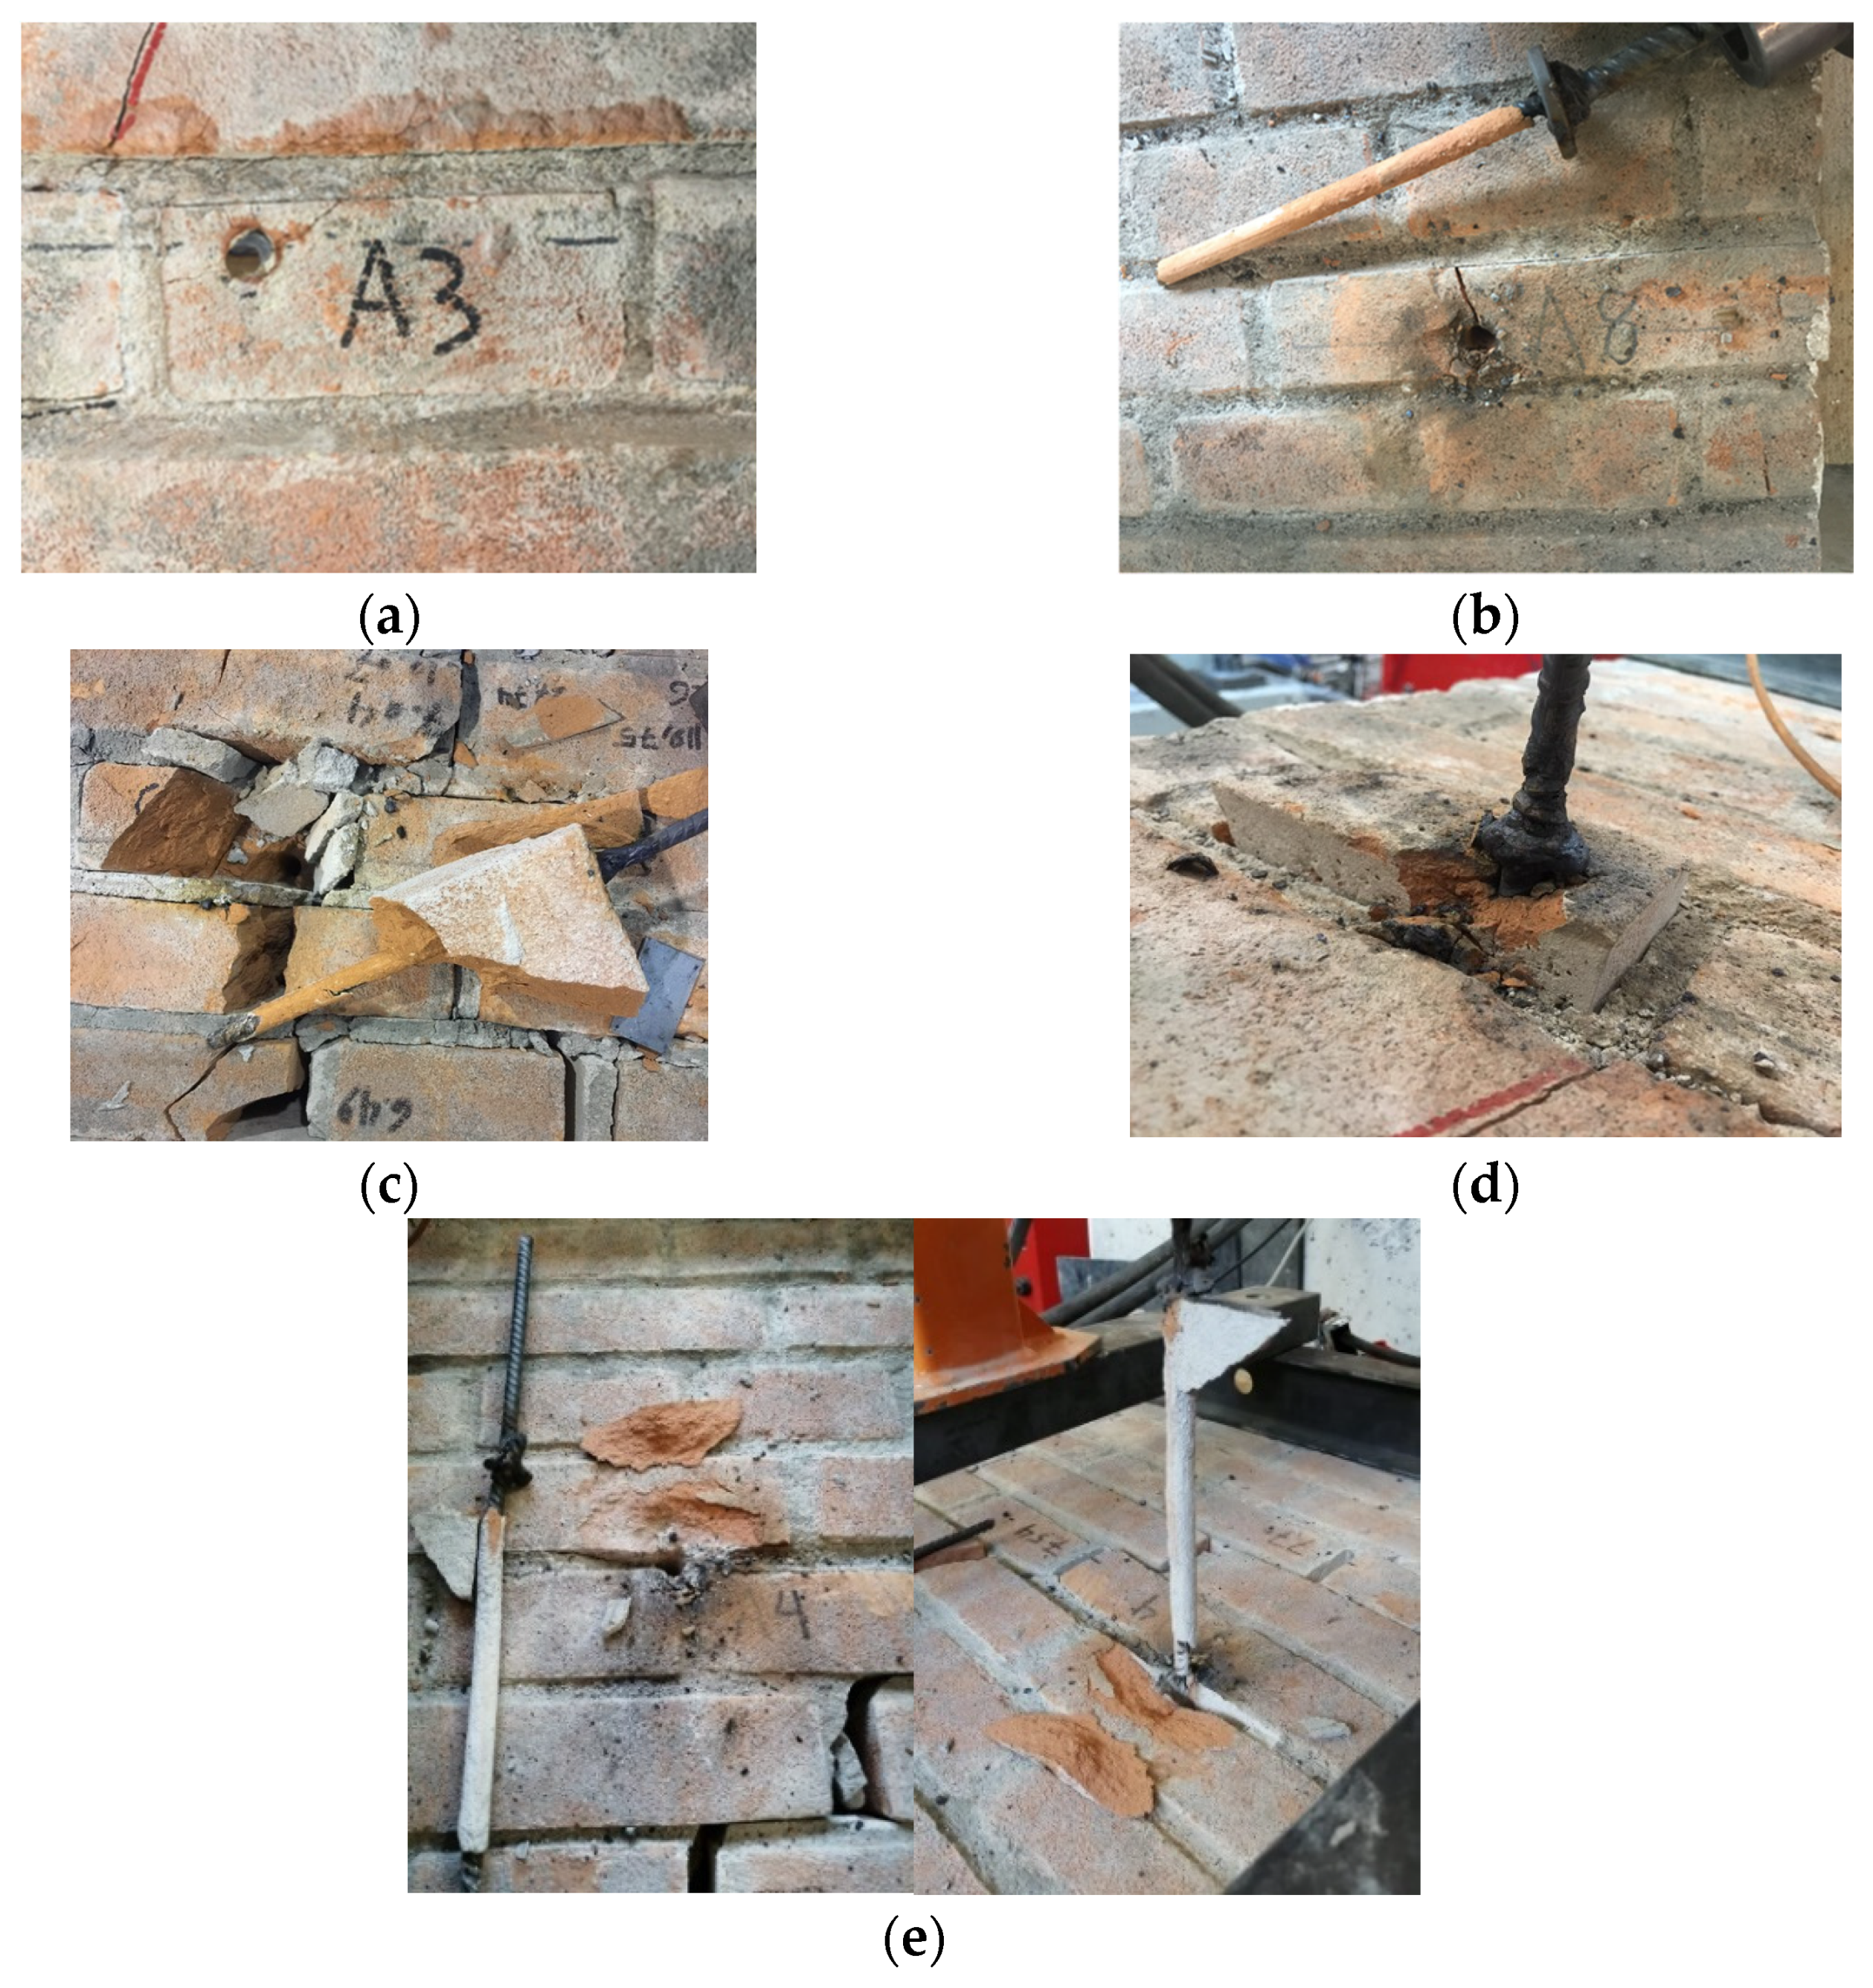
Several failure modes were observed, namely: steel failure, associated to the failure of the welded area, pull-out failure of the anchor that in some cases was associated with brick or cone failure, while in some cases pull-out of the brick was observed (Figure 6).
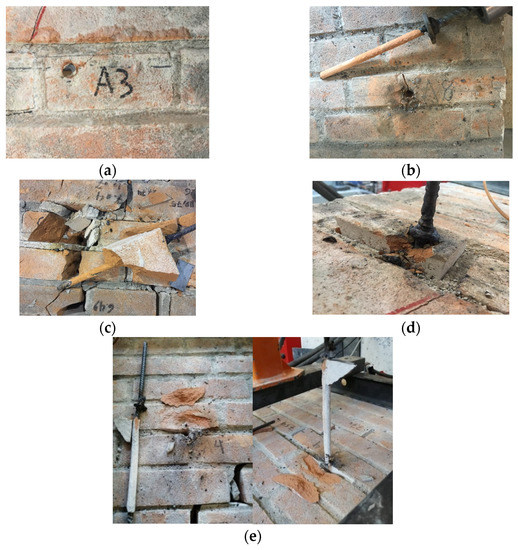
Figure 6.
Failure modes (a) steel failure (weld)– (S), (b) anchor pull-out –(PO), (c) anchor pull-out + brick breakout/pull-out (PO + B), (d) brick pull-out B, (e) anchor pull-out + cone failure (PO + C).
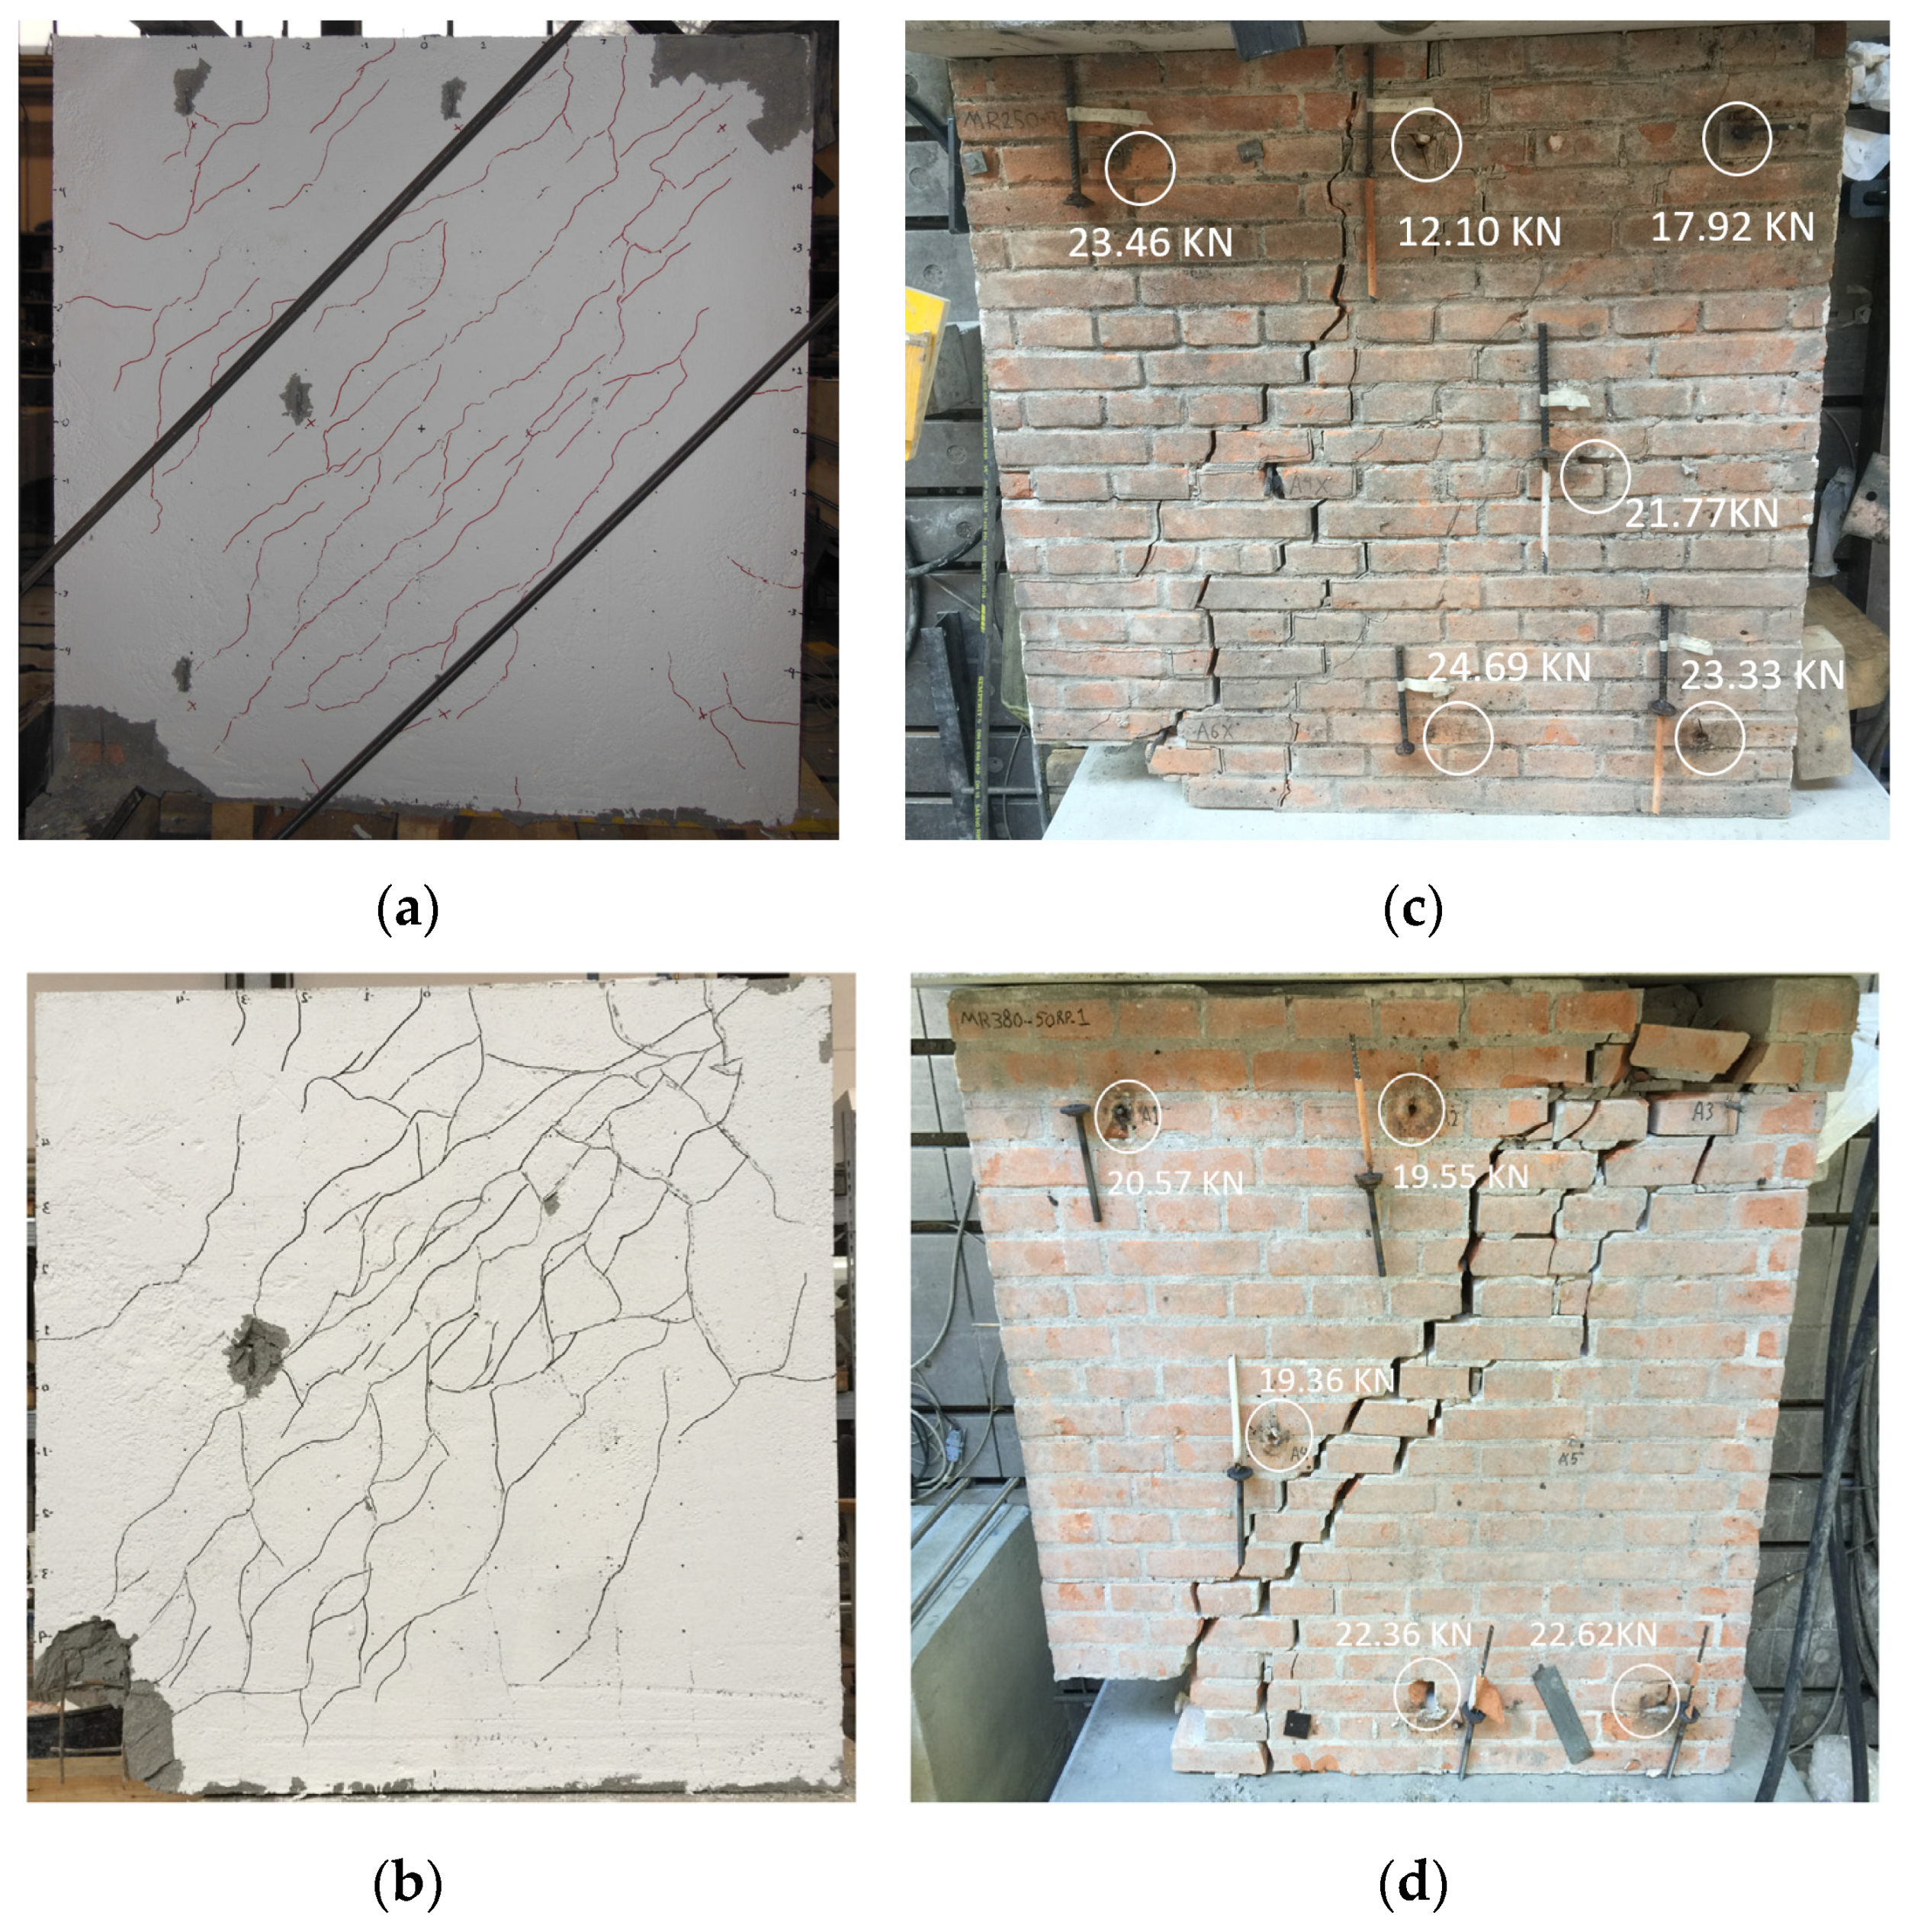
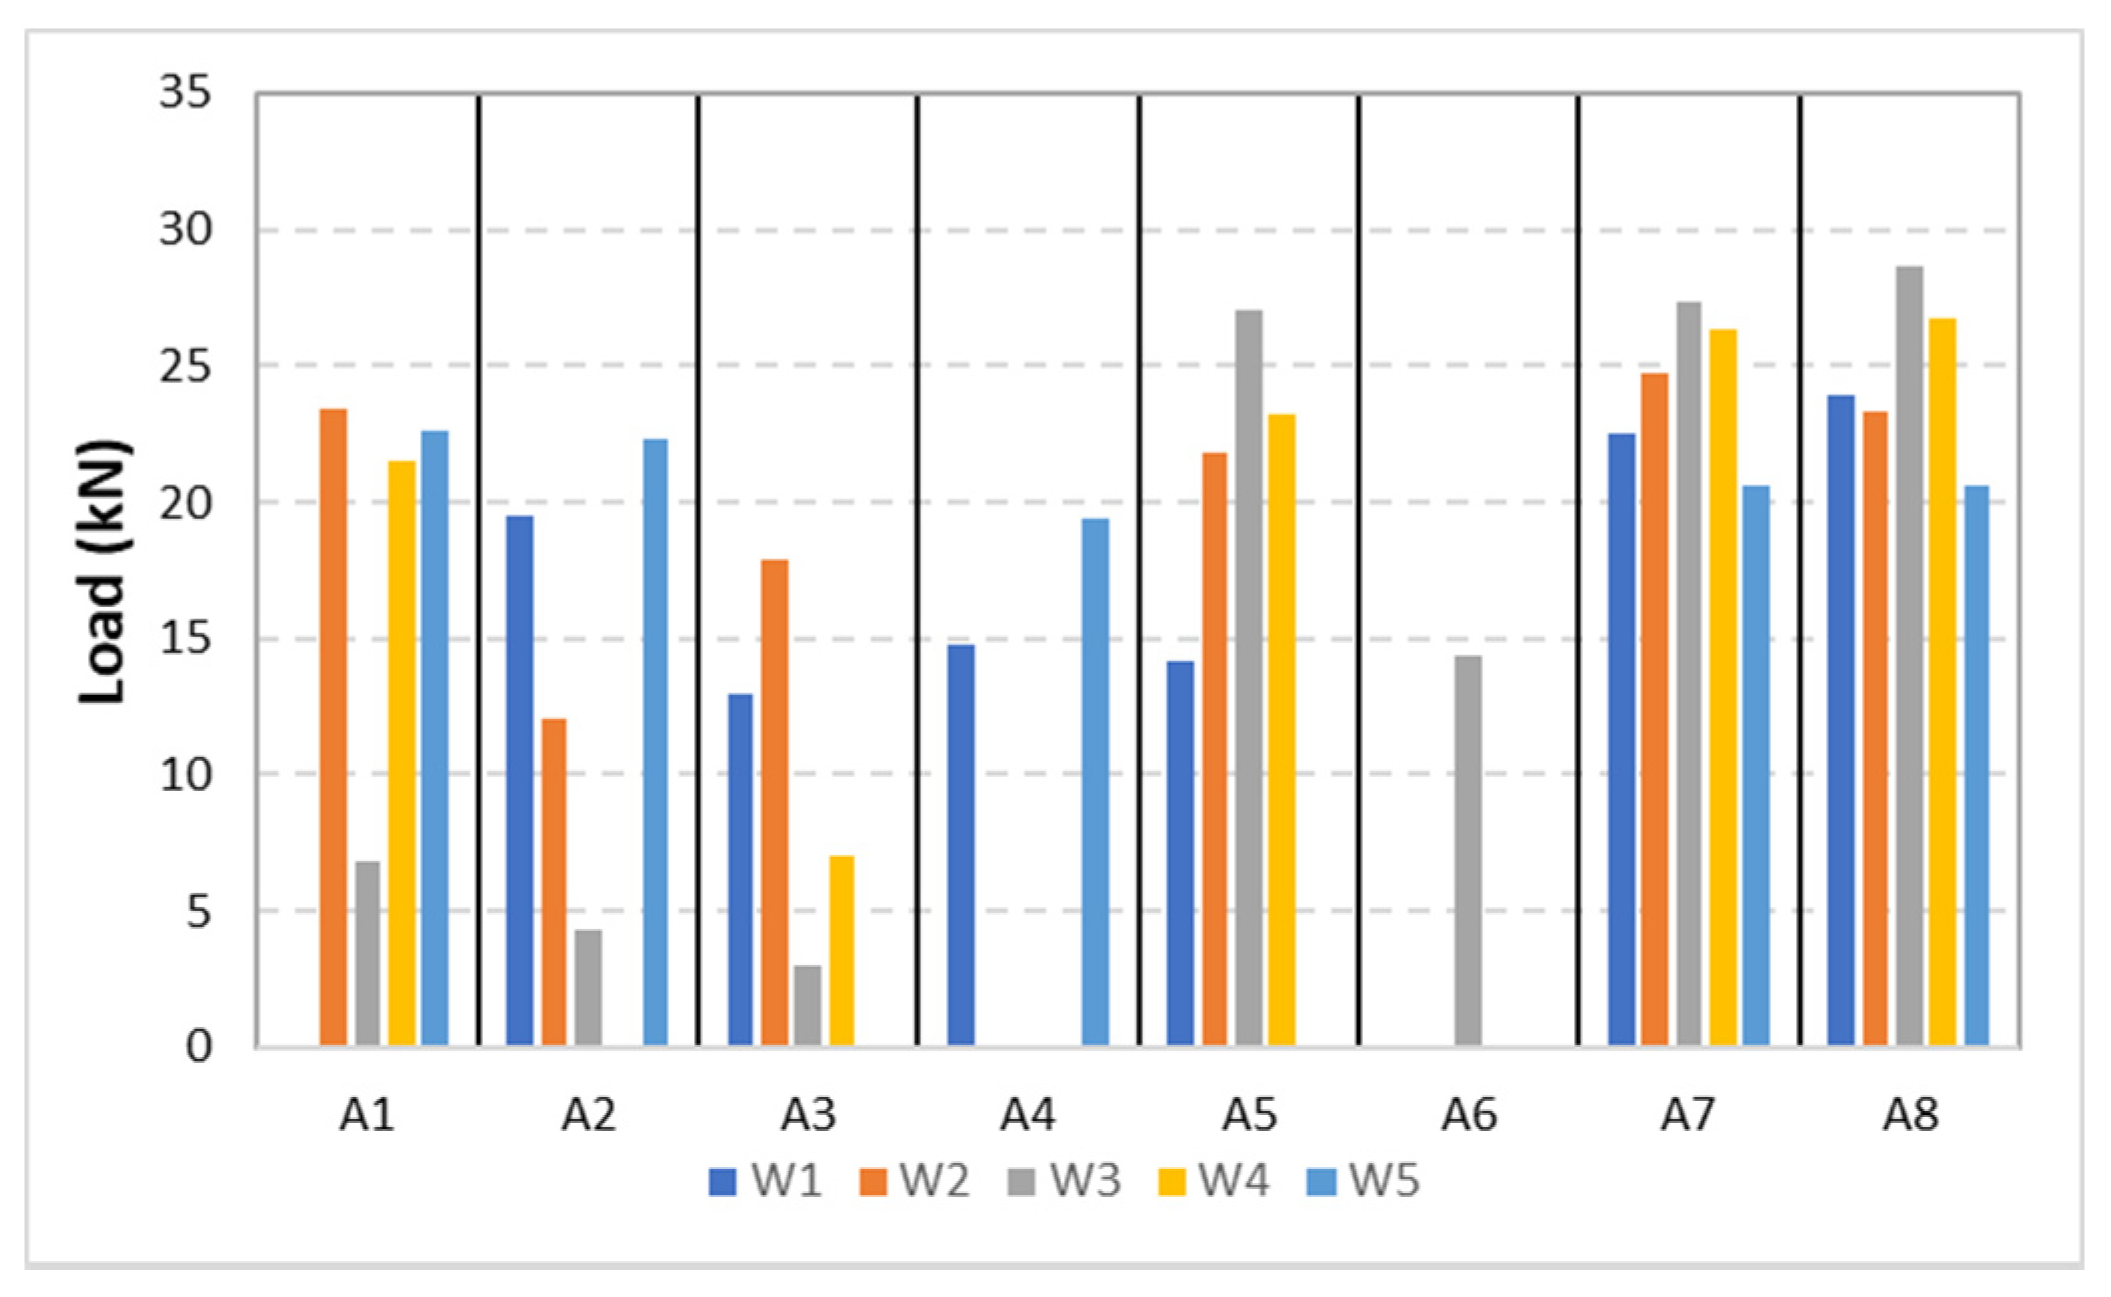
All anchors were tested in or nearby cracks that varied between 0.1 mm and 2.5 mm as reported in Table 1. Anchors seem to be crack inducers. When the walls were cyclically loaded and damaged prior to the anchor tests, it seems that the crack propagation passed through the anchor hole. A couple of examples of the crack width measurements are reported in Figure 7. As expected, the crack width was related to the position within the wall, therefore the anchors close to the diagonal and in the upper part of the wall were in the most severe conditions. This is evident by looking at the walls after the tests (Figure 8) and by collecting the load depending on the position (Figure 9). Figure 8 shows the walls after the cyclic tests (left) and after the removal of the reinforced plaster and the tensile tests (right). In many cases, during the cyclic loading on the walls, the bent part of anchors pushed out the concrete, suggesting that the anchors were subjected to high stresses [40]. This phenomenon was observed along the diagonal (A3 to A6) and in the upper part of the wall (anchor positions A1 and A2).

Figure 7.
Examples for crack width.
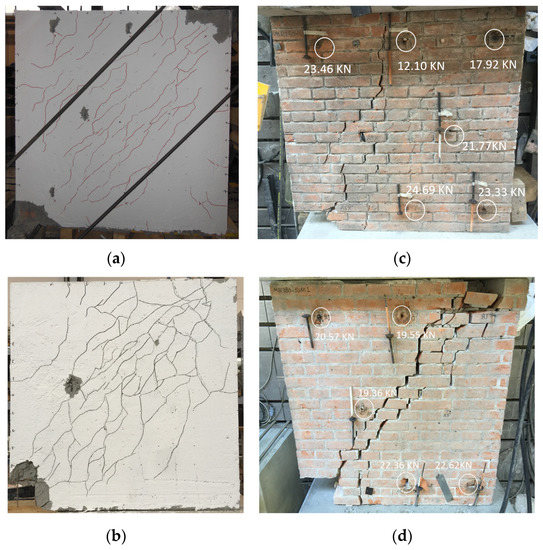
Figure 8.
Damaged walls: after wall testing ((a) wall W2 and (b) wall W5) and after anchor testing ((c) wall W2 and (d) wall W5) with residual load.

Figure 9.
Maximum load in each position.
4. Discussion
The experimental results highlight that there is great variation in terms of maximum load, indeed Table 1 shows that the overall coefficient of variation (cov) of the load is about 37% and, within the same wall (except for wall 5), the variation is huge (from 25% up to 72%). The reasons of this great variation in tensile tests on anchors could be related to the installation parameters/procedure or to the features of the base material. Nevertheless, in this research the installation of all anchors was performed in the same way (installation procedure, embedment depth, anchor size, drill bit diameter and cleaning procedure) so the causes should be related to the condition of the base material.
The anchors differed in the position within the wall (Figure 1 and Figure 3) and thus they were in areas with different damage (e.g., crack width) and with different distance from the mortar joint. It is of relevant interest to investigate the effects of these parameters on the overall behavior and compare the experimental outcome with existing guidelines or research prediction equation.
4.1. Effect of the Position
The results (Table 1) are grouped in a different way to investigate whether they are affected by the position within the wall (Table 2). It can be noted that the coefficients of variation of the ultimate loads drop except for positions A1, A2, and A3. Positions A7 and A8 (far from the diagonal and in the bottom part of the specimen) showed good repeatability of the results (cov ca. 13%). It must be noted that in these positions the crack width was limited (up to 0.33 mm), while in other positions the coefficient of variation increases because the anchors installed in/nearby wide cracks exhibited low load-carrying capacity. For instance, in position A1 by excluding the test W3-A1 (with a crack width of 1.8 mm), the coefficient of variation falls to 4.4% (from 42.5%).
Table 2.
Test results evaluated on the basis of anchor position.
Overall, the results show that the anchors along the diagonal (A3, A4, A6) feature the lowest carrying capacity with failure associated to anchor pull-out and/or brick failure or cone failure. Steel failure was never observed. This behavior is reasonable since the masonry along the diagonal underwent the highest stresses during the cycles and thus it was damaged already before the anchor tests. On the other side, in positions far from the diagonal (e.g., A1, A7, A8), in many cases steel failure or pull-out failure with very high loads (similar to those obtained with steel failure) were observed. By considering the position of the anchor with respect to the mortar joints (Figure 3) it seems that there is a limited effect on the overall behavior. Nevertheless, all anchors were placed in a joint or close to it (with a distance in one direction of about 5 mm), so additional research is needed to validate these conclusions.
4.2. Effect of the Crack Width
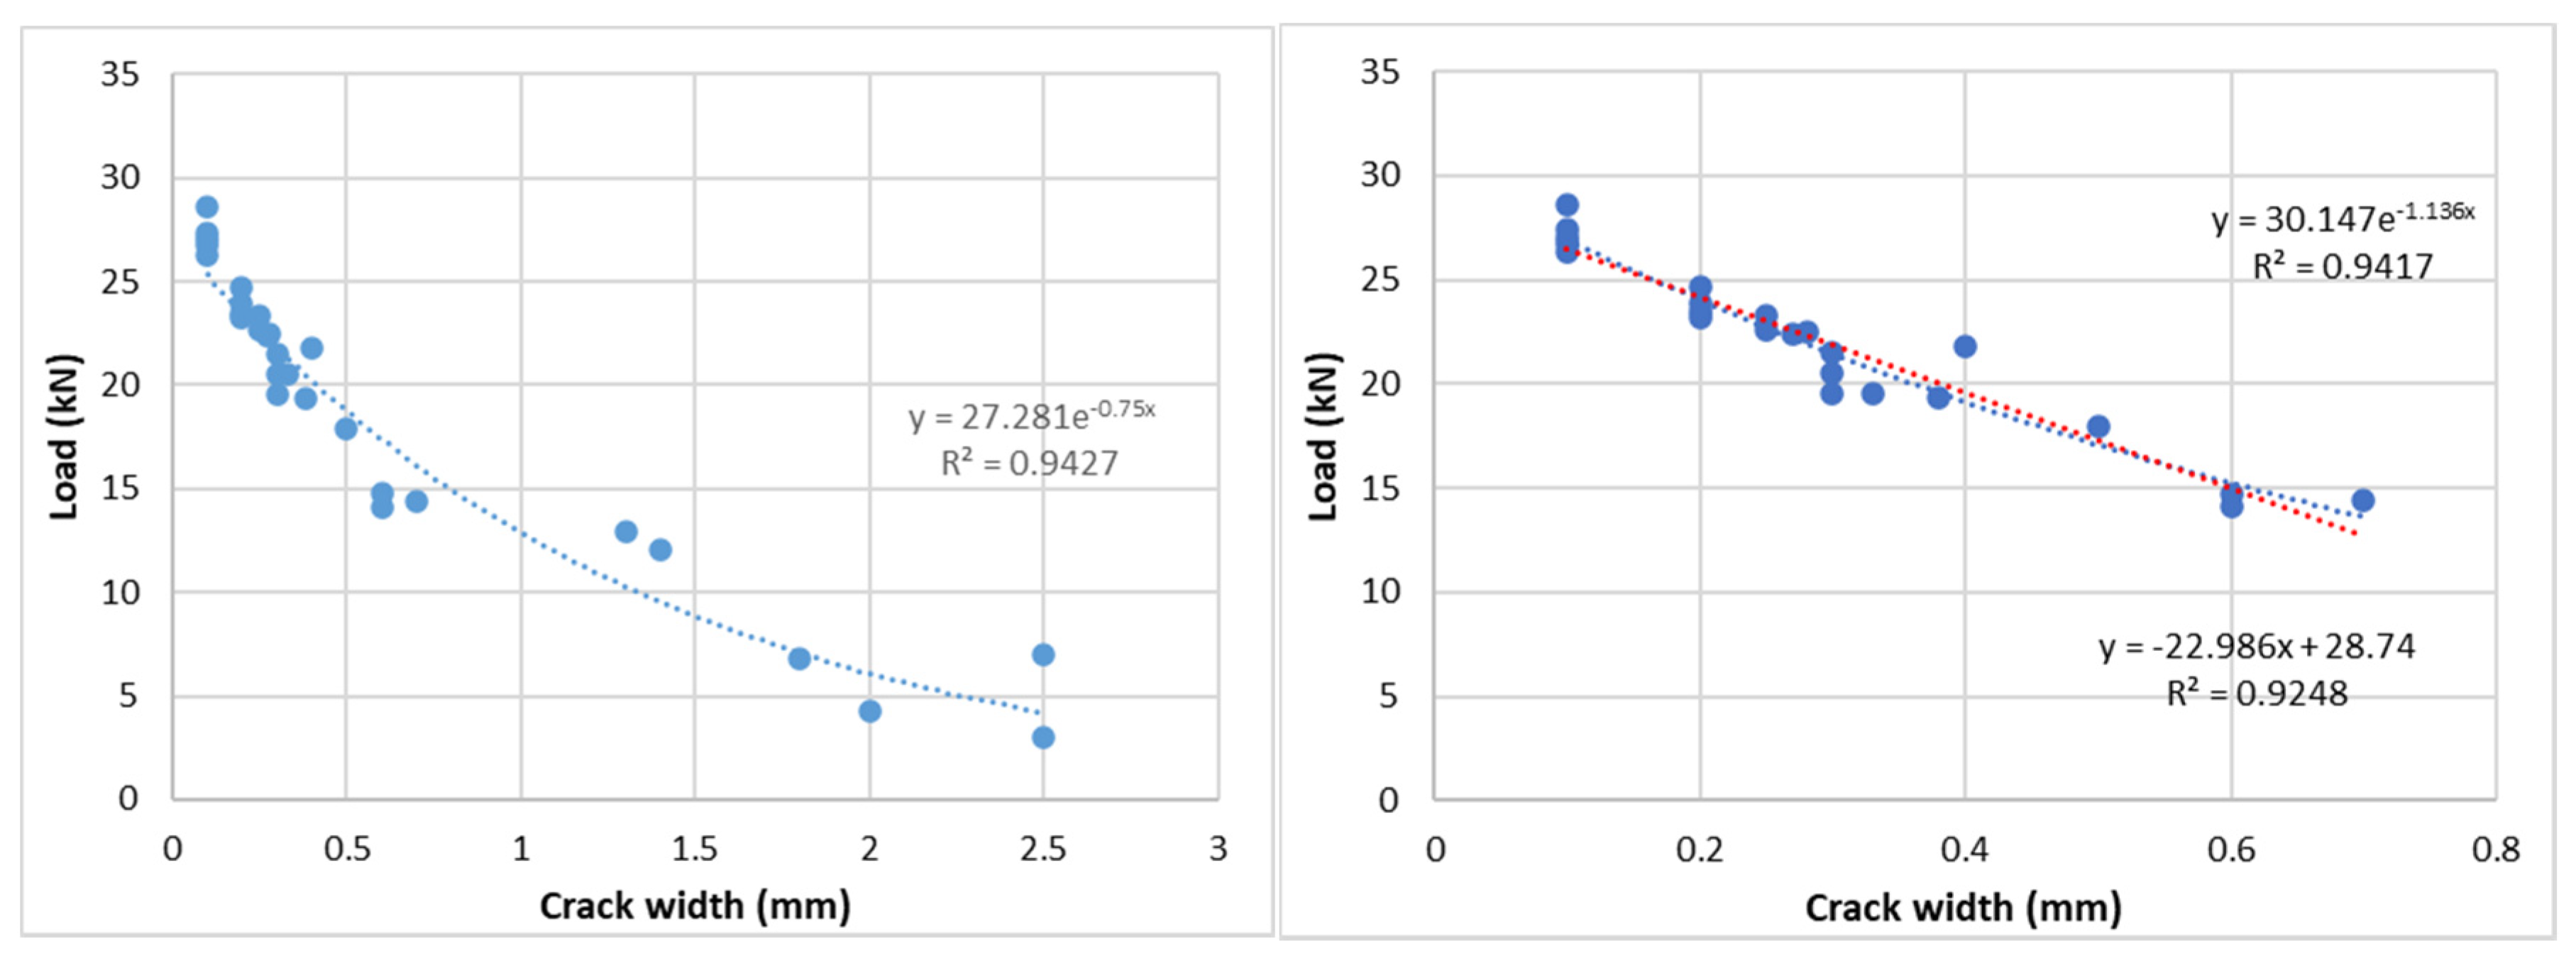
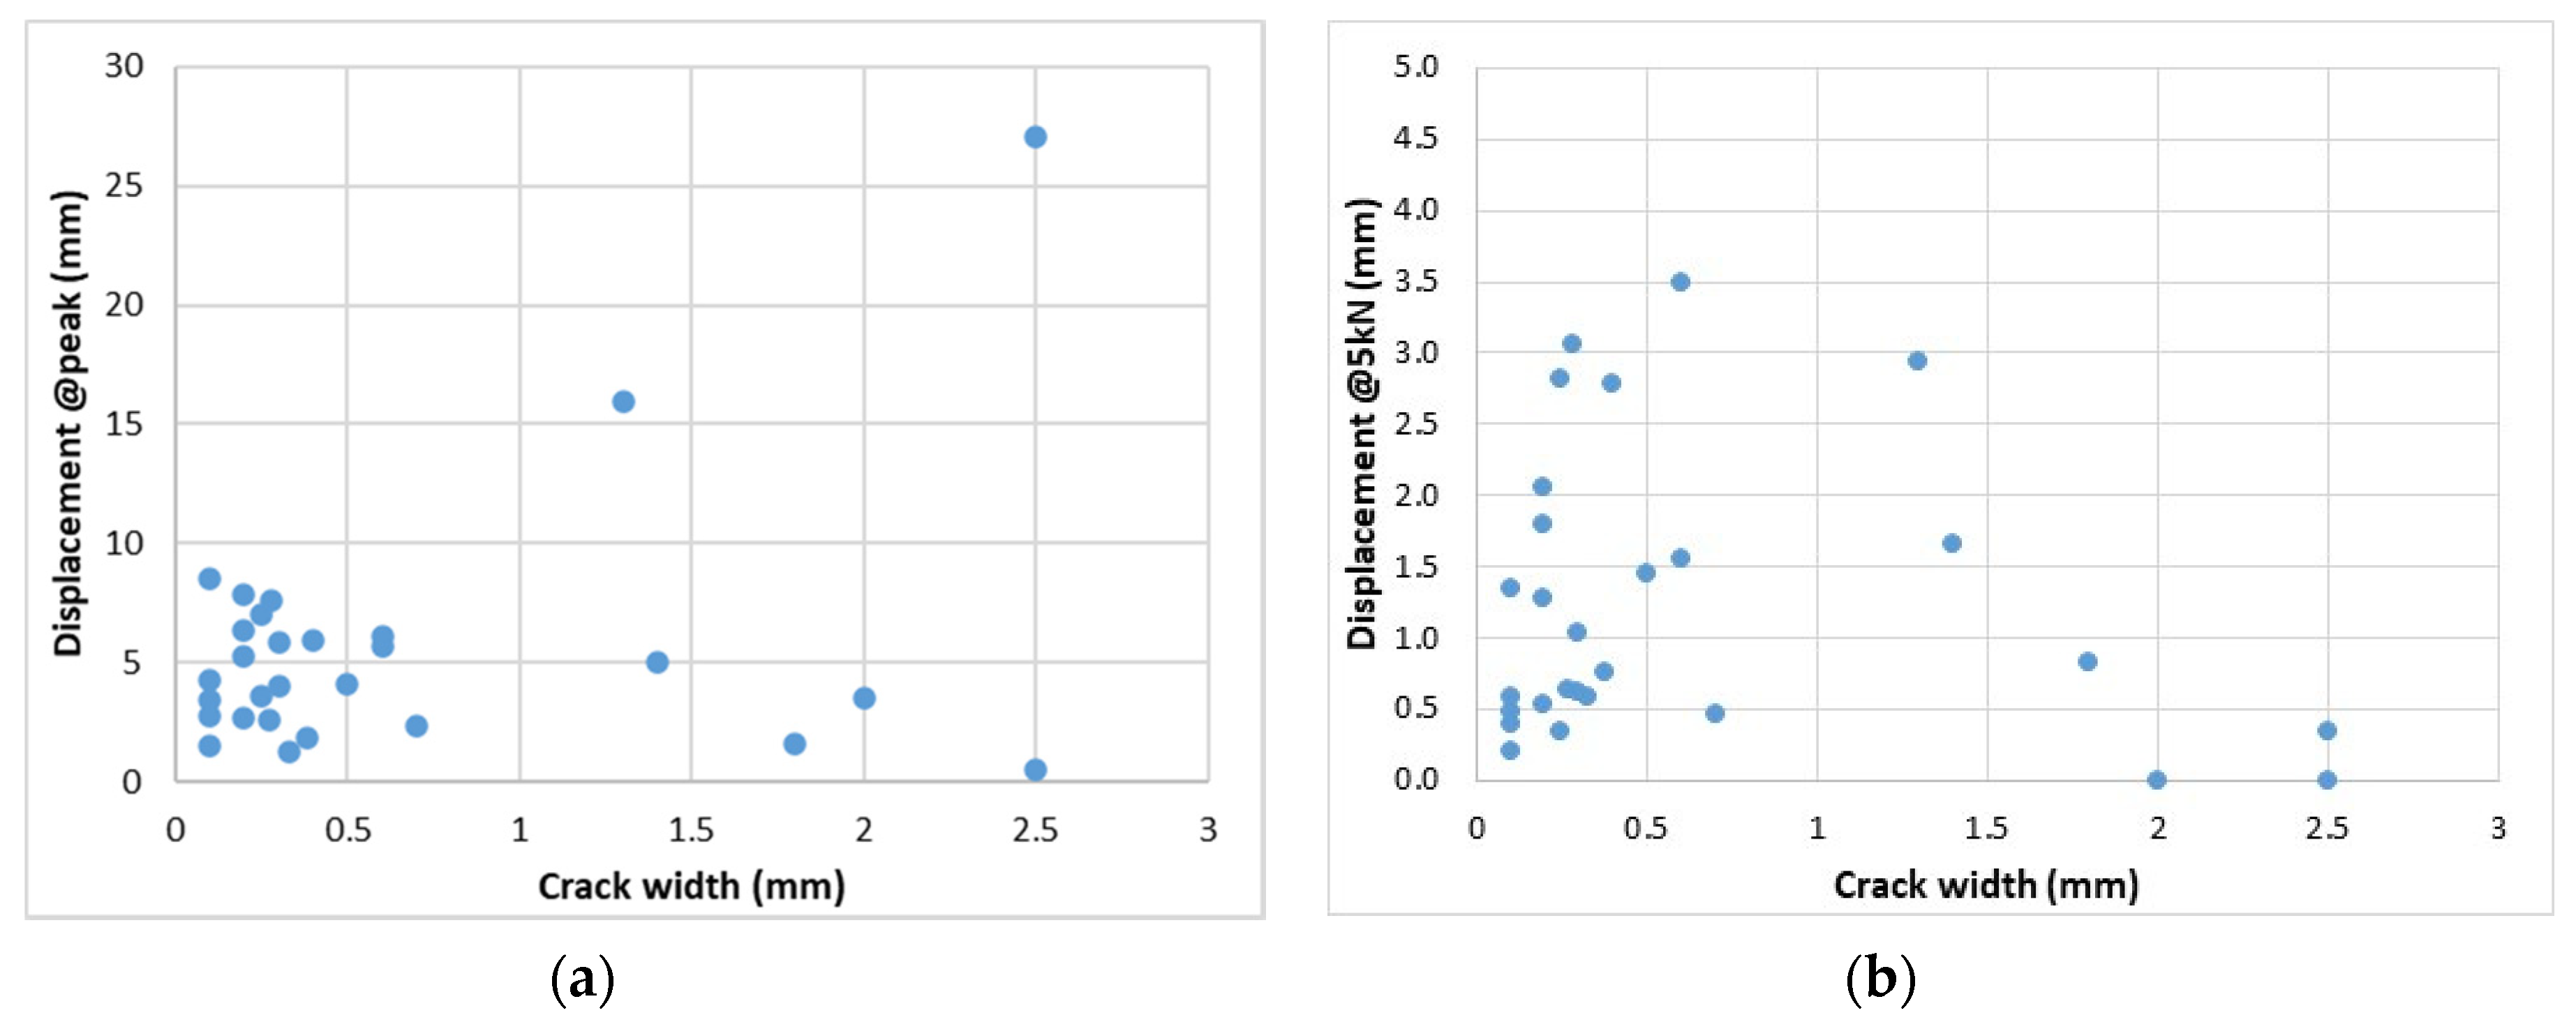
On the basis of the previous analysis, it seems that apart from the position, the crack width affects the results. Figure 10 shows the maximum load vs. the crack width. The load decreases exponentially with the increasing of the crack width with an excellent correlation (R2 = 0.94). It seems that up to the crack width of about 0.7 mm the decrease follows either an exponential (R2 = 0.94) or a linear trend (R2 = 0.92) (Figure 10 right), while beyond that limit the load reduction is less pronounced and only an exponential function can fit the experimental results (Figure 10 left). Unfortunately, there are no results in the crack width range 0.7–1.3 mm, while it would be interesting to observe whether there is a steep change in gradient (at a given crack width) or a soft decrease until reaching an asymptotic value. To investigate this topic a specific additional experimental campaign is needed. On the basis of these results, it seems that the crack opening is the governing parameter that affects the results. Nevertheless, although the correlation between load and crack width is excellent, there is no correlation between displacement and crack width. Indeed, the coefficients of variation of the displacements evaluated at different load levels (Peak load, 50% of the peak load and at 5 kN- Table 3 and Figure 11) are very high. It has to be noted that the displacements at the peak load and at 50% of the peak load were associated to the different loads of each test. Nevertheless, even when evaluated at the same (rather low) load level (5 kN), the coefficients of variation remained very high. The coefficient of variation of the load associated to different crack width (Table 3) is very low up to crack width equal to 0.4 mm.

Figure 10.
Load vs. crack width (all results and up to 0.7 mm).
Table 3.
Test results evaluated on the basis of crack width.
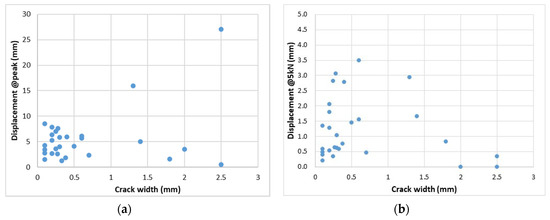
Figure 11.
Displacement vs. crack width at the peak load (a) and at 5 kN (b).
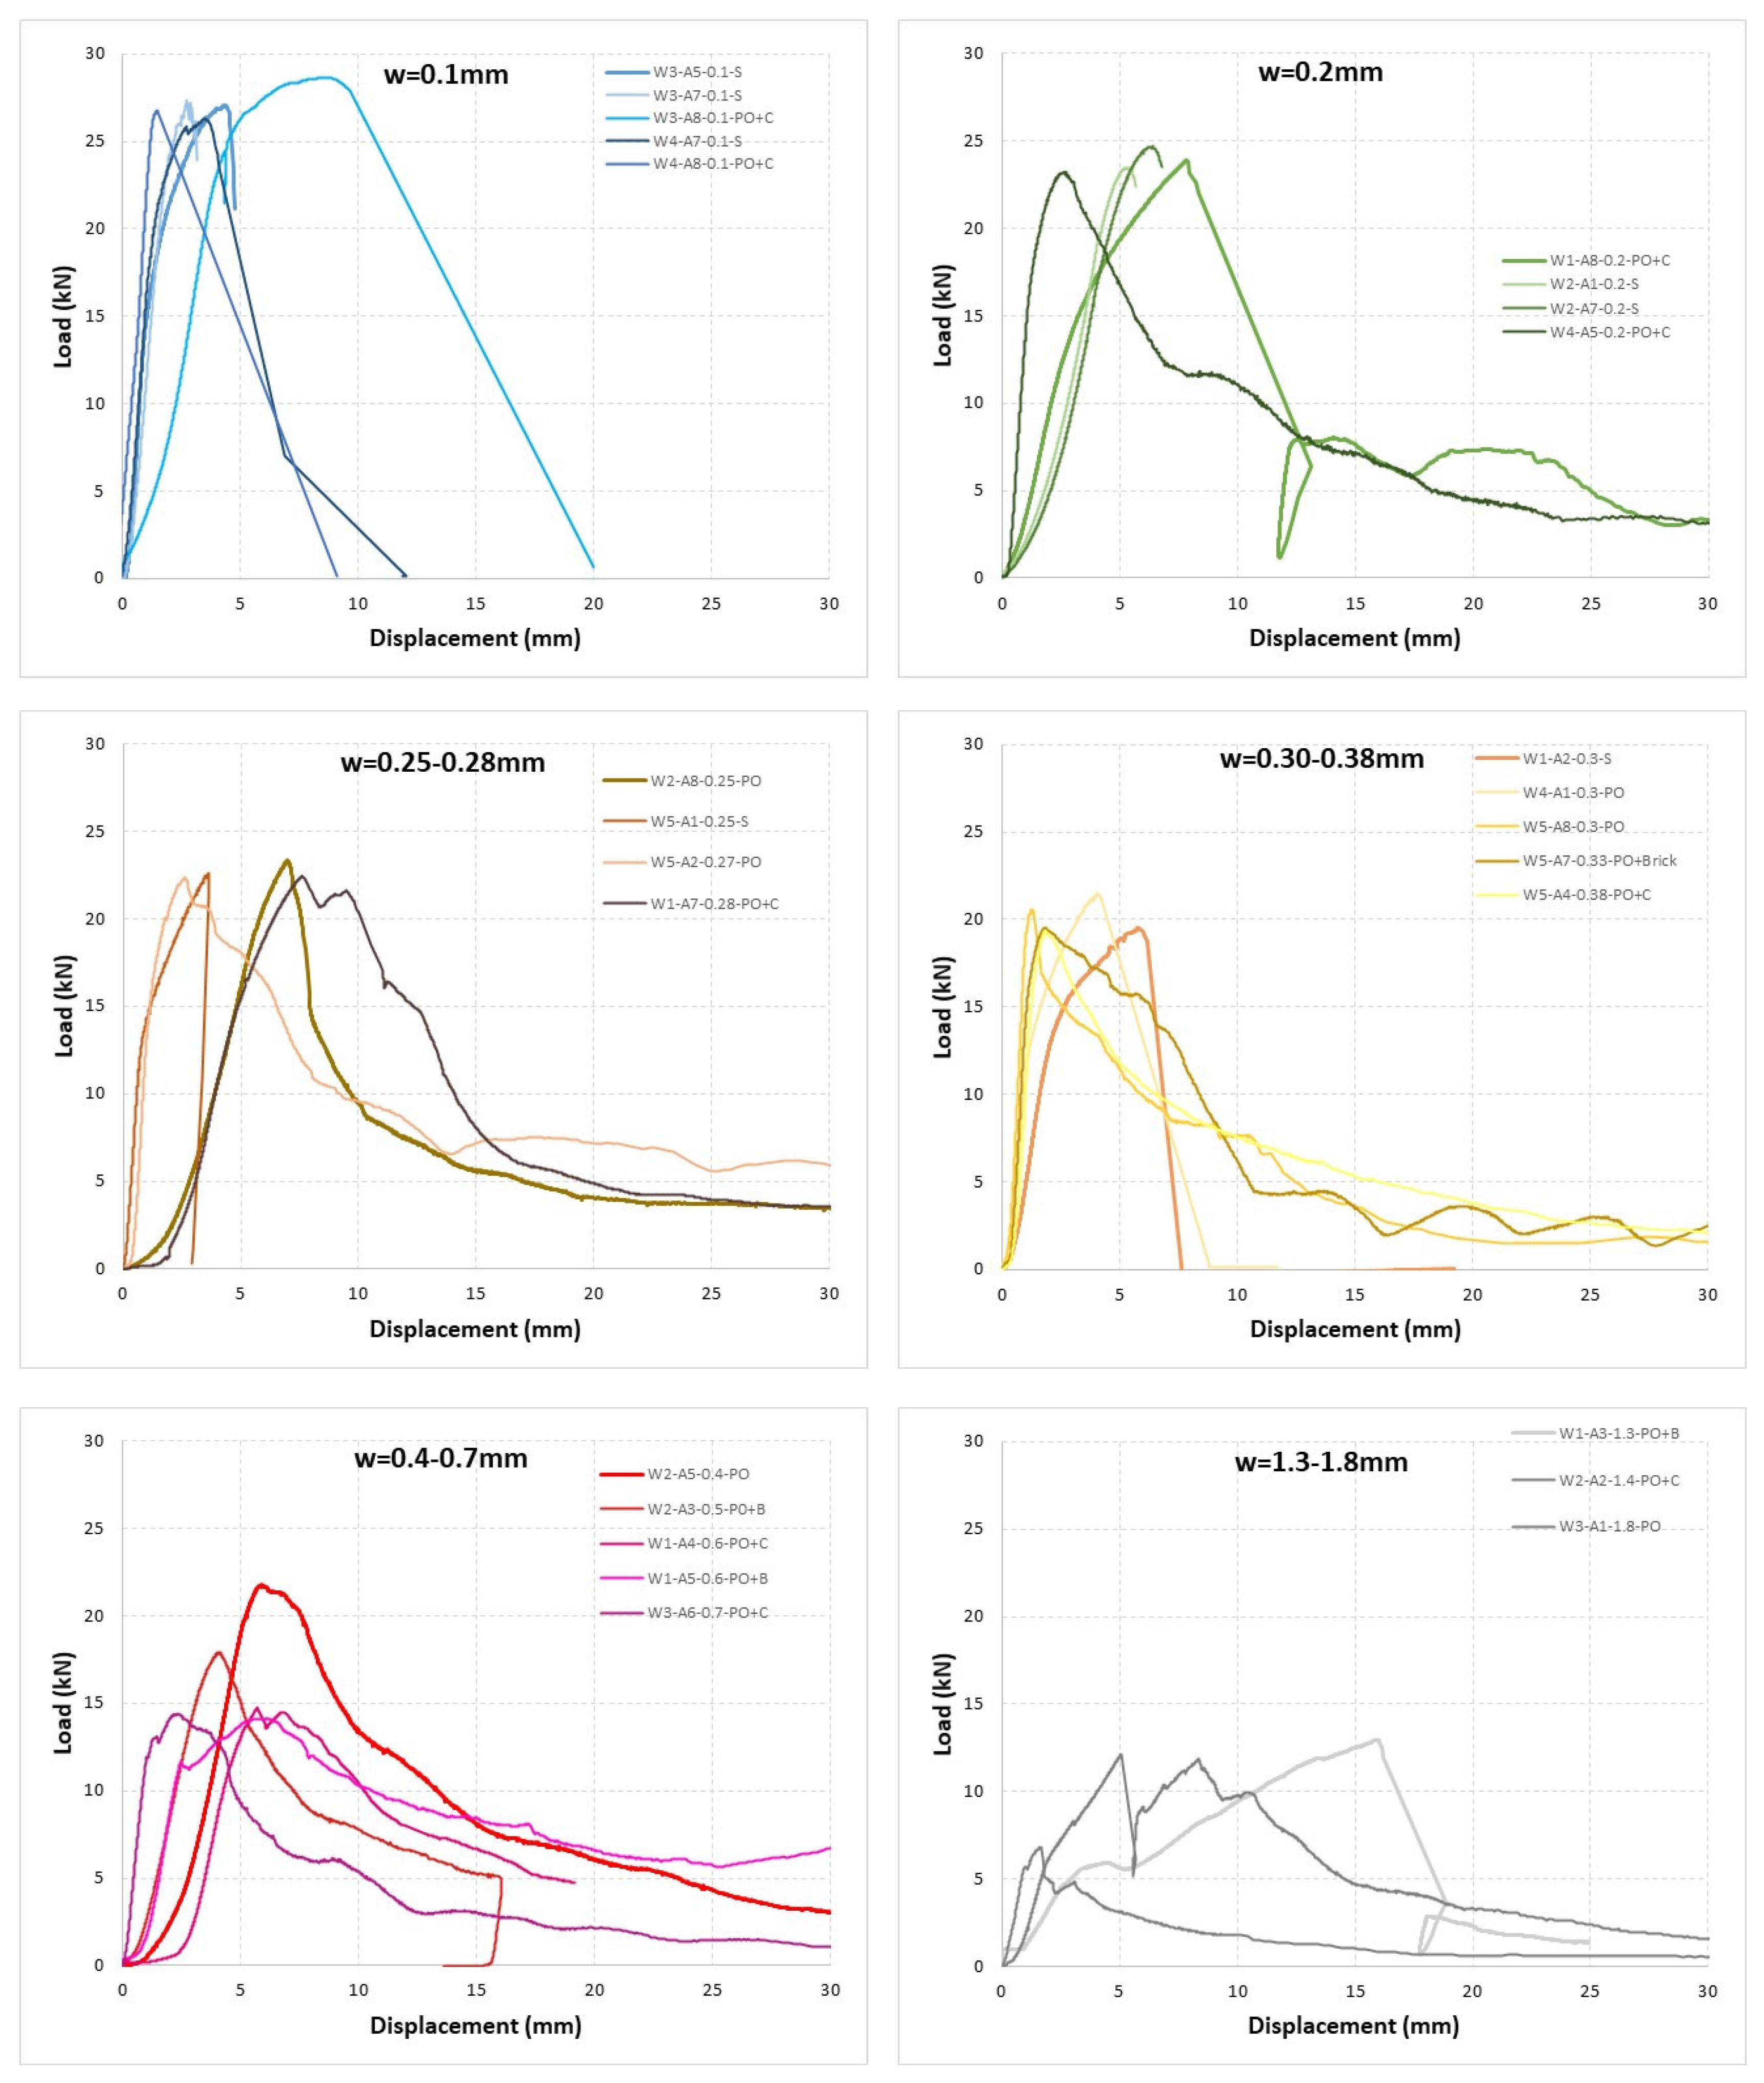
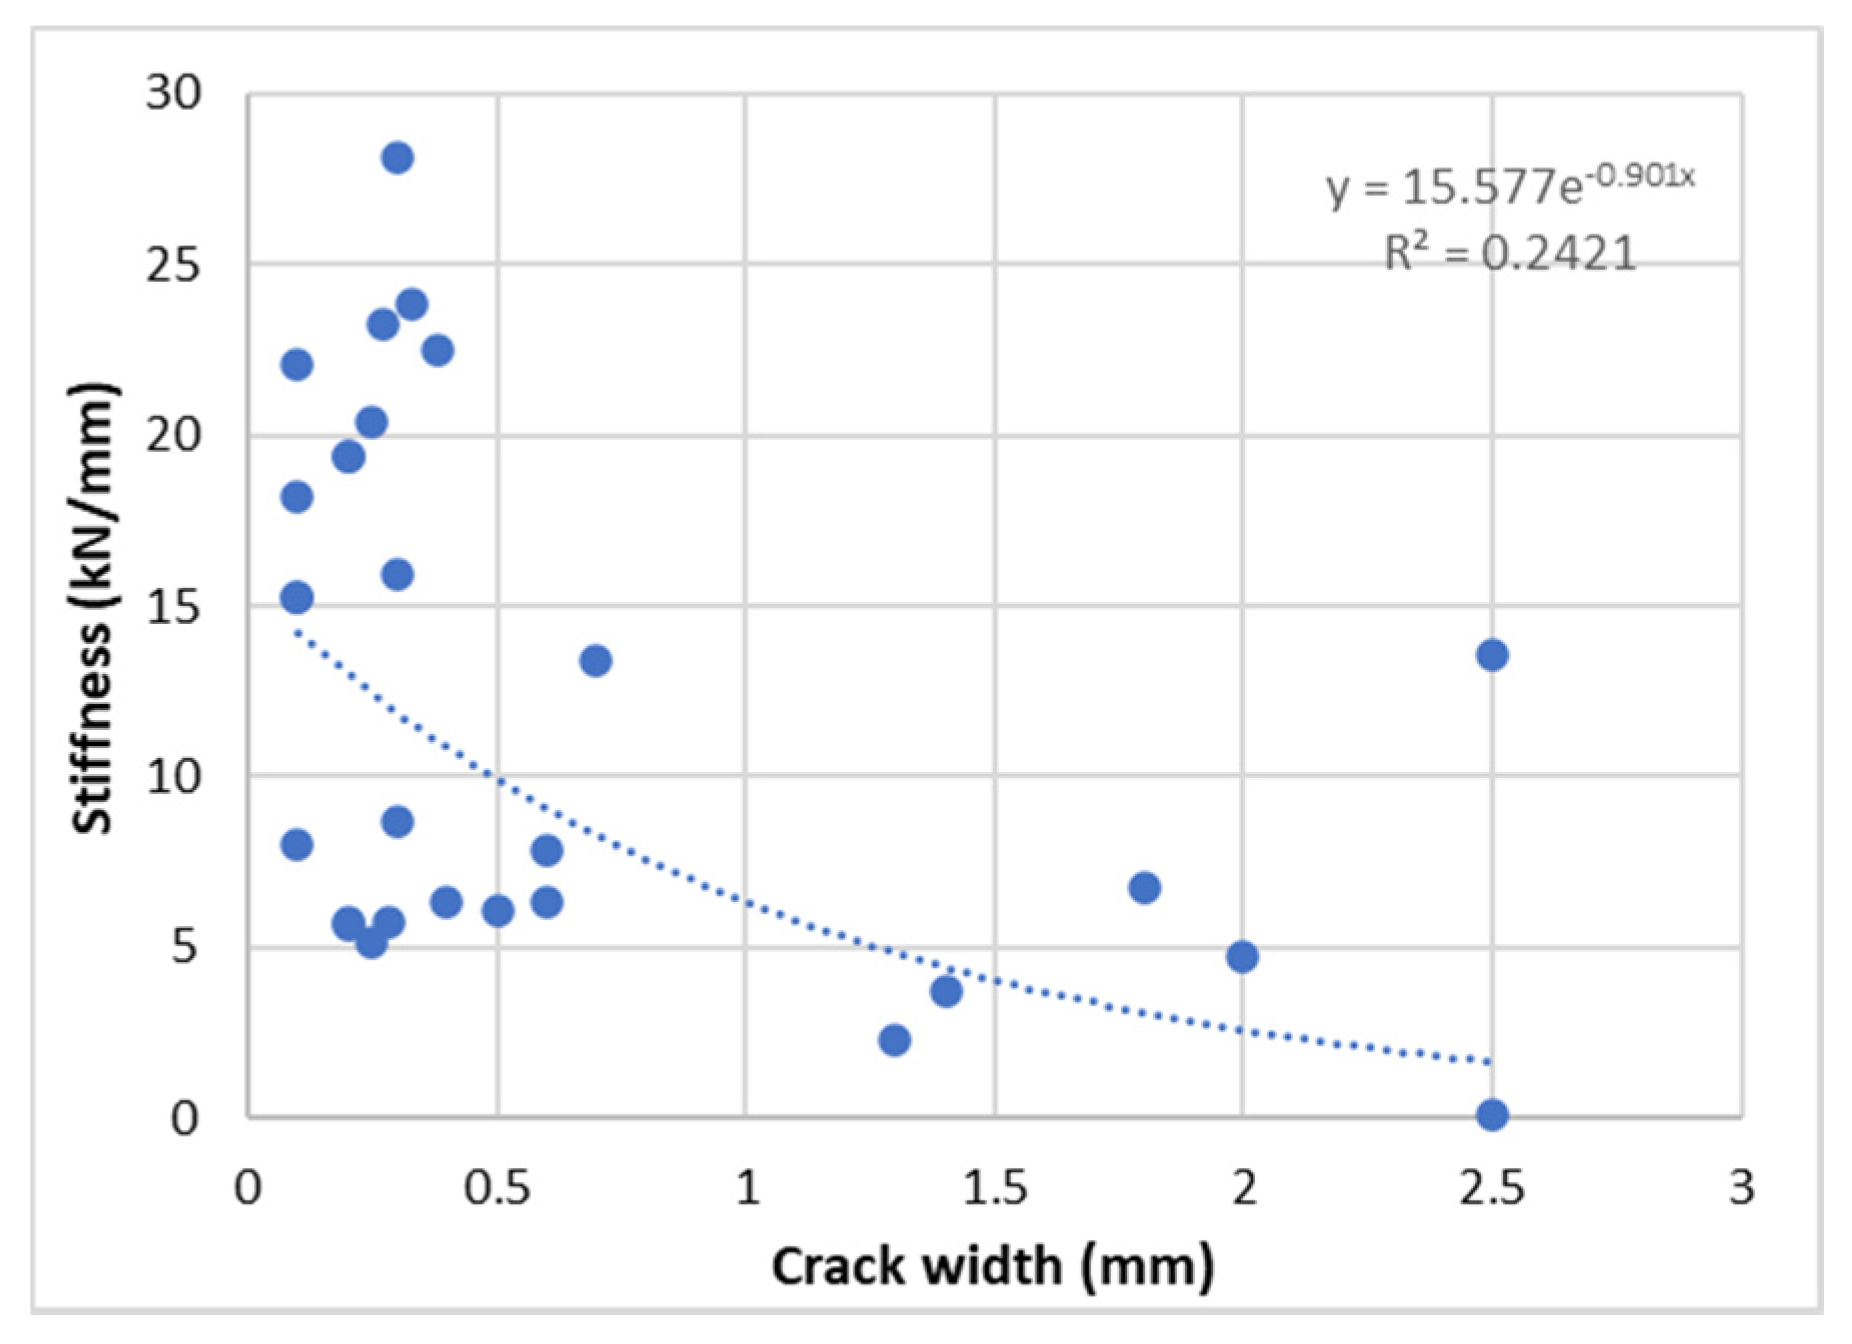
By comparing the load displacement curves associated at a given crack width (Figure 11) it seems that the displacement is only partially affected by the crack width. Indeed, Figure 12 shows that, also for small crack width (0.1 mm and 0.2 mm), there are some curves that differ (independent from the type of failure) and thus the coefficient of variation of the displacements at given loads are very high. This behavior seems more pronounced with increasing crack width, nevertheless no clear trend can be found and there is also no correlation with the failure mode. In addition, it is evident that in some cases a non-linear branch at the beginning of the test was observed (i.e., test W1-A7, W1-A4), followed by a linear part. For this reason, the stiffness of the load-displacement curves was evaluated considering the tangent of the linear part. Figure 13 shows this stiffness vs. the crack width. It seems that the correlation of the two variables is rather limited, even if a trend is identifiable. Likely, the level of pre-damage from the load cycle affects the results, and the crack opening measured on the surface does not consider the possible damage (along the hole) within the masonry, which could affect the load-displacement behavior as well.


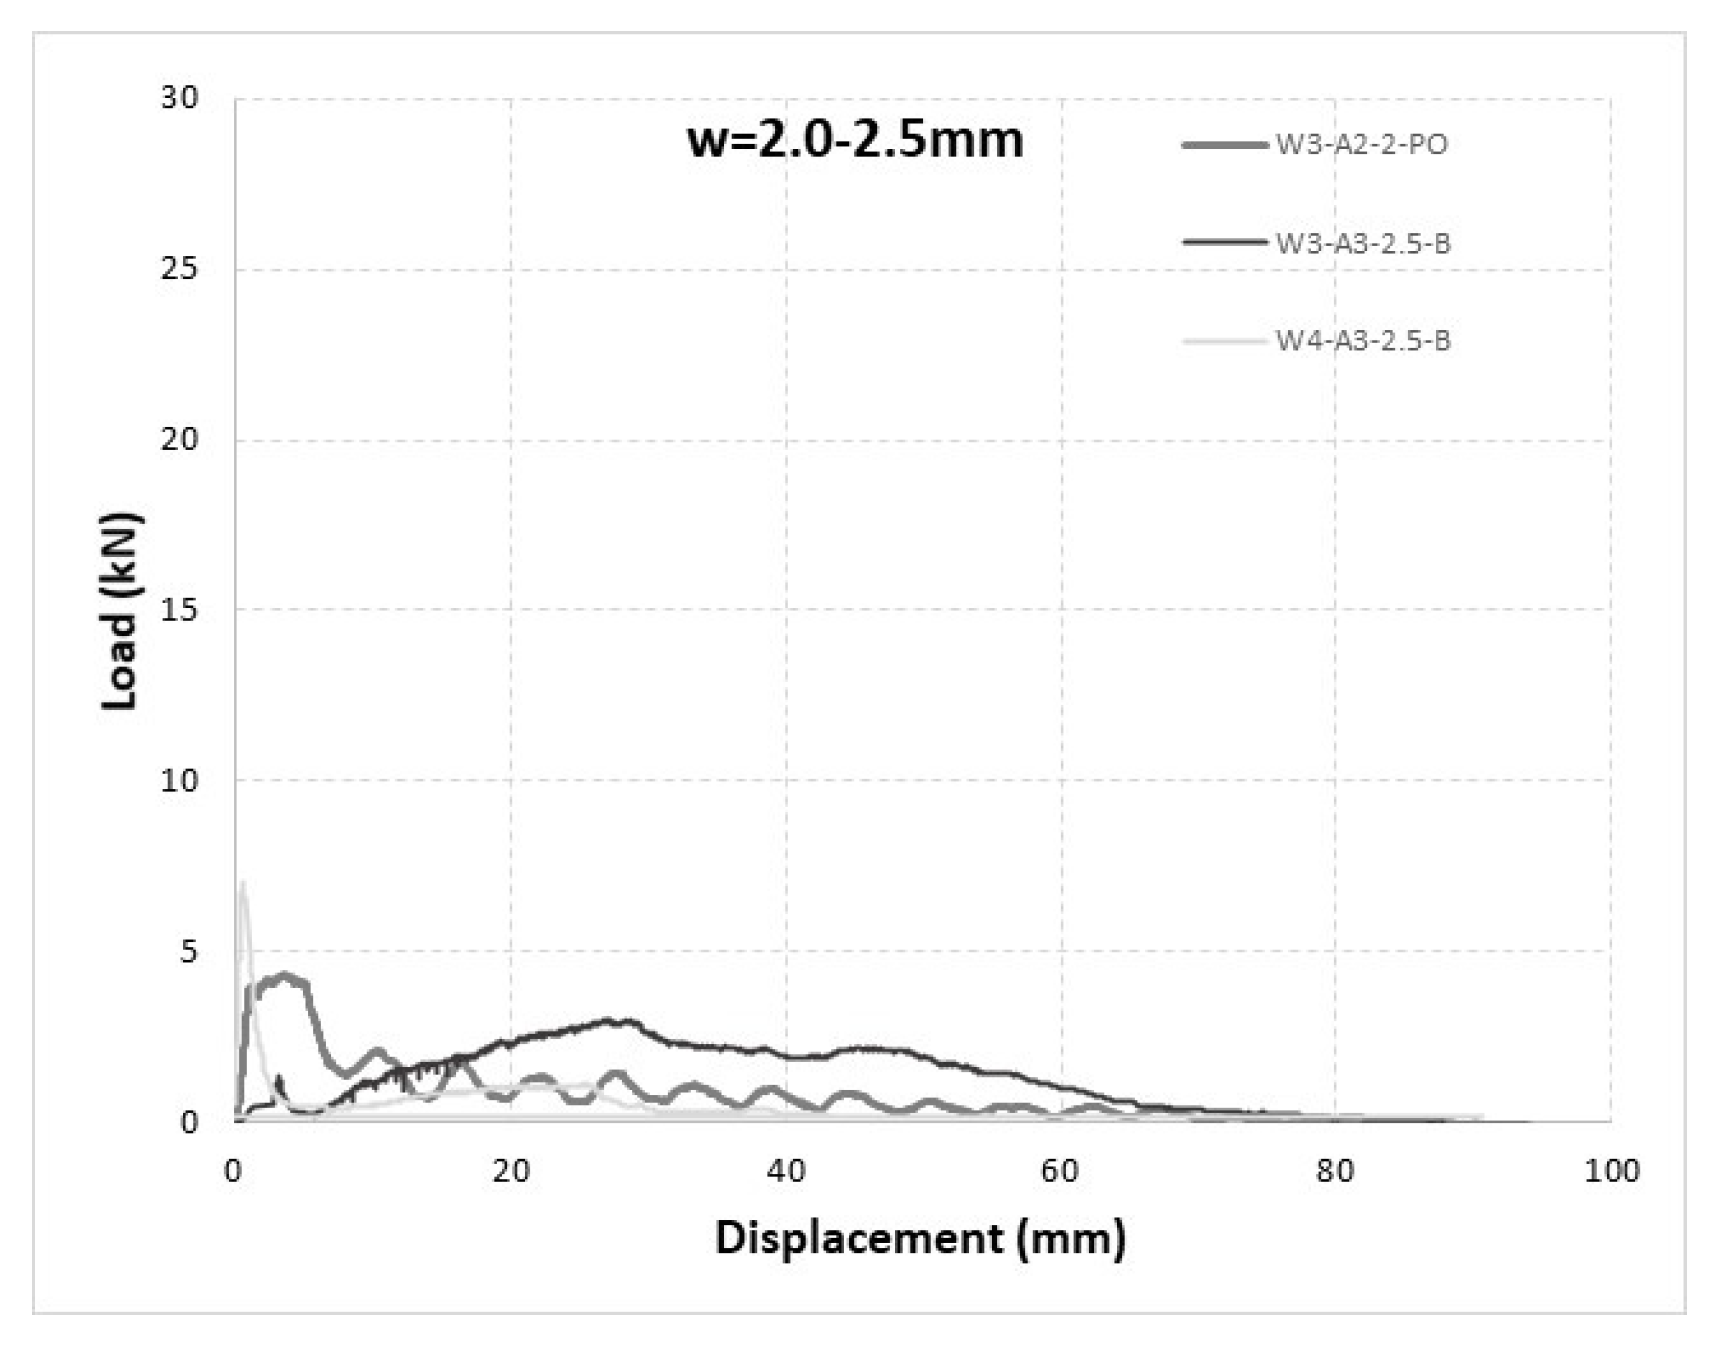
Figure 12.
Load-Displacement curves grouped by crack width (Test Code-crack width in mm-type of failure).
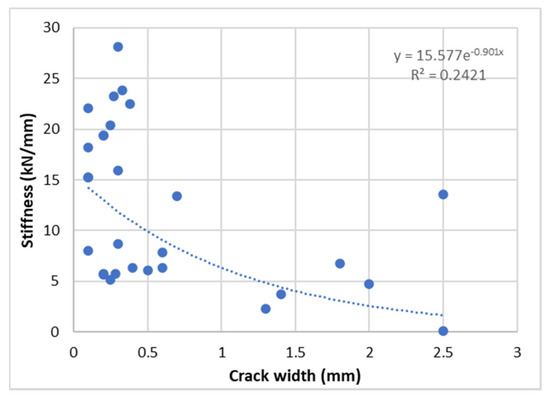
Figure 13.
Stiffness of the linear branch of the load-displacement curves vs. crack width.
4.3. Comparison of Experimental Results with Prediction Equations
To use post-installed bonded anchors in masonry in Europe, the assessment of the adhesive performance must be performed according to EAD 330,076 (European Assessment Document) [13] issued by EOTA. The associated document to design anchor connections is the TR054 [14] which requires the evaluation of all possible failure modes (considering even joint influence), under tension loading namely: steel failure, pull-out failure of the anchor, brick breakout failure, pull-out of one brick. The document gives formulations only for steel (Nrk,s) and pull-out of one brick (Nrk,pb) characteristic failure loads, while other failure modes must be experimentally assessed according to EAD and are reported in the ETA (European Technical Assessment) of the anchor system. For the considered case it results:
where As and fuk are the bar area and the ultimate steel strength, lbrick, bbrick, hbrick are the length, width, and height of the brick, fvk,0 is the initial shear strength of the masonry mortar and σd is the compressive stress perpendicular to the bed joint.
Nrk,s = Asfuk = 27.1 kN
Nrk,pb = 2 lbrickbbrick (0.5 fvk,0 + 0.4σd) + 2 hbrickbbrick 0.5 fvk,0 = 12.1 kN
Several brick breakout formulations, based mainly on the concrete capacity design (CCD) method developed for anchors in concrete [21], can be found in literature. Usually, the proposed methods [36,37] consider a constant tensile strength acting on the projected area of the failure cone to evaluate the ultimate mean load. The main difference among models is related to the evaluation of the tensile strength (which is correlated to compressive strength fm) and on the projected area which can be assumed in different ways (cone or pyramid with an angle of 35° or 45°). Those models overestimate the expected ultimate load (range of about 18–70 kN). In [18] another approach is proposed for brick breakout failure of clay bricks, which is based on results with perforated bricks and considers a linear influence of the embedment depth. The characteristic resistance is calculated as follows (with fb the average brick compressive strength and hef the effective embedment depth):
Nb = 11.4 √fb hef
Nb = 9.7 kN from Equation (3)
The available formulations seem to be unsuitable to predict the ultimate load, in some cases it is overestimated (with the CCD approach overestimate [36,37]) or underestimated as in Equation (3), presumably because of the linear approach. In addition, it should be considered that the formulations do not consider cracking and damage level of the wall.
From experimental evidence the resistance for anchor pull-out failure can be predicted from Table 1, neglecting the anchors that exhibited steel or brick failure.
By considering all tests, it results a characteristic value (5% fractile)
Nrk,p = 4.0 kN (19 tests; cov = 35%)
While considering only test of anchors in crack width lower than 1.0 mm, it results
Nrk,p = 10.9 kN (15 tests; cov = 21%)
This last result suggests that anchors that underwent a limited cyclic damage (limited crack width) are still able to sustain a high carrying capacity.
5. Conclusions
This research allows to draw the following conclusions:
- The existing European assessment and design of post-installed adhesive anchors in masonry [13,14] do not cover seismic loading conditions nor the influence of masonry cracking and damage on the anchor performance. Anchor products, in fact, are required to be tested only in uncracked, undamaged conditions. Depending on the level of damage of the base material, however, adhesive anchors undergoing cyclic actions (e.g., seismic events) can exhibit poor performances.
- There seems to be a clear correlation between the crack width, measured on the surface at or nearby the anchor location, and its maximum recorded load capacity. Furthermore, when damage is limited (e.g., crack width below 1.0 mm) the characteristic pull-out strength evaluated on the basis of the test results is still considerably high and reaches around 75% of the expected characteristic resistance valid for uncracked conditions.
- Only a rather weak correlation was found between anchor stiffness and crack width. This may be related to the fact that cracks were measured on the surface without considering damage (incl. crack propagation) inside the masonry, which is expected to affect the anchor stiffness rather than its peak load, especially for smaller crack widths.
- The location of the anchor within the wall is crucial. Anchors along the diagonal (most stressed area) exhibited lower strength compared to all others. Overall, anchors exhibited good performance when highly stressed areas (associated to crack widths well beyond 0.5 mm) were avoided. For anchors installed in these areas, the peak loads were still significant (minimum load 3 kN at a crack width of 2.5 mm), but their displacements were not compatible with practical applications.
Summing up, the installation of anchors in masonry elements expected to undergo seismic actions should be preceded by a detailed analysis of the expected stress state of the base material to avoid areas where large cracks are foreseen and where a reliable performance of the connection might not be guaranteed. On the other hand, the adhesive anchors installed in areas with limited damage could still show relatively good strengths. This latter conclusion, however, is no substitution for requiring specific cyclic tests under crack influence in the future to guarantee a reliable and adequate anchor performance for seismic-relevant applications.
Author Contributions
Conceptualization, S.C.; methodology, S.C. and N.V.; software, S.C. and N.V.; validation, S.C. and N.V.; formal analysis, S.C. and N.V.; investigation, N.V.; resources, S.C.; data curation, S.C. and N.V.; writing—original draft preparation, S.C. and N.V.; writing—review and editing, S.C. and N.V.; visualization, N.V.; supervision, S.C.; project administration, S.C.; funding acquisition, S.C. All authors have read and agreed to the published version of the manuscript.
Funding
This research received no external funding.
Institutional Review Board Statement
Not applicable.
Informed Consent Statement
Not applicable.
Acknowledgments
While opinions, findings, and conclusions are those of the authors, we would like to thank Georg Welz for his insights, expertise, and suggestions throughout the preparation and review of this article, together with the technical staff of the Materials and Structures Testing Laboratory of Politecnico di Milano (particularly, Daniele Spinelli and Roberto Minerva) for their assistance during the experimental work.
Conflicts of Interest
The authors declare no conflict of interest.
References
- Roca, P.; Lourenço, P.B.; Gaetani, A. Historic Construction and Conservation: Materials, Systems and Damage; Routledge: London, UK, 2019; p. 366. [Google Scholar]
- Gautam, D. Masonry Construction in Active Seismic Regions; Rupakhety, R., Gautam, D., Eds.; Elsevier: Amsterdam, The Netherlands, 2021; p. 480. [Google Scholar]
- De Angelis, A.; Maddaloni, G.; Pecce, M.R. Seismic Vulnerability Assessment of a Monumental Masonry Building. Infrastructures 2020, 5, 93. [Google Scholar] [CrossRef]
- Brandonisio, G.; Lucibello, G.; Mele, E.; De Luca, A. Damage and performance evaluation of masonry churches in the 2009 L’Aquila earthquake. Eng. Fail. Anal. 2013, 34, 693–714. [Google Scholar] [CrossRef]
- Barbieri, G.; Valente, M.; Biolzi, L.; Togliani, C.; Fregonese, L.; Stanga, C. An insight in the late baroque architecture: An integrated approach for a unique Bibiena church. J. Cult. Herit. 2017, 23, 58–67. [Google Scholar] [CrossRef]
- Scamardo, M.; Franchi, A.; Crespi, P. An innovative approach for the finite element modelling of masonry cracking. In Proceedings of the International Masonry Society Conferences 2018, Milan, Italy, 9–11 July 2018. [Google Scholar]
- Scamardo, M.; Franchi, A.; Crespi, P. A non-standard numerical method for finite element modelling of tensile cracks in quasi-brittle material. Comput. Struct. 2022, 258, 106664. [Google Scholar] [CrossRef]
- Biolzi, L. Evaluation of compressive strength of masonry walls by limit analysis. J. Struct. Eng. 1988, 114, 2179–2189. [Google Scholar] [CrossRef]
- Bento, R.; Lopes, M.; Cardoso, R. Seismic evaluation of old masonry buildings. Part II: Analysis of strengthening solutions for a case study. Eng. Struct. 2005, 27, 2014–2023. [Google Scholar] [CrossRef]
- Paganoni, S.; D’Ayala, D. Testing and design procedure for corner connections of masonry heritage buildings strengthened by metallic grouted anchors. Eng. Struct. 2014, 70, 278–293. [Google Scholar] [CrossRef]
- Ceroni, F.; Cuzzilla, R.; Pecce, M. Assessment of performance of steel and GFRP bars as injected anchors in masonry walls. Const. Build. Mat. 2016, 123, 78–98. [Google Scholar] [CrossRef]
- Cascardi, A.; Leone, M.; Aiello, M.A. Transversal joining of multi-leaf masonry through different types of connector: Experimental and theoretical investigation. Const. Build. Mat. 2020, 265, 120273. [Google Scholar] [CrossRef]
- EOTA. EAD 330076-00-0604. In Metal Injection Anchors for Use in Masonry; EOTA: Bruxelles, Belgium, 2014. [Google Scholar]
- EOTA. TR 054. In Design Methods for Anchorages with Metal Injection Anchors for Use in Masonry; EOTA: Bruxelles, Belgium, 2016. [Google Scholar]
- Vintzileou, E.; Tselios, I.; Karagiannaki, D. Quantification of damage to masonry structures under seismic conditions. In Brick and Block Masonry—From Historical to Sustainable Masonry; CRC Press: Boca Raton, FL, USA, 2020; ISBN 9781003098508. [Google Scholar]
- EOTA. EAD 330499-01-0601. In Bonded Fasteners for Use in Concrete; EOTA: Bruxelles, Belgium, 2018. [Google Scholar]
- CEN. EN. EN 1992-4:2018. In Eurocode 2—Design of Concrete Structures—Part 4: Design of Fastenings for Use in Concrete; CEN: Tokyo, Japan, 2018. [Google Scholar]
- Meyer, A. Zum Tragverhalten von Injektionsdübeln in Mauerwerk. Ph.D. Thesis, Universität Stuttgart, Stuttgart, Germany, 2006. [Google Scholar]
- Welz, G. Tragverhalten und Bemessung von Injektionsdübeln unter Quer- und Schrägzugbelastung im Mauerwerk. Ph.D. Thesis, Universität Stuttgart, Stuttgart, Germany, 2011. [Google Scholar]
- Stipetić, M. Zum Tragverhalten von Injektionsdübeln in Ungerissenem und Gerissenem Mauerwerk. Ph.D. Thesis, Universität Stuttgart, Stuttgart, Germany, 2018. [Google Scholar]
- Eligehausen, R.; Mallée, R.; Silva, J. Anchorage in Concrete Construction; Ernst&Sohn: Berlin, Germany, 2006. [Google Scholar]
- Eligehausen, R.; Cook, R.A.; Appl, J. Behavior and design of adhesive bonded anchors. ACI Struct. J. 2006, 103, 822–831. [Google Scholar]
- Cook, R.A.; Konz, R.C. Factors Influencing Bond Strength of Adhesive Anchors. ACI Struct. J. 2001, 98, 76–86. [Google Scholar]
- Grosser, P.; Fuchs, W.; Eligehausen, R. A field study of adhesive anchor installations. Concr. Int. 2011, 33, 57–63. [Google Scholar]
- Gurbuz, T.; Ilki, A. Pullout performance of fully and partially bonded retrofit anchors in low strength concrete. ACI Struct. J. 2011, 108, 61–70. [Google Scholar]
- Gesoglu, M.; Ozturan, T.; Ozel, M.; Guneyisi, E. Tensile behavior of post-installed anchors in plain and steel fiber reinforced normal and high-strength concretes. ACI Struct. J. 2005, 102, 224–231. [Google Scholar]
- Cattaneo, S. Wedge-Type expansion anchors in high performance concrete. ACI Struct. J. 2007, 104, 191–198. [Google Scholar]
- Delhomme, F.; Brun, M. Pullout Tests on Post-installed Bonded Anchors in Ultra-high Performance Fiber Reinforced Concrete. Struct. Eng. Int. 2019, 29, 1–8. [Google Scholar] [CrossRef]
- González, F.; Fernández, J.; Agranati, G.; Villanueva, P. Influence of construction conditions on strength of post installed bonded anchors. Constr. Build. Mater. 2018, 165, 272–283. [Google Scholar] [CrossRef]
- Cattaneo, S.; Locatelli, A.; Rago, D. Reliability of bonded anchors with different installation techniques: Experimental assessment. Asian J. Civ. Eng. 2019, 20, 681–692. [Google Scholar] [CrossRef]
- Contrafatto, L.; Cosenza, R. Behaviour of post-installed adhesive anchors in natural stone. Constr. Build. Mater. 2014, 68, 355–369. [Google Scholar] [CrossRef]
- Zheng, X.; Tao, Y.; Shi, Q.; Chen, J. Pullout behaviour of FRP anchors in clay bricks. Constr. Build. Mat. 2021, 283, 122544. [Google Scholar] [CrossRef]
- Burton, C.; Visintin, P.; Griffith, M.; Vaculik, J. Field testing of vintage masonry: Mechanical properties and anchorage strengths. Structures 2020, 28, 1900–1914. [Google Scholar] [CrossRef]
- Jonak, J.; Karpinski, R.; Siegmund, M.; Wójcik, A.; Jonak, K. Analysis of the Rock Failure Cone Size Relative to the Group Effect from a Triangular Anchorage System. Materials 2020, 13, 4657. [Google Scholar] [CrossRef] [PubMed]
- Lamplmair, S.; Zeman, O.; Voit, K. Factors Influencing the Load-Bearing Capacity of Rock as Base Material for Post-Installed Anchors. Materials 2021, 14, 5130. [Google Scholar] [CrossRef] [PubMed]
- Arifovic, F.; Nielsen, M.P. Strength of Anchors in Masonry; Report BYG DTU, R-134; Kongens Lyngby: Copenhagen, Denmark, 2006; p. 151. [Google Scholar]
- Moreira, S.; Ramos, L.F.; Oliveira, D.V.; Lourenço, P.B. Design Parameters for Seismically Retrofitted Masonry-To Timber Connections: Injection Anchors. Int. J. Archit. Herit. 2015, 10, 217–234. [Google Scholar] [CrossRef] [Green Version]
- ASTM E519/E519M-21. Standard Test Method for Diagonal Tension (Shear) in Masonry Assemblages; ASTM International: 2021; Volume 5. Available online: https://www.techstreet.com/standards/astm-e519-e519m-21?product_id=2226777 (accessed on 29 September 2021).
- Porter, M.L. Sequential Phased Displacement (SPD) Procedure for TCCMAR Testing. Presented at the Third Meeting of the Joint Technical Coordinating Committee on Masonry Research; U.S.—Japan Coordinated Earthquake Research Program: Tomamu, Japan, 1987. [Google Scholar]
- Giuriani, E. Consolidamento Degli Edifici Storici; UTET: Milan, Italy, 2012; p. 400. [Google Scholar]

Publisher’s Note: MDPI stays neutral with regard to jurisdictional claims in published maps and institutional affiliations. |
© 2021 by the authors. Licensee MDPI, Basel, Switzerland. This article is an open access article distributed under the terms and conditions of the Creative Commons Attribution (CC BY) license (https://creativecommons.org/licenses/by/4.0/).