Article

Applying Heuristics to Generate Test Cases for Automated Driving Safety Evaluation

1
Institute of Automotive Engineering, Technische Universitaet Braunschweig, 38106 Braunschweig, Germany
2
ITK Engineering GmbH, 38122 Braunschweig, Germany
3
Japan Automobile Research Institute (JARI) and SAKURA Project, Tsukuba-shi 305-0822, Japan
4
Department of Mechanical Systems Engineering, Tokyo University of Agriculture and Technology, Tokyo 184-8588, Japan
*
Author to whom correspondence should be addressed.
Appl. Sci. 2021, 11(21), 10166; https://doi.org/10.3390/app112110166
Submission received: 17 September 2021 / Revised: 19 October 2021 / Accepted: 26 October 2021 / Published: 29 October 2021

Abstract

:
Comprehensive safety evaluation methodologies for automated driving systems that account for the large complexity real traffic are currently being developed. This work adopts a scenario-based safety evaluation approach and aims at investigating an advanced methodology to generate test cases by applying heuristics to naturalistic driving data. The targeted requirements of the generated test cases are severity, exposure, and realism. The methodology starts with the extraction of scenarios from the data and their split in two subsets—containing the relatively more critical scenarios and, respectively, the normal driving scenarios. Each subset is analysed separately, in regard to the parameter value distributions and occurrence of dependencies. Subsequently, a heuristic search-based approach is applied to generate test cases. The resulting test cases clearly discriminate between safety critical and normal driving scenarios, with the latter covering a wider spectrum than the former. The verification of the generated test cases proves that the proposed methodology properly accounts for both severity and exposure in the test case generation process. Overall, the current study contributes to fill a gap concerning the specific applicable methodologies capable of accounting for both severity and exposure and calls for further research to prove its applicability in more complex environments and scenarios.

1. Introduction

1.1. Motivation and Aim

As automated and autonomous driving (AD) systems get ready to penetrate the market, their safety evaluation and approval for public roads demands standardized and harmonized safety evaluation methodologies. To fulfil this demand, several international efforts are being undertaken by large scale research projects, such as PEGASUS [1,2,3], SAKURA [4,5,6], Ko-HAF [7,8], Catapult [9], and Streetwise [10]. All these projects have adopted a scenario-based safety evaluation approach, which relies on a clear description of the operational design domain (ODD), in which the systems are meant to be used, as well as on well-structured sets of functional scenarios that the systems will need to address to evaluate their safety [2]. These scenarios are subsequently parameterized and concretized to define finite sets of test cases (thereafter test suite), upon which the AD-system safety is evaluated physically on proving grounds and/or virtually based on simulations.
The scenario-based approach needs to be contextualized within comprehensive safety strategies. A scenario test suite, that specifically addresses the components of decision making and trajectory planning of the architecture of an AD-system [11], must consider various requirements, regarding severity (targets at safety-critical boundaries), realism (corresponds with situations occurring in real traffic), and exposure (includes all reasonably foreseeable situations that may occur in real traffic). Accordingly, the scenario-based approach is necessary, but not sufficient, to ensure the safety of an AD system, and the selection of specific test cases shall focus on ensuring representativeness and coverage of both corner-cases, as well as the general patterns observed in real traffic. Other complementary aspects of safety shall be addressed, including functional safety [ISO 26262], safety of the intended functionality [ISO 21448], or cybersecurity [ISO 21434].
This study aims to investigate an advanced methodology to generate scenario-specific test suites that account for realism, severity, and exposure requirements. In particular, this paper proposes a methodology to generate test cases by applying heuristics to naturalistic driving data and demonstrates the application of the proposed methodology with a cut-in scenario dataset extracted from a previously unpublished driving data set.

1.2. Related Work

Basic requirements for AD testing are summarized in [12], with a major focus on efficiency and effectiveness. Efficiency refers to economic, reproducible, and safe procedures for testing, whereas effectiveness refers to quality assessment through representative, valid, and variable test cases [12]. The need to efficiently and effectively test an immense parameter space applies to the fields of software and AD-system safety testing, in particular. Therefore, a review of the work, related to test case generation methods in software testing, is introduced first, followed by a review of the work that addresses the specific requirements of AD testing as, e.g., including physical dependencies. Therefore, the literature overview is followed by specific work on test case parameterization, in the context of scenario-based testing for automated vehicle safety evaluation.
Combinatorial approaches in software testing aim at the required testing coverage by systematically combining input parameters under consideration of relevant systems’ dependencies and verifying the results of the output data [13,14,15,16]. Sensitivity analysis varies each input parameter individually, while keeping the other parameters constant at their mean value [17]. Heuristics, which is a sub-category of search-based testing, aims at identifying nearly-optimal test cases with a reasonable effort by applying case-specific objective functions and iteratively assigning test cases [14,18,19].
Recent work within the field of scenario-based testing can be clustered into three steps: identification of relevant functional scenarios [20,21], parameterization of scenarios, and the efficient (virtual) execution of the priorly-defined testing scope. There is an effort to combine the first two steps by directly deriving relevant scenarios for testing from real driving data [22,23].
Explicit scenario parameterization for AD safety is commonly supported by expert knowledge, which limits the test suite to scenarios which have been identified as critical in advance [24]. Monte Carlo methods consider the frequency of real-world events for single parameters, but they lack of appropriate consideration of parameter dependencies [25]. This limitation can be overcome by incorporating linear pairwise dependencies between parameters [26], but other possible multi-dimensional dependencies remain out of consideration. Moreover, importance sampling techniques allows a biased sample through the importance function, but do not consider parameter dependencies explicitly [27]. An alternative approach is to fit a Gaussian mixture model, from which relevant test cases (that account for multi-dimensional dependencies) are derived [28]. Although this methodology considers multi-dimensional dependencies, the accurate reflection of safety-relevant corner cases remains questionable.
Additionally, all the previously introduced methodologies restrict the application of criticality metrics to a posteriori evaluation. The search-based approach, within the domain of automated driving, compromises of the optimization of the AD system’s configuration [29,30], the minimization of required test cases by introducing a cost function [31], or the clustering of scenarios from real traffic data [32].
To the best knowledge of the authors of this paper, neither search-based techniques for explicit scenario parameterization that addresses all the above limitations nor the sub-category of heuristics have been applied to generate test cases for automated vehicle safety evaluation.

1.3. Main Contribution

This paper proposes a novel methodology to generate safety-relevant test cases by applying heuristics to naturalistic driving data. The proposed methodology can contribute to overcome several of the unresolved challenges in the field of test case generation.
In contrast with [26,27,28], the distinction between normal and critical driving scenarios is addressed before starting the test case generation, which ensures that only parameter ranges and dependencies that are known to be relevant in advance are accounted for in the process. By defining criticality measurements in advance, specific subsets can be extracted from the real-world data. Consequently, test cases to address severity are generated based on the critical subset, whereas test cases to address exposure are derived from the normal driving subset. This can be a significant improvement over previous studies, as the parameter dependencies between critical and normal driving scenarios have been shown to differ [26].
Another contribution of the proposed approach is an improved compromise between the incorporation of corner cases from real driving scenarios and the robustness in considering outliers. In [26], outlying scenario data has a significant impact on the resulting dependencies, but the robustness is relatively low. On the other hand, the multi-dimensional fitting in [28] often neglects corner cases. The proposed methodology considers multi-dimensional and polynomial dependencies between parameters through the incorporation of regression models for the test case assignment. This enables parameter dependencies to be appropriately accounted for in the test case generation.
Finally, the proposed search-based methodology constantly verifies the safety relevance of the generated test cases in two dimensions during the iterative process, which improves the quality of the final test suite. Therefore, the generated test suite does not require additional steps to evaluate the safety relevance or redundancy of the test cases, allowing for a direct application for AD safety evaluation. Therefore, the adoption of search-based scenario parameterization enhances the current state-of-the-art in explicit scenario parameterization.

1.4. Paper Structure

Hereafter, the methodology, results, discussions, and conclusions of the current paper are elaborated in detail. In Section 2, the heuristics methodology, proposed to generate tests, is described generically. In Section 3, the heuristics methodology proposed is prototypically applied to a set of cut-in scenarios extracted from a previously collected and unpublished traffic data set. The cut-in test cases generated are assessed in Section 4 from the perspective of severity and exposure, by means of independent metrics. Finally, a general discussion is presented in Section 5 and the paper is concluded with Section 6.

2. Heuristics Methodology

The proposed methodology requires the availability of a driving data set that can be assumed representative of the scenario and the traffic environments targeted. First, the scenarios and their corresponding parameters are extracted from the driving data and split into two subsets that represent critical and normal driving scenarios. The scenario parameters are analysed by fitting distributions and by modelling their dependencies through regression analysis. The results obtained from the analysis are then processed by heuristics to iteratively determine, by evaluating the severity and the exposure of each test case candidate, which ones are included in the final test suites.

2.1. Evaluation of Severity and Exposure

Safety relevance of a scenario was considered according to its potential consequences in the case of failure (severity) and the likelihood to occur in real traffic (exposure), as introduced in [33]. Criticality is, therefore, associated with both severity and exposure, implying that it can either result from consequences (in the case of failure), unfavorable handling at some point of the system’s lifetime, or a scenario frequently occurring in real traffic. Consequently, safety relevant scenarios are severe, frequent, or a combination of both. The test cases towards severity aim to meet the former, while the test cases towards exposure aim to meet the latter. By explicitly targeting frequently occurring scenarios, the necessary breadth of testing is reached, and it is ensured that the system is capable of dealing with all occurring scenarios.
Severity was evaluated by means of risk potential field (RPF), in accordance with [34,35]. The RPF is a Bayesian network-based trajectory planner that calculates the overall risk potential of the vehicle’s possible paths. For the required application of the database and the corresponding evaluation of test cases, the RPF evaluation was limited to the path associated with the analysed test case, the driving state of the vehicle under test (VuT) (as defined in [26]), and its interaction with the challenging vehicle (chall) (represented by the parameters characterizing the scenario, as in [36]).
Exposure was addressed by targeting the full coverage of the patterns (parameter’s individual distribution functions as well as the parameter dependencies from the regression models) found in the data set. Therefore, an evaluation was conducted to compare the previously assigned test cases and the newness of a parameter combination of a test case candidate. In order to avoid redundancy between different test cases and to optimize the coverage of the data, an objective measure of newness was incorporated.
The newness evaluation of a test case candidate was conducted in several steps, by comparing each test case candidate with all previously assigned test cases (e.g., to define the fourth test case, a test case candidate was compared with the three test cases previously assigned to the test suite). For each Parameter (Param), the value difference between the test case candidate (cand) and the compared test case (comp) was divided by the parameter distribution range from the total data set, according to (1). Therefore, the equation provides values close to zero for similar candidates and compared parameters, as well as values close to one for very different parameters.
Newness param = abs ( Param cand Param comp ) ( Param max ,   data     Param min ,   data )
Based on the newness value for each individual parameter, the average newness value of the parameters that defined a test case was calculated. The minimal average newness of all parameters that defined a test case candidate was regarded as relevant, in comparison to all previously assigned test cases (e.g., the relevance of a candidate to become the fourth test case in the final test suite is judged based on the minimum newness value out from the comparison with each of the three previously assigned test cases).

2.2. Data Split, Distribution Fitting, and Regression Analysis

The scenario data set was split into two subsets, representative for critical and normal driving scenarios, respectively. Thereafter, for each subset, distributions were fitted to the data and analysed through regression models. These distributions and models served as input for the application of the heuristic methodology. The resulting regression models allowed us to consider parameter dependencies in the test case generation and to reflect the observed data patterns of the underlying naturalistic driving data. In that way, realism in the test case generation is accounted for in two manners: first, as naturalistic driving data build the basis for the test case generation procedure, it is ensured that no synthetic parameter values are applied. Moreover, by abstracting the original parameter values with distribution functions, no outlier parameter values are used in the test case generation. Second, current state-of-the-art approaches [24,27] set parameter values in the test case generation independently, neglecting the fact that dependencies exist. Its importance has already been introduced in [26] and is now considered in this proposed methodology.
With the severity evaluation of each scenario, by means of RPF, a relative split of the data set was conducted. For the current study, a 10% threshold was applied to split the relatively more severe data from the normal driving data. The threshold was determined iteratively during the methodology development, as a trade-off between the large number of scenarios in the transition from critical to normal driving scenarios, as well as the limited data sample size that can affect the statistical reliability of the results. Future work should address the threshold’s value and kind (relative or absolute split), by analyzing multiple data sets and scenario types.
From the distribution fitting, the resulting range, as well as the frequency of occurrences, were derived for each parameter. Univariate, generalized, extreme value distributions were applied to consider both skewness and sharpness at the parameter range boundaries. This resulted in parameter values for the expected value (μ), the standard deviation (σ), and the skewness (k). The minimum and maximum of each individual parameter range, during the test case generation, was determined as the 0.1 and 99.9 percentiles of the corresponding distribution, as in [37].
For the regression analysis, four types of independent parameter relations (constant, linear, pairwise–linear, and quadratic) were considered. The selection of these relations was conducted based on physical plausibility. For example, a second order dependency between distances and accelerations is physically plausible, therefore justifying the incorporation of quadratic relationships in the analysis. By this, the particularity of the AD systems is addressed, as there are physical dependencies between parameters, which is not generally applicable, in the context of software testing. Only the terms that improved the R2-value of the model by at least 0.1 were incorporated in the final regression models. The implementation was conducted by a stepwise regression, to assess all potential dependencies, while removing those that did not meet the pre-defined chosen criteria.

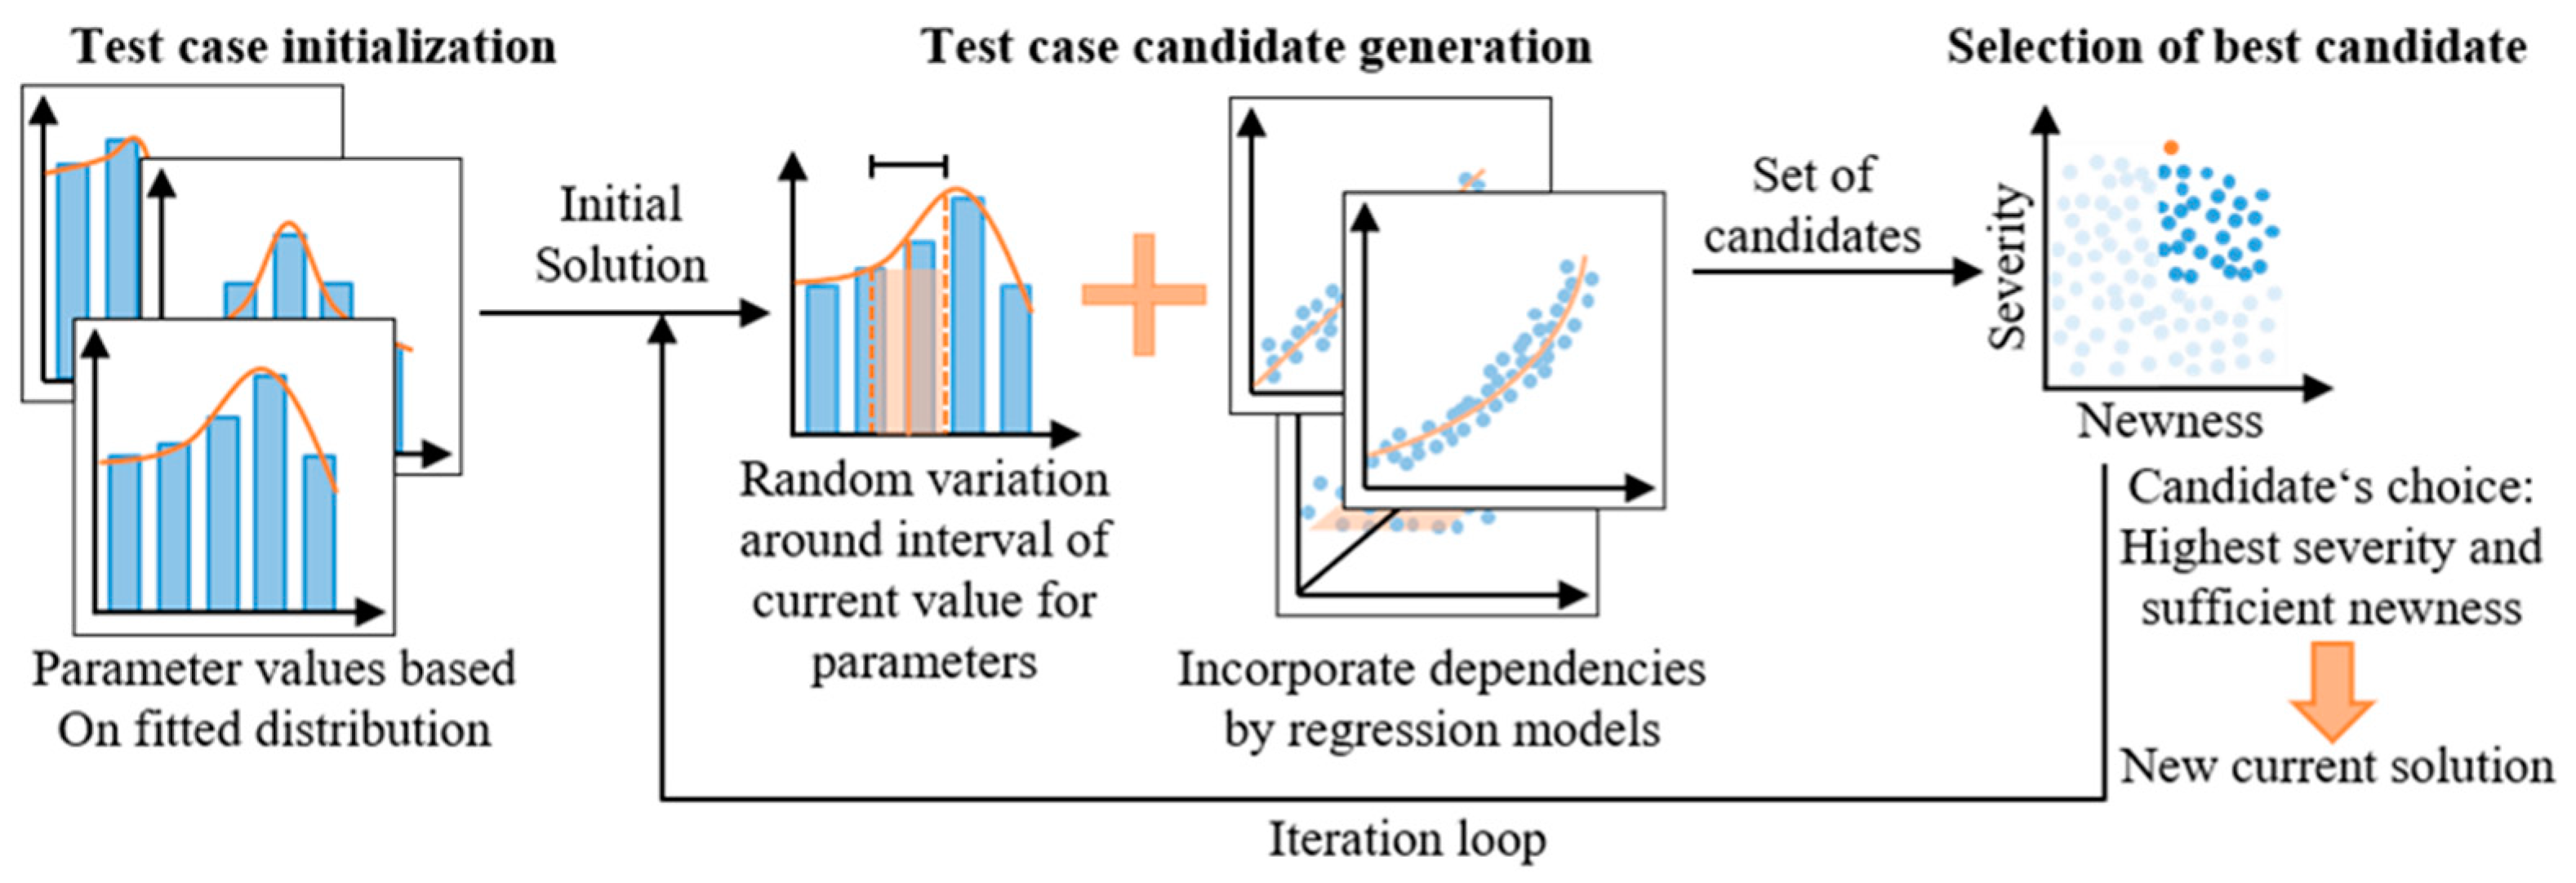
2.3. Heuristic Generation of Test Cases

This section presents the actual application of a heuristics search-based methodology to generate the test cases, based on the fitted distributions and the regression models previously developed. Since the objective function differs between severity and exposure test cases, an explanation focused on severity is provided first, followed by clarifications concerning exposure.
The proposed heuristics methodology is adapted from the software testing related work described in [38] and summarized in Figure 1. The severity test cases were derived from the fitted distributions and the regression models obtained from the critical subset of scenarios. The generation of a single test case comprised three main steps (“Test case initialization”, “Test case candidate generation”, and “Selection of best candidate”), from which the latter two were part of an iteration loop.
In the “Test case initialization” step, an initial solution was obtained by randomization, based on each parameter’s fitted distribution. To ensure a wide spread of cases, the initial values for each parameter from the randomization were set to differ at least 20% from the corresponding value of the previous assigned test case.
This procedure accounts for the coverage of the search space for the methodology, as well as for the representativeness, by considering the frequency of occurrence of the parameters.
The “Test case candidate generation” step, applied the initialized random test case from the previous step to generate a pre-determined number of test case candidates. For each candidate, each parameter value from the initial random solution was varied, within a range of 20% around the first obtained randomized solution, as well as based on the fitted distribution. Hereafter, each of these values were assigned the influencing variables, following the regression models that had a minimum R2-value of 0.7, and the current values were overwritten, according to the following rules:
  • Set parameters only influenced by independent parameters;
  • Set parameters influenced by either parameters set, according to rule 2 or by independent parameters;
  • Set all remaining dependent parameters, according to their regression models from lower to higher R2 order.
In the current study, to provide a high coverage when analyzing the parameter combinations as potential test cases, an arbitrary number of 1000 test case candidates was defined.
As previously mentioned, the “Test case candidate generation” and “Selection of best candidate” steps were part of an iteration loop. For the assignment of a test case, the iteration loop was repeated until no better candidate test case could be identified or until an arbitrary number of 100 iteration steps was reached. In either case, the current solution was assigned to the final test suite as the best test candidate. To select the best test case candidate, both safety dimensions were assessed, either being optimized or meeting a pre-defined level. Specifically, for the severe test cases, the RPF was optimized, while a certain newness value was ensured. Therefore, severe test cases that covered the relevant parameter space were derived by this verification-in-the-loop procedure. Subsequently, the process was restarted from the test case initialization step for the next test case.
The process to assign exposure test cases to the final test suite is analogue to the process to assign the severity test cases, with the following differences. First, the normal driving subset of scenarios was used to fit the distributions and develop the regression models, instead of the critical subset of scenarios. Second, in the step “Selection of best candidate”, a maximum RPF value was pre-defined to ensure focus on normal driving scenarios. Furthermore, the newness value was optimized to reach the goal of covering the parameter space of normal driving to the best achievable level.
Regarding the test suite size, a trade-off between an accurate coverage of the data pattern (by a large amount of test cases) and an efficient safety evaluation process (by limiting the test suite to the most relevant test cases) needs to be defined. In the current study, a test suite of 20 severity test cases and 20 exposure test cases was pre-defined.

3. Prototypical Application to Cut-In Dataset

3.1. Data Set

In this section, the heuristics methodology proposed was prototypically applied to a set of cut-in scenarios, extracted from a previously collected, yet unpublished, traffic data set.

3.2. Cut-In Scenario Definition, Detection, and Grouping

The data set incorporated in this study was collected on German highways with four different instrumented vehicles. The vehicles were equipped with a mid-range front radar, a mono camera, and measurement hardware devices to continuously record the naturalistic driving behaviour of both the measurement vehicle and the surrounding objects. As the measurement devices of the vehicles are not recognizable from outside of the vehicles, the collected surrounding objects and vehicle data can be regarded as non-biased. The data comprised a total of 123,225 km driven kilometres and 1159 h, with neither automation function activated nor instructions for the drivers.
Following data post-processing, to generate clear lane-related object tracks, cut-in scenarios from the right were detected, following the definitions above and rule-based detection algorithms, extended by a dual approach for lane change detection, as elaborated in detail in [39]. For the current study, the beginning of a cut-in scenario was set when the challenging vehicle’s lateral distance to its left lane became lower than 1.5 m and had a positive lateral velocity. The end of the cut-in was set when the lateral distance from the challenging vehicle to its right lane (after crossing it) exceeded 1 m. The application of the detection algorithms and further data set clearing steps resulted in a total of 2294 clear cut-in scenarios that formed the basis of the current study application. For each of the detected scenarios, the required VuT’s and challenging vehicle’s parameters, evolving over the scenario duration, were saved as illustrated in Figure 2. The detected time of the evolving scenario parameters were abstracted by taking the characteristic values of the relevant descriptive parameters as summarized in Table 1. Subsequently, the risk potential value for each scenario was calculated. Based on these results, the detected scenarios were grouped into a relatively more severe subset and an exposure subset, which comprised of 229 and 2065 cut-in scenarios, respectively.

3.3. Data Distribution and Regression Analysis

The resulting fitted distributions for the severe and the exposure data subsets are provided in Table 2 and Table 3, respectively. A comparison of the fitted distributions shows that severe cut-in scenarios tend to have lower longitudinal velocity of both vehicles (vx,VuT = 98.2 km/h and vx,chall = 95.9 km/h), lower longitudinal distance (dx = 14.4 m), and a more frequent braking by the challenging vehicle than the exposure cut-in scenarios.
Table 4 shows the resulting regression models that were identified as relevant (R2 higher than 0.7). For each regression model, its R2-value and the influencing parameters, together with their standardized coefficients, are provided. Negative values indicate that the corresponding dependent parameter decreases with an increase of the associated influencing parameter. For each regression model, a significant constant term was identified. Moreover, the normal driving data set shows a strong cross-correlation between the two longitudinal velocities.

3.4. Application of Heuristic and Resulting Test Cases

Table 5 summarizes the severity and the exposure test suites, obtained as a result of applying the heuristics (Section 2.3 and Figure 1) to the fitted distributions (Table 2 and Table 3) and regression models (Table 4). Each test suite generated comprises 20 test cases, as pre-determined.
Concerning the application of the regression models, within the test case candidate generation, the following order was applied. For both test suites, the two parameters vx,VuT and vx,chall were mutually influencing. Therefore, rule three (Section 2.3 above) applies. For the severe test cases, the regression model for vx,chall is applied first, due to its lower R2-value. The same rule, applied to the exposure test cases, leads to the opposite order of vx,VuT, followed by vx,chall.

4. Assessment of Generated Cut-In Test Cases

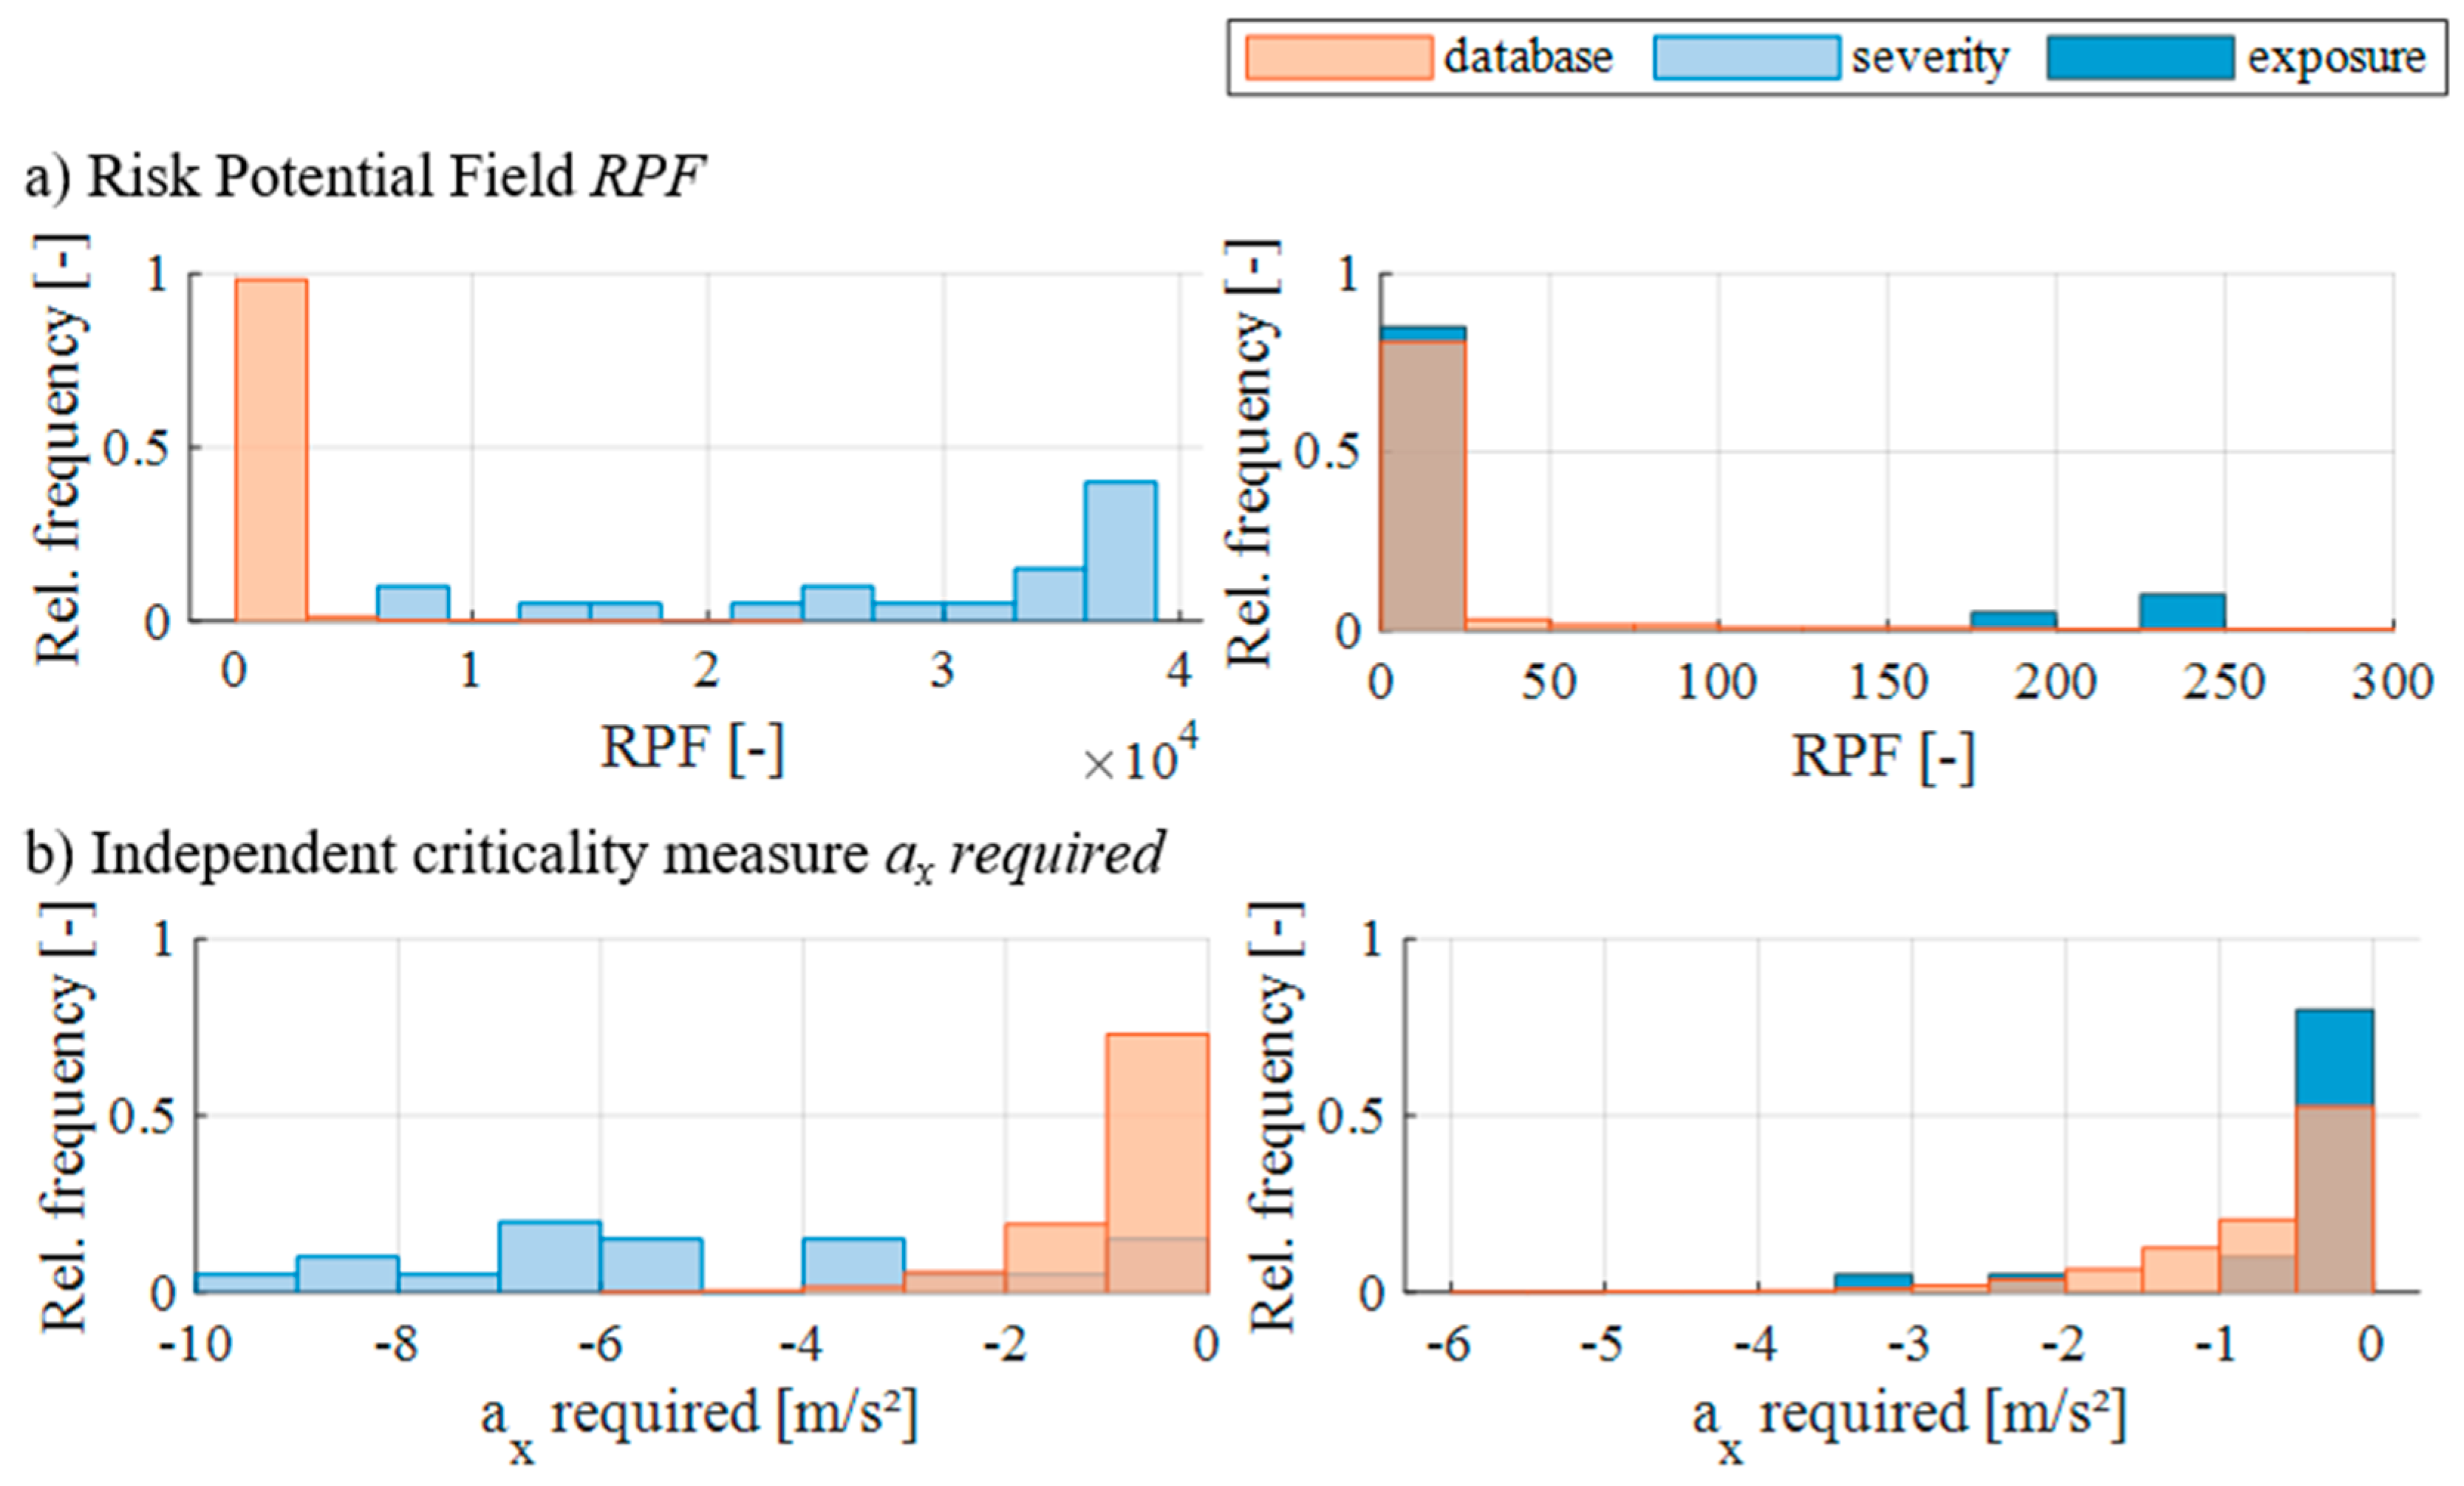
4.1. Evaluation of Criticality of Severity and Exposure Test Suites

The evaluation of criticality for both test suites was conducted based on two different metrics: RPF (Figure 3a) and a newly developed independent criticality metric, denoted as required deceleration, ax (Figure 3b). For both metrics, the generated test suites severity and exposure are opposed to the original scenario database. Accordingly, the performance of the heuristics, to create critical test cases out of the original database, can be evaluated.
Figure 3a shows the comparison of the RPF values from the original database and the RPF values from the severity and the exposure test cases, respectively. The comparison reveals that the RPF values of the generated severity test cases are at the edge of the RPF values from the original dataset. Accordingly, the test cases that are more critical could be synthetically generated. Contrary to that, the values of the exposure test cases show, as expected, a comparable criticality as the original scenario dataset.
To validate the severity of both test suites, a newly defined independent criticality measure (required deceleration ax) was incorporated. The selection of this metric was justified because the established metrics, such as time to collision or time headway, do not account for criticality in longitudinal and lateral direction. The critical deceleration metric is defined as the required mean deceleration for the VuT necessary to overcome the negative relative velocity with the challenging cut-in vehicle and to achieve a longitudinal distance > 10 m, before the end of the cut-in scenario.
Hence, a simulation framework is established, where the generated cut-in test cases are re-modelled by applying their generated characteristic parameter values.
To calculate the required deceleration of the VuT for a scenario, the scenario is re-modelled in simulation, according to its specified parameter characteristics. The following assumptions apply: the cut-in object is assumed to be detected by the VuT as soon as the object’s left side crosses the left lane marking.
The movement of the VuT is characterised by the initial velocity from the test case, influenced by the initial acceleration value model. The cut-in object is initially positioned and parametrized according to the initial longitudinal and lateral distance, as well as the initial velocity in the test case. The object’s acceleration is modelled as a mean value over the lane change maneuver. The lateral movement for the lane change is abstracted as a second-degree polynomial function of the lateral velocity with a maximum according to the maximum lateral velocity in the test case. As the test cases were assessed in a simplified simulation environment, not the absolute but the relative values were relevant for evaluation purposes.
Figure 3b shows the comparison of the VuT’s required deceleration values between the original scenario database and the severity and exposure test cases, respectively. Even with an independently designed criticality measure, the severity test suite incorporated significantly higher risk, interpreted as higher required deceleration for the VuT than the original database. Only a few test cases show a comparable criticality to the original data. For the exposure test suite, a risk evaluation that was similar to the original scenario data can be observed.

4.2. Evaluation of Coverage of Severity and Exposure Test Suites

To evaluate how well the generated severity and exposure test suites cover the parameter values from the dataset, the coverage ratio between each parameter value range (in each test suite) and the corresponding parameter value range (from the fitted distribution of the underlying dataset) were calculated. Therefore, the parameters’ value ranges in the test cases were compared against their 0.1 to 99.9 percentile of the belonging fitted distribution. Table 6 summarizes the coverage ratios for each parameter. The values for the parameters set by regression models are denoted in brackets, as the use of a regression model highly restricts the achievable coverage of a parameter’s range.
For the exposure test cases, the independent parameters ax,VuT, vy,chall, and ax,chall were perfectly covered (100%) by the generated test suite. For the two dependent parameters, vx,VuT and vx,chall, the coverage was lower, with 46.0% and 37.5%, respectively. The coverage of dx was slightly lower than for the other independent parameter, due to its appearance in the regression models. In this specific case, it led to the shortage of the influencing parameter’s value range. For the severity test cases, comparatively, low coverage ratio values were obtained, ranging from 30.5%% for vx,chall to 98.2% for ax,chall.

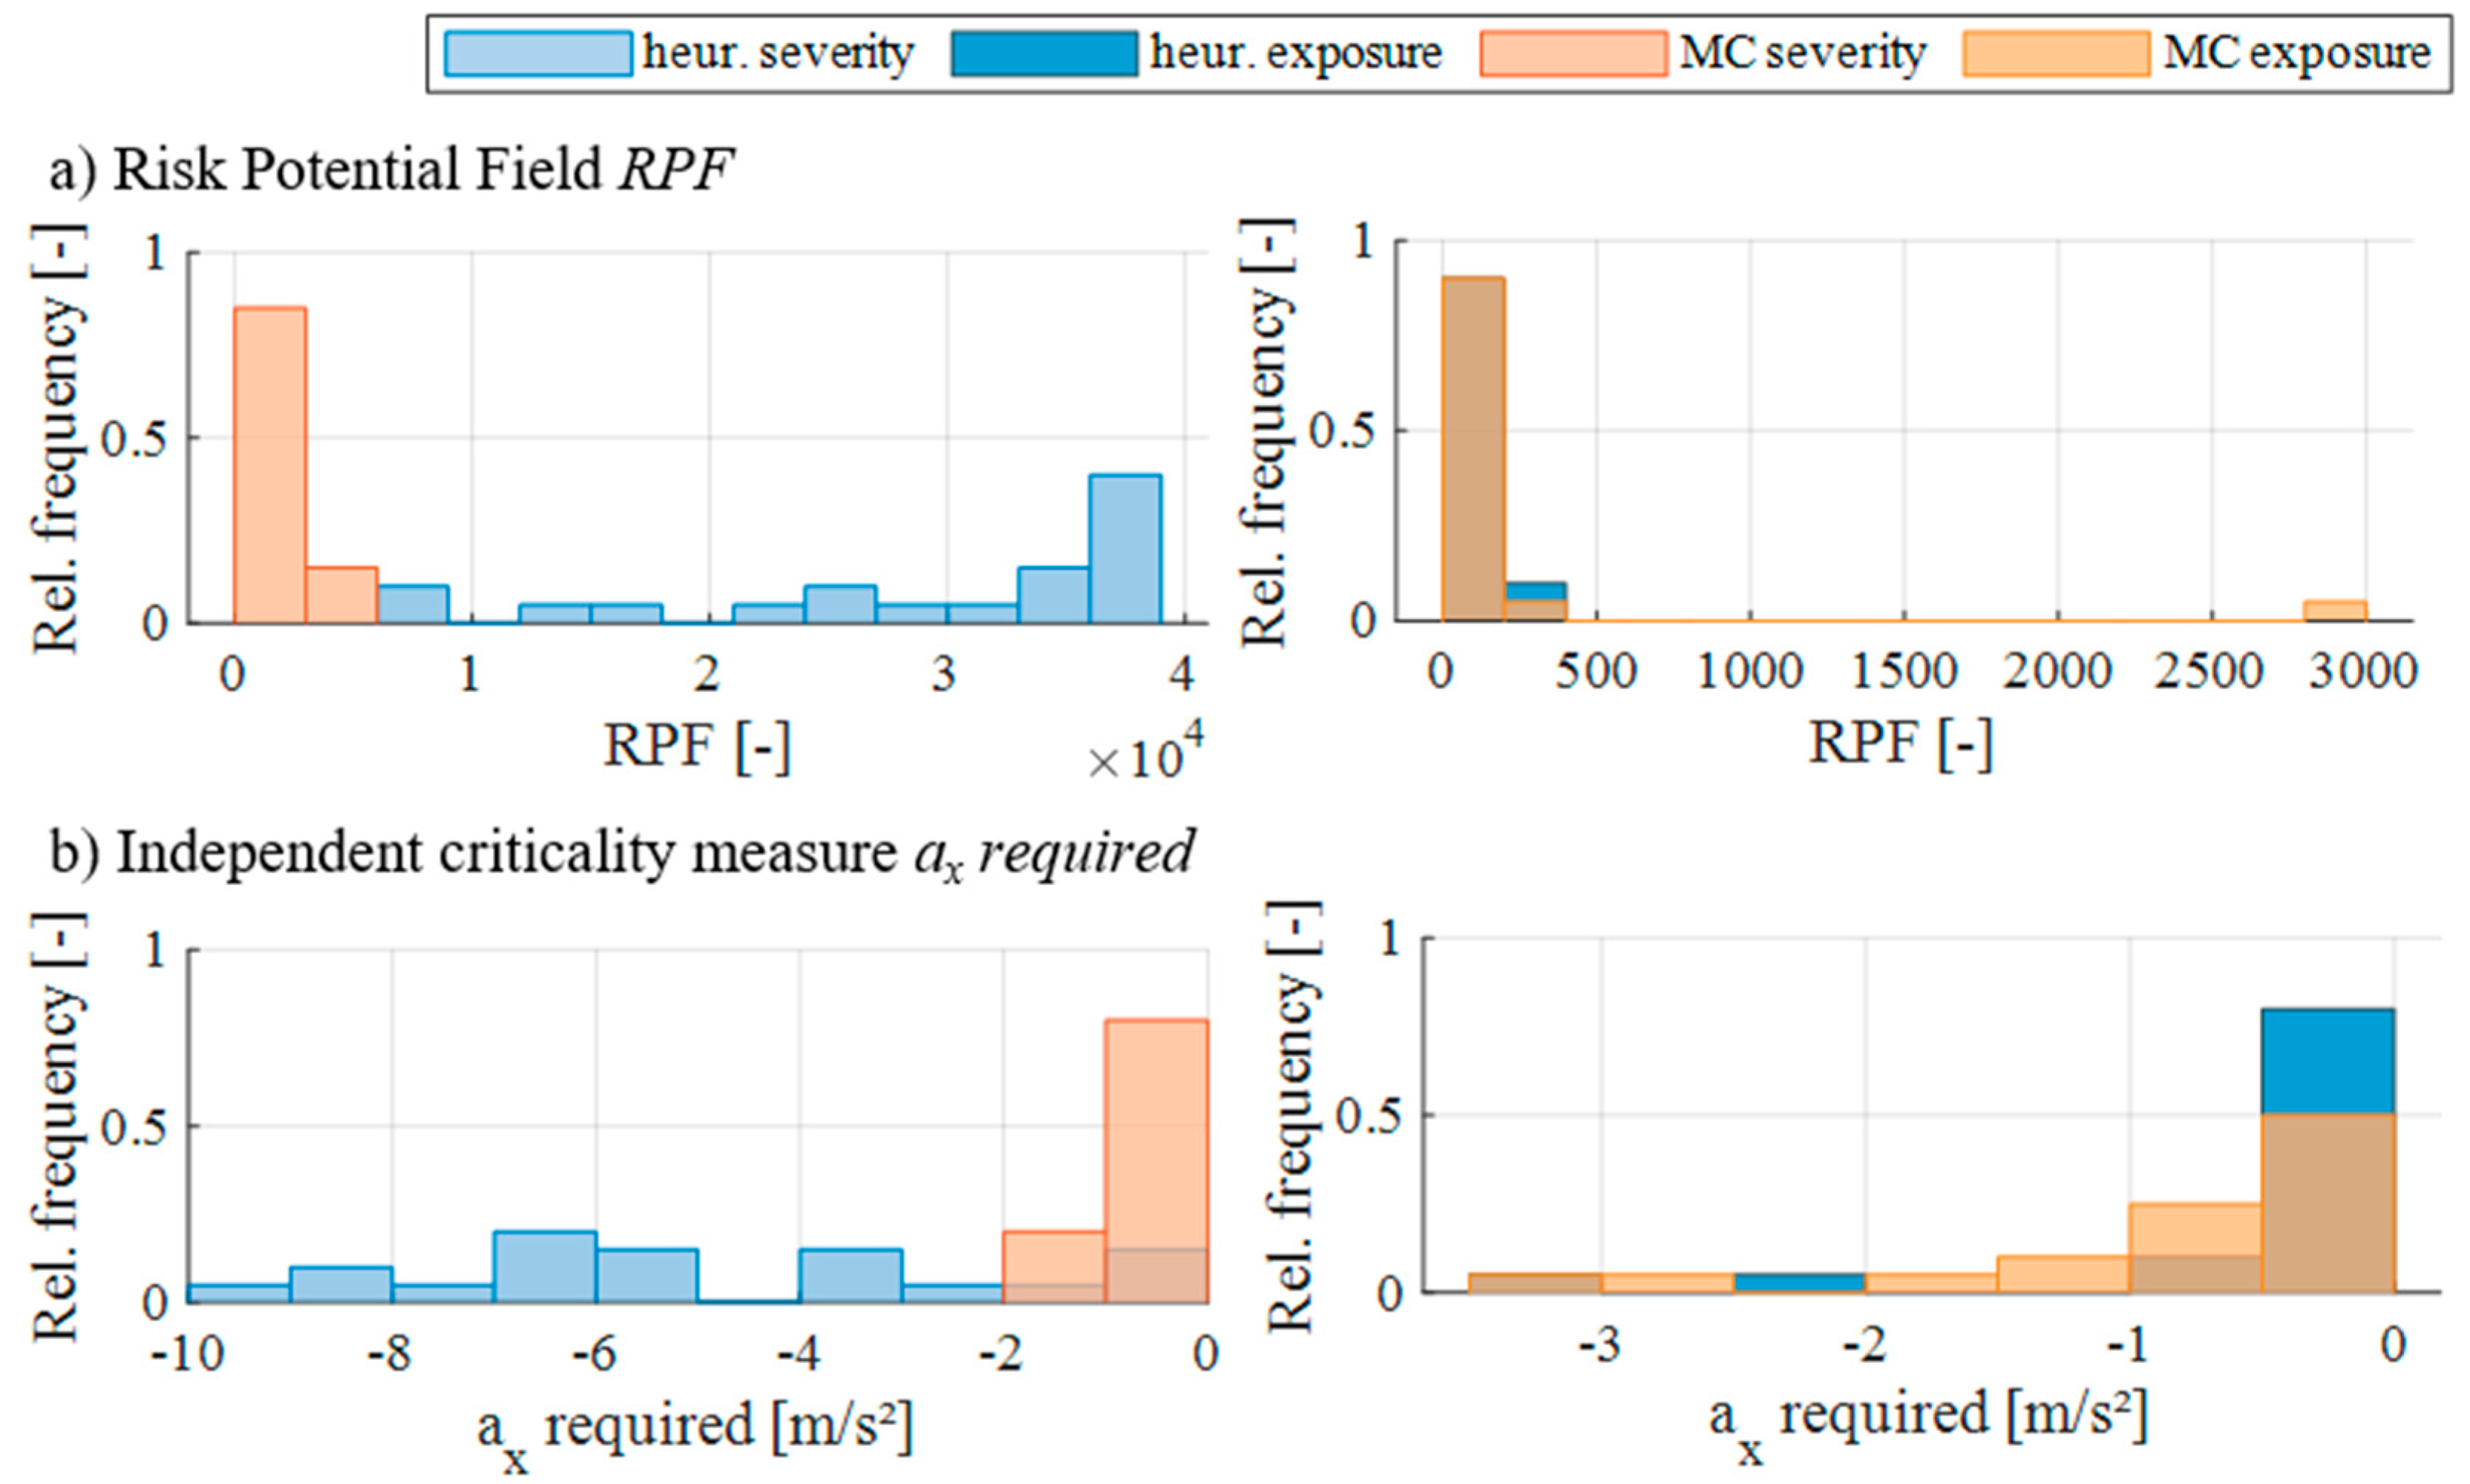
4.3. Comparison to Monte Carlo-Based Test Case Generation

In this sub-chapter, a Monte Carlo-based test case generation was applied to the cut-in dataset, to enable an additional evaluation of the methodology proposed in the current paper, by comparing with a methodology typically applied to generate test cases in the field. As indicated in related work, no method is available which accounts for both multi-dimensional parameter dependencies and objective functions. A Monte Carlo simulation, which considers multi-dimensional dependencies, shows to be a suitable comparison method in terms of replicability and comparability.
To ensure the comparability, the data subsets for severity and exposure (see Section 2.2) were reused, resulting in one test suite for severity and one test suite for exposure. First, the parameters were fitted to distributions independently for each subset, as follows: independent parameters were approximated by a normal distribution. These were ax,VuT, vy,chall, and ax,chall for the severe data subset and ax,VuT, vy,chall, and dx for the normal driving subset. The two dependent parameters, both times vx,VuT, vx,chall, and dx, were fitted with a multivariate Gaussian distribution. Thereby, the parameter dependencies were incorporated, which accounts for the comparability of the methodologies.
Second, sampling was applied by generating randomized values or pairs of values, respectively, from the parameter distributions of each scenario subset and assigning them to the test cases.
The number of test cases for each test suite was limited to the size of the heuristics test suites. The generated test suites for severity and exposure of the Monte Carlo simulation are provided in the Appendix A Table A1.
In the following, the same evaluation methods as in section A and B were applied by comparing the heuristics test suites with the Monte Carlo test suites. For criticality, the test suites were assessed by their RPF values and the introduced independent criticality metric required deceleration, ax, in Figure 4.
For both criticality metrics, the heuristics severity test suites showed significantly higher incorporated criticality than the generated Monte Carlo severity test suite. For exposure, a comparable distribution of the RPF values and ax required can be observed for the heuristics and the Monte Carlo test suites. While the heuristics aims to find different test cases (by newness evaluation), the Monte Carlo methodology is more focused on the frequency of occurrence. Therefore, the corner-cases tends to be neglected by the native Monte Carlo sampling.
Regarding coverage, Table 7 presents the coverage rations for the Monte Carlo test suites of severity and exposure. The comparison with the coverage results of the heuristics test suites reveals a slightly higher parameter coverage for the severe Monte Carlo test suite, in comparison to the severe heuristics test suite. A contrary tendency becomes visible for the exposure test cases with a higher coverage of the exposure heuristics test suite.

5. Discussion

5.1. Efficiency of the Test Case Generation Process

The heuristics approach, applied to the cut-in dataset, proved valid and efficient to identify both severe and normal driving test cases (Table 5).
The required computational power can be considered low, as it took less than 30 min run time on an Intel Dual-Core i5-7200u with 8 GB RAM to generate the test cases, starting from the original data set. Nevertheless, the algorithm was more efficient in identifying severe cases than normal driving cases. Specifically, the majority of severity test cases were determined within 20 iterations, whereas many of the exposure test cases reached the pre-set maximum number of 100 iterations. This difference can be explained by the difference between parameter spaces and objective functions (applied to define both test suites). The severe data subset was limited to narrow parameter ranges that tend to concentrate in the vicinity of parameter range edges. In addition, the objective function, applied to the severe data subset and based on RPF, imposed a restrictive combination of parameter values (e.g., short distances and high lateral velocity). In contrast, the normal driving data subset tended to cover wider parameter ranges, and the restrictions imposed by the newness value were looser than for the RPF. When the proposed methodology is further developed and applied to larger sets and more complex scenarios, the balance between size of the data set, the number test case candidates generated, and the pre-set maximum number of iterations need to be further evaluated.

5.2. Results from the Criticality Assessment

The criticality evaluation of the heuristics test suites based on RPF (Figure 3a) indicated the correct application of the test case generation process on the prototypical dataset, as the severity test cases were at the edge of the dataset’s RPF distribution. The 10% threshold was set as a trade-off between the relatively small overall data base and the sample size requirements, in order to enable statistically significant results. However, the incorporation of an independent criticality metric highlights both the potential of the methodology proposed and the importance of criticality metrics. Even with the independent criticality measure, the severity test cases showed significantly higher criticality values. However, there seemed to be, on the one hand, test case that incorporated a comparable, low criticality, similar to the original dataset. On the other hand, a few test cases showed extremely high incorporated risk with the required deceleration values > 10 m/s2. Moreover, the severity test cases, indicated in Table 5, show that comparably similar test cases were created with high lateral velocity vy,chall and low cut-in distances dx but only small relative velocities. Previous studies, e.g., [26], showed that high criticality is also connected to high relative velocities, in relation to greater cut-in distances, which is not properly included in the RPF criticality metric. Furthermore, the test cases toward severity show a certain convergence towards low longitudinal distances and similar longitudinal velocities. This highlights the relevance of well-suited criticality metrics to the test case generation process, which represented the risk sustained by VuT’s as realistically as possible. This is equally valid for the scenario data division into the severe and normal driving subset, based on the 10% highest RPF values. As soon as an internationally accepted criticality measure are available, the threshold should be set to a finite value, in order to be independent from the dataset.
Nonetheless, setting a definite threshold can lead to further challenges, regarding measurement errors of parameters or the handling of scenarios, from naturalistic driving data that are below the criticality threshold but are still somewhat nearly severe. Accordingly, the evaluation of the possible incorporation of an enlarged parameter band, instead of one concrete value or threshold for the data split, remains for future work.

5.3. Results from the Coverage Assessment

The coverage evaluation confirms a good coverage of the exposure data and an expected limited coverage of the critical test cases. Furthermore, as all coverage values were lower than 100%, the used distribution functions were suitable. The comparably low coverage ratio values of the exposure test suite for vx,VuT and vx,chall (Table 6) can be explained by the relatively low R2-value (0.79 and 0.86) of the associated regression models (Table 4). Although the regression models were valid, according to the set rules, the value range of the parameter was not entirely explained by the regression model, resulting in the reduced applied parameter range. This leads to a trade-off between the consideration of even lower dependencies and the maximisation of the parameter coverage. Another trade-off, regarding coverage, becomes visible for the set minimum newness threshold for severe test cases. A high threshold value leads to a higher coverage but a lower criticality performance of the resulting test cases. Both trade-offs are part of future work.
Independent from the concrete results, the proposed exposure evaluation, by means of relative newness, provides the following advantages: first, each parameter is treated equally for the newness evaluation. Second, the ratio to the actual value range of a parameter ensures comparability through different data sets. Third, the holistic comparison of a test case candidate with all prior assigned test cases avoids the assignment of similar test cases that increases the variety of the test cases assigned.

5.4. Results from the Comparison with Monte Carlo Sampling

With the comparison to the Monte Carlo sampling, the explicit advantages of the methodology became visible. Although the Monte Carlo simulation was executed with the two data subsets for severity and normal driving, the method was not able to create test cases beyond the criticality of the original dataset. More critical test cases might be generated when extending the size of the test suite, going along with an increase in computational time, or including the mentioned importance-based sampling techniques, as in [27]. However, to the best of our knowledge, no work is available that connects importance-based sampling and multi-dimensional dependencies, as in our proposed methodology. Regarding the results for coverage, the indicated coverage ratios for the Monte Carlo test suites underline the importance of suitable distribution functions. Therefore, for scenario-related parameter ranges, the proposed univariate generalized extreme value distribution, which considers both skewness and sharpness, can be recommended.

5.5. General Implications of the Methodology

In general, the methodology proposed in this study relies on the existence of a data set, upon which, by generating two different test suites, can provide an acceptable coverage of both severity and exposure. The most basic underlying assumption of the methodology is that there will be a data set available that is representative of the scenarios that need to be covered to ensure safety of a different automated driving systems. This assumption is feasible for relatively simple scenarios, such as the cut-in involving only two vehicles applied in the current study. However, as the field evolves towards more complex scenarios that incorporate road geometry, several traffic participants, and urban environments, the requirements for naturalistic traffic data will boost. Therefore, the presented methodology might need to be enhanced by the incorporation of discrete parameters. This highlights the need for international collaborative efforts to continue developing safety assurance methodologies and to share data for automated driving safety evaluation purposes.

6. Conclusions

This study proposes a novel methodology to generate scenario-specific test suites that account for realism, severity, and exposure requirements. Based on two scenario subsets (one covering severe conditions and one covering normal driving), the scenario parameters were abstracted by distribution functions and regression models. Thereafter, test cases were generated by optimizing the objective functions for severity and exposure, while considering the identified data patterns. The severity and the exposure were optimized by the risk potential field, as well as by a newly proposed newness criterion, respectively. To our best knowledge, the methodology proposed was unique in considering both multi-dimensional parameter dependencies and optimization by an objective function.
The applicability of the proposed methodology was demonstrated by applying it to generated test cases for cut-in scenarios from a naturalistic driving data set collected on German highways. The generated test cases reflect the real traffic data patterns and successfully discriminate between safety critical and normal driving scenarios. The applicability of the methodology to larger data sets and different scenarios remains as future work.

Author Contributions

L.S. led the conceptualization, methodology, software development, data analysis, and validation; S.T. led the evaluation section and provided constant support and guidance throughout the study; L.S. led the preparation of the original draft; S.T. and J.A.-M. actively contributed to the writing, reviewing, and editing of the manuscript; R.H., H.N., J.A.-M. and N.U. supervised the study and administered the funding acquisition and the project; P.R. provided scientific advice and contextualization. All authors have read and agreed to the published version of the manuscript.

Funding

Parts of this research have been funded by the Ministry of Economy, Trade and Industry of Japan, under the SAKURA project.

Institutional Review Board Statement

Not applicable.

Informed Consent Statement

Not applicable.

Data Availability Statement

Not applicable.

Acknowledgments

The Ministry of Economy, Trade and Industry of Japan is acknowledged for supporting this research.

Conflicts of Interest

The authors declare no conflict of interest. The funders had no role in the design of the study; in the collection, analyses, or interpretation of data; in the writing of the manuscript, or in the decision to publish the results.

Appendix A

Table A1. Monte Carlo-based test cases.
Test Case No.vx,VuT
[km/h]
ax,VuT
[m/s2]
vx,chall [km/h]vy,chall
[m/s]
ax,chall
[m/s2]
dx
[m]
Severity Test Cases
186.9−0.680.01.1−0.321.8
281.10.076.11.20.125.6
3100.2−0.591.60.90.611.3
498.00.592.21.1−0.213.4
5100.50.190.31.10.024.3
696.80.688.70.50.710.4
7122.50.7110.40.60.414.6
888.8−0.182.71.00.810.2
995.6−0.385.50.7−0.117.5
10110.40.1101.71.40.618.2
11101.60.892.61.10.416.0
12113.7−1.2109.91.0−0.318.3
13132.1−0.3125.01.20.615.8
14114.40.0102.00.50.416.0
1587.30.076.91.30.215.1
16110.8−1.9117.41.1−0.615.0
1790.2−0.680.10.80.021.1
1885.5−0.681.91.20.816.3
19106.8−0.7109.20.70.415.0
20126.3−0.4125.80.60.412.7
Exposure Test Cases (Normal driving)
1111.2−1.2111.50.70.054.5
2104.6−0.1107.10.60.430.3
3118.60.1101.51.20.432.7
4135.90.0120.60.90.251.5
595.3−0.873.01.2−0.452.0
6113.9−0.1106.21.20.024.0
7143.0−1.0140.61.00.633.5
8127.8−0.6123.70.9−0.361.0
9128.90.2125.11.20.162.8
10116.90.2118.71.00.257.0
11134.60.0125.10.90.136.5
12105.91.290.60.80.265.5
13114.1−1.095.40.4−0.232.3
14128.80.5107.30.80.230.7
15140.50.7137.20.50.559.3
16135.70.1121.80.60.335.0
17134.90.5102.51.20.348.7
18137.2−0.8127.70.50.064.3
19114.70.7117.01.00.370.1
20102.00.995.51.00.612.4

References

  1. Andreas, P.; Adrian, Z.; Jörg, K.; Julian, B.; Lutz, E. Database Approach for the Sign-Off Process of Highly Automated Vehicles. In 25th International Technical Conference on the Enhanced Safety of Vehicles (ESV), Detroit, MI, USA, 5–8 June 2017; National Highway Traffic Safety Administration: Washington, DC, USA, 2017. [Google Scholar]
  2. Steimle, M.; Bagschik, G.; Menzel, T.; Wendler, J.T.; Maurer, M. Ein Beitrag zur Terminologie für den szenarienbasierten Testansatz automatisierter Fahrfunktionen. In Proceedings of the AAET-Automatisiertes und vernetztes Fahren: Beiträge zum gleichnamigen 19, Stadthalle, Braunschweig, Germany, 14–15 March 2018; ITS Mobility e.V.: Braunschweig, Germany, 2018; pp. 10–32, ISBN 978-3-937655-44-4.
  3. PEGASUS. Pegasus Method: An Overview, Ehra-Lessien. 2019. Available online: https://www.pegasusprojekt.de/files/tmpl/Pegasus-Abschlussveranstaltung/PEGASUS-Gesamtmethode.pdf (accessed on 21 May 2019).
  4. Uchimura, T. Connected and Automated Driving Project in Japan “SIP-adus”. In PEGASUS Symposium, Aachen, Germany, 9th November 2017; Deutsches Zentrum für Luft- und Raumfahrt e. V.: Cologne, Germany, 2017. [Google Scholar]
  5. Antona-Makoshi, J.; Uchida, N.; Imanaga, H.; Kitajima, S.; Taniguchi, S.; Ozawa, K.; Kitahara, E. Towards global AD safety assurance. In 2019 Automated Vehicles Symposium, Orlando, FL, USA, 19 July 2017; Association for Unmanned Systems International (AUVSI): Arlington, VA, USA; Transportation Research Board (TRB): Washington, DC, USA, 2017. [Google Scholar]
  6. Taniguchi, S. Safety Validation Investigation in Japan: AVS Breakout Session, 18 July 2018; Japan Automobile Manufacturers Association (JAMA): Tokyo, Japan, 2018. [Google Scholar]
  7. Znamiec, H. Methodik zur Gesamtsystemerprobung für das hochautomatisierte Fahren. In Ko-HAF Zwischenpräsentation, Aschaffenburg, 18 May 2017; Projektträger Mobilität und Verkehrstechnologien: Cologne, Germany, 2017. [Google Scholar]
  8. Znamiec, H.; Rauber, B.; Henze, R. Prozesse zur Qualifikationsprüfung automatisierter Fahrfunktionen. In Proceedings of the AAET Automatisiertes und Vernetzes Fahren: Beiträge zum gleichnamigen 20, Stadthalle, Braunschweig, Germany, 6–7 February 2019; pp. 330–346. [Google Scholar]
  9. Transport Systems Catapult. Taxonomy of Scenarios for Automated Driving, Milton Keynes, UK, 2017. Available online: https://s3-eu-west-1.amazonaws.com/media.ts.catapult/wp-content/uploads/2017/04/25114137/ATS34-Taxonomy-of-Scenarios-for-Automated-Driving.pdf (accessed on 20 November 2019).
  10. Elrofai, H.; Paardekooper, J.-P.; de Gelder, E.; Kalisvaart, S.; Op den Camp, O. StreetWise: Scenario-Based Safety Validation of Connected and Automated Driving; TNO: Helmond, The Netherlands, 2018. [Google Scholar]
  11. Schuldt, F.; Reschka, A.; Maurer, M. A Method for an Efficient, Systematic Test Case Generation for Advanced Driver Assistance Systems in Virtual Environments. In Automotive Systems Engineering II; Winner, H., Prokop, G., Maurer, M., Eds.; Springer International Publishing: Cham, Switzerland, 2018; pp. 147–175. ISBN 978-3-319-61607-0. [Google Scholar]
  12. Winner, H.; Chan, C.-Y. Safety Assurance for Automated Vehicles. In Road Vehicle Automation 4; Meyer, G., Beiker, S., Eds.; Springer International Publishing: Cham, Switzerland, 2018; pp. 165–175. ISBN 978-3-319-60934-8. [Google Scholar]
  13. Cohen, D.M.; Dalal, S.R.; Fredman, M.L.; Patton, G.C. The AETG system: An approach to testing based on combinatorial design. IIEEE Trans. Softw. Eng. 1997, 23, 437–444. [Google Scholar] [CrossRef] [Green Version]
  14. Anand, S.; Burke, E.K.; Chen, T.Y.; Clark, J.; Cohen, M.B.; Grieskamp, W.; Harman, M.; Harrold, M.J.; McMinn, P.; Bertolino, A.; et al. An orchestrated survey of methodologies for automated software test case generation. J. Syst. Softw. 2013, 86, 1978–2001. [Google Scholar] [CrossRef]
  15. Cohen, M.B.; Colbourn, C.J.; Gibbons, P.B.; Mudgrdge, W.B. Constructing Test Suites for Interaction Testing. In Proceedings of the 25th International Conference on Software Engineering, Portland, OR, USA, 3–10 May 2003; IEEE Computer Society: Washington, DC, USA, 2003. ISBN 076951877X. [Google Scholar]
  16. Kuhn, R. Introduction to Combinatorial Testing; Carnegie-Mellon University: Pittsburgh, PA, USA, 2011. [Google Scholar]
  17. Katzourakis, D.; de Winter, J.C.; de Groot, S.; Happee, R. Driving simulator parameterization using double-lane change steering metrics as recorded on five modern cars. Simul. Model. Pract. Theory 2012, 26, 96–112. [Google Scholar] [CrossRef]
  18. Ali, S.; Briand, L.C.; Hemmati, H.; Panesar-Walawege, R.K. A Systematic Review of the Application and Empirical Investigation of Search-Based Test Case Generation. IEEE Trans. Softw. Eng. 2010, 36, 742–762. [Google Scholar] [CrossRef] [Green Version]
  19. Tung, Y.-W.; Aldiwan, W.S. Automating test case generation for the new generation mission software system. In Proceedings of the 2000 IEEE Aerospace Conference Proceedings, Big Sky, MT, USA, 18–25 March 2000; IEEE: Piscataway, NJ, USA, 2000; pp. 431–437, ISBN 0-7803-5846-5. [Google Scholar]
  20. Hauer, F.; Gerostathopoulos, I.; Schmidt, T.; Pretschner, A. Clustering Traffic Scenarios Using Mental Models as Little as Possible. In Proceedings of the 2020 IEEE Intelligent Vehicles Symposium (IV), Las Vegas, NV, USA, 19 October–13 November 2020; IEEE: Piscataway, NJ, USA, 2020; pp. 1007–1012, ISBN 978-1-7281-6673-5. [Google Scholar]
  21. Zhao, J.; Fang, J.; Ye, Z.; Zhang, L. Large Scale Autonomous Driving Scenarios Clustering with Self-Supervised Feature Extraction. 2021. Available online: http://arxiv.org/pdf/2103.16101v1 (accessed on 6 June 2021).
  22. Wang, W.; Zhang, W.; Zhu, J.; Zhao, D. Understanding V2V Driving Scenarios Through Traffic Primitives. IEEE Trans. Intell. Transport. Syst. 2020, 1–10. [Google Scholar] [CrossRef]
  23. Ding, W.; Xu, M.; Zhao, D. CMTS: A Conditional Multiple Trajectory Synthesizer for Generating Safety-Critical Driving Scenarios. In Proceedings of the 2020 IEEE International Conference on Robotics and Automation (ICRA), Paris, France, 31 May–31 August 2020; IEEE: Piscataway, NJ, USA; pp. 4314–4321, ISBN 978-1-7281-7395-5. [Google Scholar]
  24. Zhou, J.; del Re, L. Identification of critical cases of ADAS safety by FOT based parameterization of a catalogue. In Proceedings of the 2017 Asian Control Conference Gold Coast, Australia, Gold Coast, QLD, Australia, 17–20 December 2017; IEEE: Piscataway, NJ, USA, 2017; pp. 453–458, ISBN 978-1-5090-1573-3. [Google Scholar]
  25. Winner, H.; Wachenfeld, W.; Junietz, P. Validation and Introduction of Automated Driving. In Automotive Systems Engineering II; Winner, H., Prokop, G., Maurer, M., Eds.; Springer International Publishing: Cham, Switzerland, 2018; pp. 177–196. ISBN 978-3-319-61607-0. [Google Scholar]
  26. Thal, S.; Znamiec, H.; Henze, R.; Nakamura, H.; Imanaga, H.; Antona-Makoshi, J.; Uchida, N.; Taniguchi, S. Incorporating safety relevance and realistic parameter combinations in test-case generation for automated driving safety assessment. In Proceedings of the 2020 IEEE 23rd International Conference on Intelligent Transportation Systems (ITSC), Rhodes, Greece, 20–23 September 2020; IEEE: Piscataway, NJ, USA, 2020; pp. 1–6. [Google Scholar]
  27. Zhao, D.; Lam, H.; Peng, H.; Bao, S.; LeBlanc, D.J.; Nobukawa, K.; Pan, C.S. Accelerated Evaluation of Automated Vehicles Safety in Lane-Change Scenarios Based on Importance Sampling Techniques. IEEE Trans. Intell. Transport. Syst. 2017, 18, 595–607. [Google Scholar] [CrossRef] [Green Version]
  28. Akagi, Y.; Kato, R.; Kitajima, S.; Antona-Makoshi, J.; Uchida, N. A Risk-index based Sampling Method to Generate Scenarios for the Evaluation of Automated Driving Vehicle Safety. In Proceedings of the 2019 IEEE Intelligent Transportation Systems Conference (ITSC), Auckland, New Zealand, 27–30 October 2019; IEEE: Piscataway, NJ, USA, 2019; pp. 667–672, ISBN 978-1-5386-7024-8. [Google Scholar]
  29. Calo, A.; Arcaini, P.; Ali, S.; Hauer, F.; Ishikawa, F. Generating Avoidable Collision Scenarios for Testing Autonomous Driving Systems. In Proceedings of the 2020 IEEE 13th International Conference on Software Testing, Validation and Verification (ICST), Porto, Portugal, 24–28 October 2020; IEEE: Piscataway, NJ, USA, 2020; pp. 375–386, ISBN 978-1-7281-5778-8. [Google Scholar]
  30. Calò, A.; Arcaini, P.; Ali, S.; Hauer, F.; Ishikawa, F. Simultaneously searching and solving multiple avoidable collisions for testing autonomous driving systems. In Proceedings of the 2020 Genetic and Evolutionary Computation Conference, Cancún, Mexico, 8–12 July 2020; Coello, C.C.A., Ed.; ACM: New York, NY, USA, 2020; pp. 1055–1063, ISBN 9781450371285. [Google Scholar]
  31. Beglerovic, H.; Stolz, M.; Horn, M. Testing of autonomous vehicles using surrogate models and stochastic optimization. In Proceedings of the IEEE ITSC 2017, 20th International Conference on Intelligent Transportation Systems: Mielparque Yokohama in Yokohama, Kanagawa, Japan, 16–19 October 2017; IEEE: Piscataway, NJ, USA, 2017; pp. 1–6, ISBN 978-1-5386-1526-3. [Google Scholar]
  32. Ben Abdessalem, R.; Nejati, S.; Briand, L.C.; Stifter, T. Testing advanced driver assistance systems using multi-objective search and neural networks. In Proceedings of the 31st IEEE/ACM International Conference on Automated Software Engineering, Singapore, 3–7 September 2016; Lo, D., Apel, S., Khurshid, S., Eds.; ACM: New York, NY, USA, 2016; pp. 63–74, ISBN 9781450338455. [Google Scholar]
  33. Feng, S.; Feng, Y.; Yu, C.; Zhang, Y.; Liu, H.X. Testing Scenario Library Generation for Connected and Automated Vehicles, Part I: Methodology. IEEE Trans. Intell. Transport. Syst. 2020, 22, 1573–1582. [Google Scholar] [CrossRef] [Green Version]
  34. Akagi, Y.; Raksincharoensak, P. Longitudinal and lateral motion planning method for avoidance of multi-obstacles in urban environments based on inverse collision probability. In Proceedings of the 2016 IEEE Intelligent Vehicles Symposium (IV), Gothenburg, Sweden, 19–22 June 2016; IEEE: Piscataway, NJ, USA, 2016; pp. 827–832, ISBN 978-1-5090-1821-5. [Google Scholar]
  35. Sato, D.; Nunobiki, E.; Inoue, S.; Raksincharoensak, P. Motion Planning and Control in Highway Merging Maneuver Based on Dynamic Risk Potential Optimization. In Proceedings of the 5th International Symposium on Future Active Safety Technology toward Zero Accidents (FAST-zero ‘19), Blacksburg, VA, USA, 9–11 September 2019. [Google Scholar]
  36. Weber, H.; Bock, J.; Klimke, J.; Roesener, C.; Hiller, J.; Krajewski, R.; Zlocki, A.; Eckstein, L. A framework for definition of logical scenarios for safety assurance of automated driving. Traffic Inj. Prev. 2019, 20, S65–S70. [Google Scholar] [CrossRef] [PubMed] [Green Version]
  37. Osterwald-Lenum, M. A Note with Quantiles of the Asymptotic Distribution of the Maximum Likelihood Cointegration Rank Test Statistics1. Oxf. Bull. Econ. Stat. 1992, 54, 461–472. [Google Scholar] [CrossRef]
  38. Eick, C.F.; Parmar, R.; Ding, W.; Stepinski, T.F.; Nicot, J.-P. Finding regional co-location patterns for sets of continuous variables in spatial datasets. In Proceedings of the 16th ACM SIGSPATIAL International Conference on Advances in Geographic Information Systems 2008 (ACM GIS 2008), Irvine, CA, USA, 5–7 November 2008; Aref, W.G., Mokbel, M.F., Schneider, M., Eds.; Curran: Red Hook, NY, USA, 2009; p. 1, ISBN 9781605583235. [Google Scholar]
  39. Sonka, A.; Krauns, F.; Henze, R.; Kucukay, F.; Katz, R.; Lages, U. Dual approach for maneuver classification in vehicle environment data. In Proceedings of the 28th IEEE Intelligent Vehicles Symposium, Redondo Beach, CA, USA, 11–14 June 2017; IEEE: Piscataway, NJ, USA, 2017; pp. 97–102, ISBN 978-1-5090-4804-5. [Google Scholar]
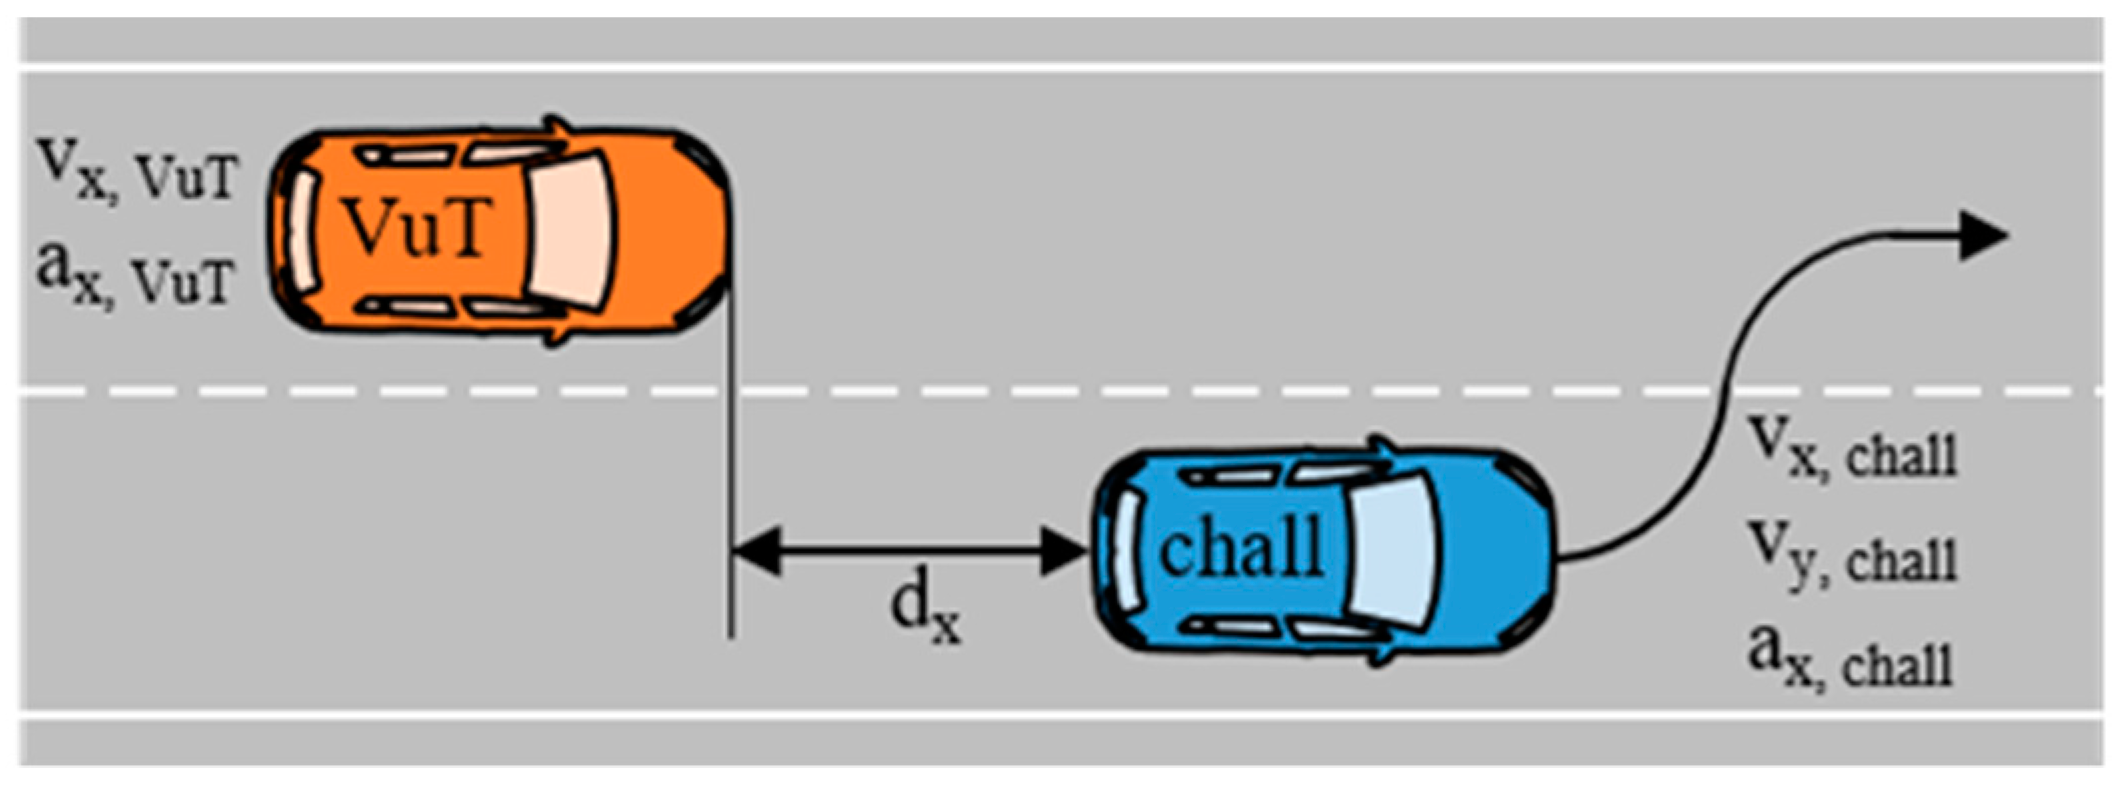
Figure 1. Procedure to assign a severity test case to the final test suite.
Applsci 11 10166 g001
Figure 2. Cut-in scenario schematic (including relevant parameters considered).
Applsci 11 10166 g002
Figure 3. Results of criticality evaluation for severity test suite (left column) and exposure test suite (right column), based on two different criticality measures: risk potential field (a) and required VuT deceleration (b).
Applsci 11 10166 g003
Figure 4. Results of criticality evaluation for severity test suite (left column) and exposure test suite (right column) of the heuristics (heur.), in comparison to the Monte Carlo (MC) simulation results, based on two different criticality measures: risk potential field (a) and required VuT deceleration (b).
Applsci 11 10166 g004
Table 1. Cut-in scenario parameters.
Vehicle under Test (VuT)Challenging Vehicle (Chall)Interaction Parameters
vx (initial value)vx (initial value)Longitudinal distance dx
ax (initial value)vy (max. value)(initial value)
ax (mean value)
Table 2. Fitted distributions for severe data subset (based on 229 cut-in scenarios).
Parameter NameUnitμσk
vx,VuTkm/h98.214.10.0
ax,VuTm/s2−0.40.6−0.3
vx,challkm/h95.916.3−0.2
vy,challm/s0.90.3−0.1
ax,challm/s200.4−0.2
dxm14.44.8−0.3
Table 3. Fitted distributions for exposure data subset (based on 2065 cut-in scenarios).
Parameter NameUnitμσk
vx,VuTkm/h116.717.6−0.5
ax,VuTm/s2−0.30.5−0.2
vx,challkm/h103.817.3−0.3
vy,challm/s0.70.20.0
ax,challm/s20.10.4−0.2
dxm47.118.2−0.3
Table 4. Relevant regression models from severe and exposure data subsets.
Dependent
Parameter
R2Constant TermInfluencing
Parameter 1
Influencing
Parameter 2
Severe data set (based on 229 cut-in scenarios)
vx,VuT0.9520.20vx,chall (0.92)
vx,chall0.9150.20vx,VuT (0.91)
Normal driving data set (based on 2068 cut-in scenarios)
vx,VuT0.7900.33ax,VuT (−0.25)vx,chall (0.77)
vx,chall0.8570.33vx,VuT (0.84)ax,VuT (0.23)
Table 5. Generated severity and exposure test cases.
Test Case No.vx,VuT
[km/h]
ax,VuT
[m/s2]
vx,chall [km/h]vy,chall
[m/s]
ax,chall
[m/s2]
dx
[m]
Severity Test Cases
1144.80.0143.92.20.02.1
2136.9−0.5136.42.20.72.1
3140.0−1.6139.42.20.12.1
4139.0−0.3138.42.2−1.02.1
5130.80.0130.52.10.35.5
6118.10.0118.52.20.87.7
7124.1−0.8124.22.20.13.4
8139.61.5139.02.20.02.8
9121.00.2121.21.60.25.1
10120.20.0120.52.2−0.62.1
11120.6−0.8120.81.4−0.23.5
12144.31.5143.52.21.22.1
13136.50.6136.02.2−0.65.0
14113.7−0.3114.32.1−0.16.2
15124.70.9127.72.20.38.4
16144.20.0143.32.21.62.1
17144.6−1.7143.72.21.32.1
18116.4−0.2116.81.30.19.9
19131.00.7130.82.21.02.3
20112.3−0.1112.91.90.313.0
Exposure Test Cases (Normal driving)
1146.70.0139.40.20.019.5
2137.31.5144.32.21.5101.5
3144.5−1.7116.31.40.2101.5
4130.80.4122.41.11.447.8
5149.7−1.0133.32.20.829.7
6136.60.8135.90.60.3101.5
7137.80.2129.52.00.478.7
8149.7−1.7127.70.31.536.7
9135.91.5142.51.4−0.839.1
10117.91.4117.01.50.964.6
11140.11.5148.10.51.030.8
12123.81.0120.72.10.339.0
13149.7−0.9134.70.90.364.4
14142.30.6140.51.50.525.9
15129.91.5134.40.3−0.254.3
16122.50.6114.22.01.393.7
17148.3−0.3137.80.50.148.8
18147.9−0.4136.01.41.595.8
19144.60.3140.10.21.378.0
20139.71.1143.61.31.079.6
Table 6. Coverage ratios of severity and exposure test suites.
vx,VuTax,VuTvx,challvy,challax,challdx
Severity test cases
[46.8%]93.5%[30.5%]43.1%98.2%41.5%
Exposure test cases (Normal driving)
[46.0%]100%[37.5%]100%100%83.5%
[ ]: Parameters are set by their regression models and not independently.
Table 7. Coverage ratios of Monte Carlo test cases.
vx,VuTax,VuTvx,challvy,challax,challdx
Severity test cases
[72.3%]75.2%[48.9%]47.1%51.7%58.5%
Exposure test cases (Normal driving)
[68.9%]77.9%[74.6%]40.5%42.1%58.7%
[ ]: Parameters were set by their regression models and not independently.
Publisher’s Note: MDPI stays neutral with regard to jurisdictional claims in published maps and institutional affiliations.

