Abstract
This paper aims to improve transfer utility between bike-sharing and subway. For this paper, the transfer costs of three combined travel modes were analyzed, including “Bike-sharing + Subway”, “Walking + Subway” and “Bus + Subway”, and a transfer cost function, including time cost and expense cost, was constructed. Cluster analysis was carried out on the origin and destination of bike-sharing in the transfer-influenced area. The sum of squares of errors and the service radius were used to verify the clustering results. Then the number of alternative facilities, the location of alternative facilities and the initial number of shared bikes were preliminarily predicted. Based on the initial scheme, a bi-level programming model of facility layout and configuration in bike-sharing was established, with the goal of improving ride volume and reducing the transfer cost and facility-operation costs to optimize the initial facility-allocation scheme. Then a heuristic algorithm was used to solve the model. Finally, a typical subway station was selected as a case, and the configuration process for facilities in bike-sharing is discussed in detail in the paper. The research results of this paper may provide reference for the planning and optimization adjustments of facilities for bike-sharing.
1. Introduction
In the context of the development of sustainable transportation, low-carbon travel modes such as cycling and walking are becoming more and more popular. In sustainable transportation plans, cycling and walking are alternatives to the motorized transportation system [1]. Many countries are increasing investment in infrastructure construction for pedestrian and bicycle travel. However, pedestrians and cyclists are vulnerable in the road traffic system. Safety issues are an important factor hindering the use of bike lanes on urban roads [2]. There is an increasing number of studies on the treatment of pedestrian and cycling mobility issues in the urban environment. D’Apuzzo et al. proposed an original estimation method for cycling flow, taking safety into account in cycling infrastructure layouts [3]. They also proposed an original risk-based methodological approach for pedestrians [4]. Systemic pedestrian safety management processes can reduce pedestrian accidents [5]. Some scholars have proposed a forecasting model for estimating pedestrian flow in the network, which can be used in measures to protect vulnerable road users [6]. In the sustainable development of cities, the two modes of walking and cycling still have great potential.
After the advent of bike-sharing, the availability of bikes and the flexibility of bike routes have been significantly enhanced. Bike-sharing has developed on a large scale in China [7]. Bike-sharing has greatly satisfied the needs of short-distance travelers because of its convenient, fast and efficient characteristics. Bike-sharing has become the most flexible transfer mode of urban rail transit. With the development of urban rail transit networks, “rail transit + bike-sharing” has become an important trend in the future development of urban multi-mode combined travel [8]. However, mass investment without planning in the early stages has directly resulted in a significant waste of resources, and the efficient “rail transit + bike-sharing” model was unsustainable. In order to further promote the development of the “rail transit + bike-sharing” mode, bike-sharing has gradually stepped into a new stage involving fixed-point borrowing of pile-free facilities and refined delivery management. At the same time, there is also a series of derivative problems; for example, the layout of bike-sharing facilities is not convenient enough, there is no effective network among bike-sharing facilities, and shared bikes are randomly parked in the area near subway stations [9]. These problems pose higher challenges to the layout and construction of bike-sharing infrastructure in the future.
The layout of bicycle facilities mainly includes two problems. One is the determination of public bicycle parking piles, drop-in points and electronic fences of shared bikes. The other is the determination of the scale of bike-sharing facilities and the number of shared bikes. Previous studies on bike-sharing management mainly focus on the bicycle rebalancing scheduling problems of bike-sharing systems [10,11]. Moreover, studies on public bicycle parking locations and allocation are relatively comprehensive [12,13,14]. Some researchers have also considered the location and the allocation of public bicycle systems. Frade [15] established an optimization model of parking location, parking pile configuration, bicycle allocation in each period and rebalancing scheduling decisions. Martinez [16] considered parking location, bicycle allocation and rebalancing scheduling problems under the mixed use of ordinary and electric bicycles, and established a mixed-integer linear programming model with the goal of maximizing income. Jiang [17] put forward the method of urban public bicycle location, considering the influence of newly added public bicycle stations from the perspectives of decision makers and users, and then constructed a bi-level programming model.
In researching shared bicycle parking locations and facility configuration, Yan [18] constructed the public bicycle parking location and configuration model with deterministic demand and random demand based on the spatiotemporal network model. Caggiani [19] proposed a method of dynamic allocation of bicycles based on operators, which started from predicting the allocation and location of bicycles in the operating area, and ended with a decision-support system for the redistribution process. Reiss [20] obtained the spatial and temporal characteristics of bike usage by analyzing the GPS data of the bike-sharing system in Munich. Then a demand model was constructed to forecast bike demand at certain times and places. Some scholars also pay attention to the connection between shared bicycle configuration and public transport. Zhang [21] explored the problem of travel-mode shift between shared bicycle and public transit in order to improve the traffic environment and increase the sharing rate of public transit. Some studies also put forward an optimal distribution plan of shared bicycles connecting with the subway line during the morning peak hours from the perspective of low-carbon [22].
The research on public bicycle theory has been relatively comprehensive. In recent years, some studies have been undertaken on bicycle-sharing-related issues. However, most shared bicycle parking facility layout methods only focused on a single mode, and there was a lack of integrated discussion on related competitive combination transfer modes. However, these modes of travel actually constitute components of a whole, being closely related and mutually restricted. To the best of our knowledge, the facility layout configuration model and operation management measures do not fully reflect the impact on the transfer combination travel mode, and cannot solve the overall problem. Drawing lessons from traditional concepts and from experiences of public bicycle allocation, the related studies on bike-sharing have also made some progress in recent years. However, the research on the layout of bike-sharing facilities in the transfer-influenced area of subway station is still insufficient.
This paper focuses on the layout of bike-sharing facilities in the transfer-influenced area of a subway station. Based on the Nanjing travel order data provided by Mobike, this paper firstly quantifies the generalized travel cost of bike-sharing transfer to rail transit and related combined travel modes, which enables the modeling and calculation of facilities layout in bike-sharing. Then, two-dimensional spatial clustering is used to predict alternative parking spots in bike-sharing, and a bi-level programming model is established, which is solved by heuristic genetic algorithm. Finally, taking a typical station of Nanjing rail transit as an example, this paper verifies the model and algorithm and analyzes the sensitivity of the parameters.
The outline of this paper is as follows. The methodology section introduces the research process and the bi-level programming model. In the results and discussion section, the Xinglongdajie Subway Station in Nanjing, China is taken as the case study object to verify the model, and the results are analyzed and discussed. Finally, the main findings are summarized in the conclusion section.
2. Methodology
2.1. Data Collection
In the Data Collection section, the content includes three main parts: data structure description, data cleaning and data extraction.
2.1.1. Data Description
The data of bike-sharing used in this paper come from Mobike. Mobike is a company that runs bike-sharing in China. The original data time range of this study is 18–24 September 2017. The data in this paper cover all Mobike shared bicycles in Nanjing, China. There are 3618994 valid units of data of bike-sharing trips. The original data structure is shown in Table 1.

Table 1.
Example of bike-sharing riding data.
2.1.2. Data Cleaning
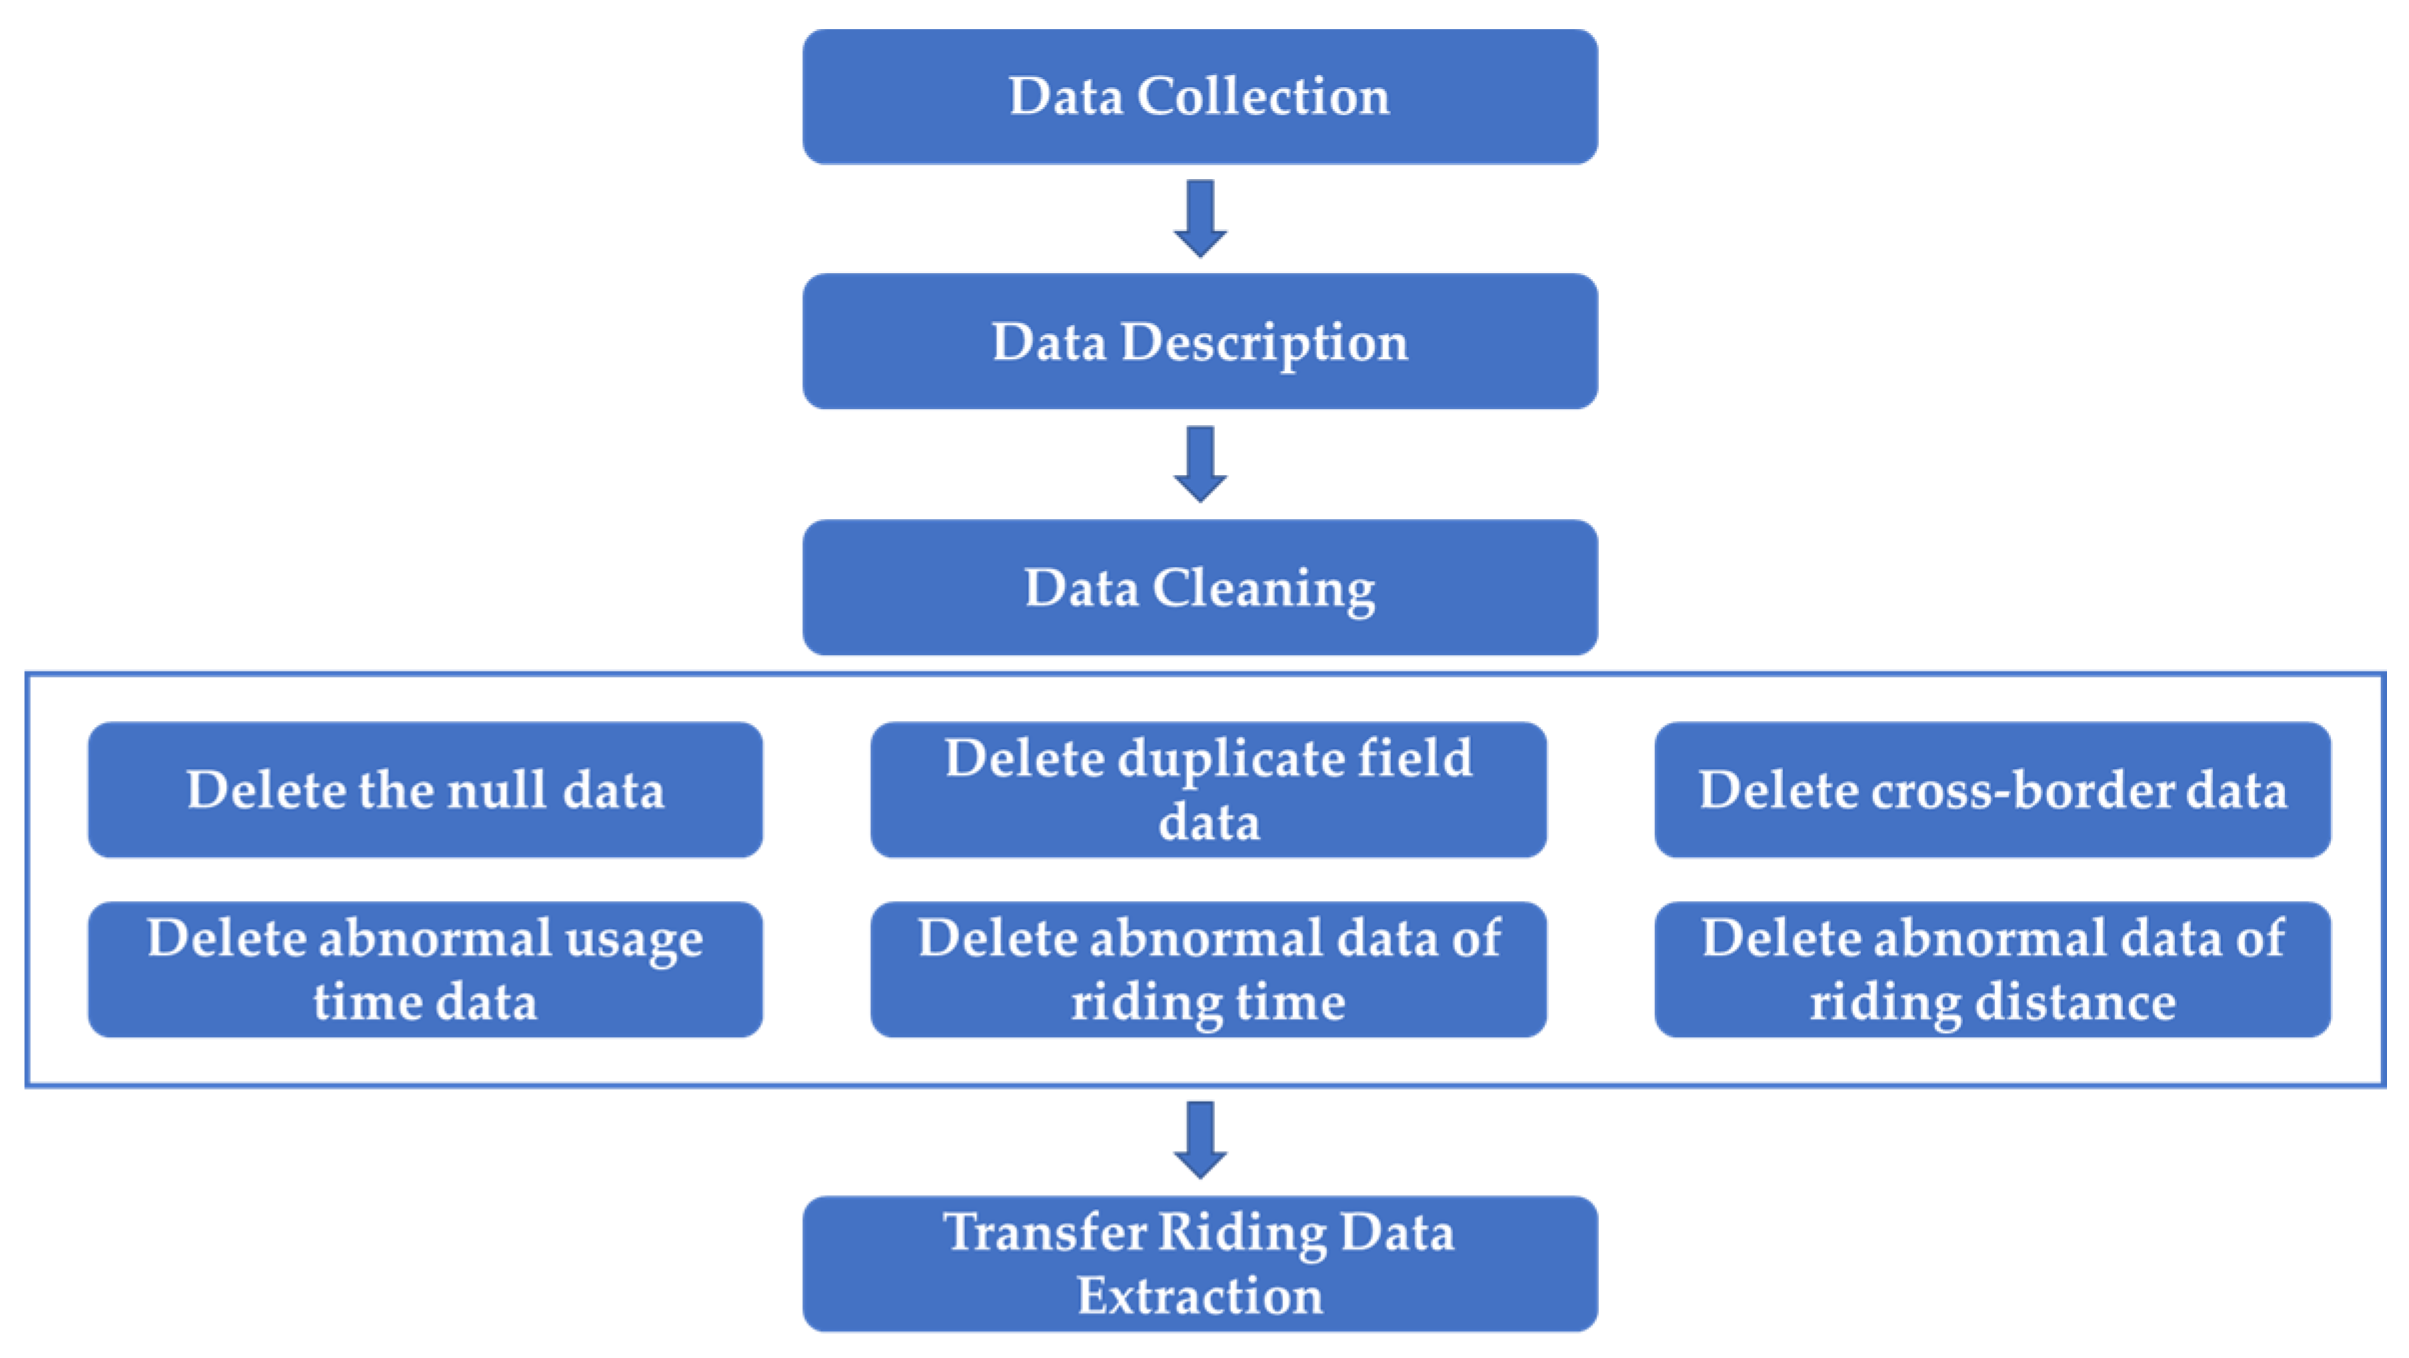
Data cleaning is a necessary preparation for data analysis, which directly affects the quality of data. The communication positioning between the shared bike and the server may cause abnormalities due to signal shielding, operation errors, positioning failures and other reasons. This affects the accuracy of the background cycling data statistics. Therefore, in this study, it was necessary to preprocess the data to reduce the impact of errors. The data cleaning in this paper mainly included the following points:
- Deletion of null data. The original data contained abnormal data for system reasons, such as GPS equipment and data transmission. For example, there were null values in the riding time and geographic location information. These null data were deleted.
- Deletion of duplicate field data. The order number must be a unique value. Abnormal data with duplicate fields in the order data were deleted.
- Deletion of cross-border data. The coordinates of the city area of Nanjing are from 31°14″ N to 32°37″ N, and from 118°22″ E to 119°14″ E, so it was necessary to delete the data located outside the coordinate range.
- Deletion of abnormal usage time data. It was necessary to delete the records in which the rental date and return date were not the same day.
- Deletion of abnormal data of riding time. The 98% quantile of the original riding data was 40 min, so 30 min was used as the cleaning standard for the time dimension, and data with a riding time exceeding 40 min were deleted. Taking into account the operation time for the user to pick up and return the bicycle, records with less than 60 s were deleted.
- Deletion of abnormal data of riding distance. Due to the bike-sharing company’s policy of rewarding users for using bike-sharing, some users have generated many abnormal orders, so the records of travel distances less than 150 m were excluded in this research. In this study, the main role of bike-sharing was to transfer to rail transit, so the data concerning long-distance travel were excluded. The upper distance limit was 5 km.
After cleaning the original data based on the above rules, there were 3.32 million order data remaining, accounting for 91.7% of the original bike-sharing data sample.
2.1.3. Transfer-Ride Data Extraction
In the existing studies, the association range between bike-sharing and urban rail transit stations is as follows: a circular range with the station as the center and 300 m as the radius. All the data collected in this range are counted as riding related to the station. There are often problems when processing data within this range. For example, the 300 m circular range is too large and even includes the riding data inside the building near the subway station, resulting in large deviations in the selected data. In order to select the riding data near the subway station that were more specific to the study, this study proposed a method to select the data using ArcGIS software.
This study used ArcGIS software to construct a circular buffer. This circular area was centered on each entrance and exit of the subway station, and had a radius of 50 m. It was considered that the cycling data in this range were the cycling data related to the subway station in this paper. With the support of large data volumes, it can be assumed that these data were the data of bike-sharing transferring to rail transit.
According to the above method, taking one day’s data as an example, this paper collected 142,500 riding data of shared bike transferring to rail transit from 622,000 order data. The amount of data extracted accounted for 22.91% of the total amount of data. Data collection steps in this paper are shown in Figure 1.
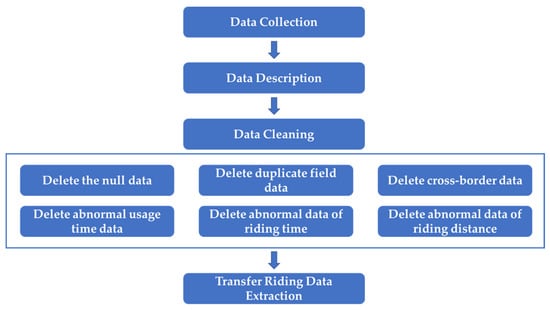
Figure 1.
Diagram of data collection steps.
2.2. Transfer-Cost Function Establishment
According to the 2019 bike-sharing research report, the main alternative transfer modes for bike-sharing are bus and walking. In order to highlight the research focus and simplify the model calculation, this paper only considers the three transfer modes (walking, bus, and bike-sharing) in strong competition with each other in the facility configuration model. Travelers are affected by multiple related factors when choosing a transfer mode, especially travel time and travel expense. This paper integrates these two factors into the transfer cost, and constructs a function.
2.2.1. Travel-Time Cost
Travel-time cost refers to the value of the time used by travelers to choose a certain travel mode from the origin to the destination. This paper utilizes the unit time value to quantify the travel time cost. The accuracy of this parameter is related to the transfer mode division. In addition, the travel time includes not only the running time of the travel mode, such as bike-riding and bus operating time, but must also consider the bike-locking time and the waiting time for the bus in the whole transfer process. Based on the above analysis, this paper establishes the travel-time cost model, including the bike-sharing lock time and the average waiting time of bus.
The unit time value is estimated mainly on the basis of the traveler’s annual income [23]. The calculation method is shown in Equation (1).
where is the average income of travelers, and is the average working time of travelers.
The travel time cost model includes the total time spent by the traveler from the origin to the subway station. The travel time cost model of walking, bike-sharing and bus is shown as following:
- Walking. When the traveler chooses to walk to the subway station to transfer to the rail transit, travel time indicates the time for the traveler to walk to the station. The walking travel-time cost is shown in Equation (2).
- Bike-sharing. When the traveler chooses to ride a shared bike to the rail station, the travel time includes the time for the traveler to walk to the bike-sharing facility , the time for opening and locking the bicycle , and the time for the traveler to cycle to the station . The bike-sharing travel-time cost is shown in Equation (3).
- Bus. When the traveler chooses to take the bus to the rail station, the travel time includes the time for the traveler to walk to the bus stop , the waiting time at the bus stop , and the time to take the bus to the station . The bus travel time cost is shown in Equation (4).
2.2.2. Travel Expense
Travel expense refers to the actual cost of traveler choosing a certain travel mode. It is the economic performance of a certain travel mode. When travelers choose different travel modes, they not only pay attention to the time cost of the mode, but also consider the expense of a single trip. Walking to the subway station discussed in this paper, the travel expense is equal to 0 (), cycling on a shared bike requires payment of a single ride rental price and taking the bus requires payment of the fare .
2.2.3. Transfer Cost
Transfer cost includes travel-time cost and travel expense. Travelers tend to choose the mode with a low transfer cost. Combined with the previous analysis, it can be seen that travel time cost and travel expense are independent of each other [24]. Therefore, this paper uses the addition principle to calculate the two factors. The transfer cost calculation of walking, bike-sharing and bus are shown in Equations (5)–(7).
2.3. Alternative Facility Location Prediction
2.3.1. Transfer-Influenced Area Determination
The transfer-influenced area of urban subway station refers to the space–time range that travelers can accept when they arrive at the station by walking or other modes to transfer to rail transit, specific to the transfer-influenced area of bike-sharing, that is, the range of riding that can be accepted by riders arriving at subway stations [25]. Hao [9] proposed an analysis method for the transfer-influenced areas of subway stations based on the riding characteristics of bike-sharing transfer, and verified the applicability of the method through Nanjing urban rail transit network and typical stations. This method analyzed bike-sharing riding data and the space–time circle layer of the transit from and riding to the rail transit station was calculated. The index system of the transit and riding of the rail station was constructed based on the existing multi-source data conditions, and relevant factors, such as traffic, facilities, and land use were considered. Hao used this method to carry out network overlay analysis to obtain the space–time range of the transit-influenced area of the rail transit station, and combined the urban roads and land use data to modify the transit-influenced area of the rail transit station. In this paper, this method is used to determine the transfer-influenced area of the subway station.
2.3.2. Location Prediction
A large number of cycling-origin and destination data reflect the spatial movement characteristics of bike-sharing travel. Given that the end of the last trip and the starting point of the next trip of bike-sharing are mostly coincident, the starting point of travel was selected as the research object in this paper, and the K-means two-dimensional spatial clustering analysis method was used to perform cluster analysis on the bike-sharing order data to discern the spatial points where the number of cycling transfers was relatively frequent and dense. On identifying the cluster center, the location of the candidate point for the bike-sharing facility was obtained.
When a traveler chooses to use bike-sharing, if the walking distance for finding a bike exceeds their acceptable range, they may give up using shared bikes and switch to other transfer modes. According to the analysis of the transfer cost, when the transfer costs of bike-sharing and walking are equal, the distance is the maximum acceptable walking distance for bike-sharing mode. Correspondingly, the maximum acceptable walking distance to find a shared bike is the maximum service radius of the candidate points in the cluster analysis [26]. In this paper, the service radius of alternative facilities locations was utilized as the evaluation index of the bike-sharing clustering result, and the clustering result needed to fulfill the requirement of maximum radius. The specific clustering process was as follows:
- Filtering the bike-sharing order data of the destination coordinates within 50 m of each exit of the subway station. The purpose of these bike-sharing orders was considered to transfer to rail transit in this paper.
- Filtering the bike-sharing order data again to obtain the coordinates of the origin located in the transfer-influenced area of the subway station, and modifying the acquired order data in the transfer-influenced area based on the actual land characteristics.
- Clustering the origin coordinates of the bike-sharing order data, and adjusting the clustering value K continuously, so that the area of the convex hull composed by the origin coordinates of the same class was small enough to be within walking distance.
- Integrating the resulting data into ArcGIS, marking the cluster center, and drawing the cluster boundary.
2.3.3. Allocation Prediction
For each alternative facility location, the usage of shared bikes is constantly changing, so the corresponding demand and supply also changes throughout the day. Reasonable delivery is the most important content for the space–time resource allocation of shared bikes. The entrances and exits of subway stations serve as the key nodes of the bike-sharing transfer connection. The number of bicycles allocated to bike-sharing facilities must satisfy the demands for transport during peak hours. Therefore, the initial supply of shared bikes can be expressed by Equation (8) combined with the transfer-ride order data.
where is the usage of shared bikes; is the supply ratio of shared bikes, generally from 0.9 to 1; is the unit time turnover rate of shared bikes, at peak hour, is 2, at flat peak hour, is 0.5.
2.4. Bi-Level Programming Model of Bike-Sharing Facility Layout and Configuration Based on Alternative Locations
There are many studies on the basic supply and demand theories and models that form the basis of the transportation model system [27]. The optimization of the layout and configuration of bike-sharing facilities is a bi-level programming problem [28]. The decision maker of the upper model is the planning manager, and the decision maker of the lower model is the traveler. Under the considerations of the cost, service level and other conditions, the manager formulates the layout and configuration plan of the bike-sharing facility according to the alternative facility locations to guide the traveler’s transfer mode choices. The traveler estimates the transfer cost from the origin to the subway station, and selects the appropriate transfer mode from the three modes: walking, bike-sharing and bus. The planning manager can refer to the traveler’s travel choices and adjust the layout and scale of the bike-sharing system. At this time, the facility layout, the configuration scheme and the travel-behavior selection interact with each other, finally reaching equilibrium. In order to solve the above problem, this paper establishes the upper and lower models from the perspective of maximizing the comprehensive target benefit of the bike-sharing configuration scheme and minimizing the user’s transfer cost. Subsequently, the bi-level programming model of bike-sharing facility layout and configuration in the transfer-influenced area is established.
2.4.1. Upper Model
Combined with the prediction results of alternative locations, managers set up different bike-sharing facility planning schemes to adjust the transfer cost, which can play a guiding role in the traveler’s choice of transport modes. The upper model is an overall optimal problem of bike-sharing facilities. The purpose of the planning is to attract more people to choose the transfer mode in bike-sharing with limited resources, and to ensure the service level of the bike-sharing system. The objective function of the upper-level model of the bi-level programming model established in this paper is composed of three main parts:
- Bike-sharing ride volume (Equation (9)), which refers to the number of people who use shared bikes to transfer to rail transit in each traffic zone in the transfer-influenced area.
- Facility-operation cost (Equation (10)), which mainly includes the operation cost of bike-sharing facilities and overload penalty.
- Overall transfer cost (Equation (11)), which mainly includes the cost of walking, bike-sharing and bus transfer to subway station.
As a matter of fact, due to the constraints of investment, urban development and the intensity of planned regional development, it is difficult to construct bike-sharing systems in one step. The construction of a bike-sharing system is a gradual and continuous improvement process from sparse to dense and from small to large. In different planning periods, the planning objectives should be different. Therefore, bike-sharing should meet different coverage requirements, that is, for the same traffic zone, with the gradual improvement of bike-sharing systems, the number of facilities that can provide services for the traffic zone should gradually increase. Combined with the idea of progressive coverage, the constraints of the upper model are as follows:
where is the number of shared bikes that should be placed at alternative point at the initial stage; is the turnover rate of shared bike; is a large positive number.
Equation (12) indicates that when an alternative point is selected, the shared bike can be deployed at that point.
where is the maximum number of facilities.
Equation (13) represents that the number of facilities actually established shall not exceed the planned number of facilities.
where is the distance between different facilities; is the specified minimum distance.
Equation (14) shows that the distance between the facilities shall not be less than the specified minimum distance.
where and are the upper and lower limits of the number of shared bikes at the selected facility, that is, 10 and 50.
Equation (15) represents the transfer overload penalty corresponding to the number of shared bikes actually deposited in the facility.
where is the coverage degree of the alternative points to the demand point ; is the distance between the demand points of the traffic zone and the alternative point ; and are the upper and lower limits of the attenuation radius of each alternative point covering the demand points of the traffic zone.
Equation (16) describes the calculated value of the coverage of the facility corresponding to the demand point. When the distance exceeds the maximum radius , the value is 0, which means that the facility cannot serve the demand of the traffic zone.
where is the minimum coverage limit for the demand points of the traffic zone, the small value is taken at the initial stage of construction, and the value can be increased moderately in the later development stage.
Equation (17) indicates that the degree of coverage of each traffic zone demand point shall not be less than the specified value.
Equations (18) and (19) indicate whether the alternative facility location point is selected, and the value range of the number of shared bikes allocated to the facility, respectively.
According to the analysis of objective function and constraint conditions, the above-mentioned multi-objective optimization problem can be transformed into the following single-objective optimization problem by the linear weighting method [29], and the overall benefit objective function of the upper-level model is shown as Equation (20).
where each target weight coefficient satisfies ; is obtained using the dimensionless method to process the original target functions, that is shown as Equation (21).
2.4.2. Lower Model
The decision makers of the lower model are the travelers, and the upper decision makers formulate the layout and configuration plan of bike-sharing facilities. Travelers choose their transfer modes by considering the transfer cost, thus generating the travel demand for multiple combinations of trips to transfer to rail transit. The generated volume of various combined transfer modes feed back to the layout and configuration plan of the upper model. Travelers tend to choose the transfer mode with the least transfer cost. This process can be abstracted as the problem of dividing the way of multimode combined travel [30]. Based on the above analysis, the Logit model is established based on the principle of minimizing transfer cost. Travelers choose among three modes that transfer to rail transit: walking, bike-sharing, and bus. The probability of the transfer mode is calculated by Equation (22), and is the unit transfer cost of this mode.
The part of each index item is divided by the average generalized transfer cost of each mode , where is the correction coefficient, which is generally taken as [3, 3.5] [31]. Therefore, the improved model is shown as Equation (23).
Combined with the analysis of transfer cost in this section, the total transfer costs of walking, bike-sharing and bus are calculated as the following Equations (24)–(26).
where is the walking distance from the demand point to the subway station; is the walking distance from the demand point to the bike-sharing facility ; is the riding distance from the bike-sharing facility to the subway station; is the distance between the bus station and the subway station; represents the number of people traveling from the demand point to the subway station by the three modes; , , are the travel speed of walking, bike-sharing and bus.
The constraints of the lower-level planning model are shown as Equations (27) and (28). Equation (27) indicates that the travel demands of each traffic zone to transfer to rail transit were able to be met; Equation (28) shows that bike-sharing travelers only chose shared bike facilities within the coverage area.
According to the analysis of objective function and constraint conditions, the lower-level model aims at minimizing the transfer cost of travelers, and the objective function is shown as Equation (29).
2.5. Model Solving
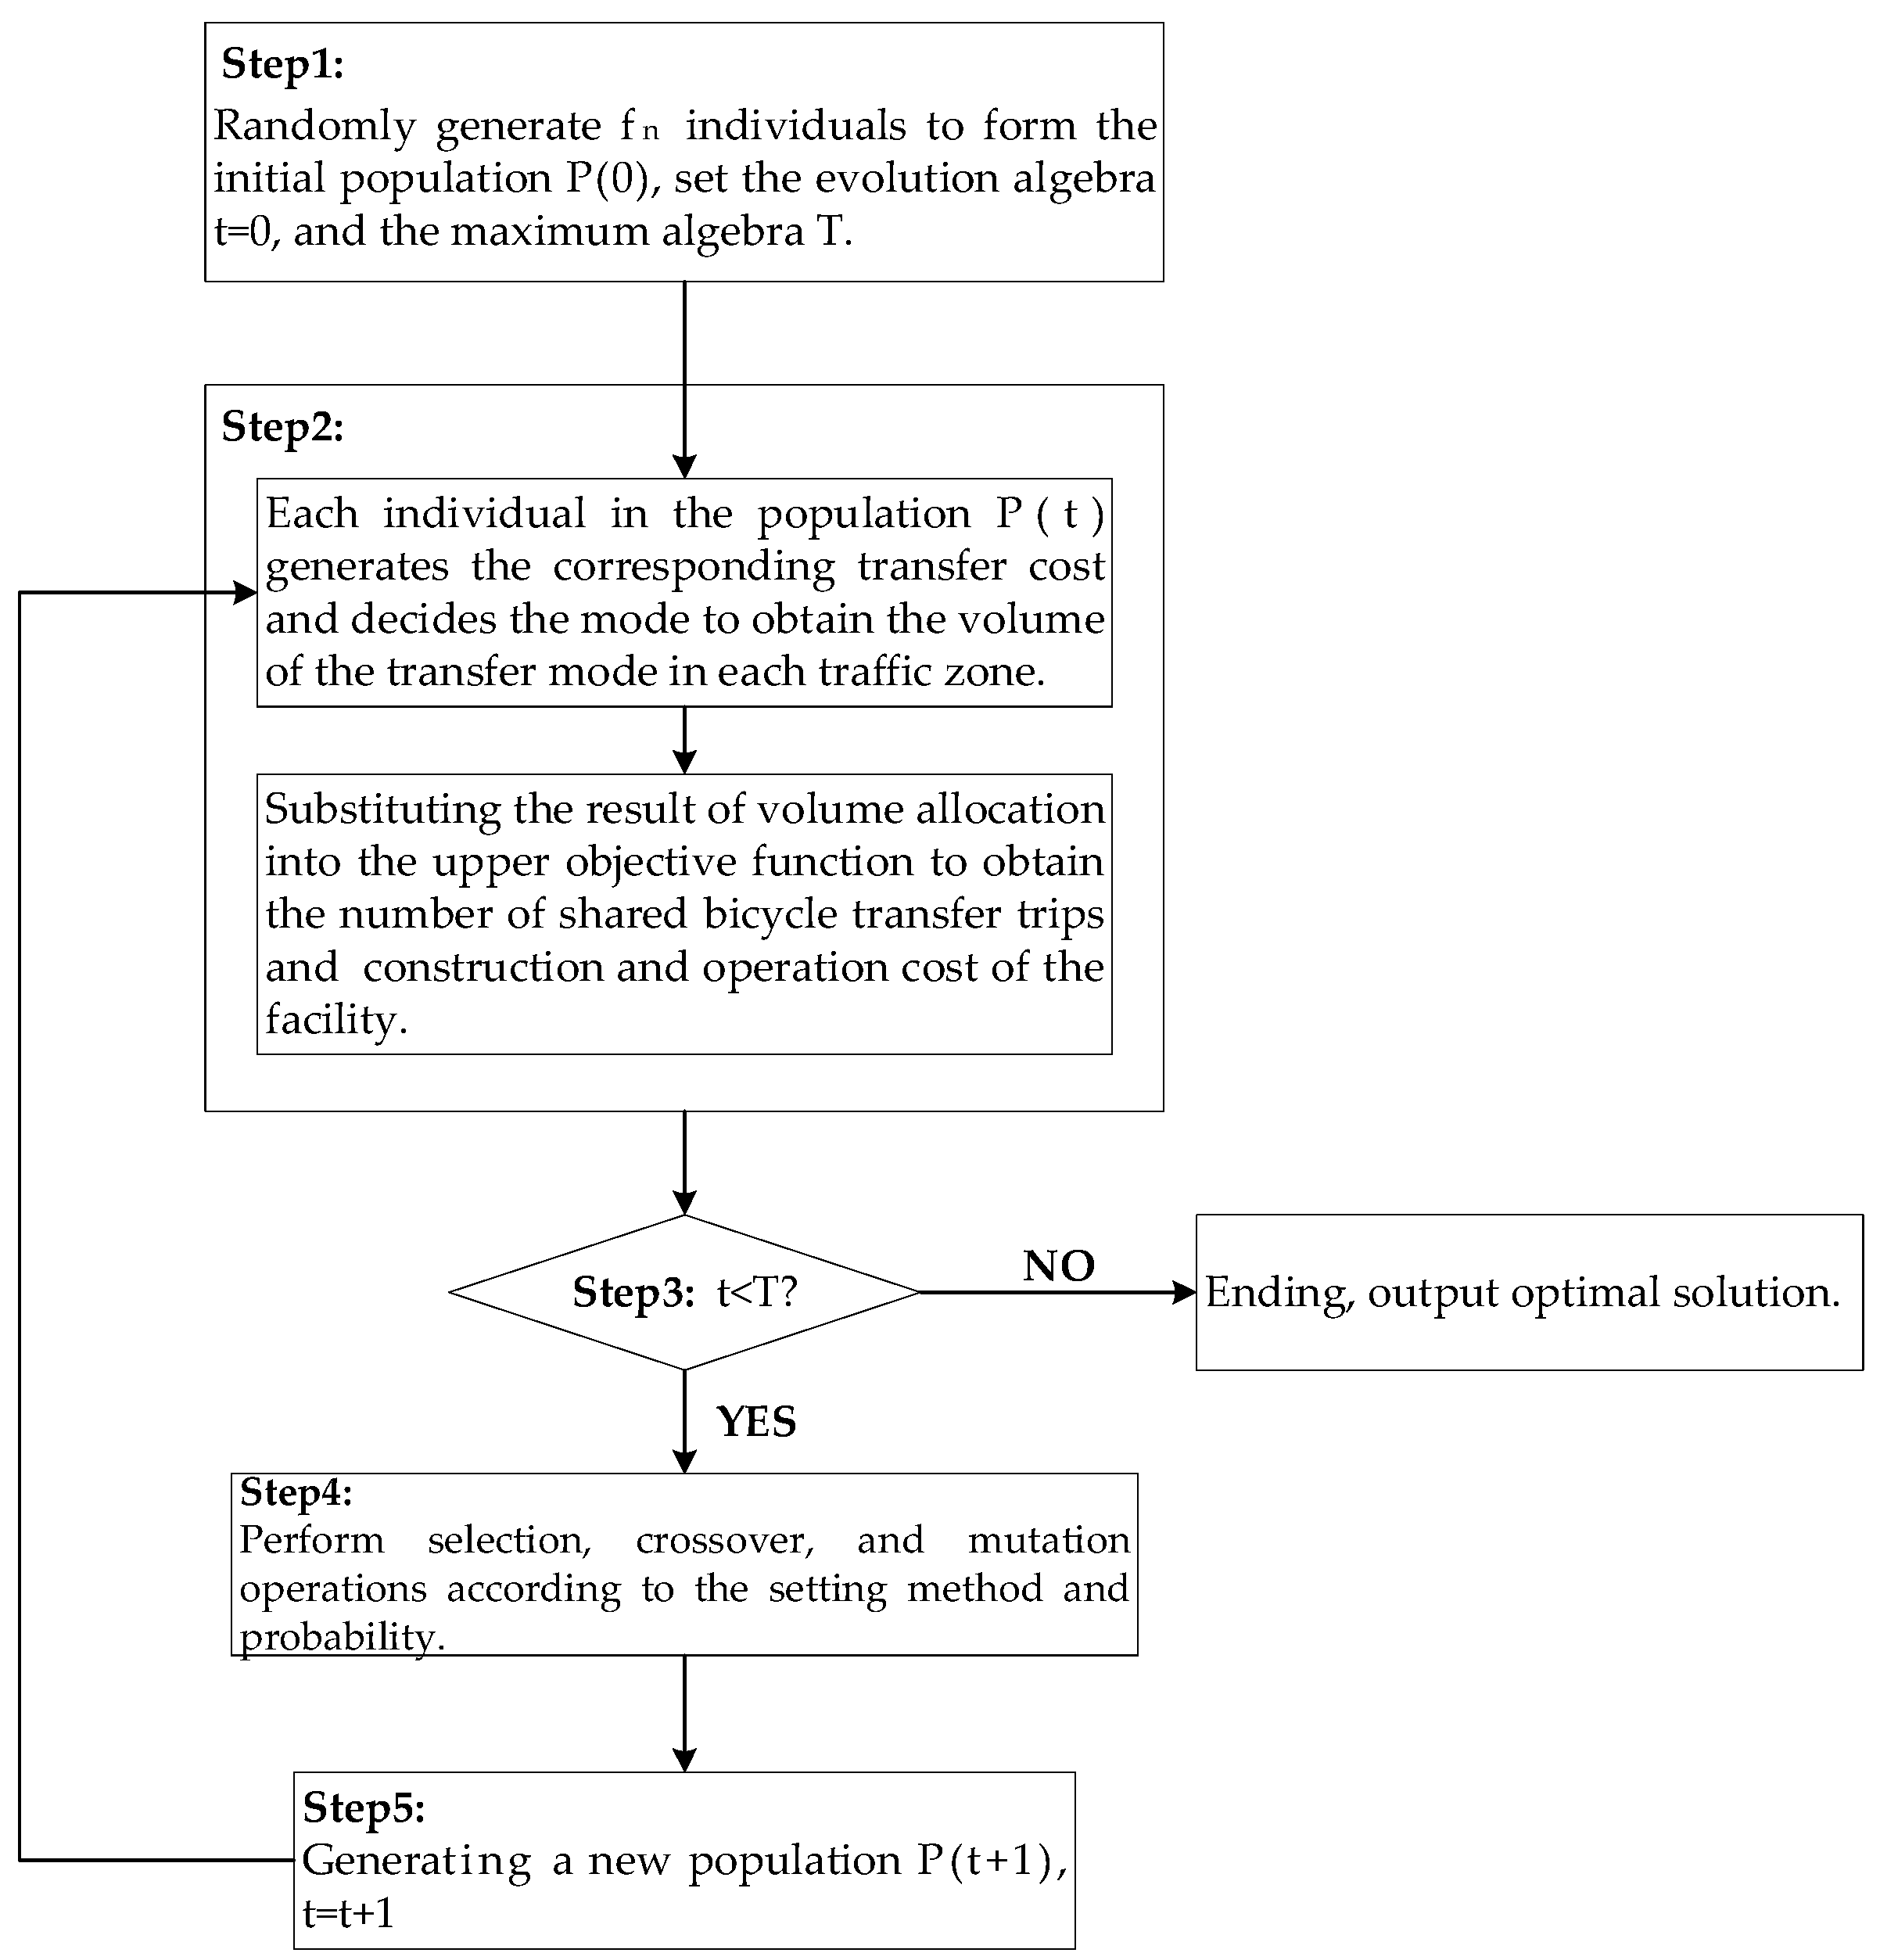
The bi-level programming model established in this section belongs to the category of the facility layout and configuration problem, which has been proved to be an NP-hard problem [32]. As an extension and modification of the traditional model, the model to be solved in this paper is also a typical NP-hard problem. For such problems, when the problem size is small, the optimal solution can be obtained using an accurate algorithm. However, when the problem size gradually increases, the solution time increases exponentially, and it is almost impossible to accurately solve the global optimal solution. Therefore, it is more practical to utilize heuristic algorithms to solve complex combinatorial optimization problems and to find approximate optimal solutions within acceptable computing time. The genetic algorithm has obvious advantages in solving such problems. On the one hand, it imposes no restrictions on the objective function and constraint conditions, does not require function continuity, has self-adjusting characteristics and search is more flexible; on the other hand, parallel computing enables it to find the optimal solution faster [33]. The calculation flow of the genetic algorithm used in this paper is shown in Figure 2.

Figure 2.
Flow chart of genetic algorithm.
3. Results and Discussion
3.1. Transfer-Influenced Area and Traffic Zone Division Results
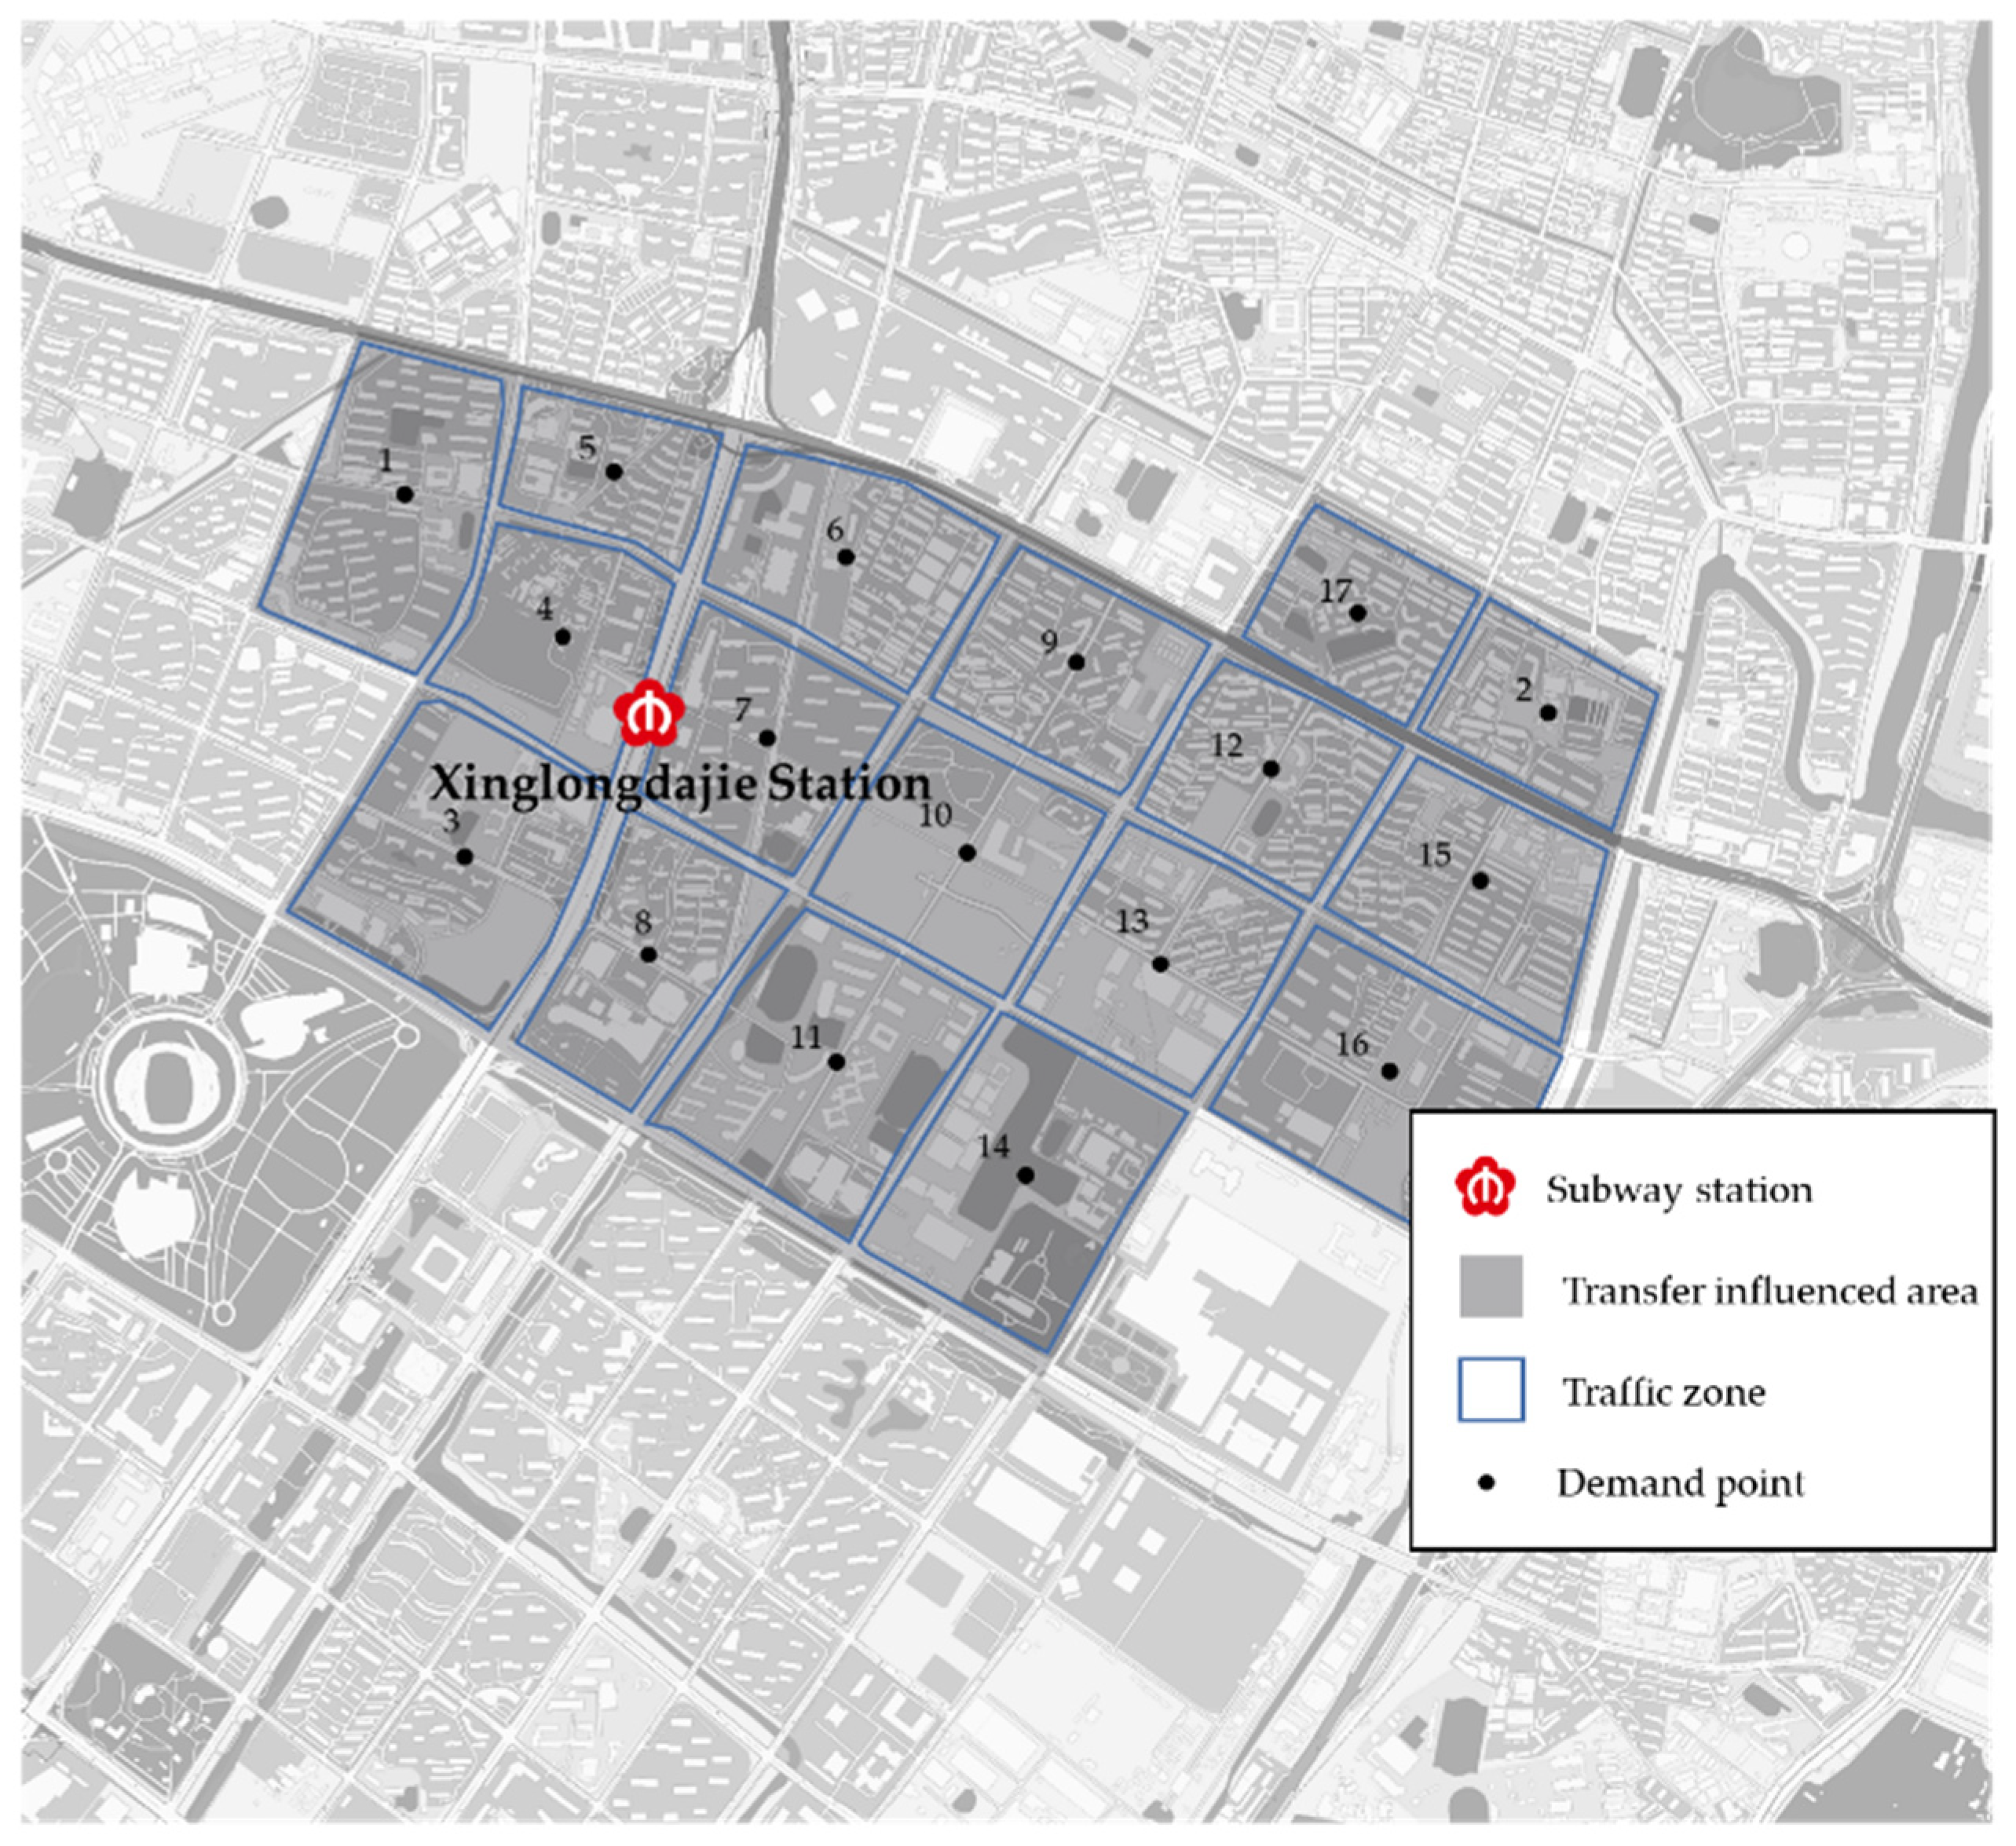
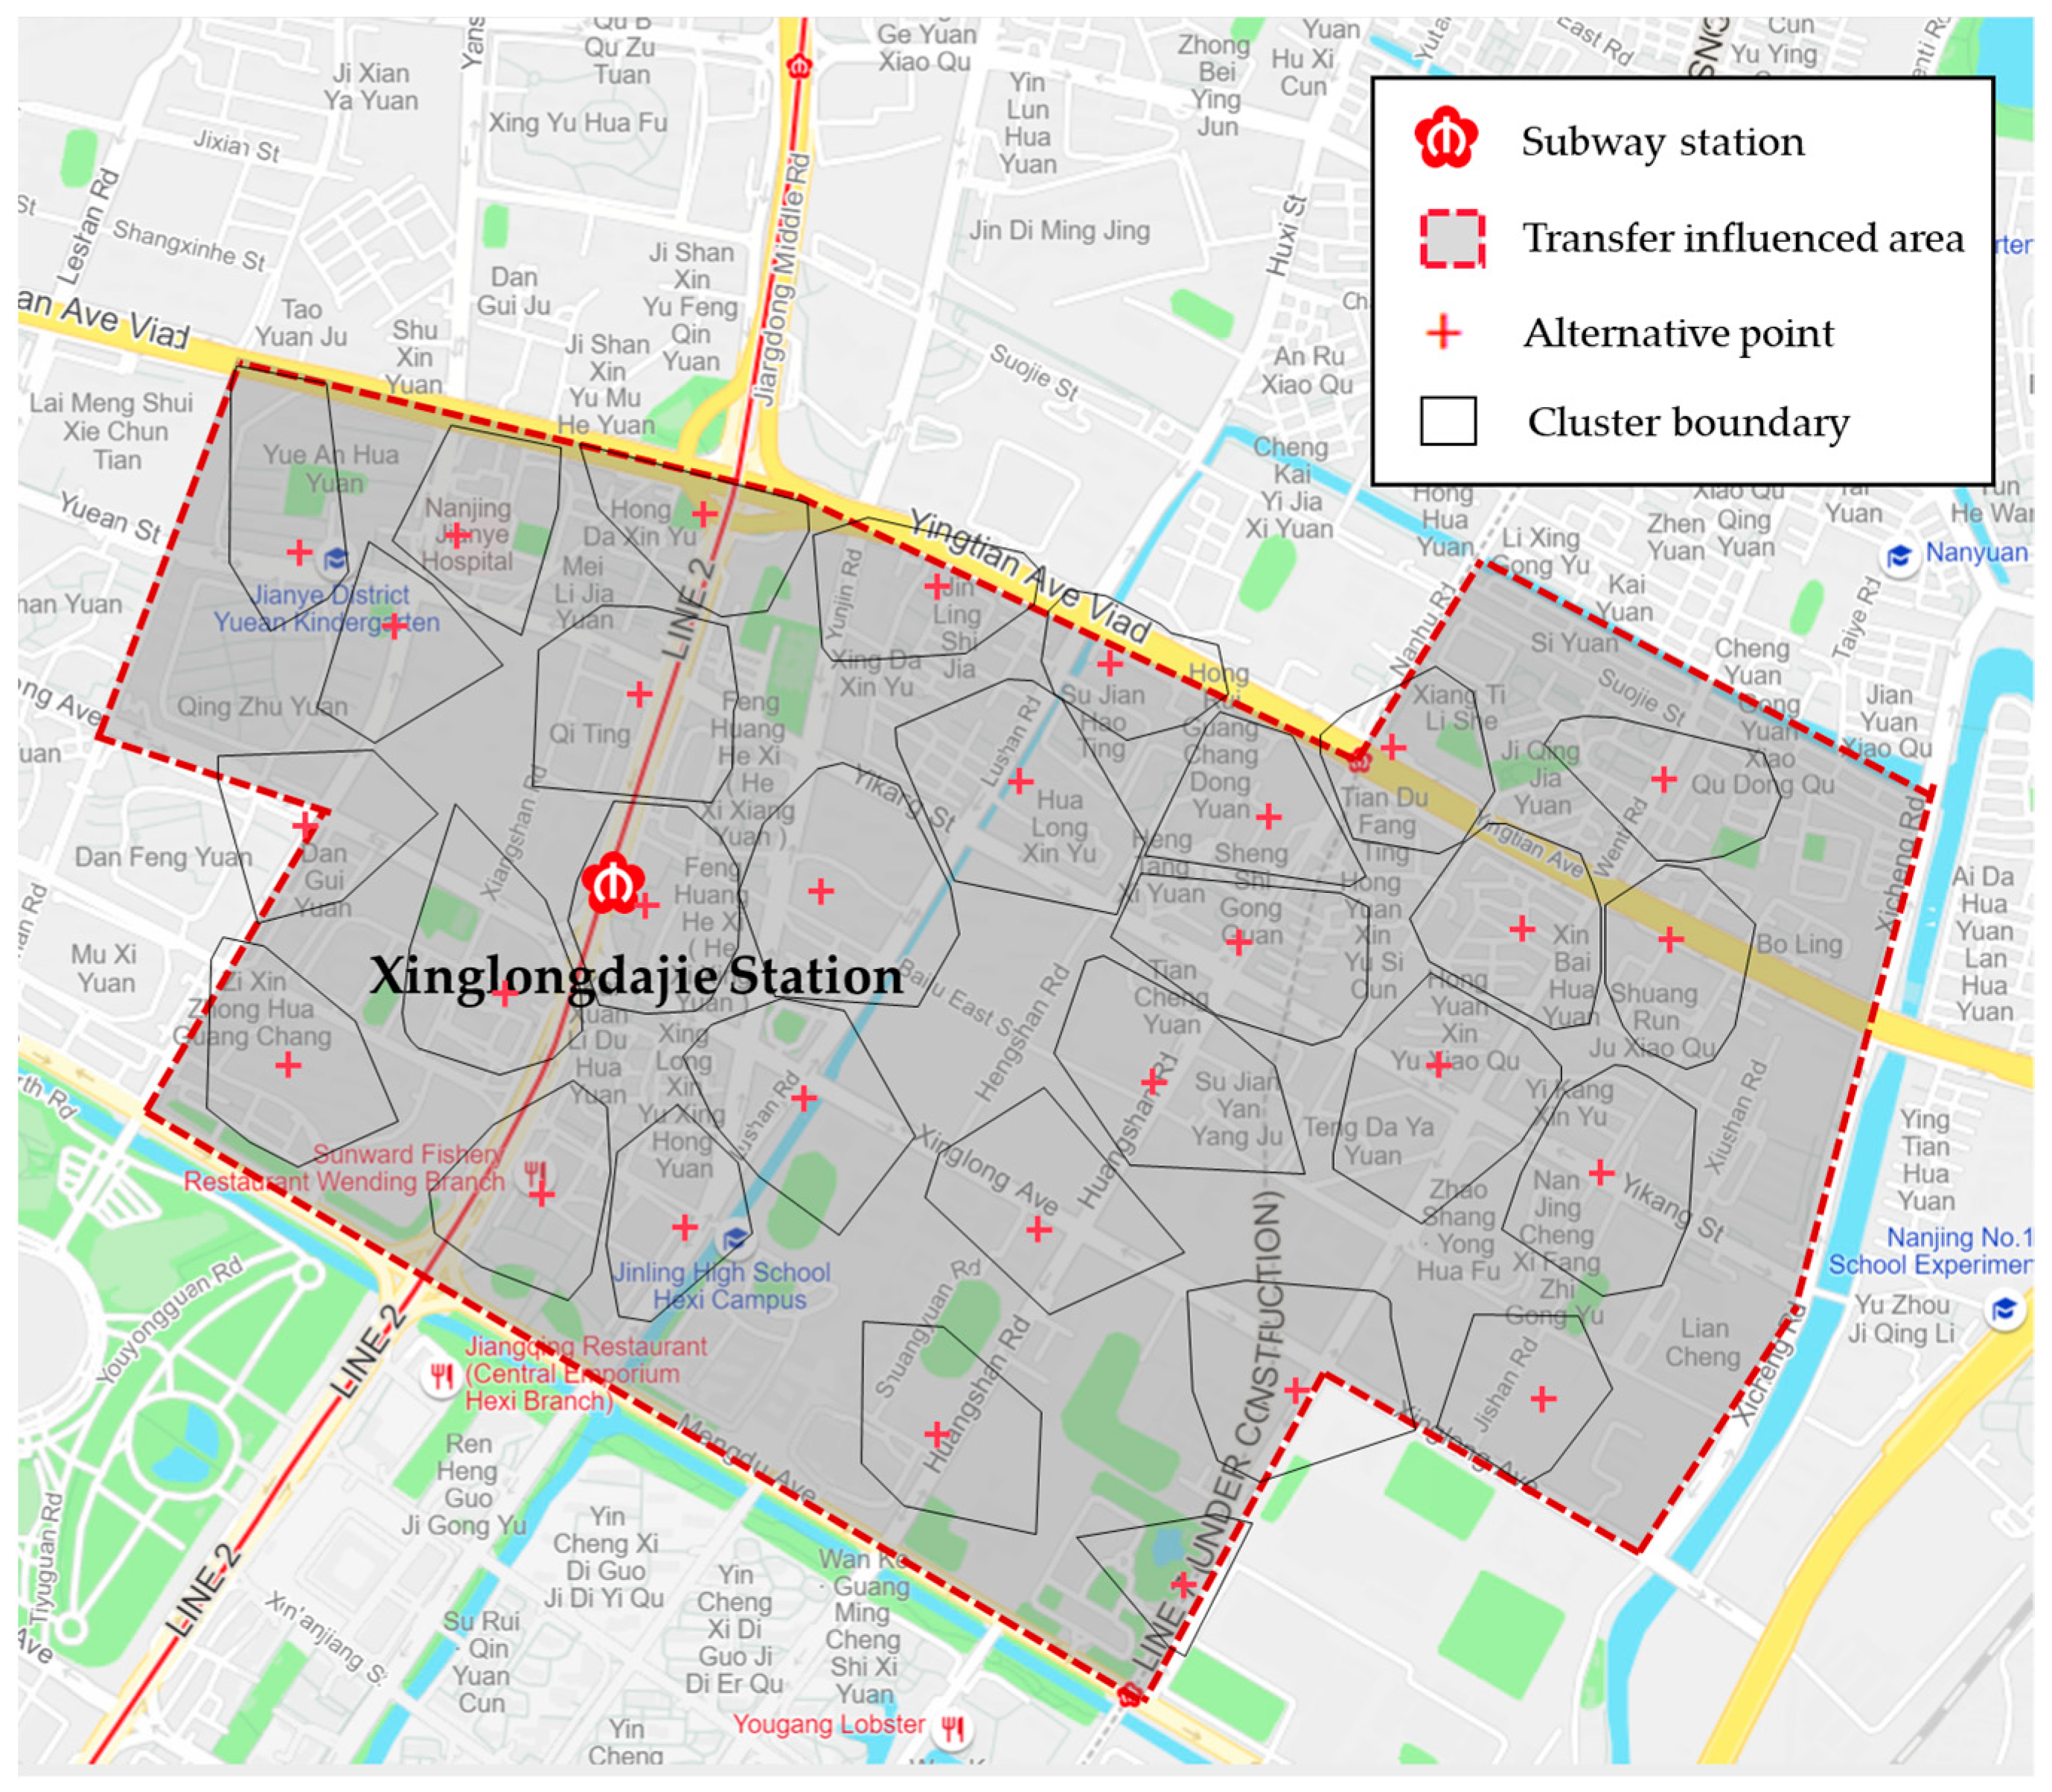
The Xinglongdajie Subway Station of Nanjing was used as a case to verify the model. The transfer-influenced area of the Xinglongdajie Station was determined, as shown in Figure 3. In order to systematically configure the facilities and simplify calculation, this study considered the structure of the grid-shaped road network in the area, divided the influence area of rail transfer into traffic zones, and selected the centroid of each zone as the travel demand point. The obtained traffic zone division result and the corresponding travel demand point are also shown in Figure 3.
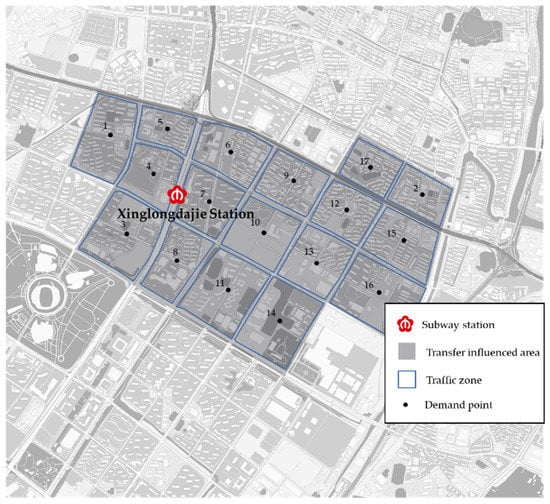
Figure 3.
Distribution of the transfer-influenced area and traffic zones.
3.2. Alternative Location Point Prediction Results
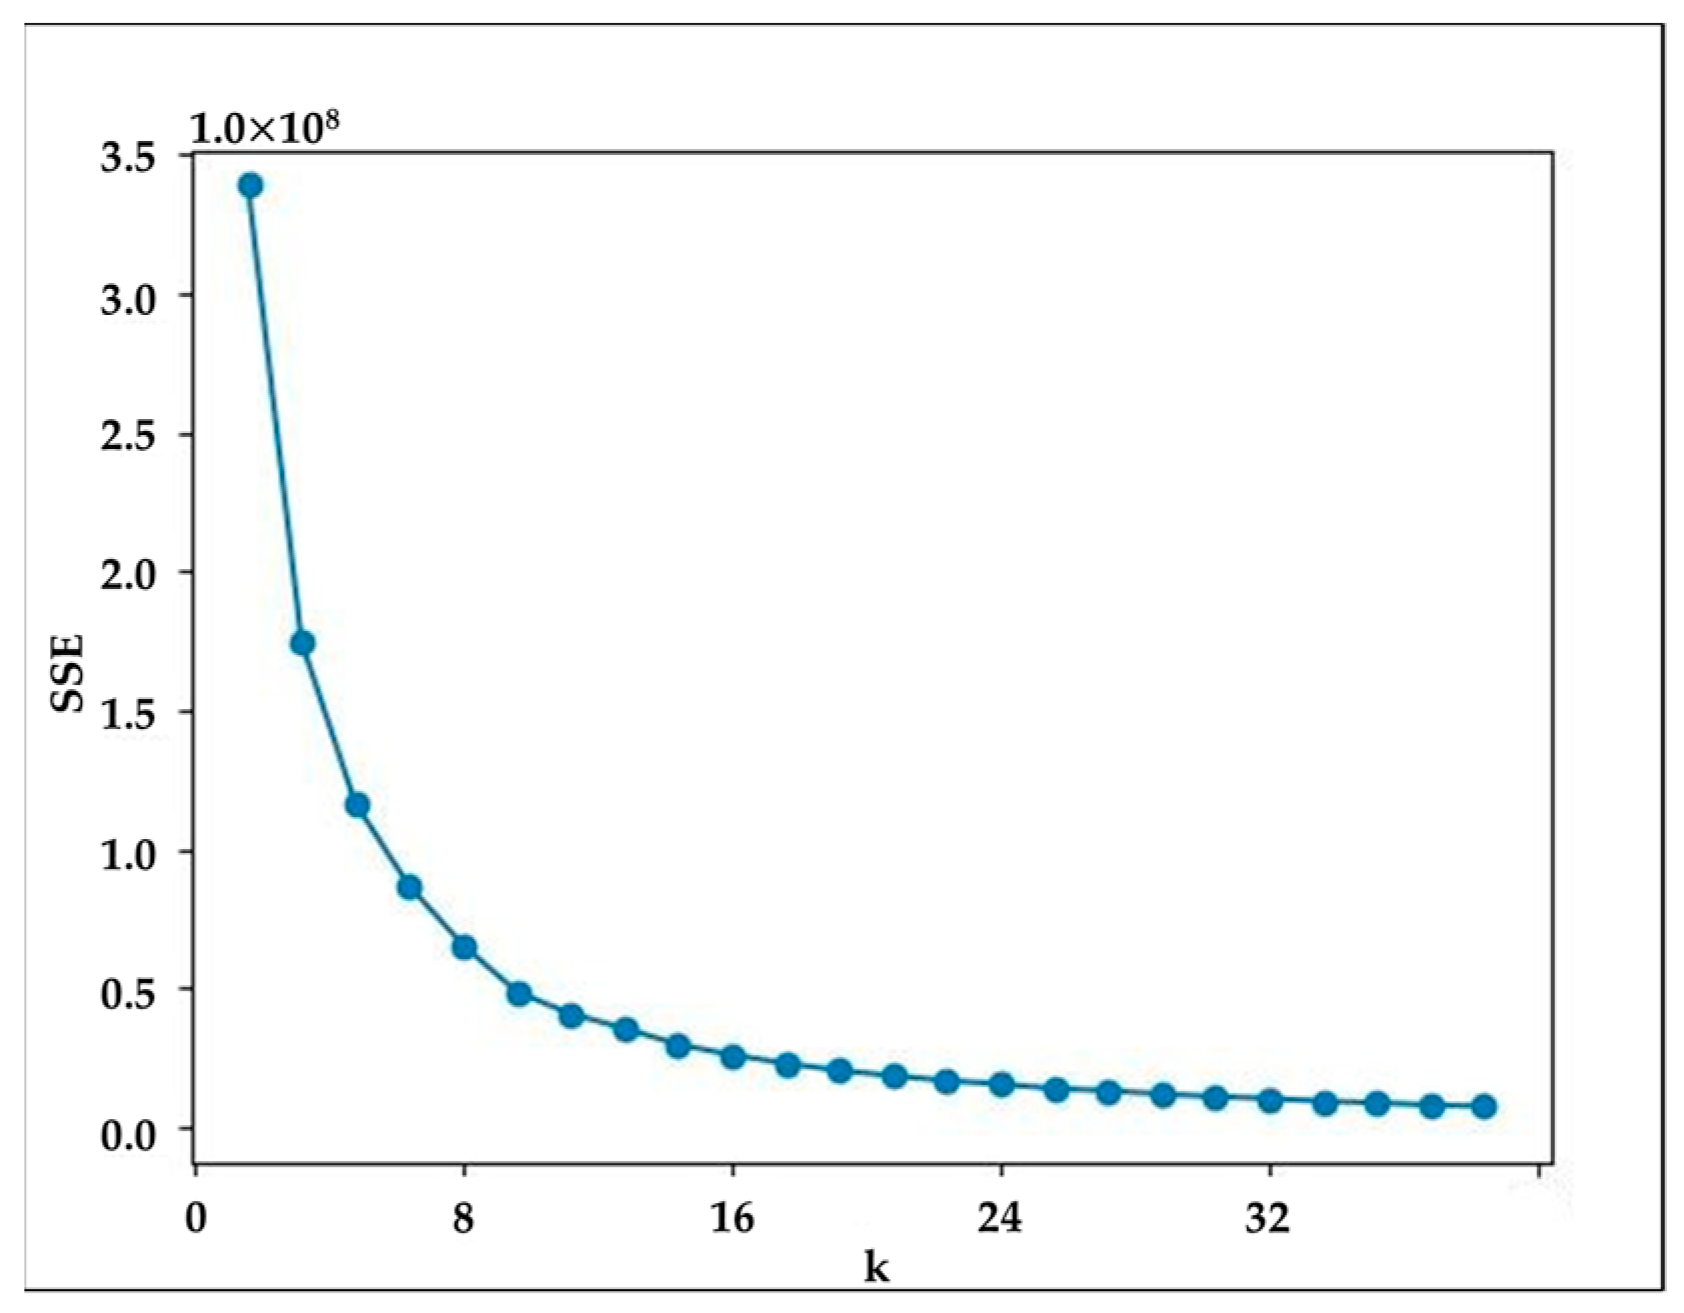
According to the prediction method of alternative facility points proposed above, this study performed two-dimensional spatial clustering on the bike-sharing order data, and iteratively calculated the sum of squares of two-dimensional spatial clustering errors under different k values. The corresponding result is shown in Figure 4. It clear that when K was greater than 24, the error sum of squares SSE tended to be stable. In order to increase the flexibility of the alternative facility location point planning, the K value was determined as 30. After debugging, the classification effect was perfect when all the order data coordinates were divided into 30 categories. Figure 5 shows the distribution of the alternative points of the bike-sharing facility. As a result, the area of the convex hull enclosed by the origin coordinates of each shared bike is about 0.16 square kilometers, which is approximately equal to a circle with a radius of 200 m, and its service radius is within the acceptable walking distance for travelers [9].
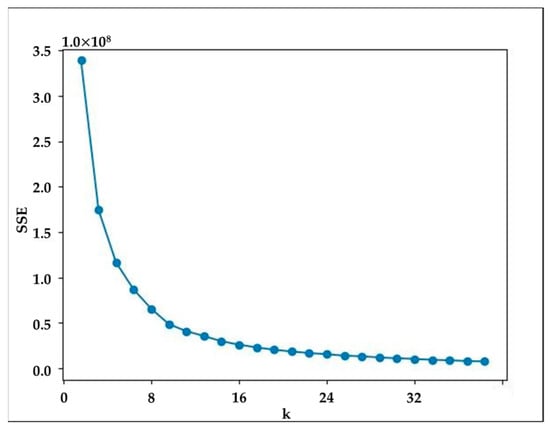
Figure 4.
The sum of squares of error SSE under different K values.
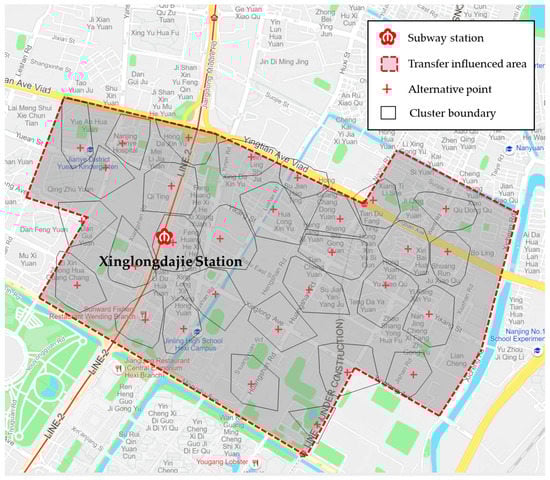
Figure 5.
Clustering results of alternative location point distribution.
3.3. Model Paremeters
- The unit time value. According to the relevant statistical data, in 2019, the per capita disposable income of Nanjing residents was 64,372 yuan. According to Equation (1), the unit time value of Nanjing residents is 0.51 yuan/min (40-h week).
- Walking speed. Generally speaking, the walking speed of travelers is between 1–1.5 m/s. In this paper, the walking speed was 1.25 m/s.
- Single ride cost. There are two common billing rules for bike-sharing: the first is the normal single payment, and the second is the monthly card payment. The normal payment for a single ride is based on the time spent on each bike. According to the latest Mobike pricing rules in November 2019, a single ride costs 1.5 yuan within 15 min, and if it exceeds 15 min, the duration fee is 0.5 yuan/15 min. The price increase trend makes it more cost-effective to pay with monthly cards. With the purchase of monthly cards, there is no limit to the number of rides users can take. Travelers who use shared bikes to transfer to rail transit use shared bikes frequently, so the monthly card payment method is cheaper. In this paper, it was assumed that all users who transferred to transportation used monthly cards to pay. As an example, with Mobike’s latest monthly card of 25 yuan the cost of each riding is 0.5 yuan (22-day month, twice per day).
- Riding speed. According to the riding report published by Mobike, the average riding speed of bike-sharing is 8 km/h.
- Opening and locking time. Considering that travelers need to spend time opening and locking the bike in addition to actual traveling time, this paper estimates that the opening and locking time of a single trip is 2 min.
- Bus fare. The regular bus lines currently operating in Nanjing all adopt the one-ticket system, and the fare is 2 yuan. Therefore, the value of a single bus fare is 2 yuan.
- Bus speed. The operating speed of a bus is affected by road traffic conditions and the time it takes to pick up and drop off passengers. Bus operating speed was checked in real time through the Baidu map API interface, and the operating speed of the bus in Nanjing was found to be 20 km/h.
- Bus waiting time. There are four bus lines in the affected area of the Xinglongdajie subway station, and the average waiting time for passengers is 8 min.
In summary, the values of the parameters required by the model are shown in Table 2.
Table 2.
The Values of Model Parameters.
3.4. Layout and Configuration Results
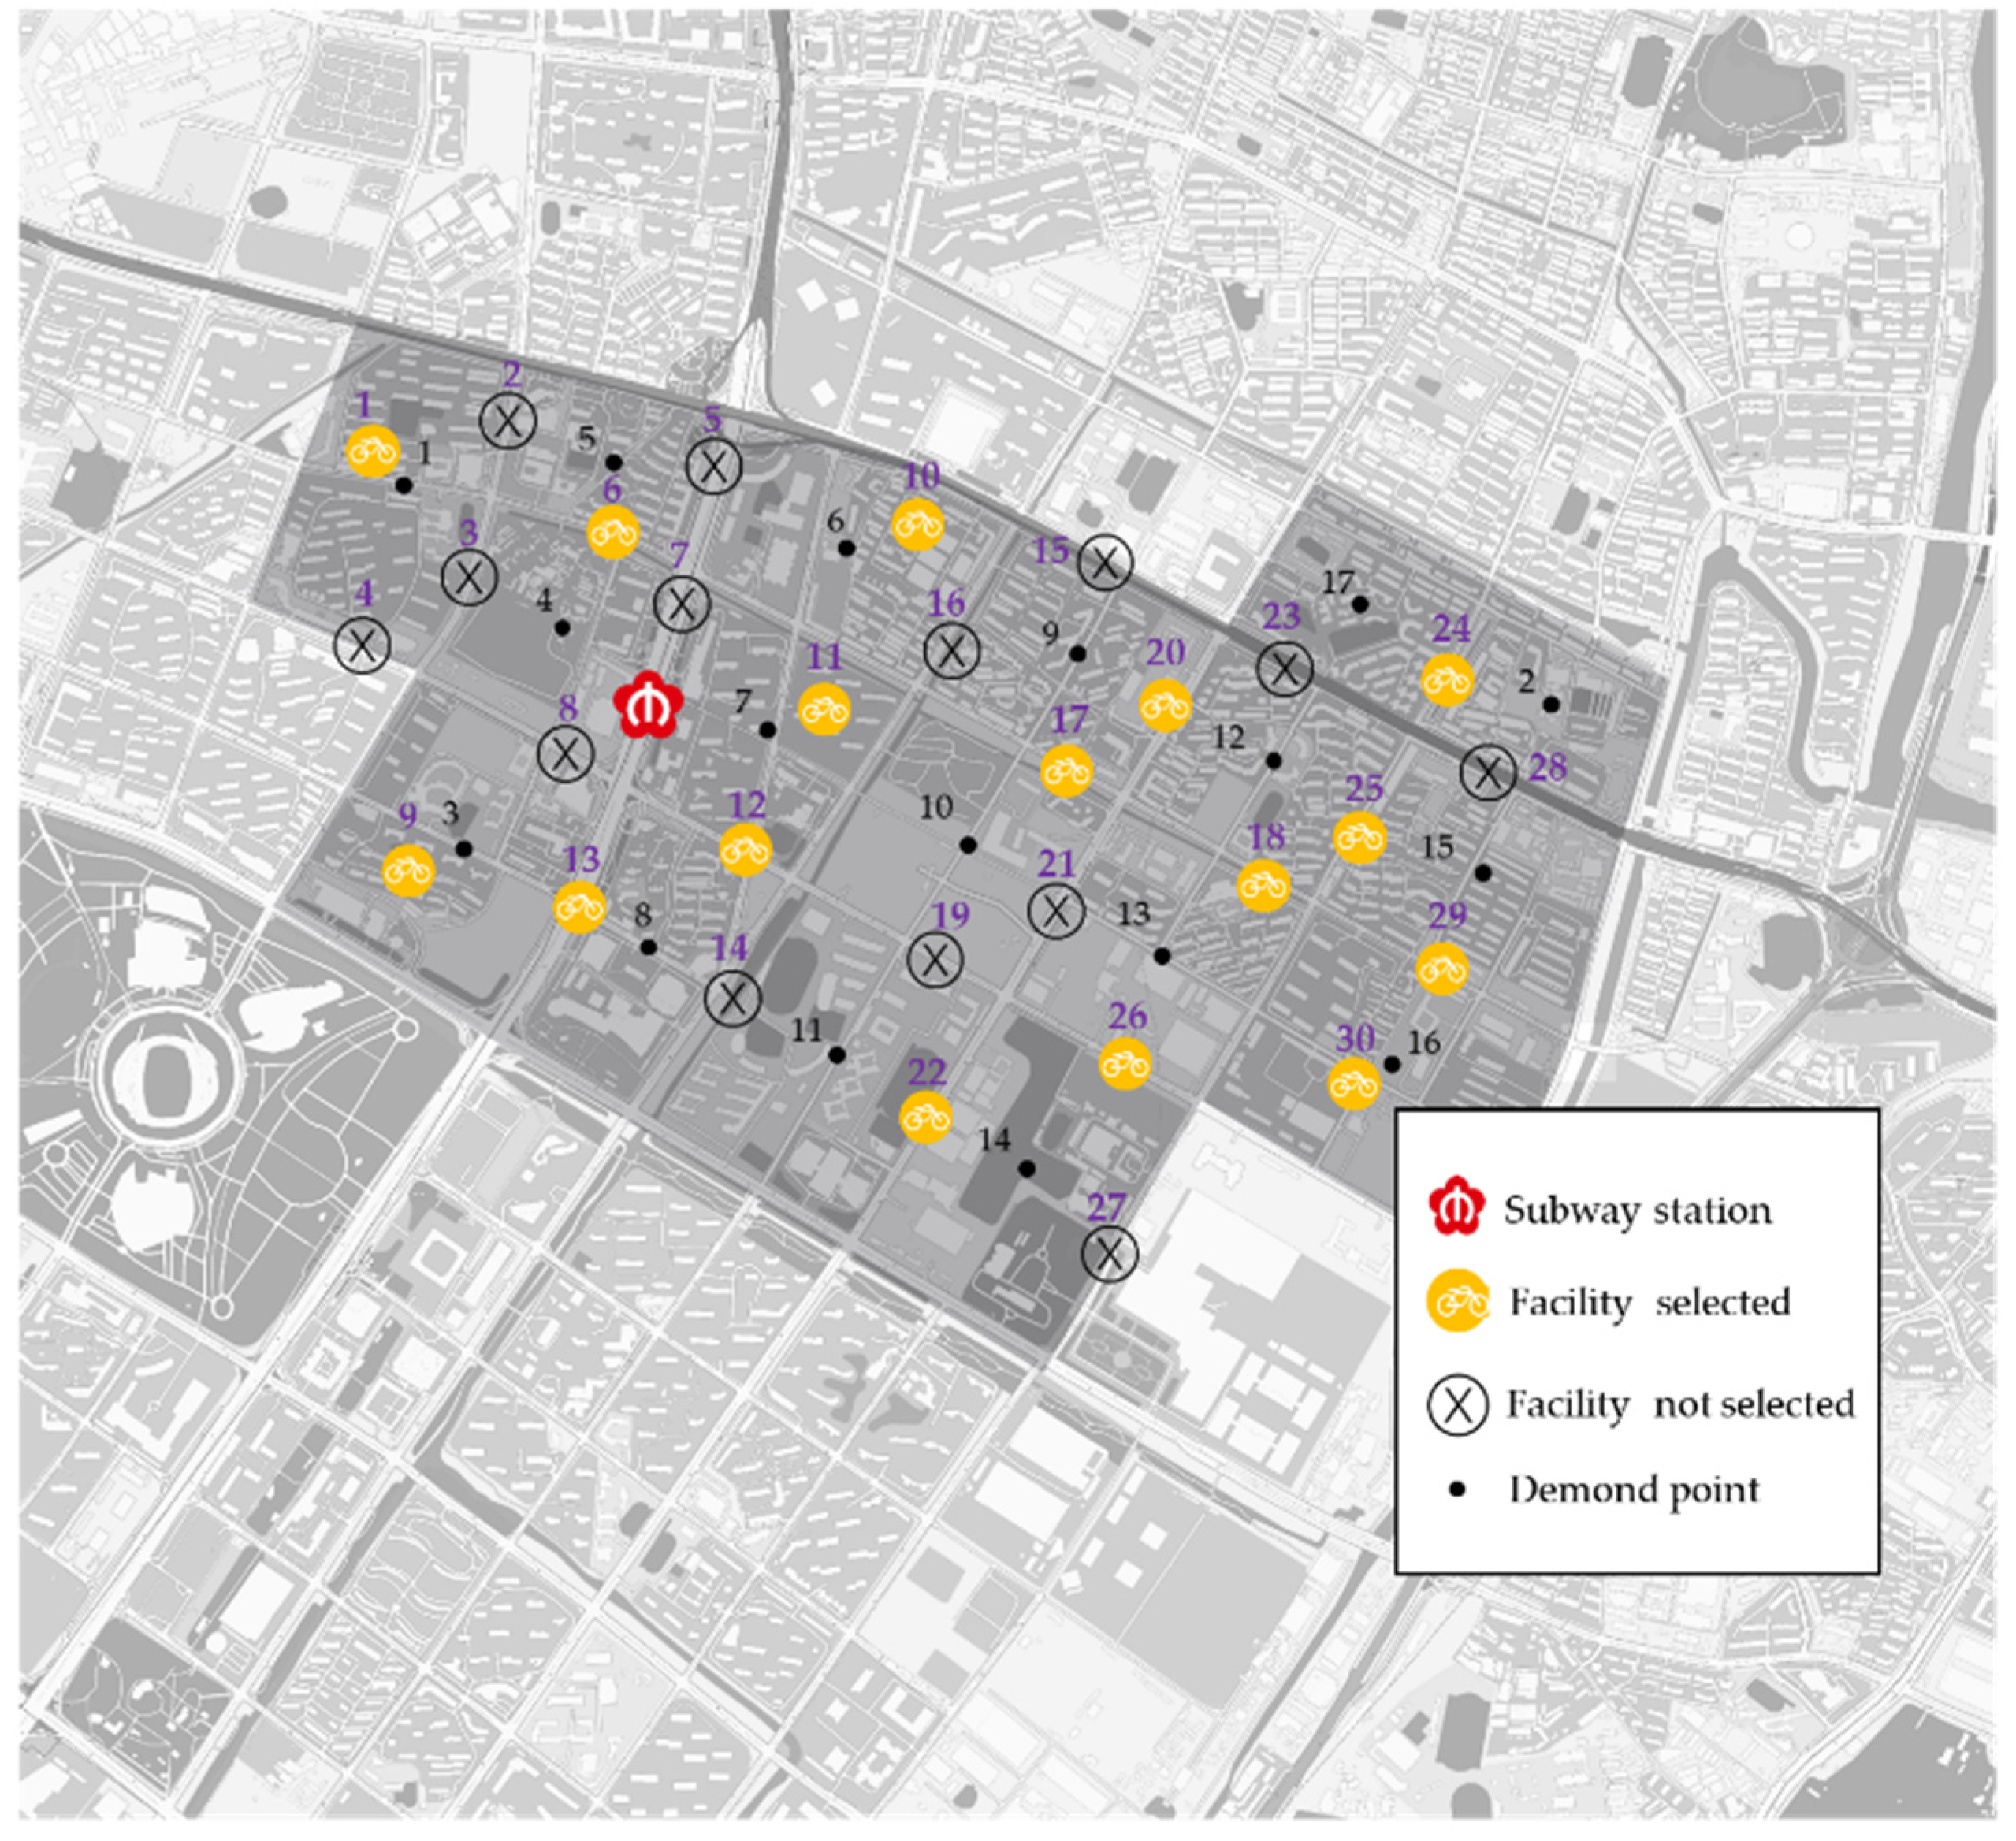
The model was solved according to the genetic algorithm process mentioned in the methodology section, and the first generation and optimal facility-layout schemes in the iterative operation of the algorithm were extracted. Figure 6 shows the spatial distribution of the first-generation scheme, and Figure 7 shows the distribution of the optimal plan of bike-sharing facilities. According to the calculation method for the initial allocation of bike-sharing facilities proposed above, the number of bikes allocated at each facility in the first generation and optimized schemes are shown in Table 3 and Table 4.
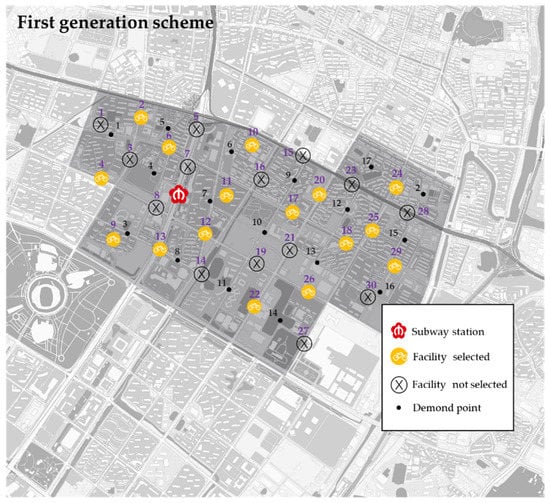
Figure 6.
The first-generation layout scheme of bike-sharing facilities.

Figure 7.
The optimized layout scheme of bike-sharing facilities.
Table 3.
The first-generation scheme and the number of shared bikes allocated.
Table 4.
The optimal scheme and the number of shared bikes allocated.
Through the comparative analysis of the first-generation scheme and the optimal scheme, the following conclusions can be obtained.
- Overall supply. The first-generation scheme was equipped with 16 shared bike facilities for a total of 477 shared bikes; the optimal plan was equipped with 20 facilities for 560 shared bikes. The optimal scheme increased the number of facilities compared to the first generation, which meant it could provide more shared bikes to meet potential transfer-ride demands.
- Spatial location. There was a certain difference between the optimal scheme and the first-generation scheme. The optimal scheme added facilities 5, 14, 19, 23 and 30 to serve the adjacent traffic zones, therefore, the travelers in traffic zones 1, 5, 11, 16 and 17 had more choices for transferring to the subway station, which reduced the transfer cost for travelers.
- Single-point allocation. Compared with the first-generation scheme, the optimal scheme had a more balanced bike allocation. The maximum number of bikes allocated in the first-generation scheme was 54 and the minimum was 10, and there was an overload penalty according to the number of bikes allocated exceeding the limitation. Correspondingly, the maximum number of bicycles allocated for the optimal scheme was 41 and the minimum was 14, which met the basic bike allocation requirement for facilities. Combined with real-time shared bicycle scheduling during peak periods, this could help avoid possible problems of bike accumulation and shortages.
In order to compare the first-generation scheme and the optimal scheme, this paper calculated the riding volumes, the facility operating costs, and the total transfer costs of the two schemes. Among these, riding volume is calculated in Equation (9), the facility operating cost is calculated in Equation (10), and the total transfer cost is calculated in Equation (11). Table 5 shows the values of each indicator of the first-generation scheme and the optimal scheme.
Table 5.
Comparison of various indicators between the schemes.
The optimal scheme has 20 bike-sharing facilities, and the total transfer cost is 30,235 yuan. Compared with the original plan, the total number of facilities increased by 4, and the riding volume is 1121, increasing by 17.4%. Transfer cost is reduced by 6.4%, and facility-operating cost is increased by 13.6%, which is mainly due to the increasing number of bike-sharing facilities and bikes. Although the total operating costs of the facility increased, the average facility operating costs declined by 9.1%. These results show that the facility layout and bike-sharing allocation of the optimal scheme are more reasonable and scientific. The principle of the optimization results includes the following two main aspects:
- The model optimization effect is related to the multi-objective weight of the facility layout in the transfer-influenced area. Theoretically, to maximize riding volume and minimize the number of facilities, it is necessary to reduce the transfer costs and choose the facility location with the shortest walking distance wherever possible, and provide sufficient shared bikes to meet demand. On the one hand, if the number of facilities is too small, the accumulation of a large number of shared bikes will increase the overload penalty corresponding to the number of transfer rides, while on the other hand, too many facilities will trigger resource waste penalties due to oversupply. Therefore, the optimal layout scheme needs to consider the comprehensive effect of multi-objective optimization at the same time, and solve the layout scheme with optimal comprehensive benefit.
- The optimization effect is related to the input parameters of the model. The bi-level programming model is an optimization model in which the upper-level location plan and the lower-level division interact each other and dynamically change. Assuming that the overall demand remains unchanged, changes in the single-use cost parameters of bike-sharing and bus will lead to changes in transfer cost, which will cause changes in the sharing rate of transfer modes, and indirectly affect the layout scheme. The total number of facilities supplied and the number of basic bikes allocated will directly affect the number of facilities and bikes allocated, which in turn has an impact on the final result of the sharing rate of transfer mode division.
3.5. Parameter Sensitivity Analysis
3.5.1. Multi-Objective Weight Parameter
In order to analyze the influence of the change of the weight coefficient of the objective function on the calculation results, the change trend of the transfer-ride volume and the generalized travel cost of transfer riding under the optimal scheme are calculated by changing the target weight from 0 to 1 (step length is 0.2), as shown in Figure 8.
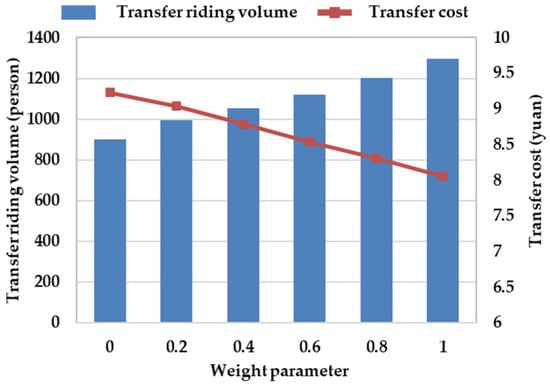
Figure 8.
Sensitivity analysis of transfer-ride volume with target weight.
The main discussions are as follows based on Figure 8.
- The target weight parameter has a significant impact on the overall transfer-ride volume. Therefore, within the range of acceptable facility operating costs, managers can appropriately adjust the weights in the objective function of the two-level programming model to obtain a more suitable configuration plan. This plan aims to increase the transfer-ride volume of shared bikes and promote the conversion of combined travel modes.
- Under the premise of controlling other input parameters unchanged, the transfer cost of a single transfer-ride is opposite to the change trend of the transfer-ride volume. That is, under the precondition of giving priority to the promotion of transferring and riding, the optimized configuration plan reduces the transfer-ride cost through the corresponding facility configuration, thereby enhancing the relative advantage of choosing walking and bus for transfer to the rail station, attracting more travelers choose the bike-sharing.
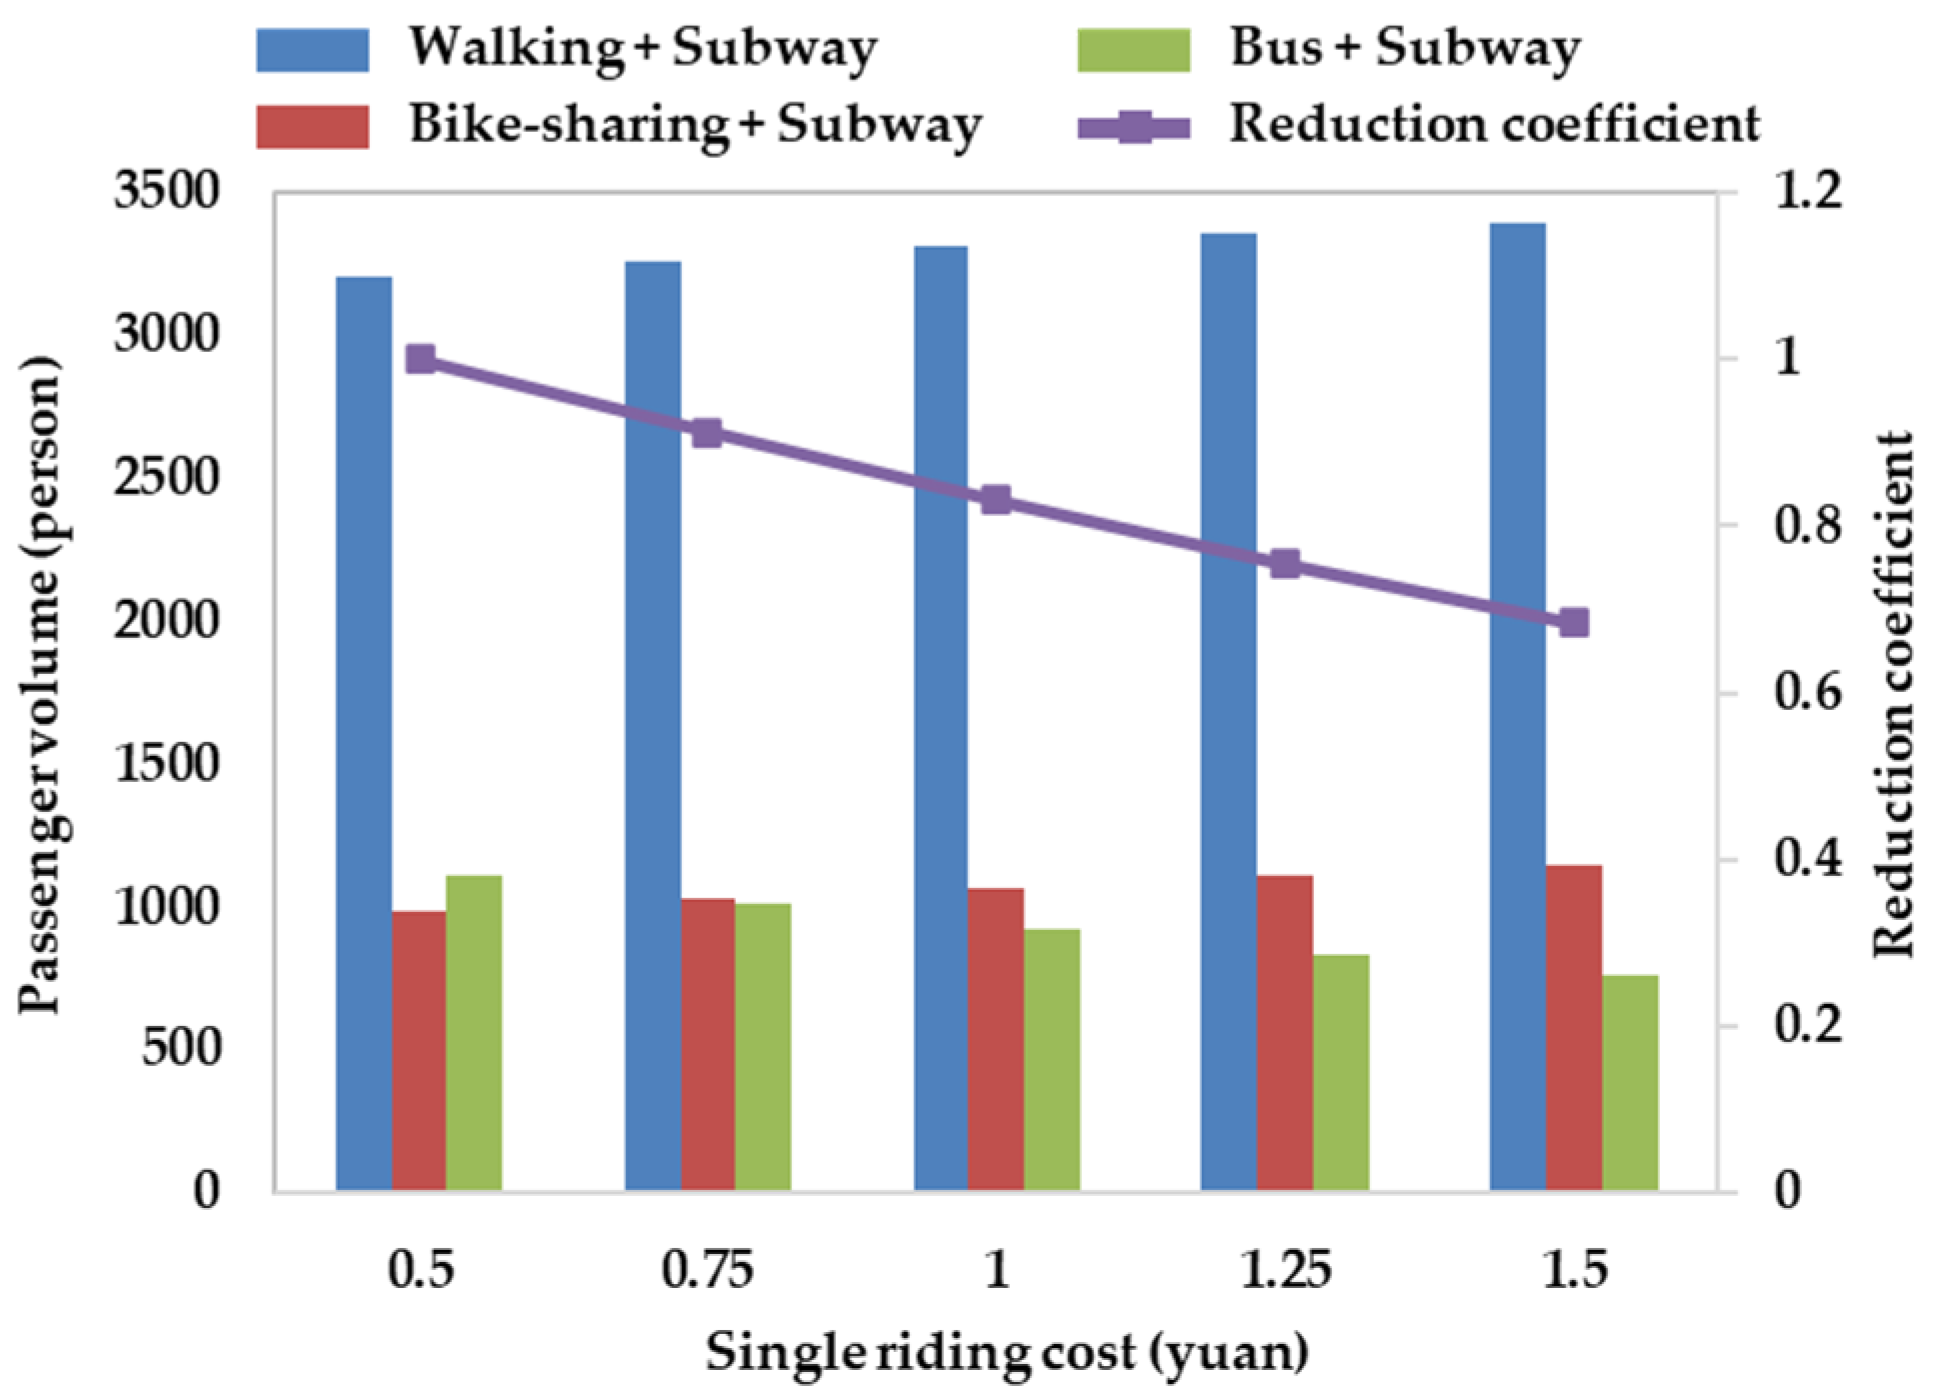
3.5.2. Single Ride Cost
The cost of a single ride has a significant impact on whether travelers choose bike-sharing to transfer to rail transit. In order to analyze the influence of the change of single-ride costs on the calculation results, the single-ride cost of bike-sharing was brought to the lower-level model as an influencing variable, other parameters were controlled to keep them constant, and the changes of three modes of rail transit combined travel in the transfer-influenced area were obtained, which are shown as Table 6 and Figure 9.
Table 6.
Volume variation of three modes.
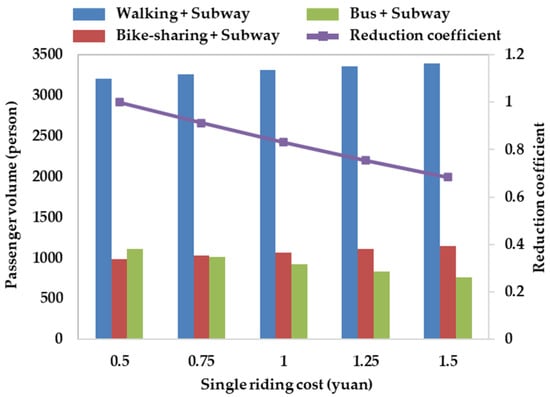
Figure 9.
Sensitivity analysis of single ride cost.
- Travelers who use bike-sharing to transfer to rail transit are more sensitive to the cost of a single trip. With the increase in the cost of a single bike-share ride, the change in the transfer volume of bike-sharing showed a gradual decline. When the cost was 0.5 yuan, the maximum volume of bike-sharing transferring to rail transit was 1121. The minimum volume was 758 when the cost was 1.5 yuan.
- With the increase in the single-ride cost of bike-sharing, the travelers who originally chose bike-sharing to transfer to rail transit changed to walking or bus, which indicates that while the transfer cost of bike-sharing is gradually increasing, some travelers are not willing to spend more and will choose alternative modes of transfer to rail transit.
- The above analysis shows that in order to increase the number of bike-sharing rides and guide travelers to choose the combined travel mode of “bike-sharing + subway” while rationally deploying facilities, formulating reasonable cycling prices or monthly subscription policies is an effective method.
3.5.3. Upper- and Lower-Limit Parameters of Bike-Sharing Allocation
The upper- and lower-limit parameters of the facilities determine the threshold of bike-sharing allocation for a single facility. The lower limit for a single facility is limited by the economic cost of a single facility and the accuracy of the electronic fence, and generally cannot be less than 10 bikes. The upper limit is limited by the actual available parking space on urban roads, and can theoretically affect the results of the optimal facility point scheme. In order to analyze the influence of the change in the upper limit parameter on the optimal layout and configuration scheme, the upper limit parameter is selected to change according to the step size of 10. The change trend of each key index is shown in Table 7 and Figure 10, and the Figure 11 shows the optimal scheme with 80 bikes. Table 8 shows the number of bikes allocated to the alternative facilities.
Table 7.
Change of optimal layout scheme with the upper limit.
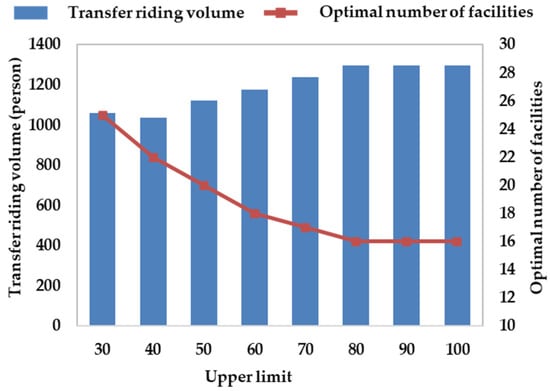
Figure 10.
Sensitivity analysis of upper limit of bike-sharing allocation.

Figure 11.
Optimal scheme of bike-sharing facilities with an upper limit of 80.
Table 8.
Optimal scheme and the number of bikes allocated with an upper limit of 80.
The main discussions are as follows.
- Under the premise that other parameters remain unchanged, the number of selected bike-sharing facilities would firstly decrease and then remain stable with the increase in the upper limit of bike-sharing allocation. If the upper limit parameter of a single facility is less than 80, the optimal layout and configuration scheme provides more choice for transferring and riding for travelers by adding facilities, and shares the ride demand of a single facility point as much as possible, so as to avoid the overload penalty of excessive demand on the comprehensive benefit value of a single point. If the upper limit parameter exceeds 80, as shown in Figure 10, theoretically all the travel needs of each traffic zone can be met by a single facility, and only the corresponding optimal facility points need to be deployed, so the layout and configuration scheme will no longer change, and the number of optimal facilities also no longer decrease. Compared with the first-generation scheme (Figure 6), we found that multiple sub-optimal facilities (such as 2, 4, 12) were selected. The transfer cost of bike-sharing was affected by the sub-optimal facility. Compared with the optimal facility scheme (Figure 7), the basic layout and configuration scheme is similar, because it is possible to build some facilities with large numbers of bikes (such as 1, 25, 26), so as to reduce the number of facility points.
- With the increase in the upper limit parameter, the transfer-ride volume increases at first and then remains stable. When the upper limit parameter is less than 80, the maximum supply of the optimal facility relative to a travel zone cannot meet all the transfer-ride needs, and travelers need to choose the next best neighboring facility, which affects the transfer-ride volume. When the upper limit parameter is greater than 80, this indicates that the supply of single facility point is sufficient, the original problem is equivalent to finding the scheme with the largest transfer-ride volume and the least number of facilities in the influenced area. At this time, all travelers in different traffic zones can meet the demand of transfer and riding by choosing the nearest facility, without causing overload penalty and reducing the comprehensive benefit value; therefore, the optimal scheme will no longer change, and the volume will no longer increase.
4. Conclusions
In this paper, based on the quantitative analysis of three competitive transfer modes, including “Bike-sharing + Subway” mode, “Walking + Subway” mode and “Bus + Subway” mode, a generalized travel cost function was established. The results showed that the combined travel choice was mainly affected by travel time, cost and other related factors. Through the two-dimensional spatial clustering analysis of cycling data in bike-sharing, it was found that the K value corresponding to the sum of squares of errors should be less than the inflection point of the curve, and the calculation of service radius of facilities in bike-sharing should be less than 250 m. This paper established a bi-level programming model of bike-sharing facility layout and configuration, and put forward a complete process from the prediction of alternative facilities in bike-sharing to scheme optimization. The heuristic genetic algorithm was used to solve NP-hard problems proposed in this paper. The results showed that the approximate optimal solution or satisfactory solution can be found under the conditions of acceptable memory and time cost, which has certain practical significance.
Finally, this paper selected Xinglongdajie Station of Nanjing Rail Transit Line 2 as a research case, discussed in detail the layout and configuration process of bike-sharing facilities in the transfer-influenced area, and conducted sensitivity analysis on key parameters. Based on the bi-level programming model, the solution result of this case was calculated. After optimization, the number of facilities in bike-sharing was 20, and the total travel cost was 30,235 yuan. Compared with the original plan, the number of facilities in bike-sharing increased by four, the number of people who changed to rail transit and bike-sharing increased by 166, the generalized travel cost decreased by 2065 yuan, the facility operation cost increased by 13.6% and the comprehensive evaluation index increased by 0.48. In addition, this paper also found that the multi-objective weight parameter had a significant impact on the overall transfer-ride volume and the travelers who used bike-sharing to transfer to rail transit were sensitive to the single-ride cost.
This paper proposed a systematic method of facility allocation and configuration in bike-sharing for the transfer-influenced area of urban rail transit. The results of the case verification showed that the optimization scheme proposed in this paper comprehensively considered the target requirements of transfer-ride volume, transfer cost and overload penalty. This paper may provide a reliable theoretical basis for the layout and configuration of bike-sharing facilities in the transfer-influenced area of rail transit stations. The method proposed in this paper can be applied to the layout and configuration of bike-sharing facilities in other urban rail transit stations. In this paper, in order to simplify the calculation and highlight the key points, only the travel modes with strong competitive relationships, namely, walking, bus and bike-sharing were considered in the analysis of the layout and configuration model. Travel modes such as cars and electric bicycles were not considered. The internal mechanisms and interaction within the facilities configuration of bike-sharing in the urban rail transit transfer-influenced area could be examined from a broader perspective if multiple travel modes can be integrated in later research. If user data can be obtained through additional surveys, such as interviews, then the calibration of the model parameters in this paper may achieve better results. It is worth noting that the case in this paper requires the collection of more updated data in subsequent stages to verify the effects of the optimization scheme.
Author Contributions
Conceptualization, H.Z. and Z.L.; Formal analysis, H.Z. and Z.L.; Funding acquisition, J.C.; Investigation, J.C.; Methodology, H.Z. and Z.L.; Writing—original draft, H.Z. and J.H.; Writing—review & editing, Z.L., J.H. and W.W. All authors have read and agreed to the published version of the manuscript.
Funding
This research was funded by the Key Project of National Natural Science Foundation of China (Grant No. 51638004), and the National Natural Science Foundation of China (Grant No. U20A20330, No. 52172317 and No. 71971059).
Institutional Review Board Statement
Not applicable.
Informed Consent Statement
Not applicable.
Data Availability Statement
The raw data used in this study are available from the corresponding author on request.
Conflicts of Interest
The authors declare no conflict of interest.
References
- Tolley, R. Sustainable Transport; CRC Press: Boca Raton, FL, USA, 2003. [Google Scholar]
- Márquez, L.; Soto, J.J. Integrating perceptions of safety and bicycle theft risk in the analysis of cycling infrastructure preferences. Transp. Res. Part A Policy Pract. 2021, 150, 285–301. [Google Scholar] [CrossRef]
- D’Apuzzo, M.; Santilli, D.; Evangelisti, A.; Nicolosi, V. Some Remarks on Soft Mobility: A New Engineered Approach to the Cycling Infrastructure Design. In Proceedings of the 21st International Conference on Computational Science and Its Applications(ICCSA 2021), Cagliari, Italy, 13–16 September 2021; pp. 441–456. [Google Scholar]
- D’Apuzzo, M.; Santilli, D.; Evangelisti, A.; Nicolosi, V. A conceptual framework for risk assessment in road safety of vulnerable users. In Proceedings of the 21st International Conference on Computational Science and Its Applications(ICCSA 2021), Cagliari, Italy, 13–16 September 2021; pp. 542–556. [Google Scholar]
- Libby, T.; Laura, S.; Charlie, Z.; Wesley, K.; Katy, L.; Bo, L.; Zachary, H.; Andrew, B.; Joseph, T.; Robert, J.S. Systemic Pedestrian Safety Analysis; The National Academies Press: Washington, DC, USA, 2018; p. 113. [Google Scholar]
- Santilli, D.; D’Apuzzo, M.; Evangelisti, A.; Nicolosi, V. Towards Sustainability: New Tools for Planning Urban Pedestrian Mobility. Sustainability 2021, 13, 9371. [Google Scholar] [CrossRef]
- Pucher, J.; Buehler, R. Cycling towards a more sustainable transport future. Transp. Rev. 2017, 37, 689–694. [Google Scholar] [CrossRef] [Green Version]
- Wang, Z.; Cheng, L.; Li, Y.; Li, Z. Spatiotemporal Characteristics of Bike-Sharing Usage around Rail Transit Stations: Evidence from Beijing, China. Sustainability 2020, 12, 1299. [Google Scholar] [CrossRef] [Green Version]
- Hao, J. Research on Layout Allocation of Shared Bicycle Facilities in Urban Rail Transit Interchange Affected Area. Master’s Thesis, Southeast University, Nanjing, China, 2020. [Google Scholar]
- Nair, R.; Miller-Hooks, E. Fleet Management for Vehicle Sharing Operations. Transp. Sci. 2010, 45, 524–540. [Google Scholar] [CrossRef]
- Shu, J.; Chou, M.C.; Liu, Q.; Teo, C.-P.; Wang, I.L. Models for Effective Deployment and Redistribution of Bicycles Within Public Bicycle-Sharing Systems. Oper. Res. 2013, 61, 1346–1359. [Google Scholar] [CrossRef]
- Lin, J.-R.; Yang, T.-H. Strategic design of public bicycle sharing systems with service level constraints. Transp. Res. Part E Logist. Transp. Rev. 2011, 47, 284–294. [Google Scholar] [CrossRef]
- Çelebi, D.; Yörüsün, A.; Işık, H. Bicycle sharing system design with capacity allocations. Transp. Res. Part B Methodol. 2018, 114, 86–98. [Google Scholar] [CrossRef]
- Yan, S.; Lu, C.-C.; Wang, M.-H. Stochastic fleet deployment models for public bicycle rental systems. Int. J. Sustain. Transp. 2018, 12, 39–52. [Google Scholar] [CrossRef]
- Frade, I.; Ribeiro, A. Bike-sharing stations: A maximal covering location approach. Transp. Res. Part A Policy Pract. 2015, 82, 216–227. [Google Scholar] [CrossRef]
- Martinez, L.M.; Caetano, L.; Eiró, T.; Cruz, F. An Optimisation Algorithm to Establish the Location of Stations of a Mixed Fleet Biking System: An Application to the City of Lisbon. Procedia Soc. Behav. Sci. 2012, 54, 513–524. [Google Scholar] [CrossRef] [Green Version]
- Jiang, Y. Research on the Demand Analysis and Rental Location of Urban Public Bicycles. Master’s Thesis, Southeast University, Nanjing, China, 2018. [Google Scholar]
- Yan, S.; Lin, J.-R.; Chen, Y.-C.; Xie, F.-R. Rental bike location and allocation under stochastic demands. Comput. Ind. Eng. 2017, 107, 1–11. [Google Scholar] [CrossRef]
- Caggiani, L.; Camporeale, R.; Ottomanelli, M.; Szeto, W.Y. A modeling framework for the dynamic management of free-floating bike-sharing systems. Transp. Res. Part C Emerg. Technol. 2018, 87, 159–182. [Google Scholar] [CrossRef]
- Reiss, S.; Bogenberger, K. Validation of a Relocation Strategy for Munich’s Bike Sharing System. Transp. Res. Procedia 2016, 19, 341–349. [Google Scholar] [CrossRef]
- Zhang, J.; Li, W.; Wang, G.; Yu, J. Feasibility Study of Transferring Shared Bicycle Users with Commuting Demand to Flex-Route Transit—A Case Study of Nanjing City, China. Sustainability 2021, 13, 6067. [Google Scholar] [CrossRef]
- Zhang, S.; Chen, L.; Li, Y. Shared Bicycle Distribution Connected to Subway Line Considering Citizens’ Morning Peak Social Characteristics for Urban Low-Carbon Development. Sustainability 2021, 13, 9263. [Google Scholar] [CrossRef]
- Liu, W. Study on Reasonable Attracting Scope of Bike Transfer to Rail Transit. Master’s Thesis, East China Jiaotong University, Nanchang, China, 2016. [Google Scholar]
- Kono, T.; Kishi, A.; Seita, E.; Yokoi, T. Limitations of using generalized transport costs to estimate changes in trip demand: A bias caused by the endogenous value of time. Transp. A Transp. Sci. 2018, 14, 192–209. [Google Scholar] [CrossRef]
- Lin, D.; Zhang, Y.; Zhu, R.; Meng, L. The analysis of catchment areas of metro stations using trajectory data generated by dockless shared bikes. Sustain. Cities Soc. 2019, 49, 101598. [Google Scholar] [CrossRef]
- Ai, Y.; Li, Z.; Gan, M. A solution to measure traveler’s transfer tolerance for walking mode and dockless bike-sharing mode. J. Supercomput. 2019, 75, 3140–3157. [Google Scholar] [CrossRef]
- Cascetta, E. Transportation Systems Analysis: Models and Applications; Springer: Berlin/Heidelberg, Germany, 2009; Volume 29, p. 742. [Google Scholar]
- He, L.; Li, X.; Chen, D. An Optimization Model of the Layout of Public Bike Rental Stations Based on B+R Mode. Lect. Notes Electr. Eng. 2014, 277, 1341–1348. [Google Scholar] [CrossRef]
- Lin, C.; Chen, Y.; Huang, J.; Xiang, X. A Survey on Models and Solutions of Multi-Objective Optimization for QoS in Services Computing. Chin. J. Comput. 2015, 38, 1907–1923. [Google Scholar] [CrossRef]
- Pei, Y.; Ma, B.; Yang, S. Analysis on the Competitiveness of Public Transport and Private Transportation of Urban Residents. J. Chongqing Univ. Technol. (Nat. Sci.) 2020, 34, 169–175. [Google Scholar]
- He, S. Analysis of Travel Mode Choice Behavior of Urban Residents Based on Generalized Cost. Mod. Transp. Technol. 2016, 13, 79–83. [Google Scholar] [CrossRef]
- Duan, C. Optimizing the Layout of Bike-sharing Rental Stations with Facility Disruption. Master’s Thesis, Chang’an University, Xi’an, China, 2017. [Google Scholar]
- Zhou, X.; Ling, X. Review on the theory and technology of genetic algorithm. Comput. Inf. Technol. 2010, 4, 37–39. [Google Scholar]


Publisher’s Note: MDPI stays neutral with regard to jurisdictional claims in published maps and institutional affiliations. |
© 2021 by the authors. Licensee MDPI, Basel, Switzerland. This article is an open access article distributed under the terms and conditions of the Creative Commons Attribution (CC BY) license (https://creativecommons.org/licenses/by/4.0/).