Article

Tyrosol, at the Concentration Found in Maltese Extra Virgin Olive Oil, Induces HL-60 Differentiation towards the Monocyte lineage

by
Lucienne Gatt
1,2,*,
David G. Saliba
2,3,
Pierre Schembri-Wismayer
4 and
Marion Zammit-Mangion
1,2
1
Department of Physiology and Biochemistry, Faculty of Medicine and Surgery, University of Malta, MSD 2080 Msida, Malta
2
Centre for Molecular Medicine and Biobanking, University of Malta, MSD 2080 Msida, Malta
3
Department of Applied Biomedical Science, Faculty of Health Science, University of Malta, MSD 2080 Msida, Malta
4
Department of Anatomy, Faculty of Medicine and Surgery, University of Malta, MSD 2080 Msida, Malta
*
Author to whom correspondence should be addressed.
Appl. Sci. 2021, 11(21), 10199; https://doi.org/10.3390/app112110199
Submission received: 30 July 2021 / Revised: 22 October 2021 / Accepted: 24 October 2021 / Published: 30 October 2021

Abstract

:
Tyrosol is a phenolic found in extra virgin olive oil (EVOO). In a Maltese monocultivar EVOO, it was present at a concentration of 9.23 ppm. The HL-60 acute myeloid leukaemia cell line, which can be differentiated to both monocytes and neutrophils, was exposed to tyrosol at this concentration and analysed for evidence of differentiation and effects of cytotoxicity. The polyphenol induced a 1.93-fold increase in cellular oxidative activity (p-value 0.044) and enhanced surface expression of CD11b and CD14. This indicates that tyrosol induces monocytic-like differentiation. An RNA-seq analysis confirmed the upregulation of monocyte genes and the loss of neutrophil genes concomitant with the bi-potential promyelocyte precursor moving down the monocytic pathway. A cell cycle analysis showed an accumulation of cells in the Sub G0/G1 phase following tyrosol exposure for 5 days, which coincided with an increase in apoptotic and necrotic markers. This indicates differentiation followed by cell death, unlike the positive monocyte differentiation control PMA. This selective cytotoxic effect following differentiation indicates therapeutic potential against leukaemia.

1. Introduction

Leukaemia is a myeloproliferative disorder characterised by uncontrolled proliferation of immature blasts in the bone marrow, eventually penetrating into the bloodstream, preventing normal haematopoiesis [1,2]. Such blasts suffer an obstruction during early development, referred to as a maturation arrest, and fail to reach functional maturity [3,4]. In acute promyelocytic leukaemia (APL), this arrest may be reversed by using all trans retinoic acid (ATRA), an approach called differentiation therapy, that has completely altered this leukaemia’s prognosis [5,6]. It generally shows less toxic side effects than chemotherapy [7]. Hence, reproducing the success of differentiation therapy on different leukaemia types is a much sought-after goal.
The HL-60 cell line consists of immature cells arrested at the myeloblast-promyelocyte stage and is well-characterised in terms of the induction of terminal differentiation down either the monocytic or granulocytic pathway. Dimethyl sulfoxide (DMSO) and ATRA drive HL-60 to granulocytic differentiation, whilst 1,25-dihydroxy vitamin D3, sodium butyrate and phorbol esters drive them towards monocytes/macrophages [8]. Such maturation is accompanied by a reduction in cell size, the condensation of nuclear material, and changes in cell surface antigens such as CD11b and CD14 surface markers [8,9,10]. Gene expression analysis in differentiating HL-60 treated cells show an increase in genes associated with the oxidative burst [11,12], cytokine upregulation [13], adhesion, and trans-endothelial migration such ICAM adhesion molecules [12,14]. Following differentiation, an increase in the expression of apoptotic-related genes may follow as these cells naturally die, which is the end point of successful differentiation therapy [14,15].
Polyphenols are a group of highly diverse molecules found extra virgin olive oils (EVOOs) and other plant sources and are associated with chemo-preventive functions and differentiation-inducing properties [16]. They are secondary metabolites that appear to offer protection against solar irradiation as well as anti-microbial and anti-pathogenic activity. They are classified into phenolic acids (hydroxycinnamic and hydroxybenzoic acids), phenolic alcohols, lignans, stilbenes, secoiridoids, coumarins, xanthones, and flavonoids. The major components of the phenolic fraction in EVOOs are tyrosol, hydroxytyrosol, and their derivatives [17]. The former, tyrosol, is known to increase in concentration during olive oil storage [18]. The phenolic profiles of Maltese EVOOs have been characterized by Lia et al., 2019 and Gatt et al., 2021 [19,20].
Differentiation-induction in leukaemia has been attributed to oleuropein, apigenin-7-glucoside, hydroxytyrosol, the dialdehydic compound of elenoic acid linked to hydroxytyrosol, as well as pinoresinol, amongst EVOO-derived polyphenols [21,22,23]. Moreover, hydroxytyrosol was noted to bring about HL-60 cell proliferation arrest at the G0/G1 phase and upregulate the cyclin-dependent protein kinase inhibitors p21 WAF1/CIP1 and p27 KIP1 [24]. Transcriptomic studies in AML models following phenolic administration do not appear to be published.
This study investigated whether tyrosol could induce HL-60 differentiation using biochemical and morphological assays. The effects on the cell cycle, as well as the transcriptomic changes following exposure to tyrosol treatment, were then explored. Changes to the NFκB pathway and the Interferon Regulatory Factors network are identified.

2. Materials and Methods

2.1. Reagents

Dimethyl sulfoxide (DMSO), ethylenediaminetetraacetic acid (EDTA), fetal bovine serum (FBS), hexane, histopaque, hydrochloric acid (HCl), Leishman stain, methanol, nitroblue tetrazolium chloride (NBT), penicillin streptomycin solution (Pen Strep), phorbol-12-myristate 13-acetate (PMA), phosphate buffered saline (PBS), phytohaemagglutinin (PHA), Roswell park memorial institute (RPMI-1640) medium, thiazolyl blue tetrazolium bromide (MTT), trypan blue, and tyrosol were acquired from Sigma-Aldrich® (St Louis, MO, USA). The identification of tyrosol was confirmed by Innovhub Stazioni Sperimentali per l’industria, Milan using HPLC analysis. Absolute ethanol and potassium hydroxide (KOH) were obtained from Scharlau (China). Antibodies and isotypes were obtained from Becton Dickinson, Mountain View, CA, USA.

2.2. Cell Culture

HL-60 cells (Acute myeloid Leukaemia) were purchased from Cell Lines services (CLS) GMBH, Eppelheim, Germany, Cryovial no. 330209. The cells were cultured in Roswell Park Memorial Institute (RPMI-1640) medium supplemented in 10% foetal bovine serum (FBS) and 1% penicillin-streptomycin (pen-strep) at 37 °C, 5% CO2, and 95% relative humidity.

2.3. Phenolic Extraction and Identification

Phenolics were extracted from a Maltese monocultivar EVOO variety using liquid-liquid extraction (LLE) in a 60:40 (v/v) methanol:water mixture [20]. The phenolic extract was then characterized using HPLC analysis through the use of phenolic standards (Supplementary File S1).

2.4. Induction of Differentiation

The phenolic extracts were tested for differentiating activity at a range of concentrations on HL-60 cells. Exponentially growing cells (50 µL) were seeded at a concentration of 1 × 10⁵ cells/mL into separate wells of a 96-well plate and treated with the crude EVOO phenolic extract at 100 ppm, 10 ppm and 1 ppm. Within the 100ppm crude phenolic extract that was found to be effective at inducing differentiation (Supplementary Figure S1), tyrosol constituted a peak area of 9.23% or a concentration of 9.23 ppm. This concentration of the pure tyrosol purchased from the chemical suppliers was therefore used for all subsequent experiments outlined in this section. Exponentially growing cells (50 µL) were again seeded at a concentration of 1 × 10⁵ cells/mL into separate wells of a 96-well plate and treated with 50 µL test reagent (9.23 ppm tyrosol), positive controls phorbol myristate acetate (PMA) at a concentration of 10 nM for monocytic differentiation, and 1.6% dimethyl sulfoxide (DMSO) for granulocytic differentiation, as well as 0.5% ethanol as the vehicle control. The negative control consisted of untreated cells in RPMI medium. All conditions were prepared in complete RPMI. All tests were carried out in triplicate and repeated as three separate experiments (n = 9).

2.5. Evaluation of Differentiation

Cell proliferation was assessed using the MTT assay, which is characterised by the reduction of yellow MTT to purple formazan catalysed by mitochondrial dehydrogenases [25]. After 3 and 5 days, 20 µL of a solution of 5 mg/mL MTT:PBS were added to each well and incubated for 4 h at 37 °C. The formazan crystals were then dissolved by the addition of 120 µL of DMSO, and the absorbance read at 570 nm [26]. The differentiation capacity was tested using the NBT assay. After 3 and 5 days, 100 µL of activated NBT (2 mg/mL NBT:PBS + 1% PMA) was added to each well, and the plate was incubated for 20 min at 37 °C and 5% CO2. Next, 70 µL of 1M HCl followed by 50 µL of 2M KOH and 150 µL of DMSO were added, and the absorbance read at 630 nm, with 405 nm as the reference wavelength [27]. The index of differentiation was then evaluated by dividing NBT by MTT.

2.6. Assessment of the Specificity of the Anti-Proliferative Action

The effect of tyrosol on lymphocytes was tested to assess whether any anti-proliferative activity exhibited by tyrosol was specific and limited to leukaemia cells. Blood from healthy donors was obtained from the National Blood Transfusion Service (as approved by the University of Malta, Faculty of Medicine and Surgery Research Ethics Committee FRECMDS1718_073) and was processed to isolate mononuclear cells through density-gradient centrifugation using filtered histopaque. The cells were incubated overnight to allow adherence and thus separation of the monocyte fraction. The lymphocytes were collected, stimulated with 2% phytohaemagglutinin for lymphocyte proliferation [28,29], then incubated at a temperature of 37 °C and a 5% CO2 concentration for 2 days. The MTT assay was repeated to test for proliferative activity.

2.7. Leishman’s Stain for Visualization of Morphological Changes

The experimental steps described in Section 2.4 above were repeated. At days 3 and 5, cells were cytocentrifuged at 1000× g for 5 min using Cytospin 2 (Shandon), fixed by air-drying, and then stained using Leishman’s stain and buffer for 15 min, rinsed, and once again dried. They were then viewed via the oil immersion technique using an inverted microscope (Motic, Barcelona, Spain, AE2000).

2.8. Evaluation of the Expression of Differentiation Specific Cell Markers by Flow Cytometry

HL-60 cells were assessed for differentiation by flow cytometry at the designated time points using the FACS Calibur™ flow cytometer. The antibodies selected were the PE-conjugated Mouse Anti-Human CD14 for monocytic differentiation and the Alexa Fluor® 488-conjugated Mouse Anti-Human CD11b for granulocytic and monocytic differentiation. The isotype controls selected were the PE-conjugated Mouse IgG2b, κ and Alexa Fluor® 488-conjugated Mouse IgG1, κ.
After treatment of HL-60 cells, 1 × 10⁶ cells were washed with PBS and incubated at room temperature with blocking agent (2 mM EDTA and 10% FBS in PBS) for 10 min. The cells were then incubated with the antibodies or isotypes respectively for 30 min, on ice and in the dark. Following three consecutive washes with Tween wash buffer (0.1% Tween in PBS) and resuspension in staining buffer (2% FBS, 1% human serum and 0.1% sodium azide in 0.05M Tris Buffered Saline solution at pH 7.4), the samples were read using CellQuest™ Pro (Becton Dickinson, Mountain View, CA, USA). Histogram statistics were used to determine the percentage of HL-60 cells that were CD11b and CD14 positive (% positive gated cells). Statistical tests were carried out using IBM® SPSS® Statistics Version 21 (Armonk, NY, USA) to identify significantly different values.

2.9. Cell Cycle Analysis by Flow Cytometry

HL-60 cells were synchronized in the G0/G1 phase for the cell cycle analysis by serum starvation for 24 h. Then, cells (1.5 mL) were seeded in 12-well plates at a concentration of 1 × 10⁶ viable cells/mL along with 1.5 mL treatment and incubated at a temperature of 37 °C and 5% CO2. On Days 1, 3, and 5 of the experiment, cells were harvested then washed with PBS and fixed in 70% ethanol at 4 °C for 30 min. For DNA staining, samples were washed twice in PBS and centrifuged at 805× g for 5 min. To the pellet, 200 µL of Ribonuclease A in PBS at a concentration of 100 µg/mL and 200 µL of a 50 µg/mL propidium iodide solution were added. Samples were then incubated at a temperature of 37 °C and a 5% CO2 concentration for an hour. Samples were read using the FACS CaliburTM and CellQuest™ Pro software using the FL2 channel. For each sample, 1 × 10⁴ events were acquired. For gating, debris was excluded and the percentage of cells in the Sub G0/G1, G0/G1, S, and G2/M phases was determined. Analysis was carried out on four samples per condition.

2.10. Investigation of the Molecular Mechanism of Differentiation

Treated and untreated HL-60 cells were seeded at a final concentration of 1 × 10⁶ viable cells/mL in 6-well plates (1.5 mL cells and 1.5 mL treatment) and incubated at 37 °C and 5% CO2. Following 1, 6, and 12 h, the cells were harvested by centrifugation at 400× g for 5 min, the supernatant decanted, and the cell pellet resuspended completely in 350 µL QIAzol Lysis Reagent (Qiagen), then treated according to the manufacturer’s instructions and stored at −80 °C. The RNA concentrations and A260/280 values were determined using the NanoDrop 2000 UV-Vis Spectrophotometer (Thermo Scientific, Waltham, MA, USA), while the RNA integrity was determined by electrophoresis on an agarose gel. RNA sequencing using an Illumina HiSeq 2000 was performed by the European Molecular Biology Laboratory (EMBL) in Heidelberg, Germany.

2.11. RNA-Seq Data Analysis

Raw FastQ data were mapped to the human GRCH37_hg19 genome assembly using TopHat. The RNA-seq quantitation pipeline in SeqMonk software (www.bioinformatics.babraham.ac.uk/projects/seqmonk, accessed date 28 June 2020; v1.39.0) was used to quantitate the mapped reads at mRNA level. Opposing strand-specific quantitation was performed using mRNA transcript features, corrected for transcript length; log-transformed and cumulative distributions normalized across samples. Differentially expressed (DE) genes were determined using DEseq2 (p < 0.01, with multiple testing correction) and Intensity difference filter (p < 0.05, with multiple testing correction). DE genes common to both statistical tests generated the list of high confidence gene list used in downstream analyses. Briefly, STRING analysis of positively DE 101 genes (+Tyrosol/RPMI control) was visualised in Cytoscape (v11.0). Markov clustering algorithm [30] was performed to determine DE genes with high degree of adjacency. Reactome (reactome.org – accessed date 28 June 2020) was used to determine if DE genes are found in particular regulatory pathways than is predicted by chance.

2.12. Statistical Analysis

Using the software IBM® SPSS® Statistics Version 21, all data sets were tested for normality using the Shapiro–Wilk test. The Kruskal–Wallis test was selected as the non-parametric test for pairwise comparisons, with significant comparisons having a p-value less than 0.05.

2.13. Summary of the Study

The design of this study is summarised in Figure 1.

3. Results

Following the phenolic extraction of a Maltese monocultivar EVOO variety using LLE, its characterization revealed that tyrosol was present at a concentration of 9.23 ppm. As a result, this concentration was used for all subsequent experiments.

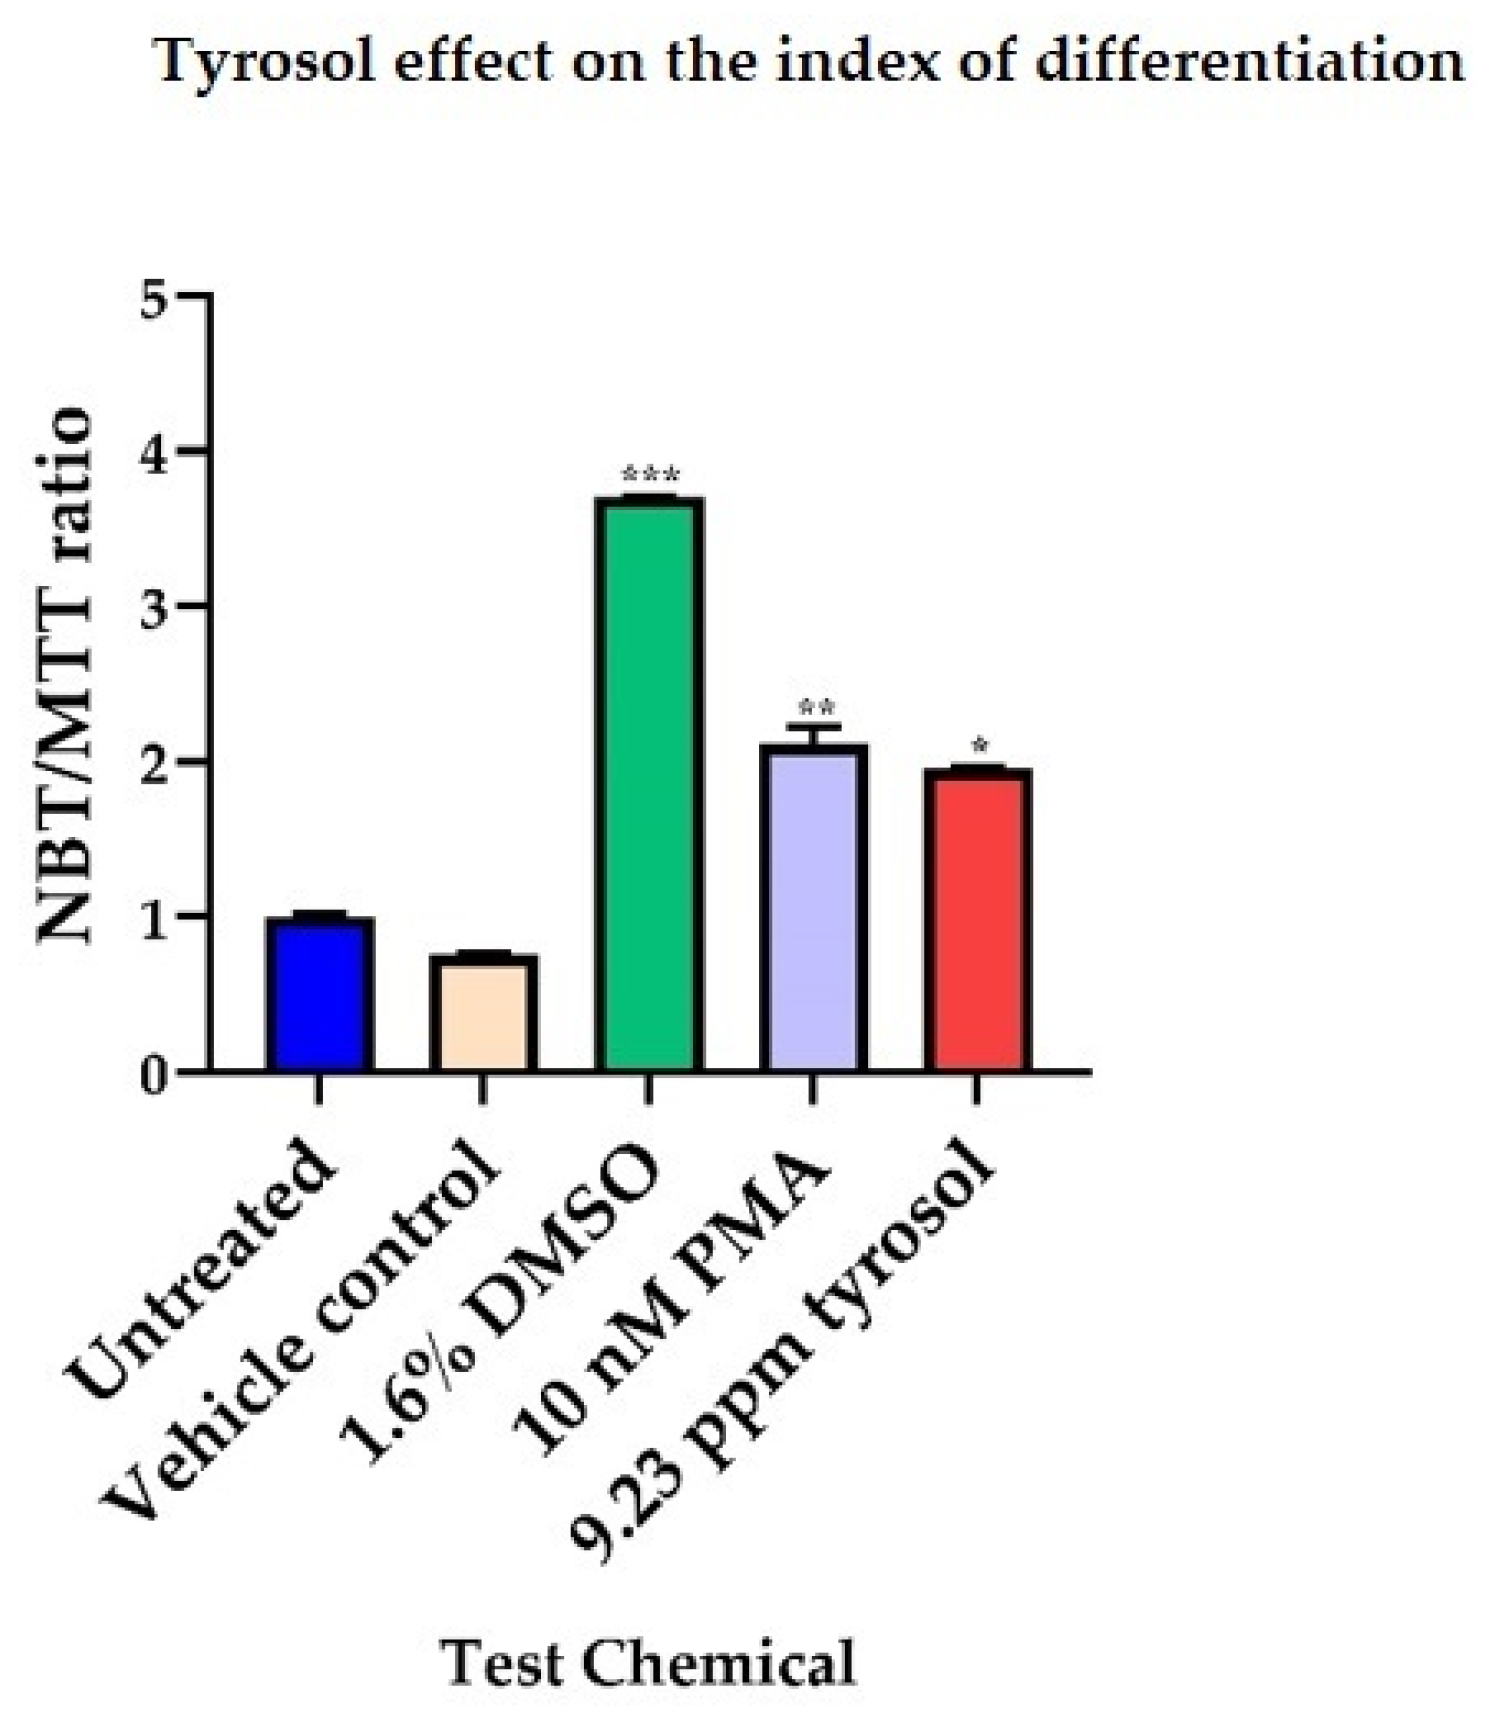
3.1. Tyrosol Shows Differentiating Activity in HL-60 Cells

Tyrosol induced a 1.93-fold increase (p < 0.05) in cellular oxidative activity compared to the untreated negative control on day 3 (Figure 2), indicating increased myeloid cell maturation. The same concentration of tyrosol was tested on lymphocytes, and no increase in cytotoxicity was noted over a period of 3 days (Figure 3).

3.2. Morphological Analysis of Tyrosol-Exposed HL-60 Cells Show Evidence of Monocytic Differentiation

A morphological analysis of the HL-60 cells post-tyrosol exposure using Leishman’s staining (Figure 4) was carried out. This confirmed the presence of morphological changes associated with white cell progenitor (leukaemia blast) differentiation in HL-60 cells treated with the positive controls (Figure 4C–F), as well as with tyrosol (Figure 4G,H). Visible changes included the presence of vacuoles, a decreased nuclear/cytoplasmic ratio, a more irregular shape, a reduction in the number of nucleoli, and reduced cell numbers (due to reduced proliferation). Since, as evident in Figure 2 and Figure 4, no differentiation-inducing effect was seen for the vehicle control, this was not included in subsequent experiments.

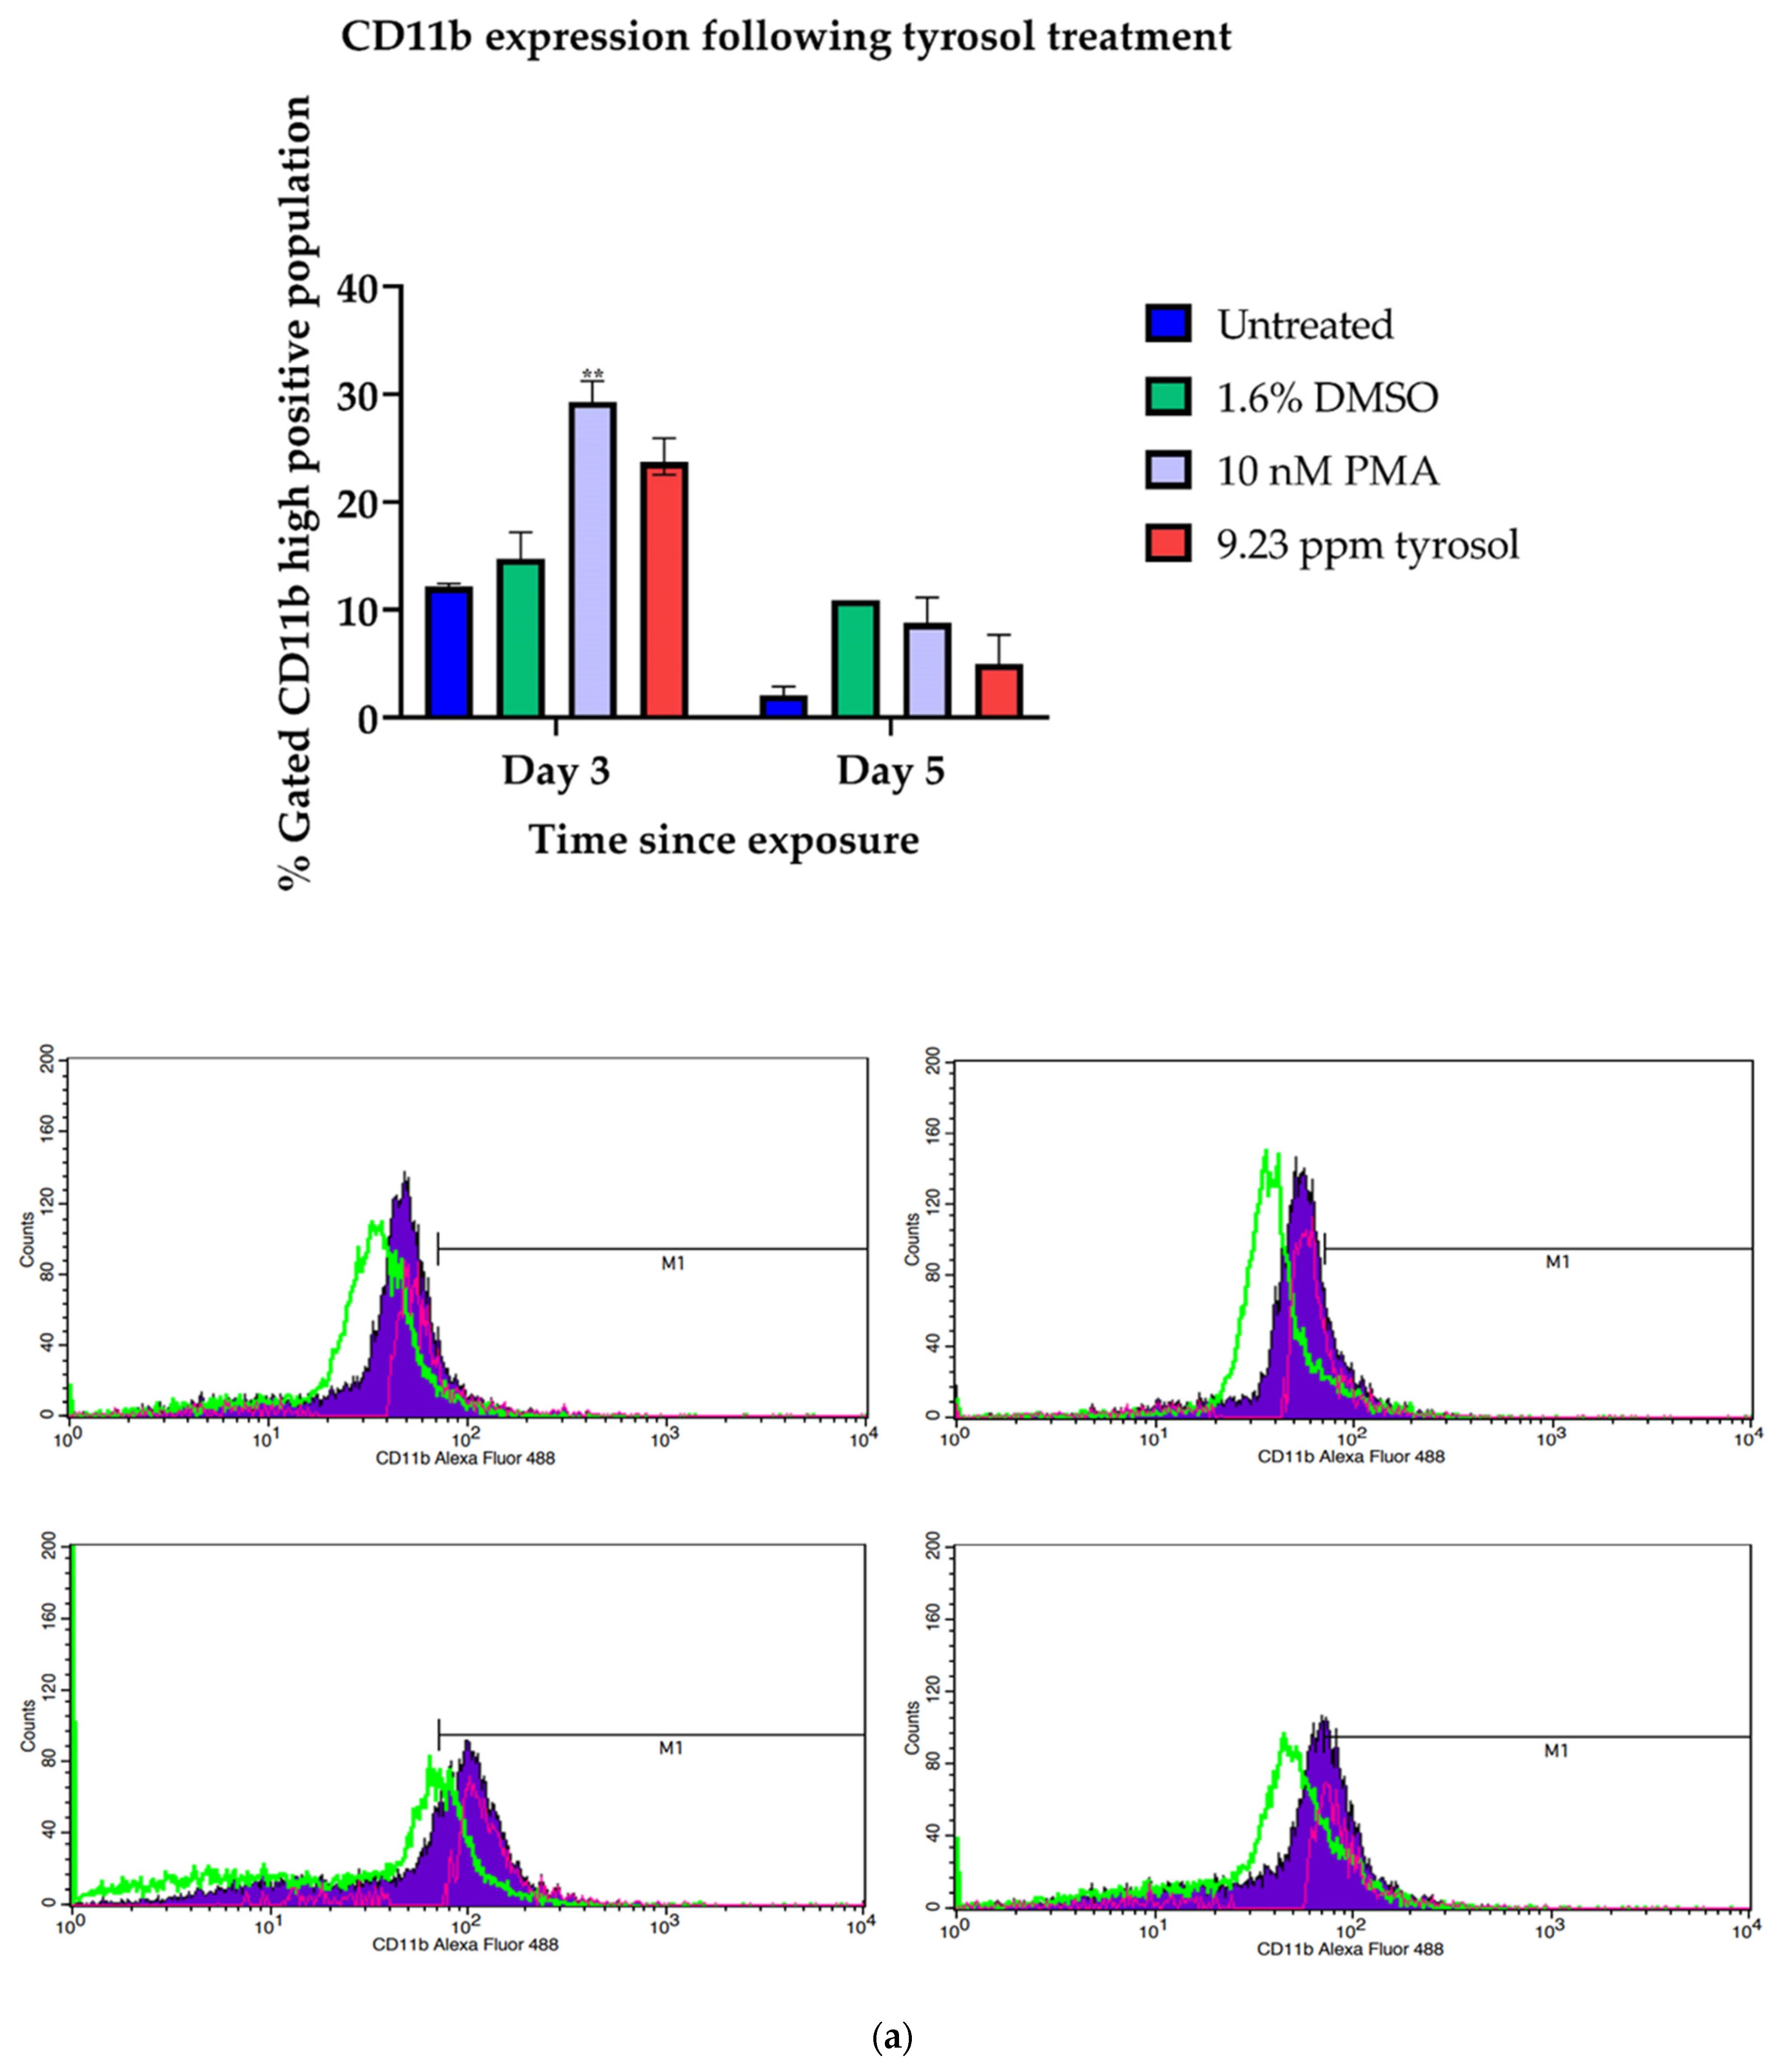
3.3. Tyrosol Stimulates the Expression of CD11b and CD14 Surface Antigens in Hl-60 Cells

Tyrosol-exposed cells were assessed with flow cytometry for changes in the expression of cell surface markers. Tyrosol treatment was found to enhance the surface expression of CD11b and CD14 with peak expression in both cases happening 3 days after exposure as with the monocytic differentiation positive control PMA (Figure 5a,b, respectively).
CD11b is an integrin marker expressed by leukocytes during the inflammatory response and is associated with leukocyte adhesion and migration. High CD11b populations were recorded at 23.70% (day 3) for tyrosol and were comparable to the 29.31% (day 3) recorded with the positive control (PMA) associated with the induction of monocyte differentiation (Figure 5a). There was no statistically significant difference between CD11b expression following tyrosol treatment and CD11b expression following PMA treatment.
CD14 is an antigen expressed by monocytes and macrophages and is associated with participation in binding of lipopolysaccharide. For CD14, the effect of tyrosol was again similar to that of PMA with CD14 high populations reported at 14.11% (day 3) and 4.38% (day 5) after tyrosol treatment compared to 16.61% (day 3) and 4.03% (day 5) after PMA application (Figure 5b). There was no statistically significant difference between CD14 expression following tyrosol and PMA exposure. Both these results confirm that tyrosol is inducing differentiation along a monocytic pathway.

3.4. Tyrosol Induces Apoptosis in Hl-60 Associated with a Reduction in Cells in the G1 and S Phases

There are numerous reports of the inhibition of cell proliferation and even cancer chemo-preventive effects by EVOO phenols [24,31,32]. To further explore the observed reduction in cell numbers (MTT assay—Supplementary Figure S2), the cell cycle status of tyrosol-exposed cells was analysed. The exposure of HL-60 cells to tyrosol resulted in a marked increase in cells in the Sub G0/G1 section (Figure 6). This suggests a significant difference in mechanism from the positive controls, with tyrosol appearing to induce cell death following induced differentiation. This appears to coincide with a reduction in the G0/G1 and S phase, with cells accumulating in the G2M phase of the cycle. This may suggest that tyrosol-exposed cells cannot progress beyond G2M, and when attempting to do so, they proceed to cellular demise.
To assess the mechanism of tyrosol-induced cell death, Annexin V/PI staining was performed and analysed by flow cytometry (Figure 7). Tyrosol exposure causes cells to primarily undergo apoptosis, with cells on day 5 showing late apoptosis (35.52%), as well as necrosis (9.35%). This contrasts with the results obtained for both differentiation controls, which do not appear to induce significant amounts of cell death by day 5, with cells (21.28% and 19.25% for DMSO and PMA, respectively) appearing to be in early apoptosis. These results indicate that the polyphenol tested here arrests the leukaemia cell line, subsequently inducing apoptosis.

3.5. Tyrosol Downregulates Neutrophil and Cholesterol Biosynthesis Genes and Upregulates Monocytic Differentiation Genes

In order to determine the Tyrosol-mediated global gene expression changes in the ATRA-resistant HL-60 cell line, an RNA-seq analysis was performed after stimulation with Tyrosol for 1, 6, and 12 h. This defined a total of 199 differentially expressed (DE) genes (DEseq2 p < 0.01 and Intensity Difference filter p < 0.05, with multiple testing correction), with 142 genes resulting in increased expression, whilst 57 genes were decreased in expression (Supplementary Table S1).
Figure 8A,B show the hierarchical clustering of the negative and positively regulated genes respectively. In order to explore the biological significance of negatively regulated genes we used Reactome pathway analysis (Reactome.org). This revealed Neutrophil Degranulation (FDR: 5.10 × 10⁻¹³) as an important process that is downregulated upon Tyrosol treatment across the timepoints and include the genes CEACAM6, CLEC5A, FPR1, SERPINA1, ELANE, AZU1, and PRG2. Moreover, the tyrosol treatment resulted in decreased expression of Cholesterol biosynthesis (FDR: 1.28 × 10⁻⁸) related genes including LSS, SQLE, ACAT2, DHCR7 HMGCS1, and FDFT1.
We used STRING analysis of the 143 positively regulated genes, which revealed a network of 130 genes (p-value < 1 × 10⁻¹⁶). These are displayed to minimize the energy of the system based on the confidence score for interactions (Figure 8C). Gene Ontology (GO) analysis revealed a Myeloid differentiation process (FDR: 0.0001) with upregulated genes including the genes OSCAR, VEGFA, IFI16, JUNB, GAB2, and RELB (Figure 8C). We observed key monocyte-derived macrophage (Figure 8D) and dendritic cell (Figure 8E) genes, including transcription factors IRF1, IRF7, STAT2, RelB, NFKB2, ATF3, and BCL3 and chemokines CCL3 and CCL4 [33,34,35].
A Markov clustering algorithm highlighted six modules with five or more nodes displaying a high degree of adjacency [30] (Figure 8F). In addition, the functional annotation of the promoters of the upregulated genes by DAVID (v6.8) revealed NF-κb, AP-1, and ISRE (p-value < 0.001) binding sites highlighting the role of these transcription factors as regulators of the tyrosol induced gene network [36] (Figure 8G).

4. Discussion

In this study, the differentiation-inducing effect of the pure polyphenol tyrosol at the concentration found in the ‘Bidni’ Maltese EVOO variety is described. Evidence of significant differentiation and a change in cell maturation was shown through biochemical assays, the assessment of cell surface marker expression, the observation of morphological features, and transcription analysis. Critically, we also observed that the anti-proliferative action of tyrosol on HL-60 cells is specific, as no cytotoxicity was observed when the same polyphenol was tested on non-malignant human lymphocytes.
The differentiating activity and inhibition of cell proliferation of HL-60 cells has been reported elsewhere using EVOO crude polyphenol extracts. Fabiani et al., 2006 suggested that this effect is partially a result of dialdehydic forms of elenoic acid linked to hydroxytyrosol (3,4-DHPEA-EDA) and tyrosol (pHPEA-EDA) present in the phenolic extract while Crescimanno et al., 2009 reported that the composition of their crude extract contained 3,4-DHPEA, pHPEA, 3,4-DHPEA-EDA, pHPEA-EDA, and 3,4-HPEA-EDA (oleuropein aglycone) [21,32]. In this study, the pure compound pHPEA was used allowing the confirmation that differentiation was due to a single bioactive agent. In addition, an extended testing time-frame of 3 and 5 days, respectively, was used. Since marked oxidative activity and expression of cell surface markers was seen on day 3, this suggests that tyrosol is driving the HL-60 cells to the monocyte stage as opposed to that of the granulocyte.
The capacity of polyphenols to inhibit cell cycle progression is an important feature shared with many drugs currently used as cancer treatments and was therefore assessed here. Previous work by Fabiani et al., 2008 demonstrated that hydroxytyrosol treatment of HL-60 cells over a period of 25 h resulted in an increase in cells in the G0/G1 phase and a decline in cells in the S phase, causing an increase in apoptotic cells [24]. This result is compatible with our findings for tyrosol, where a marked increase in the cells recorded in the sub Go/G1 stage was observed, although a direct comparison is not possible as the experimental time-plan differed. We also report an increase in cells undergoing late apoptosis, as well as necrosis on day 5. These results are in contrast with those recorded by Della Ragione et al., 2000 who reported an absence of anti-proliferative activity and apoptosis induction by tyrosol at a concentration of 100 µM for 2 days, however, the timeframe may have been a contributing factor [37].
In a further step, we also analysed the HL-60 transcriptome following polyphenol application in an effort to describe the genetic changes seen during tyrosol-induced monocytic differentiation. The transcriptome analysis, which is reported here for the first time, further confirms the upregulation of myeloid differentiation genes such as OSCAR, RELB, VEGFA, GAB2, JUNB, DNASE2, ICAM, and CCL3. OSCAR is a cell surface receptor expressed on monocytes, overexpression of which is linked to monocyte adhesion and migration [38,39]. The importance of VEGFA in myeloid cell differentiation has also been reported by Huang et al., 2017 while Czepluch et al., 2011 discussed its expression in two monocyte subsets [40,41], showing its role in monocyte chemotaxis. JUNB has been found to regulate the responses of monocytes to different immunostimulatory ligands, and its levels have also been reported to increase during monocyte maturation [42]. Moreover, ICAM that was upregulated across all time points, is a cell surface marker that is expressed by macrophages. The adhesion molecule binds to CD11b, which was observed to increase using fluorescent antibody analysis (Figure 5a). ALDH codes for aldehyde dehydrogenase, an enzyme important for the regulation of HSC differentiation. Chute et al. 2006 reported that ALDH inhibition in NOD/SCID mice resulted in HSC expansion and a delay in HSC differentiation [43].
Additionally, through Markov clustering (Figure 8F), we show that tyrosol treatment results in the upregulation of two tightly clustered networks, one involving Interferon Regulatory Factors (IRFs) and interferon-induced IFIT proteins and the NFκB network. Within the former network, IFIT proteins are expressed in response to a stimulus and gene expression is dependent on both pathogen-associated molecular patterns (PAMPs), as well as the JAK-STAT pathway. This is in line with our results which confirm the upregulation of both IRF7 and STAT2. Matikainen et al., 1997 have also reported the activation of STAT2 in myeloid cell differentiation. They showed that for NB4 and U937 cells treated with ATRA, increased levels of STAT1 and STAT2 were recorded, resulting in these differentiated cells being more responsive to IFNs [44]. Induction of the JAK-STAT pathway following treatment of HL-60 cells by PMA and DMSO has been recorded [45]. Moreover, previous studies have reported the upregulation of IRF1 gene expression by ATRA on the myeloid cell lines NB4 and HL-60, and hence the results presented in this study are compatible with these findings [46,47]. IRF1 is a transcriptional activator of both IFN and IFN inducible genes, and its level is lowest during cell proliferation and highest at cell growth arrest [48]. This upregulation is consistent with the findings outlined in Figure 7 confirming the apoptotic effect of tyrosol.
Within the same network, the upregulation of PARP9 and PARP14 was also observed, with PARP having previously been found to regulate cell differentiation [49]. Our results are again consistent with those obtained by Bhatia, Kirkland, and Meckling-Gill (1995), who observed the upregulation of PARP for both NB4 and HL-60 cells differentiated by PMA and 1,25-D3 to the monocyte/macrophage lineage [50]. Specifically, Iwata et al., 2016 reported the importance of PARP9 and PARP14 in activating macrophages [51].
With regards to the NFκB pathway, two members of the transcription factor family, NFkB2 and RELB, were found to be upregulated following tyrosol treatment. The upregulation of three inhibitors NFκBIA, NFκBIE, NFκBIZ show that tyrosol inhibits the NFκB pathway [52,53]. Inhibition of this pathway has been linked to the treatment of cancer and inflammation. A study by Holmes and Baldwin (2000) has shown that the naturally occurring flavonoid resveratrol exerts its effects by inhibiting the NFκB pathway, thus explaining the benefits of red wine in reducing coronary heart disease and cancer mortality [54]. Its suppressive effects have been attributed to a decline in the activities of both p65, as well as IκB [55]. This compound has also been found to downregulate this pathway in activated macrophages, leading to the inhibition of NO generation [56]. In summary, our results indicate that tyrosol is an effective differentiating agent driving the HL-60 cells to the monocyte stage, followed by apoptosis as cells regain senescence.

5. Conclusions

The phenolic compound tyrosol, tested at the concentration at which it was found to be present in a Maltese EVOO, was found to induce HL-60 differentiation towards the monocytic lineage as well as apoptosis. Transcriptome analysis revealed the upregulation of myeloid differentiation genes such as OSCAR, RELB, VEGFA, GAB2, JUNB, DNASE2, ICAM, and CCL3 following tyrosol treatment. Tyrosol cytotoxicity was found to be selective to HL-60 cells thus making tyrosol a suitable non-cytotoxic candidate for AML differentiation therapy. In this study, we presented the effect of one component found in a Maltese EVOO. Future studies involve an analysis of the biological effect of the rest of the phenolic profile of this EVOO on HL-60 cells.

Supplementary Materials

The following are available online at https://www.mdpi.com/article/10.3390/app112110199/s1, File S1: HPLC method, Figure S1: Extract effect on the index of differentiation, Figure S2: MTT relative absorbance on day 3, Table S1: DE intensity difference.

Author Contributions

Conceptualization, L.G., M.Z.-M. and P.S.-W.; methodology, L.G., M.Z.-M. and P.S.-W.; experimental work and data analysis, L.G.; RNA-seq data analysis, D.G.S.; investigation, L.G.; writing—original draft preparation, L.G. and D.G.S.; writing—review and editing, M.Z.-M. and P.S.-W.; supervision, M.Z.-M. and P.S.-W.; project administration, L.G.; funding acquisition, L.G. All authors have read and agreed to the published version of the manuscript.

Funding

This research was funded through the Malta Government Scholarship Scheme (Postgraduate).

Institutional Review Board Statement

The study was conducted according to the guidelines of the Declaration of Helsinki, and approved by the University of Malta, Faculty of Medicine and Surgery Research Ethics Committee (FRECMDS1718_073).

Informed Consent Statement

Informed consent was obtained from all subjects involved in the study.

Acknowledgments

The authors would like to thank Analisse Cassar, Frederick Lia, and Christian Saliba for their assistance with flow cytometry, HPLC, and RNA extraction, respectively.

Conflicts of Interest

The authors declare no conflict of interest. The funders had no role in the design of the study; in the collection, analyses, or interpretation of data; in the writing of the manuscript, or in the decision to publish the results.

References

  1. Virchow, R. Weisses blut. Froriep’s Notizen. 1847, 36, 151–156. [Google Scholar]
  2. Estey, E.H. Acute myeloid leukemia: 2012 update on diagnosis, risk stratification, and management. Am. J. Hematol. 2012, 87, 89–99. [Google Scholar] [CrossRef] [PubMed]
  3. Pierce, G.B.; Shikes, R.; Fink, L.M. Cancer: A Problem of Developmental Biology; Prentice-Hall Inc: Englewood Cliffs, NJ, USA, 1978; p. 242. [Google Scholar]
  4. Nowak, D.; Stewart, D.; Koeffler, H.P. Differentiation therapy of leukemia: 3 decades of development. Blood 2009, 113, 3655–3665. [Google Scholar] [CrossRef]
  5. Tallman, M.S.; Lefèbvre, P.; Baine, R.M.; Shoji, M.; Cohen, I.; Green, D.; Kwaan, H.C.; Paietta, E.; Rickles, F.R. Effects of all-trans retinoic acid or chemotherapy on the molecular regulation of systemic blood coagulation and fibrinolysis in patients with acute promyelocytic leukemia. J. Thromb. Haemost. 2004, 2, 1341–1350. [Google Scholar] [CrossRef] [PubMed]
  6. Sell, S. Leukemia: Stem cells, maturation arrest and differentiation therapy. Stem Cell Rev. 2005, 1, 197–205. [Google Scholar] [CrossRef]
  7. Leszczyniecka, M.; Roberts, T.; Dent, P.; Grant, S.; Fisher, P.B. Differentiation therapy of human cancer: Basic science and clinical applications. Pharmacol. Ther. 2001, 90, 105–156. [Google Scholar] [CrossRef]
  8. Birnie, G.D. The HL60 cell line: A model system for studying human myeloid cell differentiation. Br. J. Cancer. Supplement. 1988, 9, 41–45. [Google Scholar]
  9. Salvi, H.Y.; Aalto, B.; Nagy, S.; Knuutila, S.; Pakkala, S. Gene expression analysis of 1,25(OH)2D3-dependent differentiation of HL-60 cells: A cDNA array study. Br. J. Hematol. 2002, 118, 1065–1070. [Google Scholar]
  10. Chang, H.H.; Oh, P.Y.; Ingber, D.E.; Huang, S. Multistable and multistep dynamics in neutrophil differentiation. BMC Cell Biol. 2006, 7, 11. [Google Scholar] [CrossRef] [PubMed] [Green Version]
  11. Newburger, P.E.; Subrahmanyam, Y.V.; Weissman, S.M. Global analysis of neutrophil gene expression. Curr. Opin. Hematol. 2000, 7, 16–20. [Google Scholar] [CrossRef]
  12. Rincón, E.; Rocha-Gregg, B.L.; Collins, S.R. A map of gene expression in neutrophil-like cell lines. BMC Genom. 2018, 19, 573. [Google Scholar] [CrossRef] [PubMed] [Green Version]
  13. Naegelen, I.; Plançon, S.; Nicot, N.; Kaoma, T.; Muller, A.; Vallar, L.; Tschirhart, E.J.; Bréchard, S. An essential role of syntaxin 3 protein for granule exocytosis and secretion of IL-1α, IL-1β, IL-12b, and CCL4 from differentiated HL-60 cells. J. Leukoc. Biol. 2014, 97, 557–571. [Google Scholar] [CrossRef]
  14. Mark Welch, D.B.; Jauch, A.; Langowski, J.; Olins, A.L.; Olins, D.E. Transcriptomes reflect the phenotypes of undifferentiated, granulocyte and macrophage forms of HL-60/S4 cells. Nucleus 2017, 8, 222–237. [Google Scholar] [CrossRef] [Green Version]
  15. Santos-Beneit, A.M.; Mollinedo, F. Expression of genes involved in initiation, regulation, and execution of apoptosis in human neutrophils and during neutrophil differentiation of HL-60 cells. J. Leukoc Biol. 2000, 67, 712–724. [Google Scholar] [CrossRef] [PubMed]
  16. Dai, J.; Mumper, R.J. Plant phenolics: Extraction, analysis and their antioxidant and anticancer properties. Molecules 2010, 15, 7313–7352. [Google Scholar] [CrossRef]
  17. Gómez-Romero, M.; García-Villalba, R.; Carrasco-Pancorbo, A.; Fernández-Gutiérrez, A. Metabolism and Bioavailability of Olive Oil Polyphenols (2012). In Olive Oil—Constituents, Quality, Health Properties and Bioconversions; Dimitrios, B., Ed.; IntechOpen: London, UK; pp. 333–356.
  18. Shendi, E.G.; Ozay, D.S.; Ozkaya, M.T.; Ustunei, N.F. Changes occurring in chemical composition and oxidative stability of virgin olive oil during storage. Oilseeds Fats Crop. Lipids 2018, 25, 1–8. [Google Scholar]
  19. Lia, F.; Formosa, J.P.; Zammit-Mangion, M.; Farrugia, C. The First Identification of the Uniqueness and Authentication of Maltese Extra Virgin Olive Oil Using 3D-Fluorescence Spectroscopy Coupled with Multi-Way Data Analysis. Foods 2020, 9, 498. [Google Scholar] [CrossRef] [PubMed] [Green Version]
  20. Gatt, L.; Lia, F.; Zammit-Mangion, M.; Thorpe, S.J.; Schembri-Wismayer, P. First Profile of Phenolic Compounds from Maltese Extra Virgin Olive Oils Using Liquid-Liquid Extraction and Liquid Chromatography-Mass Spectrometry. J. Oleo Sci. 2021, 70, 145–153. [Google Scholar] [CrossRef]
  21. Fabiani, R.; De Bartolomeo, A.; Rosignoli, P.; Servili, M.; Selvaggini, R.; Montedoro, G.F.; Di Saverio, C.; Morozzi, G. Virgin olive oil phenols inhibit proliferation of human promyelocytic leukemia cells (HL60) by inducing apoptosis and differentiation. J. Nutr. 2006, 136, 614–619. [Google Scholar] [CrossRef] [Green Version]
  22. Abaza, L.; Talorete, T.P.N.; Yamada, P.; Kurita, Y.; Zarrouk, M.; Isoda, H. Induction of growth inhibition and differentiation of human leukemia HL-60 cells by a Tunisian gerboui olive leaf extract. Biosci. Biotechnol. Biochem. 2007, 71, 1306–1312. [Google Scholar] [CrossRef]
  23. Sepporta, M.V.; Mazza, T.; Morozzi, G.; Fabiani, R. Pinoresinol inhibits proliferation and induces differentiation on human HL60 leukemia cells. Nutr. Cancer 2013, 65, 1208–1218. [Google Scholar] [CrossRef]
  24. Fabiani, R.; Rosignoli, P.; De Bartolomeo, A.; Fuccelli, R.; Morozzi, G. Inhibition of cell cycle progression by hydroxytyrosol is associated with upregulation of cyclin-dependent protein kinase inhibitors p21(WAF1/Cip1) and p27(Kip1) and with induction of differentiation in HL60 cells. J. Nutr. 2008, 138, 42–48. [Google Scholar] [CrossRef] [PubMed] [Green Version]
  25. Abe, K.; Matsuki, N. Measurement of cellular 3-(4,5-dimethylthiazol-2-yl)-2,5-diphenyltetrazolium bromide (MTT) reduction activity and lactate dehydrogenase release using MTT. Neurosci. Res. 2000, 38, 325–329. [Google Scholar] [CrossRef]
  26. Stoica, S.; Magoulas, G.E.; Antoniou, A.I.; Suleiman, S.; Cassar, A.; Gatt, L.; Papaioannou, D.; Athanassopoulos, C.M.; Schembri-Wismayer, P. Synthesis of minoxidil conjugates and their evaluation as HL-60 differentiation agents. Bioorganic Med. Chem. Lett. 2016, 26, 1145–1150. [Google Scholar] [CrossRef] [PubMed]
  27. Chen, H.W.; Heiniger, H.J.; Kandutsch, A.A. Relationship between sterol synthesis and DNA synthesis in phytohemagglutinin-stimulated mouse lymphocytes. Proc. Natl. Acad. Sci. USA 1975, 72, 1950–1954. [Google Scholar] [CrossRef] [PubMed] [Green Version]
  28. Mire-Sluis, A.R.; Wickremasinghe, R.G.; Hoffbrand, A.V.; Timms, A.M.; Francis, G.E. Human T lymphocytes stimulated by phytohaemagglutinin undergo a single round of cell division without a requirement for interleukin-2 or accessory cells. Immunology 1987, 60, 7–12. [Google Scholar]
  29. Hutchins, D.; Steel, C.M. Phytohaemagglutinin-induced proliferation of human T lymphocytes: Differences between neonate and adults in accessory cell requirements. Clin. Exp. Immunol. 1983, 52, 355–364. [Google Scholar]
  30. Enright, A.J.; Van Dongen, S.; Ouzounis, C.A.A. An efficient algorithm for large-scale detection of protein families. Nucleic Acids Res. 2002, 30, 1575–1584. [Google Scholar] [CrossRef]
  31. Kawaii, S.; Lansky, E.P. Differentiation-promoting activity of pomegranate (Punica granatum) fruit extracts in HL-60 human promyelocytic leukemia cells. J. Med. Food 2004, 7, 13–18. [Google Scholar] [CrossRef] [Green Version]
  32. Crescimanno, M.; Sepporta, M.V.; Tripoli, E.; Flandina, C.; Giammanco, M.; Tumminello, F.T.; Di Majo, D.; Tolomeo, M.; La Guardia, M.; Leto, G. Effects of extra virgin olive oil phenols on HL60 cell lines sensitive and resistant to anthracyclines. J. Biol. Res. 2009, 82, 34–37. [Google Scholar] [CrossRef]
  33. Baillie, J.K.; Arner, E.; Daub, C.; De Hoon, M.; Itoh, M.; Kawaji, H.; Lassmann, T.; Carninci, P.; Forrest, A.R.; Hayashizaki, Y.; et al. Analysis of the human monocyte-derived macrophage transcriptome and response to lipopolysaccharide provides new insights into genetic aetiology of inflammatory bowel disease. PLoS Genet. 2017, 13, e1006641. [Google Scholar] [CrossRef] [PubMed]
  34. Saliba, D.G.; Heger, A.; Eames, H.L.; Oikonomopoulos, S.; Teixeira, A.; Blazek, K.; Androulidaki, A.; Wong, D.; Goh, F.G.; Weiss, M.; et al. IRF5:RelA interaction targets inflammatory genes in macrophages. Cell Rep. 2014, 8, 1308–1317. [Google Scholar] [CrossRef] [Green Version]
  35. Birmachu, W.; Gleason, R.M.; Bulbulian, B.J.; Riter, C.L.; Vasilakos, J.P.; Lipson, K.E.; Nikolsky, Y. Transcriptional networks in plasmacytoid dendritic cells stimulated with synthetic TLR 7 agonists. BMC Immunol. 2007, 8, 26. [Google Scholar] [CrossRef] [PubMed] [Green Version]
  36. Huang, D.W.; Sherman, B.T.; Lempicki, R.A. Systematic and integrative analysis of large gene lists using DAVID bioinformatics resources. Nat. Protoc. 2009, 4, 44–57. [Google Scholar] [CrossRef]
  37. Ragione, F.D.; Cucciolla, V.; Borriello, A.; Pietra, V.D.; Pontoni, G.; Racioppi, L.; Manna, C.; Galletti, P.; Zappia, V. Hydroxytyrosol, a natural molecule occurring in olive oil, induces cytochrome c-dependent apoptosis. Biochem. Biophys. Res. Commun. 2000, 278, 733–739. [Google Scholar] [CrossRef] [PubMed]
  38. Merck, E.; Gaillard, C.; Gorman, D.M.; Montero-Julian, F.; Durand, I.; Zurawski, S.M.; Menetrier-Caux, C.; Carra, G.; Lebecque, S.; Trinchieri, G.; et al. OSCAR is an FcRgamma-associated receptor that is expressed by myeloid cells and is involved in antigen presentation and activation of human dendritic cells. Blood 2004, 104, 1386–1395. [Google Scholar] [CrossRef] [Green Version]
  39. Goettsch, C.; Kliemt, S.; Sinningen, K.; von Bergen, M.; Hofbauer, L.C.; Kalkhof, S. Quantitative proteomics reveals novel functions of osteoclast-associated receptor in STAT signaling and cell adhesion in human endothelial cells. J. Mol. Cell. Cardiol. 2012, 53, 829–837. [Google Scholar] [CrossRef] [Green Version]
  40. Huang, Y.; Rajappa, P.; Hu, W.; Hoffman, C.; Cisse, B.; Kim, J.H.; Gorge, E.; Yanowitch, R.; Cope, W.; Vartanian, E.; et al. A proangiogenic signaling axis in myeloid cells promotes malignant progression of glioma. J. Clin. Investig. 2017, 127, 1826–1838. [Google Scholar] [CrossRef] [Green Version]
  41. Czepluch, F.S.; Olieslagers, S.; van Hulten, R.; Vöö, S.A.; Waltenberger, J. VEGF-A-induced chemotaxis of CD16+ monocytes is decreased secondary to lower VEGFR-1 expression. Atherosclerosis 2011, 215, 331–338. [Google Scholar] [CrossRef]
  42. Fontana, M.F.; Baccarella, A.; Pancholi, N.; Pufall, M.A.; Herbert, D.R.; Kim, C.C. JUNB is a key transcriptional modulator of macrophage activation. J. Immunol. 2015, 194, 177–186. [Google Scholar] [CrossRef] [Green Version]
  43. Chute, J.P.; Muramoto, G.G.; Whitesides, J.; Colvin, M.; Safi, R.; Chao, N.J.; McDonnell, D.P. Inhibition of aldehyde dehydrogenase and retinoid signaling induces the expansion of human hematopoietic stem cells. Proc. Natl. Acad. Sci. USA 2006, 103, 11707–11712. [Google Scholar] [CrossRef] [Green Version]
  44. Matikainen, S.; Ronni, T.; Lehtonen, A.; Sareneva, T.; Melén, K.; Nordling, S.; Levy, D.E.; Julkunen, I. Retinoic acid induces signal transducer and activator of transcription (STAT) 1, STAT2, and p48 expression in myeloid leukemia cells and enhances their responsiveness to interferons. Cell Growth Differ. Mol. Biol. J. Am. Assoc. Cancer Res. 1997, 8, 687–698. [Google Scholar]
  45. Cohen, S.; Dovrat, S.; Sarid, R.; Huberman, E.; Salzberg, S. JAK-STAT signaling involved in phorbol 12-myristate 13-acetate- and dimethyl sulfoxide-induced 2’-5’ oligoadenylate synthetase expression in human HL-60 leukemia cells. Leuk. Res. 2005, 29, 923–931. [Google Scholar] [CrossRef]
  46. Matikainen, S.; Ronni, T.; Hurme, M.; Pine, R.; Julkunen, I. Retinoic acid activates interferon regulatory factor-1 gene expression in myeloid cells. Blood 1996, 88, 114–123. [Google Scholar] [CrossRef] [Green Version]
  47. Gianni, M.; Terao, M.; Fortino, I.; LiCalzi, M.; Viggiano, V.; Barbui, T.; Rambaldi, A.; Garattini, E. Stat1 is induced and activated by all-trans retinoic acid in acute promyelocytic leukemia cells. Blood 1997, 89, 1001–1012. [Google Scholar] [CrossRef]
  48. Harada, H.; Kitagawa, M.; Tanaka, N.; Yamamoto, H.; Harada, K.; Ishihara, M.; Taniguchi, T. Anti-oncogenic and oncogenic potentials of interferon regulatory factors-1 and -2. Science 1993, 259, 971–974. [Google Scholar] [CrossRef] [PubMed]
  49. Francis, G.E.; Gray, D.A.; Berney, J.J.; Wing, M.A.; Guimaraes, J.E.; Hoffbrand, A.V. Role of ADP-ribosyl transferase in differentiation of human granulocyte-macrophage progenitors to the macrophage lineage. Blood 1983, 62, 1055–1062. [Google Scholar] [CrossRef] [PubMed] [Green Version]
  50. Bhatia, M.; Kirkland, J.B.; Meckling-Gill, K.A. Modulation of poly (ADP-ribose) polymerase during neutrophilic and monocytic differentiation of promyelocytic (NB4) and myelocytic (HL-60) leukaemia cells. Biochem. J. 1995, 308, 131–137. [Google Scholar] [CrossRef] [PubMed] [Green Version]
  51. Iwata, H.; Goettsch, C.; Sharma, A.; Ricchiuto, P.; Goh, W.W.; Halu, A.; Yamada, I.; Yoshida, H.; Hara, T.; Wei, M.; et al. PARP9 and PARP14 cross-regulate macrophage activation via STAT1 ADP-ribosylation. Nat. Commun. 2016, 7, 12849. [Google Scholar] [CrossRef] [PubMed]
  52. Tieri, P.; Termanini, A.; Bellavista, E.; Salvioli, S.; Capri, M.; Franceschi, C. Charting the NF-κB pathway interactome map. PLoS ONE 2012, 7, e32678. [Google Scholar] [CrossRef] [PubMed] [Green Version]
  53. Ghosh, S.; May, M.J.; Kopp, E.B. NF-kappa B and Rel proteins: Evolutionarily conserved mediators of immune responses. Annu. Rev. Immunol. 1998, 16, 225–260. [Google Scholar] [CrossRef]
  54. Holmes-McNary, M.; Baldwin, A.S., Jr. Chemopreventive properties of trans-resveratrol are associated with inhibition of activation of the IkappaB kinase. Cancer Res. 2000, 60, 3477–3483. [Google Scholar] [PubMed]
  55. Ren, Z.; Wang, L.; Cui, J.; Huoc, Z.; Xue, J.; Cui, H.; Mao, Q.; Yang, R. Resveratrol inhibits NF-kB signaling through suppression of p65 and IkappaB kinase activities. Die Pharm.-Int. J. Pharm. Sci. 2013, 68, 689–694. [Google Scholar]
  56. Tsai, S.H.; Lin-Shiau, S.Y.; Lin, J.K. Suppression of nitric oxide synthase and the down-regulation of the activation of NFkappaB in macrophages by resveratrol. Br. J. Pharmacol. 1999, 126, 673–680. [Google Scholar] [CrossRef] [PubMed] [Green Version]
Figure 1. The design of the study.
Applsci 11 10199 g001
Figure 2. NBT/MTT ratio in HL-60 cells, 3 days following exposure to tyrosol. Untreated = Cells in RPMI medium, Negative control for differentiation; Vehicle control = 0.5% Ethanol; 1.6% DMSO, 10 nM PMA = Positive controls for granulocytic and monocytic differentiation, respectively. Each value is a median value where n = 9 (n = 3 for 3 separate experiments). Values normalised to medium (RPMI) control. Error bars represent differences between the median and upper and lower quartiles. Statistically significant differences from the negative control are denoted by (*) p < 0.05, (**) p < 0.01, and (***) p < 0.001.
Applsci 11 10199 g002
Figure 3. Cytotoxicity curves of activated lymphocytes at 0, 1, 2, and 3 days following tyrosol exposure using MTT assay. Untreated = Negative (medium) control for cytotoxicity; 10% DMSO = Positive control for cytotoxicity; Vehicle control = 0.5% Ethanol. Each value is a median value where n = 9 (n = 3 for 3 separate experiments). Values normalised to initial cell number.Error bars represent differences between the median and upper and lower quartiles.
Applsci 11 10199 g003
Figure 4. (AH) Leishman’s stained HL-60 cells exposed to RPMI—Medium only negative control (A), Vehicle control 0.5% Ethanol (B), 1.6% DMSO on day 3 (C), 1.6% DMSO on day 5 (D), 10 nM PMA on day 3 (E), 10 nM PMA on day 5 (F), 9.23 ppm tyrosol on day 3 (G), 9.23 ppm tyrosol on day 5 (H). Magnification 1000×.
Applsci 11 10199 g004
Figure 5. (a): A graph representing the % Gated CD11b high population on days 3 and 5 and representative histogram overlays and subtractions for each condition on day 3. Histograms from left to right = Untreated, 1.6% DMSO, 10 nM PMA, and 9.23 ppm tyrosol. Untreated = negative (medium only) control; 1.6% DMSO = granulocytic positive control; 10 nM PMA = monocytic positive control. Each bar represents the median value where n = 3 per condition. Error bars represent differences between the median and upper and lower quartiles. Statistically significant differences from the negative control are denoted by (**) p < 0.01. (b): A graph representing the % Gated CD14 high population on days 3 and 5 and representative histogram overlays and subtractions for each condition on day 3. Histograms from left to right = Untreated, 1.6% DMSO, 10 nM PMA, and 9.23 ppm tyrosol. Untreated = negative (medium only) control; 1.6% DMSO = granulocytic positive control; 10 nM PMA = monocytic positive control. Each bar represents the median value where n = 3 per condition. Error bars represent differences between the median and upper and lower quartiles.
Applsci 11 10199 g005aApplsci 11 10199 g005b
Figure 6. Percentage gated HL-60 cells in the Sub G0/G1, G0/G1, S, and G2/M phases of the cell cycle on day 1, day 3, and day 5 and representative histograms for each condition on day 5. Histograms from left to right = Untreated, 1.6% DMSO, 10 nM PMA, and 9.23 ppm tyrosol. Untreated = negative (medium only) control, 1.6% DMSO, 10 nM PMA are positive controls for granulocytic and monocytic differentiation, respectively. Each bar represents the median value where n = 4. Error bars represent differences between the median and upper and lower quartiles. Statistically significant differences from the negative control are denoted by (*) p < 0.05 and (**) p < 0.01.
Applsci 11 10199 g006
Figure 7. Percentage gated live, early apoptotic, late apoptotic and necrotic HL-60 cells on day 1, day 3, and day 5 and representative quadrants for each condition on day 5. Days 3 and 5 and representative histogram overlays and subtractions for each condition on day 5. From left to right = Untreated, 10 nM PMA, 1.6% DMSO, and 9.23 ppm tyrosol. Untreated = negative (medium only) control, 1.6% DMSO, 10 nM PMA = positive controls for granulocytic and monocytic differentiation respectively. Each bar represents the median value where n = 4. Error bars represent differences between the median and upper and lower quartiles. Statistically significant differences from the negative control are denoted by (*) p < 0.05, (**) p < 0.01, and (***) p < 0.001.
Applsci 11 10199 g007
Figure 8. (AC): Tyrosol induces monocyte lineage gene program. Gene expression analysis of tyrosol at 1, 6, and 12 h using RNA-seq as described in Methods. (A,B) Hierarchical clustering of Heat Map showing relative expression of negative (A) and positively expressed genes (B).Scale bar depicts z-score relative expression. (C) The network plot is based on known and predicted interactions from the STRING database (v11), with minimal confidence score of 0.4. Node size represents Fold change over untreated cells in two independent experiments. Nodes with magenta border represent genes involved in Myeloid differentiation process. Scale bar depicts –log10 of p-value. (DG): (D) Network depicted in (C) with nodes involved in monocyte-derived macrophage gene program highlighted in yellow and blue border. (E) Network depicted in (C) with nodes involved in monocyte-derived dendritic gene program highlighted in yellow and green border. (F) Modules identified in protein network shown in (C) determined using the Markov Cluster algorithm (inflation parameter: 2.5). Each colour represents a separate module (associated adjacency matrix). (G) DAVID analysis of network depicted in (C) showing enrichment of NF-κb (yellow), AP-1 (green), and ISRE (blue) binding sites in gene promoters of the network.
Applsci 11 10199 g008aApplsci 11 10199 g008b
Publisher’s Note: MDPI stays neutral with regard to jurisdictional claims in published maps and institutional affiliations.

