Abstract
Tunnel lining defects are one of the most common problems that tunnels experience during operation, and they can pose severe safety risks. The most popular nondestructive testing method for detecting tunnel lining defects is ground penetrating radar (GPR), one of the basic geophysical applications. However, detection responses might differ significantly from the real shape of tunnel lining defects, making it challenging to identify and interpret. When data quality is poor, interpretation and identification become more challenging, resulting in a high cost of tunnel repairs. The improved back projection (BP) imaging and robust principal component analysis (RPCA) are used in this work to offer a GPR data processing method. Even in the event of poor data quality, our method could recover GPR responses, allowing the shapes and locations of tunnel lining flaws to be clearly depicted. With BP imaging, this approach recovers the tunnel defects’ responses to better forms and positions, and with RPCA, it further isolates the target imaging from clutters. Several synthetic data demonstrate that the approach presented in this work may successfully repair and extract the positions and forms of lining defects, making them easier to identify and comprehend. Furthermore, our technique was used to GPR data gathered from the Qiyue Mountain Tunnel in China, yielding more accurate findings than the traditional method, which was validated by the actual scenario to illustrate the efficiency of our method on real data.
1. Introduction
Tunnels are an extensively used mode of transportation for crossing natural obstacles. With the widespread use of tunnels, their lack of operational safety has come into public notice. Tunnel lining defects, such as lining fractures, concrete honeycomb, water leakage and so on, have become one of the most common issues faced by tunnels in operation period, which bring severe potential safety hazards to tunnel structure [1,2,3,4]. To timely detect and efficiently treat tunnel lining defects, ground penetrating radar (GPR), as a rapid nondestructive detection and geophysical method, is often employed [5,6,7,8].
The response characteristics of common lining defects using GPR have been summarized by the researchers [9,10]. However, the responses in the original radar profile are usually far from the true shapes of the lining defects, making it difficult to identify the accurate shapes and locations of them. When the data quality is poor, the interpretation and identification seem more difficult. To improve the interpretation of tunnel defects detected by GPR, more advanced data processing technologies need to be used. The back projection (BP) algorithm and the Robust principal component analysis (RPCA) algorithm are two potentially useful approaches.
The back projection (BP) algorithm is a simple and effective migration algorithm that restores the radar reflected wave to the real position of the reflector in space, thus realizing imaging of the detected targets [11,12,13,14]. Zhou et al. proposed a novel BP algorithm for GPR, which is both fast and with good effect of suppressing artifacts [11]. Demirci et al. made a satisfactory GPR imaging of water leaks from buried pipes based on BP method [12]. Qu and Yin proposed a fast BP algorithm for stepped frequency continuous wave GPR imaging [13]. Liu et al. used an improved back-projection algorithm to simulate and image common tunnel lining defects using GPR and made a good effect [14]. The GPR responses of tunnel lining defects can be restored by BP method. However, BP could induce artifacts in the imaging process [15]. Therefore, there is a need to develop a method that could extract the parts related to defects in the imaging results.
Robust principal component analysis (RPCA) is an optimization method that divides complex matrices into low-rank and sparse matrices, with wide applications in various fields such as computer visual and image processing [15]. Low-rank matrices generally contain little information, and they are indicative of regular structures. A sparse matrix, on the other hand, only contains a few non-zero elements, and they are indicative of prominent points or structures. Some scholars think that in GPR detection, ground reflection, antenna coupling, system ringing and other structural noises take on characteristics of low rank, while the reflected wave of the detected target presents sparse characteristics. Therefore, RPCA can be utilized to extract target responses from the detected data [16,17,18]. However, the GPR detection responses often have many hyperbolic reflections, which are insufficiently sparse and will reduce the effectiveness of RPCA to a certain extent. Song et al. proposed to first carry out a migration processing of the GPR detection data to improve the sparsity of the target responses, and then apply RPCA to extract the detection targets, achieving satisfactory results [19].
To extract the effective information from GPR detection results of tunnel lining defects and make it easier to be identified and explained, this paper refers to Song et al. and combines the BP algorithm and the RPCA algorithm to process GPR detection results. The BP method could first restore the responses of tunnel lining defects and the RPCA method could extract the imaging of lining defects from the complex imaging result. Several synthetic cases show that the method proposed in this paper can effectively restore and extract the locations and shapes of the lining defects, which is conducive to the identification and interpretation of them. With the application in the actual data from Qiyue Mountain Tunnel in China, our proposed method effectively identifies five leakage channels, which is difficult to recognize from the complicated actual data.
2. Methods
2.1. BP Imaging Algorithm
The BP imaging algorithm is a simple and effective migration imaging algorithm for radar reflected waves. It can restore complex radar-reflected-wave events to a space reflector, thereby greatly reducing the difficulty in recognizing GPR detection results. The algorithm originated from synthetic aperture radar detection [20] and was introduced to process GPR detection data, achieving desirable results [21].
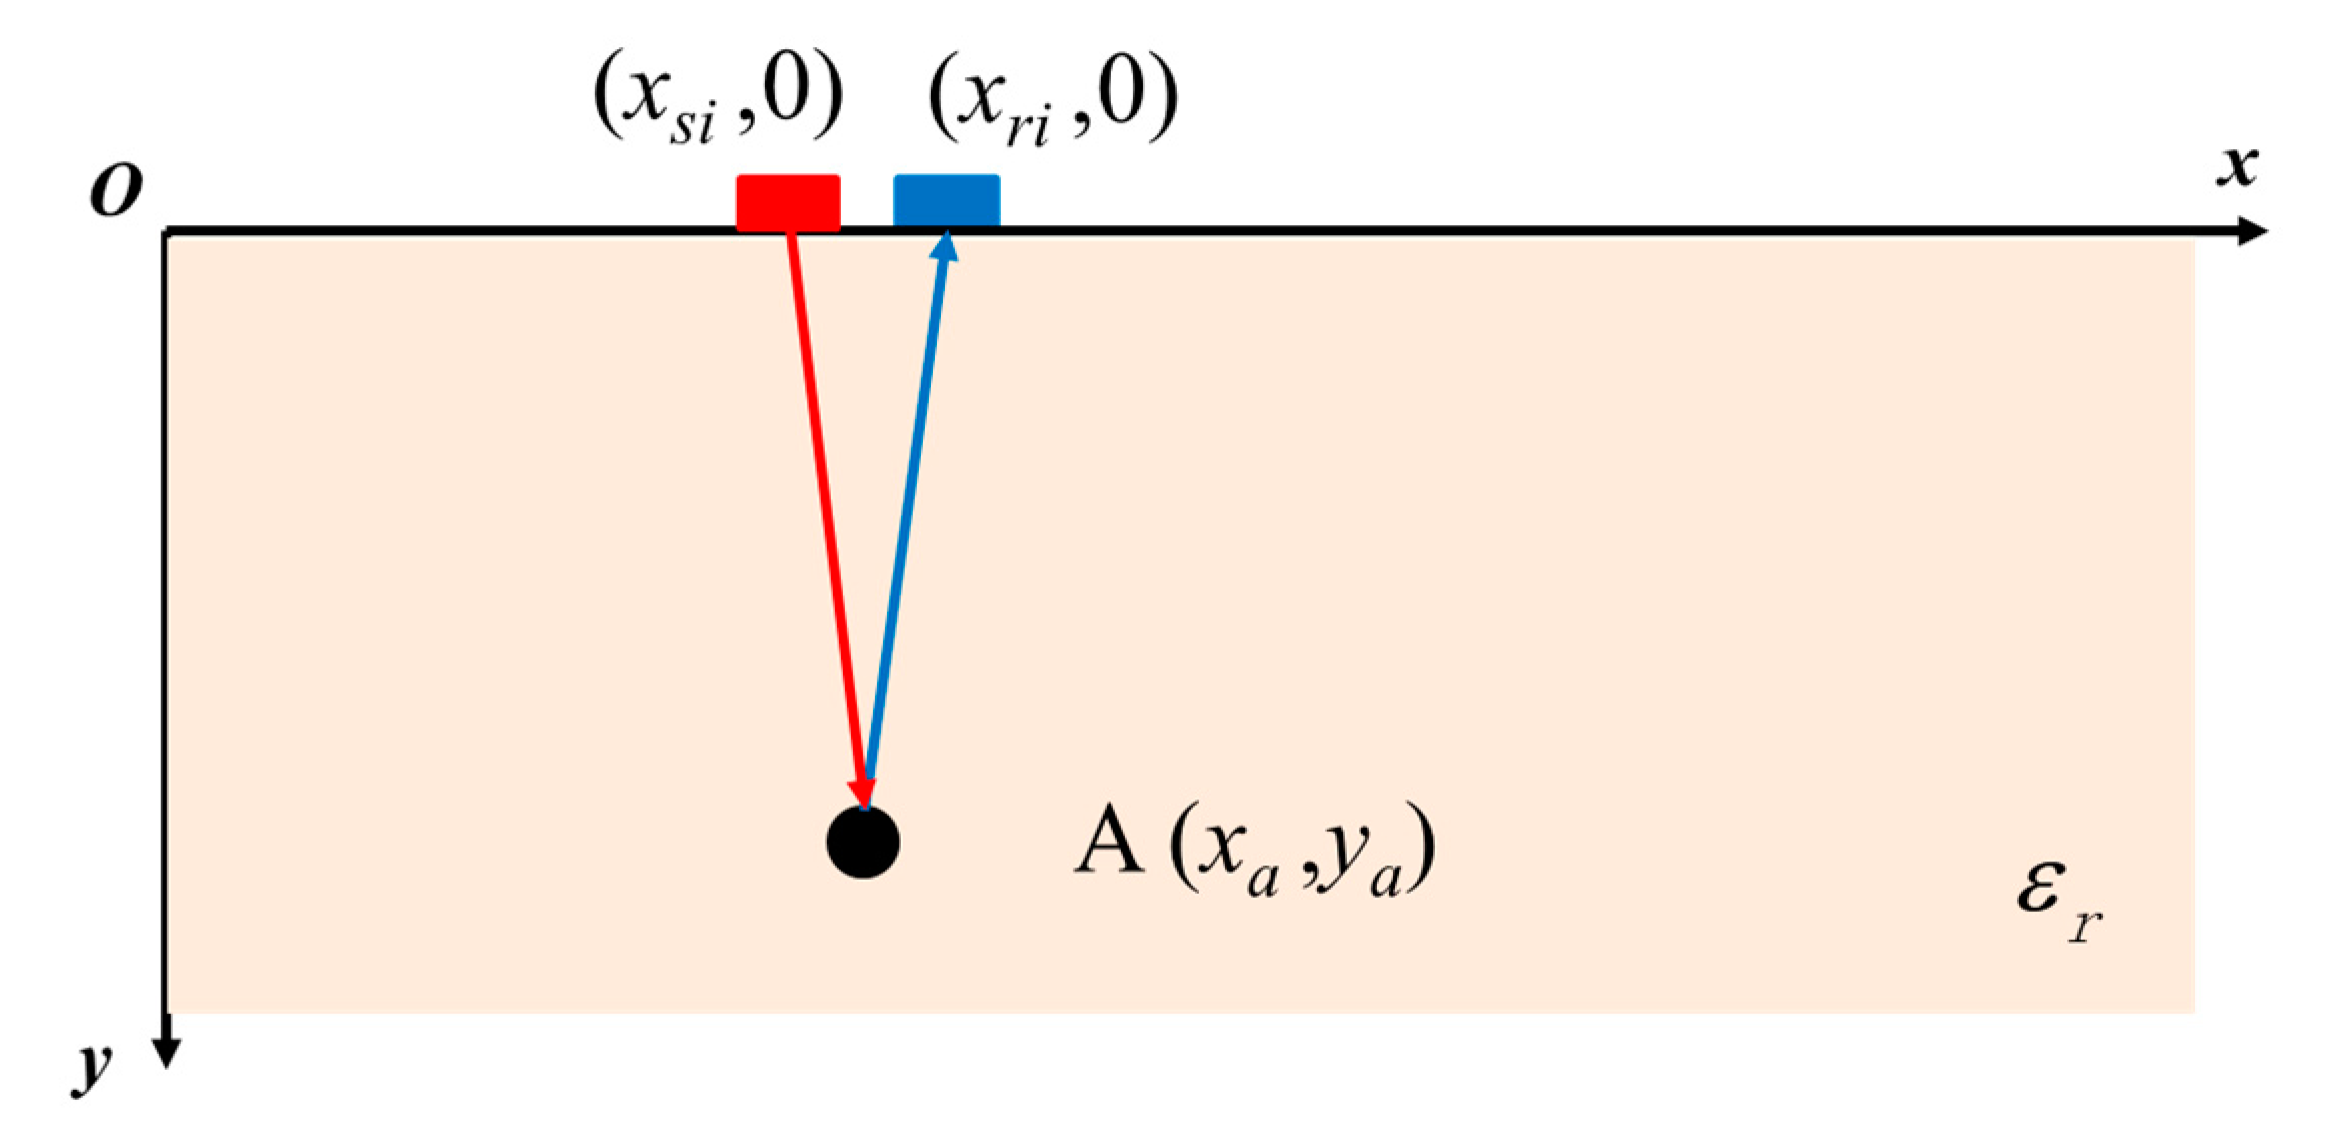
The working principle of the BP algorithm is to use the ray tracing method to calculate the propagation time of the electromagnetic wave transmitted from the transmitting antenna, which is reflected at a certain point in the detection area and received by the receiving antenna [13]. With this propagation time, the amplitude can be extracted from the measured radar data, and the imaging value can be obtained by adding the extracted amplitudes of each channel. Assuming that the transmitting antenna position is (xsi,0), the receiving antenna position is (xri,0), the coordinate of any point A in the imaging region is (xa,ya) and the relative permittivity of the background is εr, then the propagation time of the electromagnetic wave at that point is (see Figure 1):
where c is the velocity of vacuum light; i is the detected position of the GPR, where each position corresponds to a piece of data of a certain channel; and N is the total channel number of GPR detection [7]. Assuming that Si is the i-th channel data of the GPR, the BP imaging value corresponding to point A is:
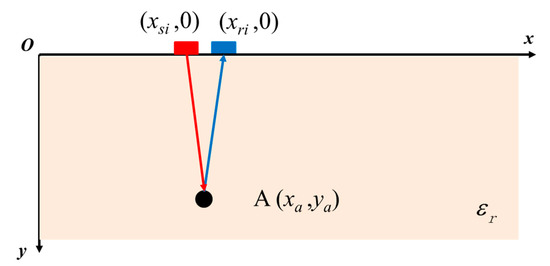
Figure 1.
The schematic diagram of back projection algorithm. The red rectangle is the transmitting antenna and the blue rectangle is the receiving antenna. The black circular is the target object. Point A is a generic point in the detection region. The x-axis is the measuring line, and the y-axis is the detection depth. The background dielectric constant is εr [13].
When the detected target is simple and the signal-to-noise ratio of the GPR data is high, the detected target position can be clearly restored by using the BP imaging algorithm alone. However, when the detected target is complex or the data quality is poor, the multipath ghosts brought by multipath propagation of rays become severe, interfering with the identification and interpretation of the targets.
2.2. Robust Principal Component Analysis
RPCA is an efficient matrix decomposition algorithm capable of extracting the low-dimensional structure of a complex matrix. A complex matrix D can be decomposed into the sum of matrices A and E, where A is a low-rank matrix with a few nonzero singular values and E denotes a sparse matrix with a few nonzero entries [15]. Their mathematical meanings can be expressed by the following equation:
where represents the rank of the matrix and represents the 0 norm, “min” is the abbreviation of “minimum” and “s.t.” is the abbreviation of “subject to”. This formula can be understood as decomposing a matrix D into the sum of two matrices A and E, and minimizing the sum of the rank of matrix A and the 0 norm of matrix E. This is an optimization problem, which can be solved by optimization algorithm. It should be noted that in this method, we do not pay attention to the specific values of and , but how to minimize the sum of them.
However, the rank function and 0 norm are non-convex, making it difficult to solve Equation (3) directly. In this regard, Candès et al. put forward the use of the nuclear norm instead of the rank function and the 1 norm instead of the 0 norm, thereby defining the so-called RPCA [22]:
where the nuclear norm is the sum of the singular values of the matrix and the 1 norm is the sum of the absolute values of the matrix. Compared to Equation (3), the nuclear norm and the 1 norm used here are both convex, so it is more tractable by optimization method [22]. We choose the truncated nuclear norm regularization method to solve this optimization problem (Equation (3)) [23].
2.3. Processing Radar Data by Combining BP and RPCA
RPCA can be used to decompose a matrix into low-rank and sparse components. Low-rank matrices generally contain little information, and they are indicative of regular structures. Sparse matrices, on the other hand, only contain a few non-zero elements, and they are indicative of prominent points or structures. Therefore, RPCA can be used to distinguish sparse anomalies in migration imaging that can be distinguished from low-rank background noise, ghost images and regular bedding anomalies in GPR data.
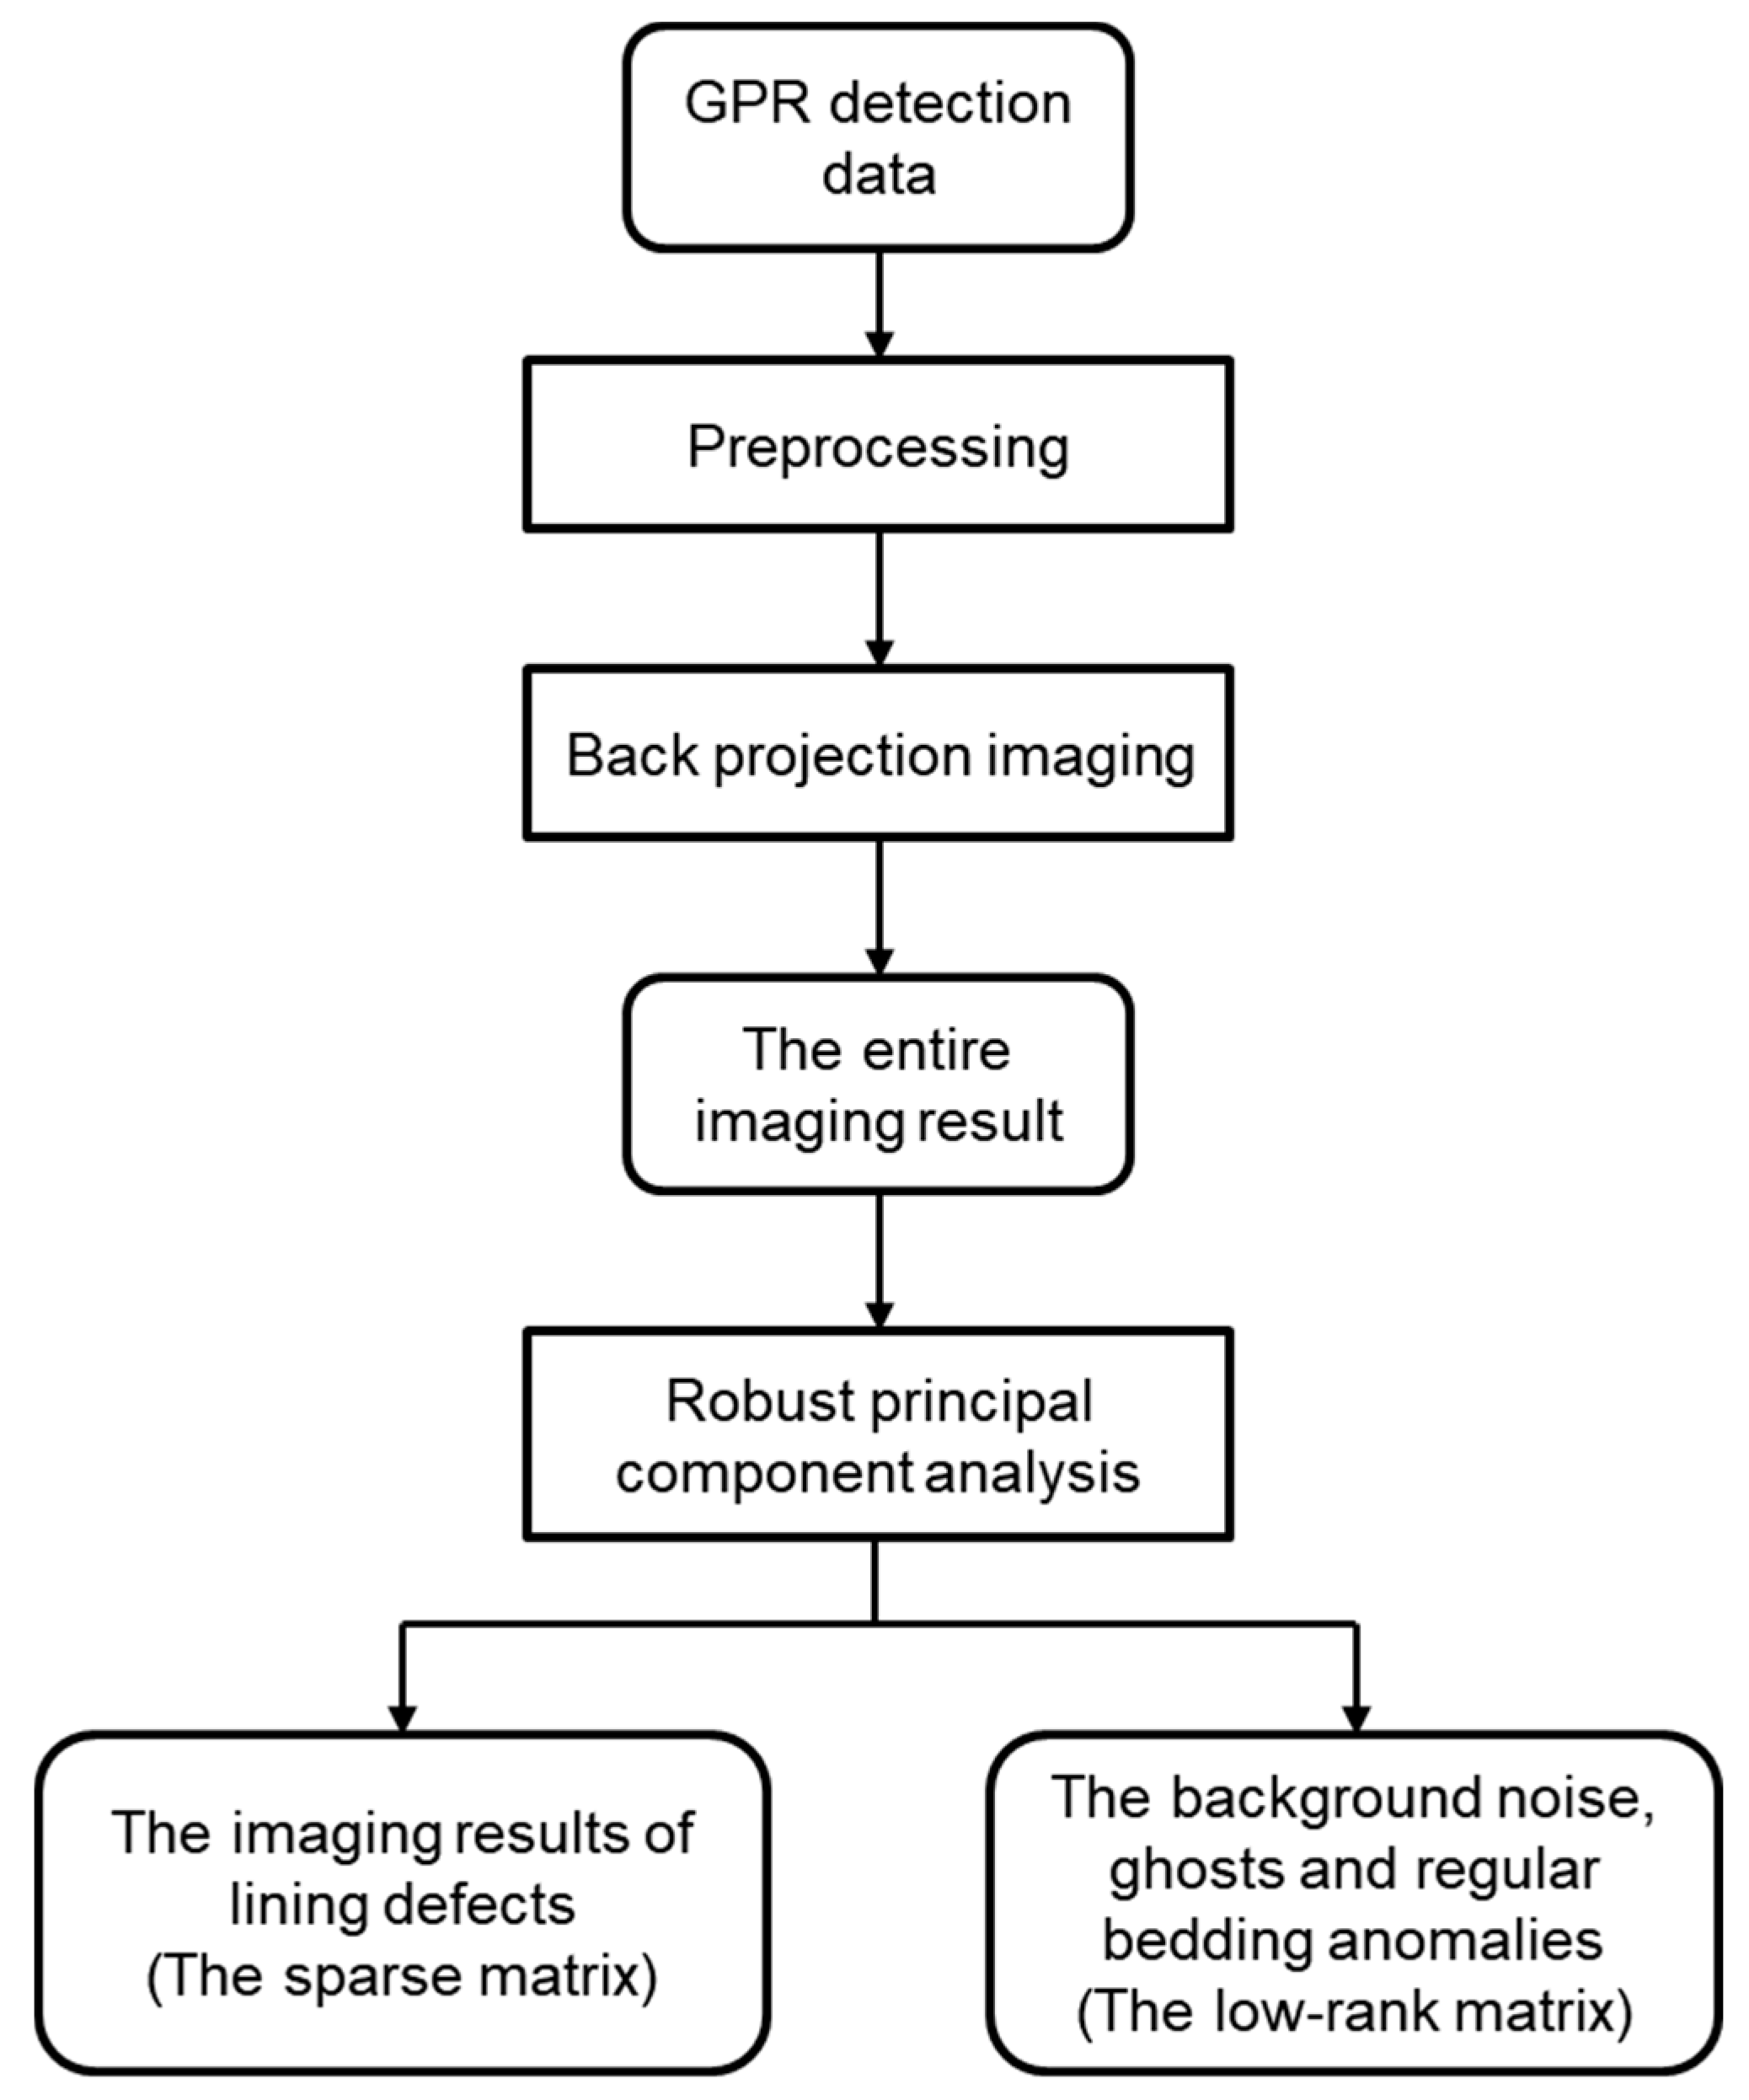
In this paper, we combined the BP algorithm with the RPCA algorithm to restore the responses of lining defects and extract the imaging results related to the lining defects. Specifically, the implementation steps of the integrated approach are as follows (see Figure 2):
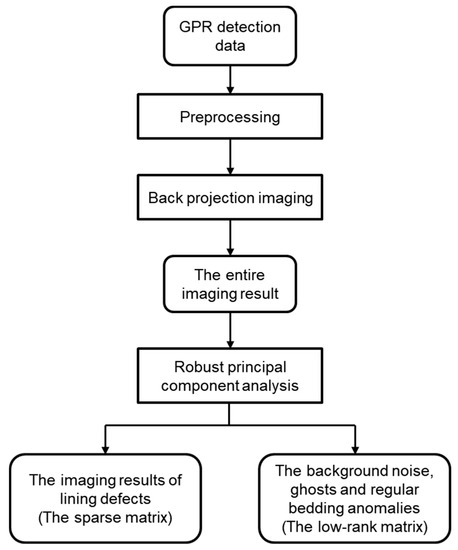
Figure 2.
The implementation steps of the integrated approach.
- Preprocessing the detection data, including direct wave removal, signal gain, band-pass filtering and moving average. Note that to eliminate the random disturbance of the characteristics of the white Gaussian noise that affects BP imaging and RPCA, a Gaussian smooth filtering is also required for the detected data.
- Performing BP imaging on the pre-processed data and Gaussian smooth filtering on the imaging results.
- Decomposing the migration imaging results with RPCA. The interference of multipath ghosts in BP imaging results is because of low-rank characteristics, and most of the information is contained in a low-rank matrix A. The imaging results of lining defects are usually sparse, and most of the information is included in the sparse matrix E.
3. Results and Discussion
3.1. Case Study of Numerical Simulation
Four kinds of common lining defects are simulated here to show the effects of the combined method, which are microscopic seepage channels, lining voids and lining-rock separation, lining fractures and concrete honeycomb [10]. Here the microscopic seepage channels refer to the leakage channels with smaller scale (centimeter scale) and perpendicular to the GPR detection line in tunnel lining. The GPR detection of this microscopic seepage channel perpendicular to the detection line is approximate hyperbola, and its BP imaging result is approximate a point, which has strong sparsity. Therefore, it could be extracted by RPCA with best effects. We will discuss the numerical simulation result of the microscopic seepage channels most detailly.
We first illustrate the effect of the processing method on the GPR detection data proposed in this study through a numerical simulation case. The synthetic data was simulated by an FDTD (Finite-Difference Time-Domain, the most used GPR detection simulation method) program with a grid size of 0.01 m, an antenna spacing of 0.1 m and a time window size of 21 ns. A Ricker wavelet with a center frequency of 400 MHz was used as the source wavelet. The simulation of one trace of data is carried out every two grids, and totally 74 traces of data are obtained from each model.
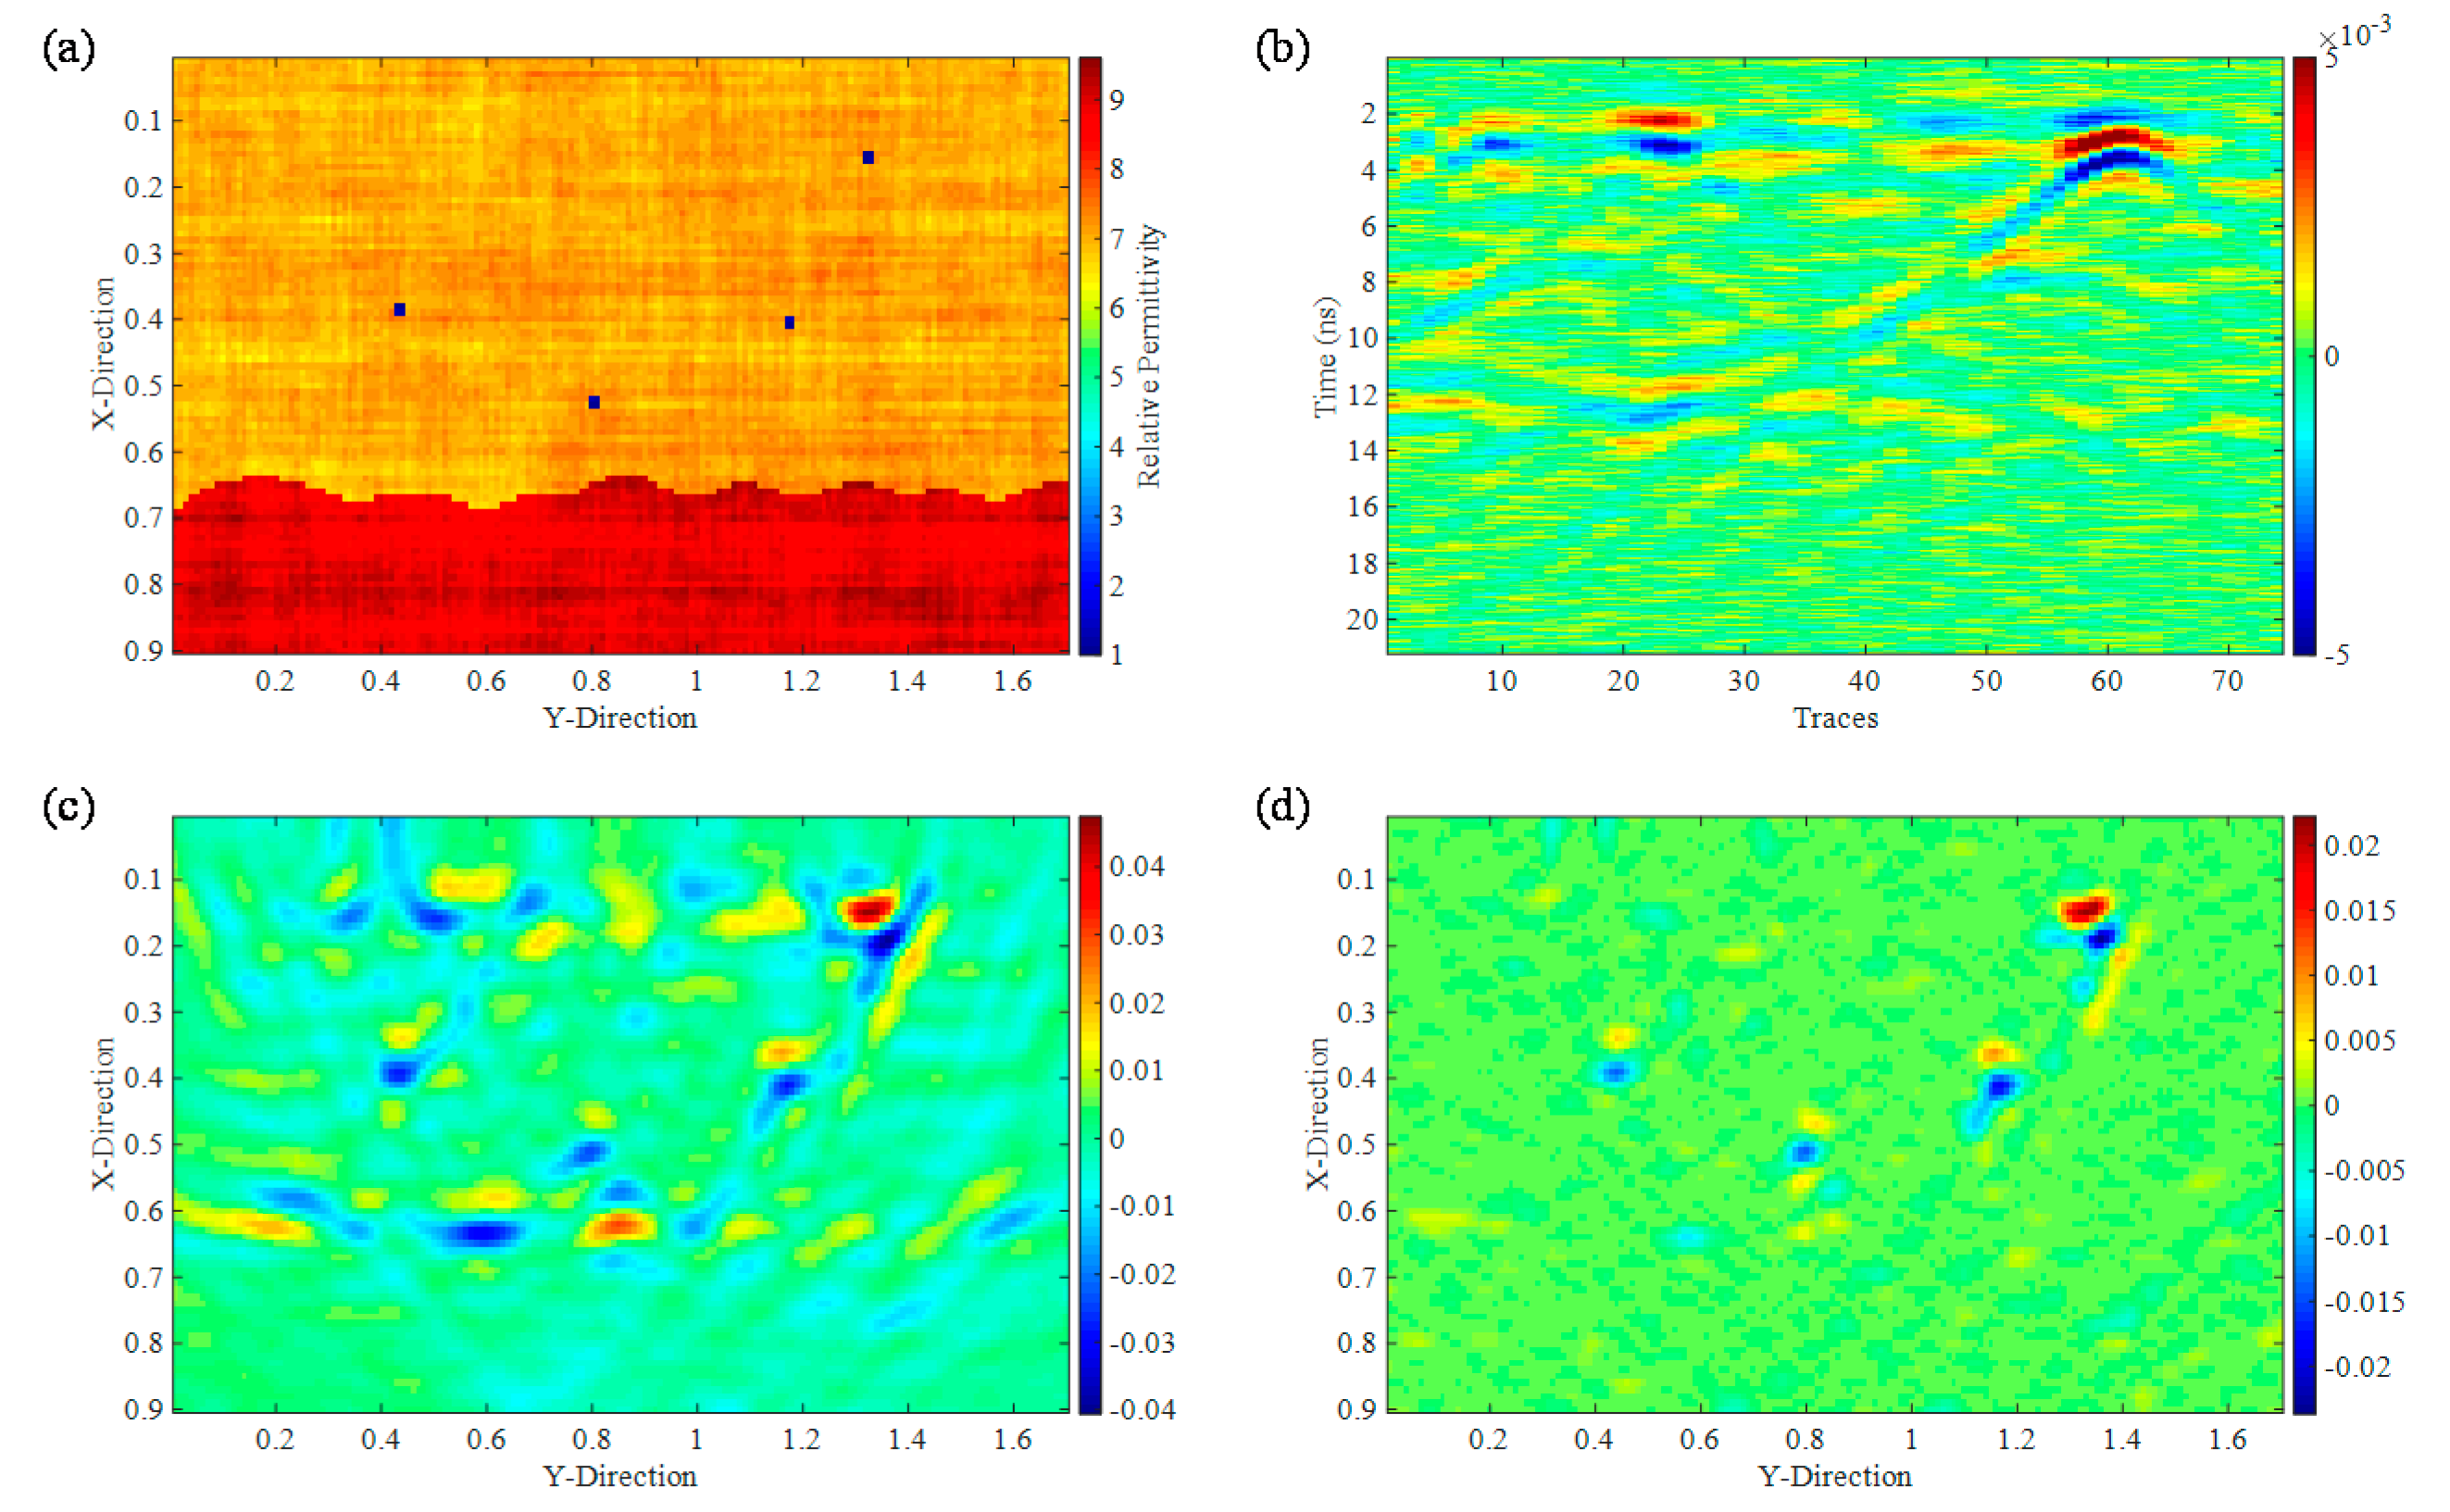
Figure 3 illustrates the first numerical experiment of this work, where microscopic seepage channels were simulated in the lining of a tunnel. The size of this model was 1.7 m × 0.9 m. Figure 3a shows the distribution of relative permittivity in the model. The upper and lower parts of the model are the lining and host rock, which have average relative permittivity of 7 and 9, respectively. There are four microscopic anomalies with a relative permittivity of 1 in the middle of the lining; these are meant to simulate water-less microscopic seepage channels. To ensure that the model is realistic, an elliptical autocorrelation function [24] was used to construct a random two-dimensional medium which simulates the non-uniformity of the latter.
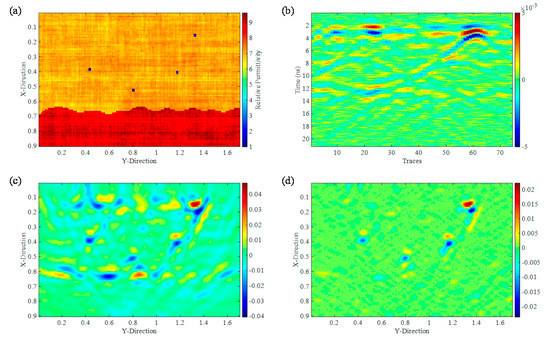
Figure 3.
The water-free seepage channel model. (a) the distribution of relative permittivity; (b) 2-D GPR profile; (c) back projection imaging; (d) RPCA anomaly extraction.
Figure 3b shows the forward-modeling results of the abovementioned numerical experiment. Direct waves were removed by cepstral mean subtraction. Here, it is shown that the responses of the four seepage channels are hyperbolic events. The direct waves were not fully removed by cepstral mean subtraction, as horizontal perturbations remain in the results. Background noise is also high in these results, and the unevenness of the host rock interface led to undulating reflection events. Due to the combined effects of these issues, it is challenging to identify the responses of the seepage channels.
Figure 3c shows the smoothed back-projection image, where the hyperbolic responses of the seepage channels have been inverted into points. Even though the seepage channels were correctly projected in Figure 3c, it is still difficult to visually identify the locations of the seepage channels, due to the interference caused by residual direct waves and host rock interfaces.
The imaging results of the residual direct waves and host rock interfaces are relatively regular and exhibit low-rank features, whereas the imaging results of the seepage channels are clustered into points and are sparse. Therefore, the RPCA algorithm proposed in this paper may be used to extract the elements of the image that correspond to seepage channels, as shown in Figure 3d. In the sparse matrix produced by the RPCA algorithm, the pixel values of the direct waves and host rock interfaces were eliminated, and the ghost images of the microscopic seepage channels were also suppressed. Clear images of the (sparse) microscopic seepage channels were thus obtained. Therefore, the RPCA algorithm could improve the ease and accuracy of GPR data interpretation to some extent.
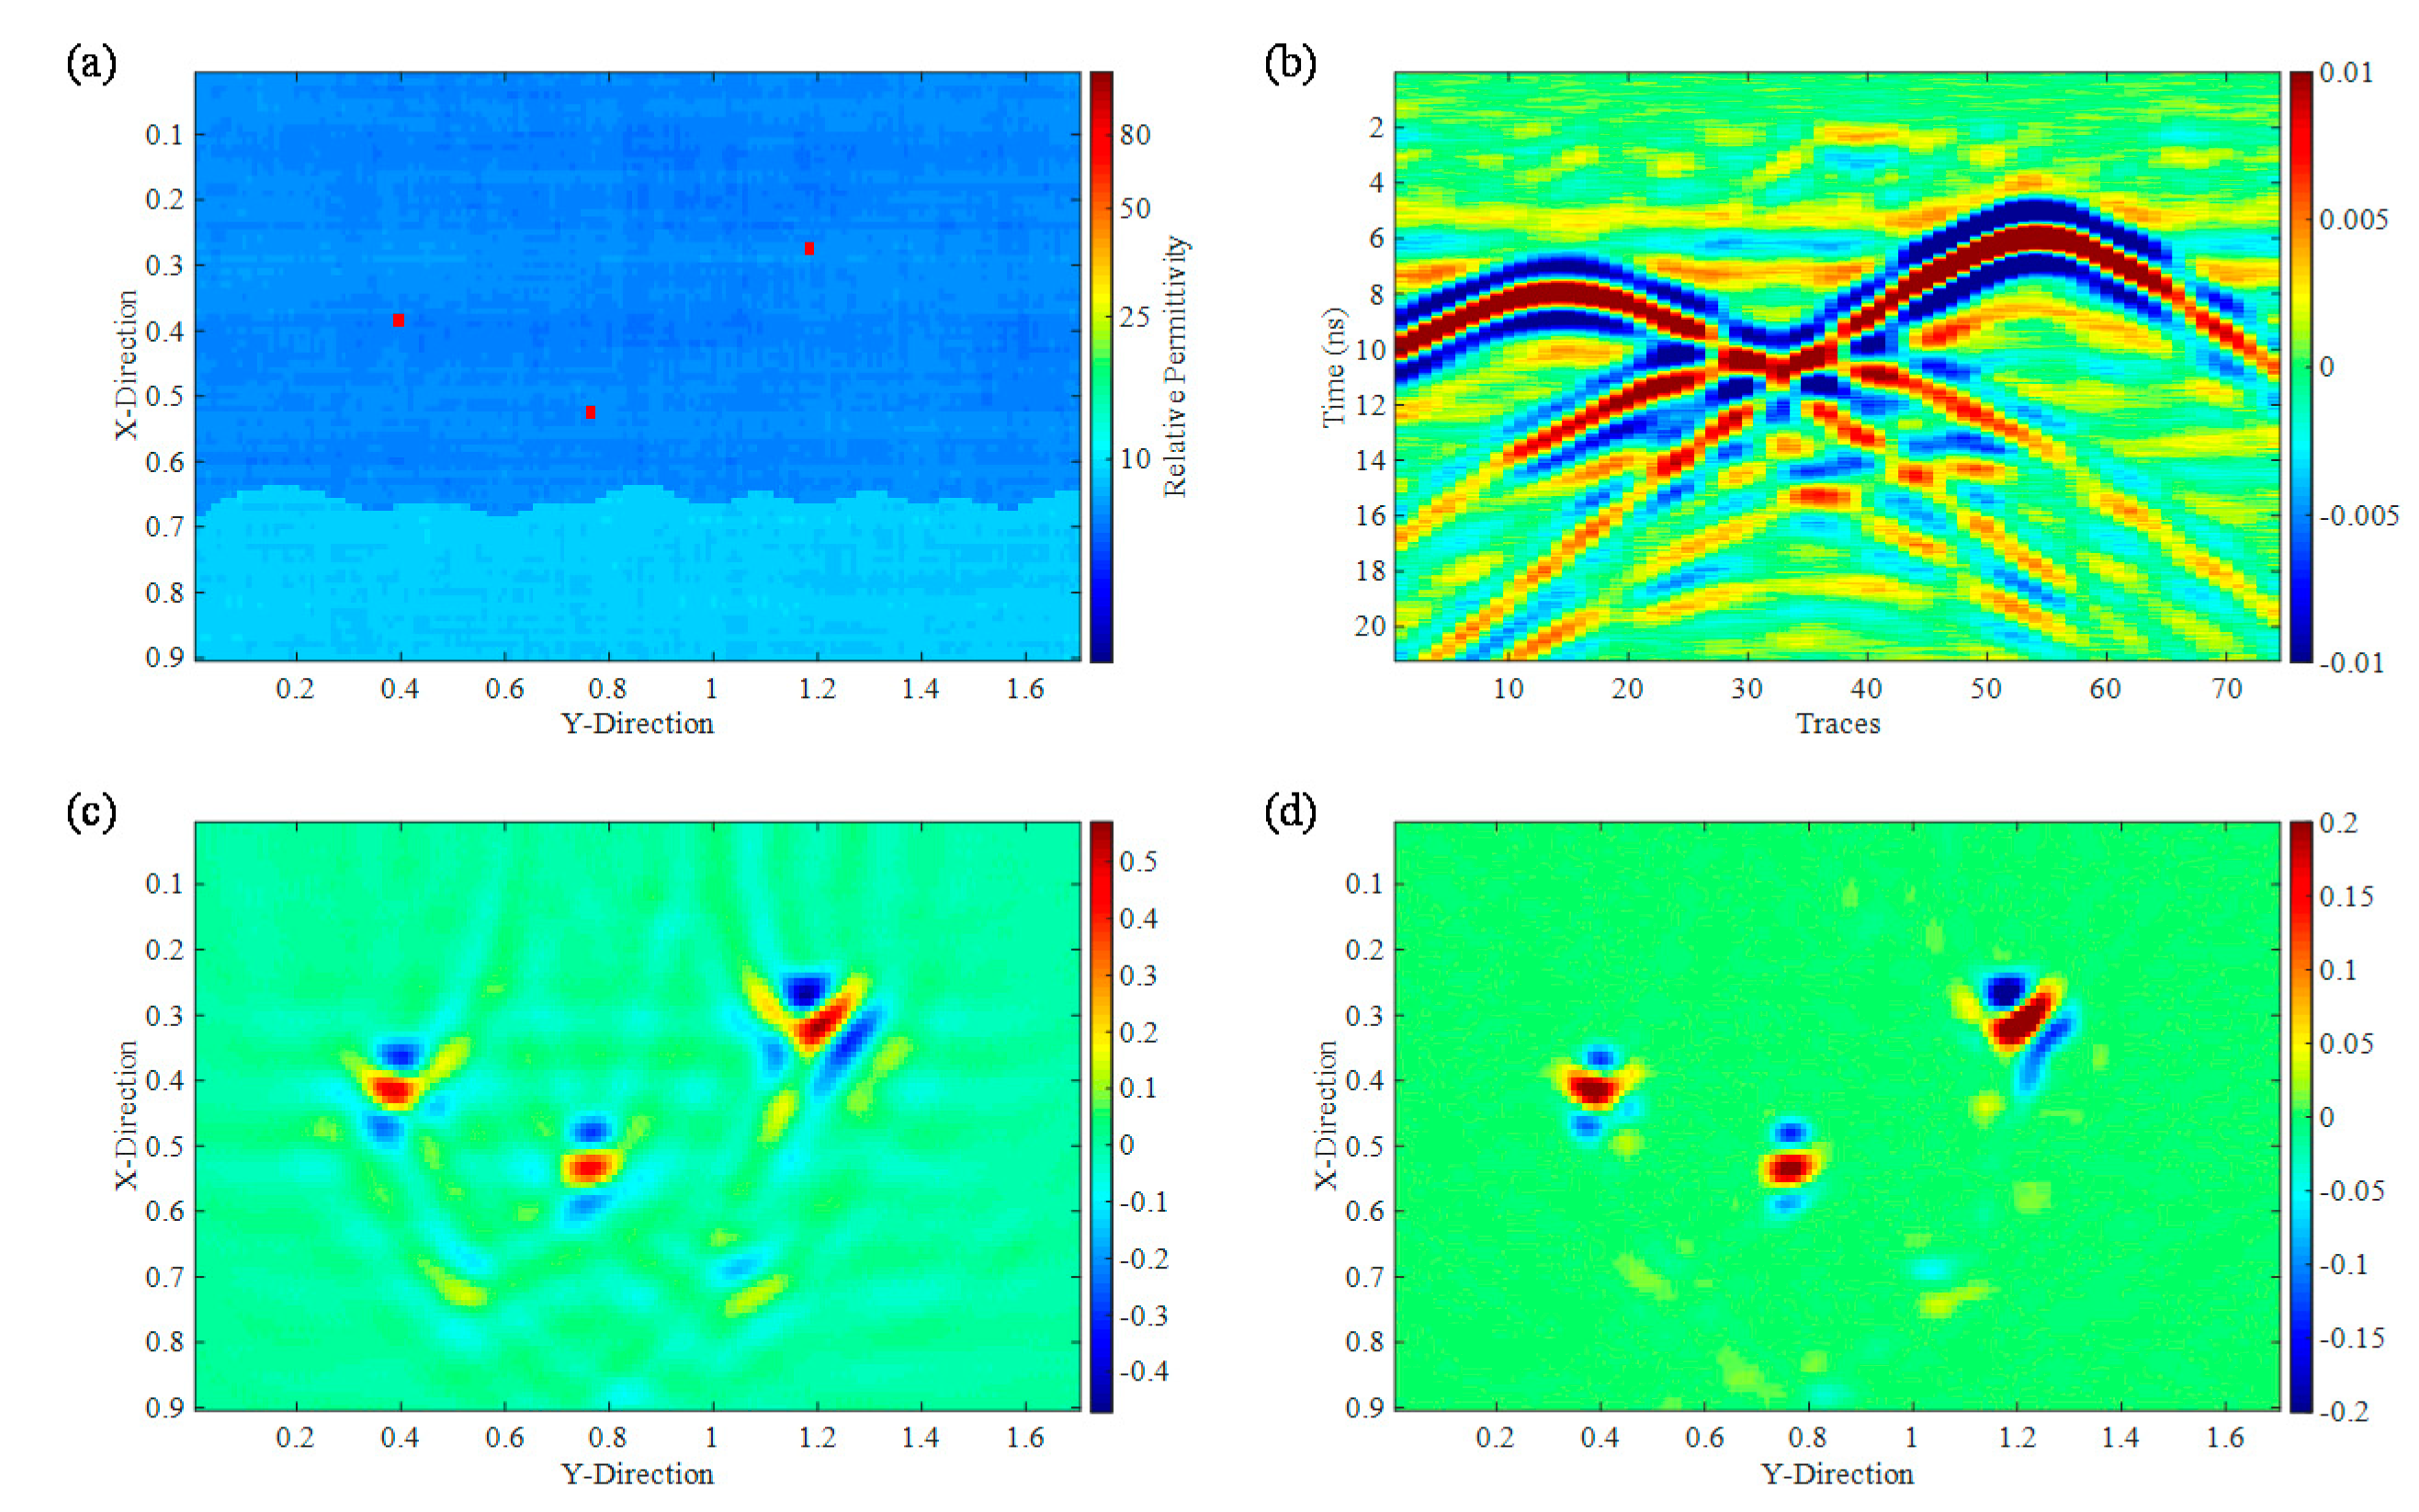
To illustrate the applicability of the proposed approach, we also examined its effectiveness in identifying microscopic seepage tunnels that contain water, as shown in Figure 4. The distribution of relative permittivity in this model is shown in Figure 4a; the water-containing seepage channels are represented by three anomalies in the lining, which have a relative permittivity of 81. The forward modeling results of this model are shown in Figure 4b. As compared to Figure 3b, the reflection responses of the anomalies are much easier to identify in this figure, as they are stronger and less susceptible to interference by residual direct waves and the host rock interfaces’ reflections. However, the presence of multiple reflections below the hyperbolic reflections of the anomalies makes it difficult to determine the number of seepage channels in the lining, as well as their locations.
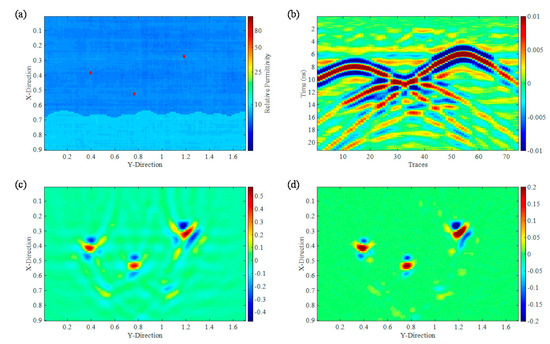
Figure 4.
The water- bearing seepage channel model. (a) the distribution of relative permittivity; (b) 2-D GPR profile; (c) back projection imaging; (d) RPCA anomaly extraction.
Figure 4c shows the back-projection image of the model above. Even though the locations of the three seepage channels have been accurately inverted and are relatively clear, the multiple reflections created two false images below the real seepage channels, hindering the accurate identification of seepage channels. RPCA was used to extract the sparse matrix, as illustrated in Figure 4d. It is shown that the seepage channels were accurately extracted. The two false images have similar shapes with the real seepage channels, but their amplitudes are close to the diffracted waves on both sides, so they are weakened by RPCA. In a word, the ease and accuracy of GPR data interpretation were improved by the proposed RPCA algorithm to some extent.
In order to illustrate the applicability of the proposed method to media with different reflectance, we designed a special model, as shown in Figure 5. The relative permittivity distribution in the model is shown in Figure 5a; There are three abnormal bodies with the same scale in the lining, and their relative dielectric constants are 1, 5 and 16, respectively. The forward simulation results of the model are shown in Figure 5b. The lowest anomaly with the highest reflectance has the strongest response, and the uppermost anomaly with the lowest reflectance has the weakest response. Figure 5c shows a back projection image of the above model. Similarly, the imaging of the lowest abnormal body is the strongest, and the imaging of the uppermost abnormal body is the weakest. RPCA is used to extract sparse matrix, as shown in Figure 5d. The results show that this method can accurately extract three abnormal bodies with different reflectance, but the imaging results of abnormal bodies with larger reflectance are clearer.
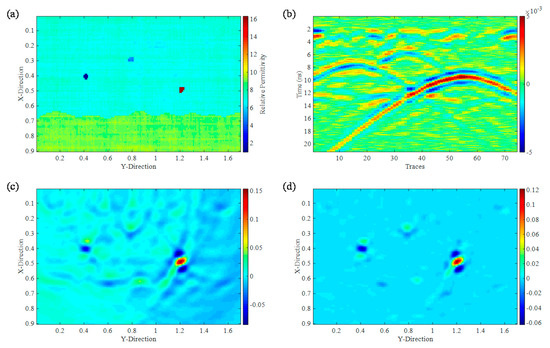
Figure 5.
The model of defects with different reflectance. (a) the distribution of relative permittivity; (b) 2-D GPR profile; (c) back projection imaging; (d) RPCA anomaly extraction.
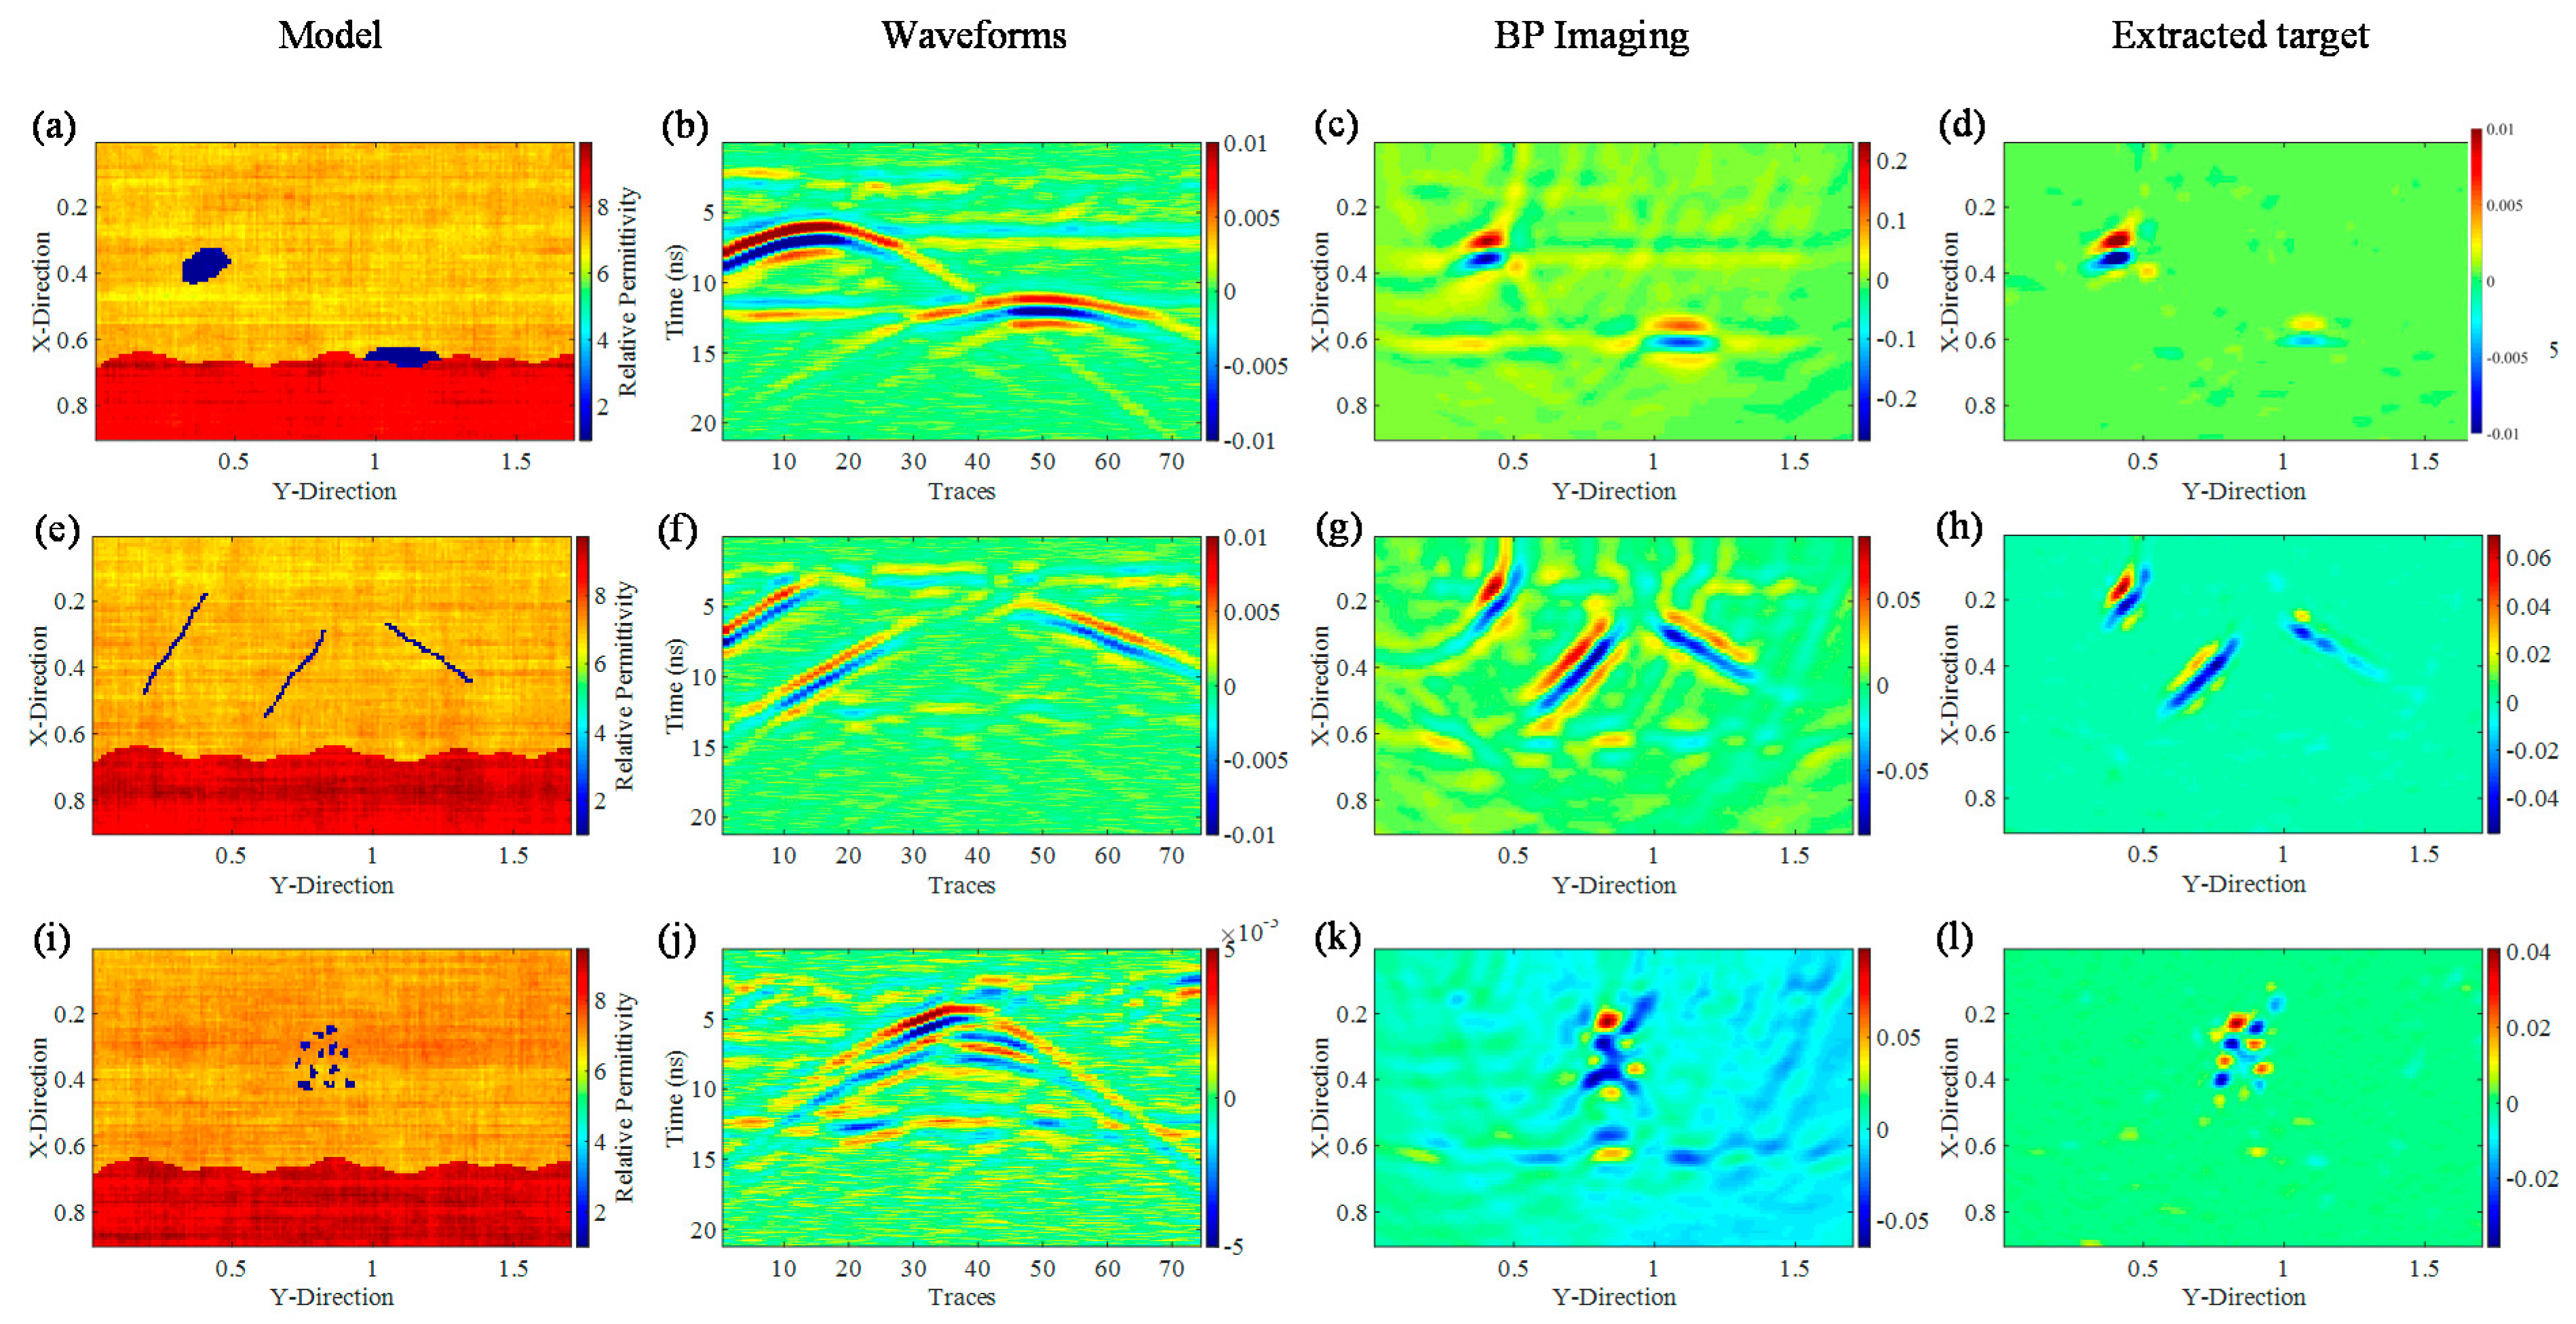
In principle, RPCA can be used to extract the imaging results of any sparse anomaly. This makes RPCA especially well-suited for the identification of point-shaped anomalies such as seepage channels. In addition to seepage channels, the common tunnel lining defects are lining voids, lining-rock separation, fractures and concrete honeycomb [5]. As the features associated with lining voids, cracks and leakages in migration imaging also exhibit sparse characteristics, our approach should, in theory, be able to detect these defects. Of course, when the cracks and lining voids are very large, they could be harder to be detected with RPCA, as the imaging results of these defects are insufficiently sparse. However, this large lining defects are usually obvious in the original BP imaging result, so the lose effectiveness of RPCA has fewer negative effects. Three numerical experiments were designed to test the viability of our algorithm for the detection of common tunnel lining defects, as shown in Figure 6. In the RPCA-extracted sparse matrix (the fourth column in Figure 6), it is shown that our method is highly effective in detecting common tunnel lining defects in GPR data, the shapes and positions of the lining defects is more obvious. However, the cracks of the crack model were not fully extracted, as the imaging results of cracks are not sufficiently sparse. In this case, it is necessary to combine the RPCA results with raw migration imaging data to identify the cracks in the tunnel lining.
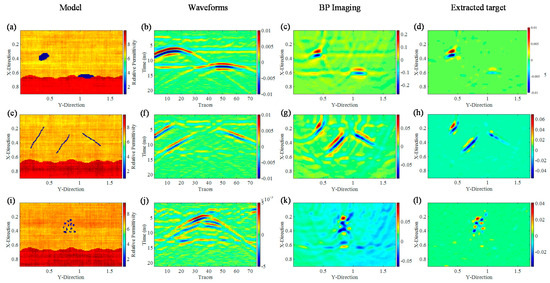
Figure 6.
(a–d) represent the lining voids and lining-rock separation model, waveform, BP imaging, and extracted target, respectively; (e–h) represent the lining fractures model, waveform, BP imaging, and extracted target, respectively; (i–l) represent the concrete honeycomb model, waveform, BP imaging, and extracted target, respectively.
3.2. Case Study of Measured Data
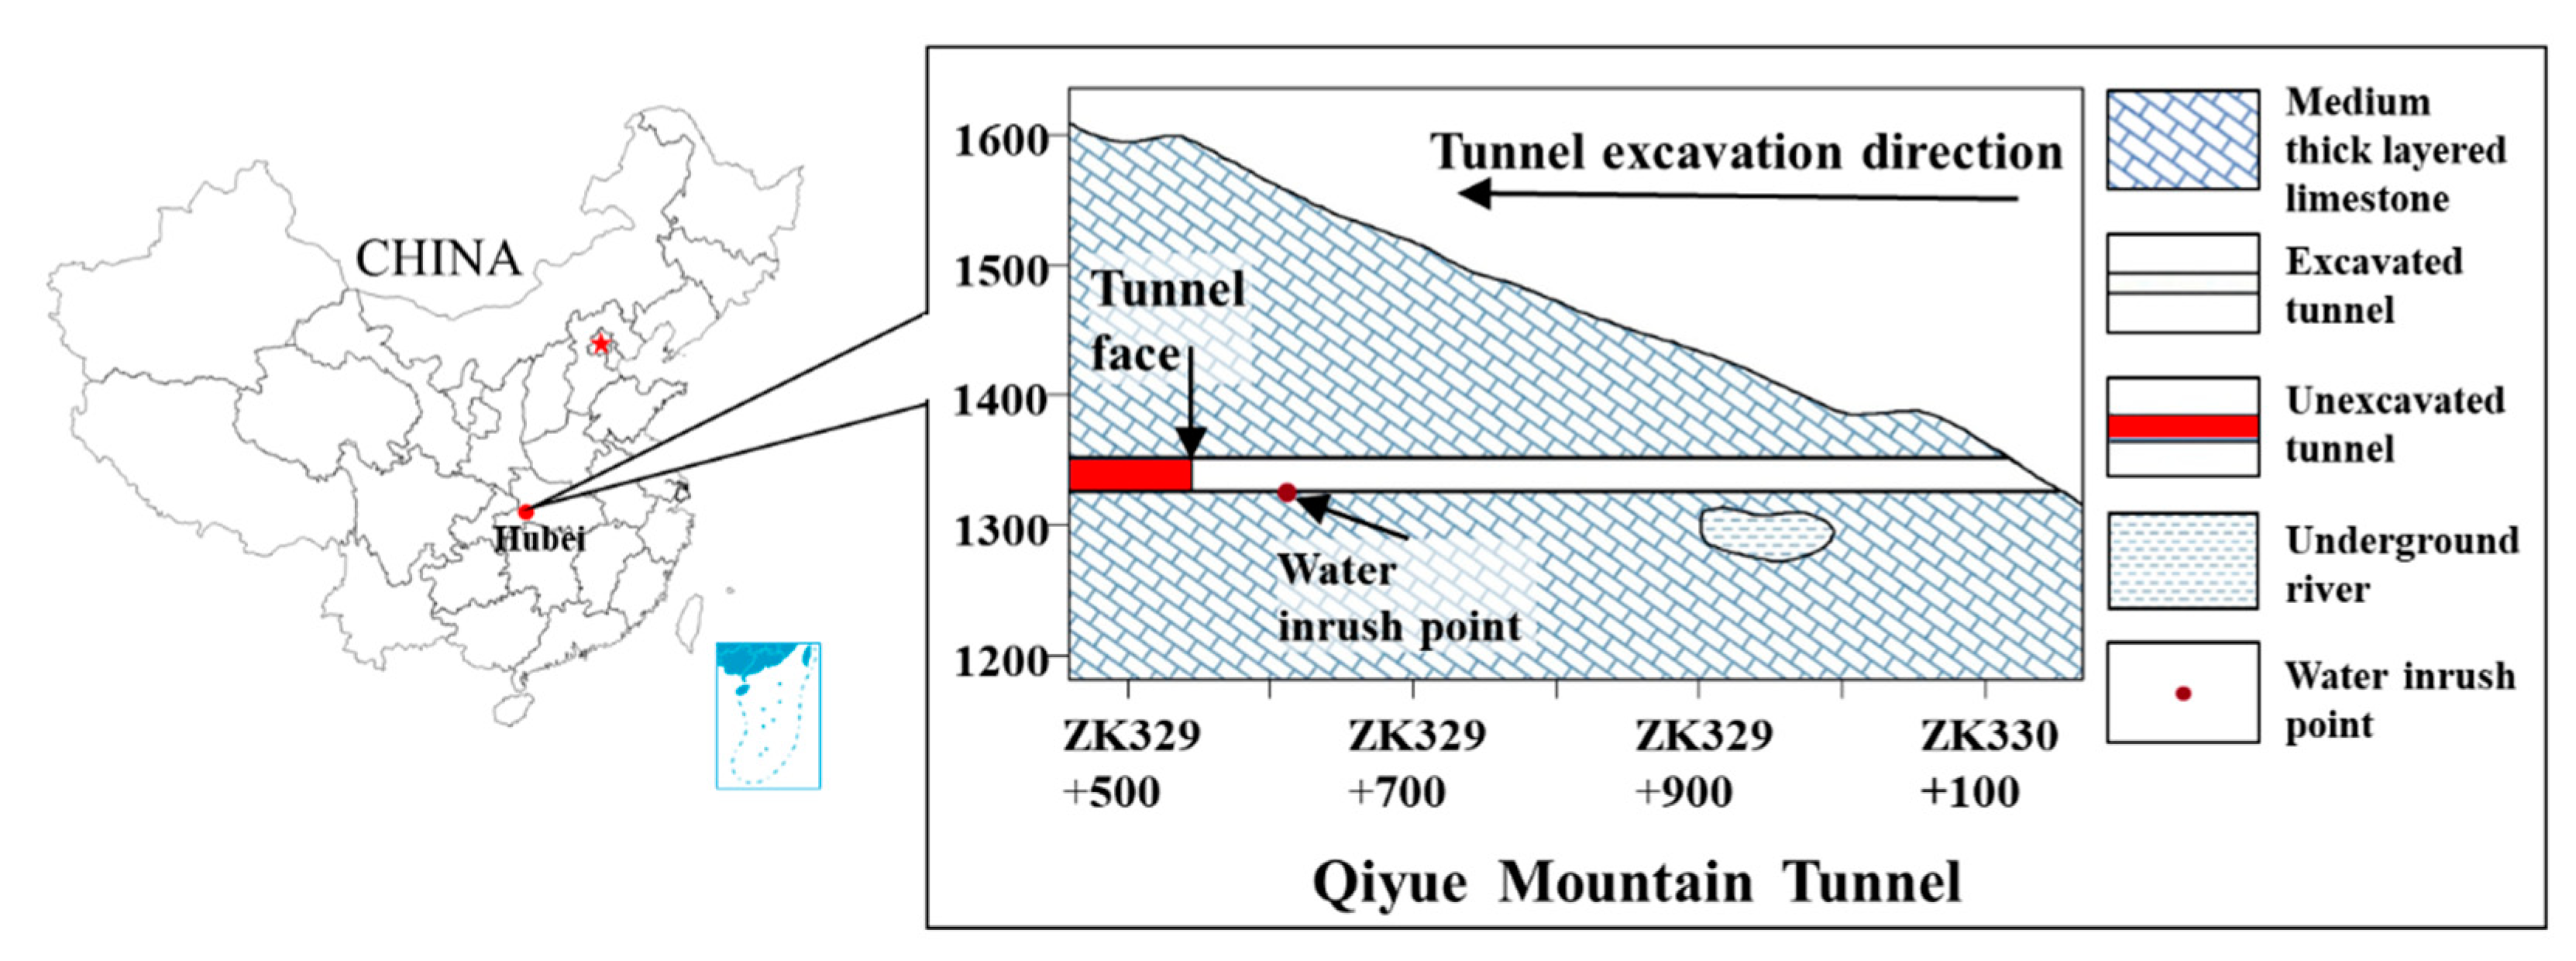
This study describes the application effects of jointly applying the BP and the RPCA algorithms on measured data. The measured data were obtained from Qiyue Mountain Tunnel, China, as shown in Figure 7. There was a gush of water at the bottom of the tunnel. After emptying out the accumulated water, a GPR was used to detect the tunnel floor, aiming to define the location of the seepage channel and carry out the targeted repairs. Data from this case was utilized in the study carried out by [14] but using completely different processing approaches.
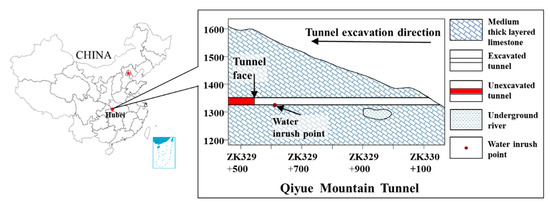
Figure 7.
The positions of Qiyue Mountain tunnel and its longitudinal geological sections from west to east of the studied sections [14].
The detection line is parallel to the tunnel axis and its length is 20 m. The GPR device used here is a GSSI 100 MHz (center-frequency) ground coupled antenna. The time window is about 140 ns. The raw GPR data are shown in Figure 8a. In the raw data, five areas are marked as the leakage passages, in which A1, A2 and A5 have the characteristics of phase axis faults, A3 and A4 have the characteristics of hyperbolic events.
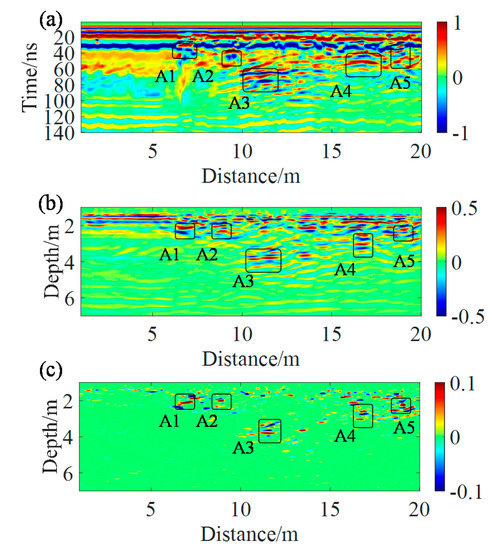
Figure 8.
(a) actual detection data; (b) back projection imaging; (c) robust principal component analysis anomaly extraction.
The corresponding back-projected image is shown in Figure 8b. Even though the responses of the seepage channels have been inverted into points, the interference caused by noise and residual direct waves is still severe in this image. Figure 8c is the RPCA-extracted sparse matrix, and it is shown that the five anomalies were clearer than Figure 8b. Of course, there are still some ghosts in the extracted imaging by RPCA (Figure 8c) and our method cannot completely solve the problem of interpretation of lining defects detection data. Compare the extracted imaging (Figure 8c) and the original BP imaging (Figure 8b), we can say that the RPCA algorithm could make the imaging of lining defects more obvious and clearer to some extent.
We can estimate the interior structure of the tunnel lining, as shown in Figure 9, using Figure 8b,c, which is considerably more accurate than processing data directly. Ref. [14], We dug a hole along the measurement line at ZK329+622 (5.5 m distant from the water entrance site) to check the accuracy of our method’s forecast findings, and discovered water flowing out of the hole, proving the method’s correctness. As a result of the foregoing, the application of our geophysical method in a real scenario was realized.
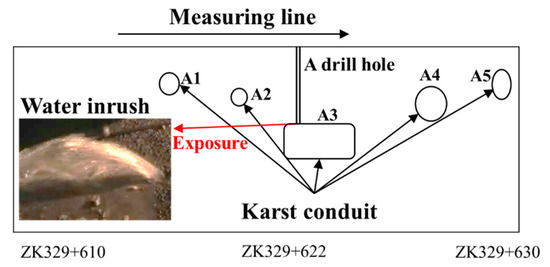
Figure 9.
GPR recognition of the geology below the tunnel floor and the actual situation of water inrush from the drill hole [14].
4. Conclusions
This study proposes a data processing method based on BP imaging coupled with RPCA and deal with the GPR detection data of tunnel lining defects. BP imaging can restore the responses of lining defects and make they closer to the real defects in shape and position. However, in case of poor data quality or complex detection environment, there will be multiple clutter interferences, which will affect the identification of abnormal bodies. On this basis, RPCA can be employed to decompose the migration results, thus separating the imaging part of the minor anomalous body with sparse characteristics and improving the convenience and accuracy for recognizing the minor anomalous body. Numerical simulation cases and measured cases verified the effectiveness of the proposed method, which can identify minor anomalies efficiently and accurately. The experimental results show that this method is suitable for point, linear and planar anomaly bodies and could deal with defects with different reflectance. It could make the radar detection results in complex situations easy to identify and interpret and has the best effect on the imaging and extraction of point anomalies. This algorithm has application potential in detecting and identifying tunnel lining defects.
In addition to lining detection, the algorithm also has certain application potential in other small abnormal body detection scenarios, such as unexploded ordnance detection and pipeline detection. However, it must be pointed out that RPCA is only a matrix factorization method, the extracted imaging results still contain some interference, and the discarded low rank matrix contains some layered or large anomaly information. Therefore, the method of this paper is only to provide an analysis tool for relevant practitioners, rather than to replace the professional interpretation.
Author Contributions
Conceptualization, D.L. and E.Y.; methodology, D.L.; writing—original draft preparation, D.L.; writing—review and editing, E.Y. All authors have read and agreed to the published version of the manuscript.
Funding
This research received no external funding.
Institutional Review Board Statement
Not applicable.
Informed Consent Statement
Not applicable.
Data Availability Statement
The study did not report any data.
Conflicts of Interest
The authors declare no conflict of interest.
References
- Yoo, C. Effect of water leakage in tunnel lining on structural performance of lining in subsea tunnels. Mar. Georesour. Geotec. 2017, 35, 305–317. [Google Scholar] [CrossRef]
- Lin, C.; Wang, X.; Li, Y.; Zhang, F.; Du, Y. Forward Modelling and GPR Imaging in Leakage Detection and Grouting Evaluation in Tunnel Lining. KSCE J. Civ. Eng. 2019, 24, 278–294. [Google Scholar] [CrossRef]
- Zhou, M.; Cheng, W.; Huang, H.; Chen, J. A Novel Approach to Automated 3D Spalling Defects Inspection in Railway Tunnel Linings Using Laser Intensity and Depth Information. Sensors 2021, 21, 5725. [Google Scholar] [CrossRef]
- Qian, W.; Li, H.; Yu, J.; Gu, Z. Theoretical and Experimental Investigation of Vehicle-Mounted Transient Electromagnetic Method Detection for Internal Defects of Operational Tunnels. Appl. Sci. 2021, 11, 6906. [Google Scholar] [CrossRef]
- Liu, Y.H.; Wu, D.Y.; Wang, J.X. Ground-Penetrating Radar Detection of the Defects in Tunnel Lining. Adv. Mater. Res. 2011, 163–167, 3794–3797. [Google Scholar] [CrossRef]
- Zhang, F.; Liu, B.; Liu, L.; Wang, J.; Lin, C.; Yang, L.; Li, Y.; Zhang, Q.; Yang, W. Application of ground penetrating radar to detect tunnel lining defects based on improved full waveform inversion and reverse time migration. Near Surf. Geophys. 2019, 17, 127–139. [Google Scholar] [CrossRef]
- Iftimie, N.; Savin, A.; Steigmann, R.; Dobrescu, G.S. Underground Pipeline Identification into a Non-Destructive Case Study Based on Ground-Penetrating Radar Imaging. Remote Sens. 2021, 13, 3494. [Google Scholar] [CrossRef]
- Li, X.; Lu, X.; Li, M.; Hao, J.; Xu, Y. Numerical Study on Evaluating the Concrete-Bedrock Interface Condition for Hydraulic Tunnel Linings Using the SASW Method. Appl. Sci. 2018, 8, 2428. [Google Scholar] [CrossRef] [Green Version]
- Parkinson, G.; Ékes, C. Ground penetrating radar evaluation of concrete tunnel linings. In Proceedings of the 12th International Conference on Ground Penetrating Radar, Birmingham, UK, 16 June 2008. [Google Scholar]
- Feng, D.; Wang, X.; Zhang, B. Specific evaluation of tunnel lining multi-defects by all-refined GPR simulation method using hybrid algorithm of FETD and FDTD. Constr. Build. Mater. 2018, 185, 220–229. [Google Scholar] [CrossRef]
- Zhou, L.; Huang, C.; Su, Y. A Fast Back-Projection Algorithm Based on Cross Correlation for GPR Imaging. IEEE Geosci. Remote. Sens. Lett. 2012, 9, 228–232. [Google Scholar] [CrossRef]
- Demirci, S.; Yigit, E.; Eskidemir, I.H.; Ozdemir, C. Ground penetrating radar imaging of water leaks from buried pipes based on back-projection method. NDT&E Int. 2012, 47, 35–42. [Google Scholar]
- Qu, L.; Yin, Y. Nonuniform fast Fourier transform-based fast back-projection algorithm for stepped frequency continuous wave ground penetrating radar imaging. J. Appl. Remote Sens. 2016, 10, 45009. [Google Scholar] [CrossRef]
- Liu, B.; Zhang, F.; Li, S.; Li, Y.; Xu, S.; Nie, L.; Zhang, C.; Zhang, Q. Forward modelling and imaging of ground-penetrating radar in tunnel ahead geological prospecting. Geophys. Prospect. 2018, 66, 784–797. [Google Scholar] [CrossRef]
- Candes, E.J.; Xiaodong, L.I.; Yl, M.A.; Wright, J. Robust Principal Component Analysis? Journal of the ACM (JACM) 2011, 58. [Google Scholar] [CrossRef]
- Yu, Z.; Tian, X. In-Wall Clutter Suppression Based on Low-Rank and Sparse Representation for Through-the-Wall Radar. IEEE Geosci. Remote. Sens. Lett. 2016, 13, 671–675. [Google Scholar]
- Kalika, D.; Knox, M.T.; Collins, L.M.; Torrione, P.A.; Morton, K.D. Leveraging robust principal component analysis to detect buried explosive threats in handheld ground-penetrating radar data. SPIE Def. Secur. 2015, 9454, 94541D. [Google Scholar] [CrossRef]
- Masarik, M.P.; Burns, J.; Thelen, B.T.; Kelly, J.; Havens, T.C. GPR anomaly detection with robust principal component analysis. Int. Soc. Opt. Photonics 2015, 9454, 945414. [Google Scholar]
- Song, X.; Xiang, D.; Kai, Z.; Yi, S. Improving RPCA-Based Clutter Suppression in GPR Detection of Antipersonnel Mines. IEEE Geosci. Remote Sens. Lett. 2017, 14, 1338–1342. [Google Scholar] [CrossRef]
- Halman, J.I.; Shubert, K.A.; Ruck, G.T. SAR processing of ground-penetrating radar data for buried UXO detection: Results from a surface-based system. IEEE Trans. Antenn. Propag. 1998, 46, 1023–1027. [Google Scholar] [CrossRef]
- Zetik, R.; Sachs, J.; Thoma, R. Modified cross-correlation back projection for UWB imaging Numerical examples. In Proceedings of the IEEE International Conference on Ultra-Wideband, Zurich, Switzerland, 5–8 September 2005. [Google Scholar]
- Candes, E.J.; Romberg, J.; Tao, T. Robust uncertainty principles: Exact signal reconstruction from highly incomplete frequency information. IEEE Trans. Inform. Theory 2006, 52, 489–509. [Google Scholar] [CrossRef] [Green Version]
- Hong, B.; Wei, L.; Hu, Y.; Cai, D.; He, X. Online robust principal component analysis via truncated nuclear norm regularization. Neurocomputing 2016, 175, 216–222. [Google Scholar] [CrossRef]
- Ikelle, L.T.; Yung, S.K.; Daube, F. 2-D random media with ellipsoidal autocorrelation functions. Geophysics 1993, 58, 1359–1372. [Google Scholar] [CrossRef]


Publisher’s Note: MDPI stays neutral with regard to jurisdictional claims in published maps and institutional affiliations. |
© 2021 by the authors. Licensee MDPI, Basel, Switzerland. This article is an open access article distributed under the terms and conditions of the Creative Commons Attribution (CC BY) license (https://creativecommons.org/licenses/by/4.0/).