Article

Environmental and Economic Evaluation of Mechanical Biological Treatment System for Municipal Waste Considering the Political Framework in Ichihara City

Graduate School of Environment and Energy Engineering, Waseda University, 509, 513 Wasedatsurumakicho, Shinjuku-ku, Tokyo 162-0041, Japan
*
Author to whom correspondence should be addressed.
Appl. Sci. 2021, 11(21), 10296; https://doi.org/10.3390/app112110296
Submission received: 9 September 2021 / Revised: 23 October 2021 / Accepted: 29 October 2021 / Published: 2 November 2021
(This article belongs to the Special Issue New Trends in Waste Management Models)

Abstract

:
Japan’s declining population has caused changes in the amount and characteristics of municipal waste. In order to optimize waste incineration plants as a countermeasure to this problem, we analyzed the performance of the integration of the plants with the Mechanical Biological Treatment (MBT) system. In the integrated system, food waste and sewage sludge from waste incineration plants, sewage treatment plants, and industrial facilities were mixed and fermented to produce methane gas. In this study, we evaluated the environmental and economic performance of the integrated system in four case scenarios. The integrated system is located in Ichihara City in Chiba Prefecture, where the Keiyo Coastal Industrial Zone is located and where petroleum and chemical industries are concentrated. The MBT system in which the heat generated from the incineration of waste was transferred to the Keiyo Coastal Industrial Zone was found to be the best. This method could reduce CO2 emissions by 1341 t-CO2/Y, and the annual cost was the lowest at 1.60 billion yen/Y. However, the results of the sensitivity analysis of the food waste ratio and the piping distance suggested that it may be impossible to obtain appropriate evaluation results without considering the regional characteristics.

Graphical Abstract

1. Introduction

The population of Japan is declining, and the population gap between rural and urban areas has become a social problem. The population is concentrated in big cities such as Tokyo, Nagoya, and Osaka, and the rural population is declining [1]. Therefore, tax revenues are expected to decrease in small cities, and reducing maintenance costs of social infrastructure is necessary. Therefore, environmental and economic reviews are underway at energy-intensive waste incineration plants and sewage treatment plants, which are representative of social infrastructure. In March 2019, the Ministry of the Environment’s “Wider area of waste treatment and integration of waste treatment facility to ensure sustainable proper treatment”, presented six methods for widening and integrating waste treatment facilities [2]. This notification established a waste treatment union, stating the necessity to carry out waste treatment in a wide area and promote the integration of waste treatment functions in cooperation with other infrastructures.
The environmental and economic efficiency of a collaboration between waste incineration plants, sewage treatment plants, and industrial facilities is under evaluation [3,4,5,6,7]. A study that evaluated the environmental friendliness and business profitability of a waste incineration plant and a sewage treatment plant, located adjacent to each other and cooperating, showed that incinerating dry sludge at the waste incineration plant and reusing the heat from the process to heat the water supply for the fire extinguishing tank resulted in a 51% Greenhouse Gas (GHG) emission reduction compared to the normal method [5]. Furthermore, a study that evaluated the feasibility of supplying steam from a sewage treatment plant to an industry in Aichi Prefecture, Japan, showed that the strategy was cost-effective within a 1 km distance, but profitability decreased with increasing distance [6]. These assessments were based on the concept of the life cycle assessment (LCA). LCA is a method for quantitatively evaluating the environmental load of a product or service over its entire life cycle or at a specific stage [8]. This method was also used in the waste fields [9,10,11,12,13,14,15].
Food waste is incinerated in waste incineration plants as combustible waste in Japan. Its high water content causes a decrease in calorific value. To solve this problem, some studies have shown that carbon dioxide (CO2) emissions can be suppressed by separating food waste, performing intensive methane fermentation treatment, and using it as an energy source [16].
In sewage sludge treatment, thermochemical decomposition has been studied to reduce the risk to the environment by converting the sludge into products with added value [17]. Pyrolysis oils obtained with low heating rates, 5 °C/min and 10 °C/min, presented higher heating value compared with the oils obtained at 50 °C/min, which were rich in water and had energy values comparable to those of natural gas, biogas, and gases obtained from plastic pyrolysis [17]. In their study, Okuda et al. estimated the GHG reduction effect of using sludge fuel for industrial and waste incineration plants [4]. It was estimated that about 85% of the total amount of unused sludge could be utilized as energy, and 679,000 t-CO2 of GHG can be reduced by using sludge fuel at paper, cement, and coal-fired thermal power plants within a 150 km radius and co-firing sludge at sewage treatment and waste incineration plants in the same municipality [4].
Recently, Japan has been focusing on mechanical biological treatment (MBT). MBT has become a popular method of treating municipal solid waste (MSW) worldwide [18]. MBT is commonly used across Europe currently [19]. The installation of 50 new MBT plants has increased the waste treatment capacity by 5,000,000 tons, especially in Spain [20]. Some studies conducted LCA when introducing the MBT system in MSW and those that examined the applicability of MBT in the waste management system in Japan. However, the use of the MBT system in Japan remains low as of 2021 [21,22].
A study by Fei et al. compared the environmental and economic performance of landfill treatment, incineration, and MBT treatment of MSW in China [21]. The results showed that the MBT and biogas generation scenario had the best environmental performance. However, another study suggested that MBT generates more leachate than incineration, making it less economical [21]. Abeliotis et al. presented the results of the LCA of MBT in Ano Liosia, Greece, revealing that the environmental benefits of MBT were greater than those of landfill disposal [22].
Evaluating MBT plants in Japan is necessary, but since waste quality and the scale of treatment in facilities differ regionally, it is necessary to consider Japan’s unique regional characteristics [23,24,25,26]. Many LCA-related articles only present inventory data and evaluation results without showing detailed calculation methods; however, unless the detailed calculation process and estimation results are presented, they are not helpful for evaluation in different model regions.
Therefore, the authors aimed to integrate the waste incineration plant in Japan and reduce social costs. The authors attempted to evaluate CO2 emissions and the economic impacts of introducing an MBT system in conjunction with waste incineration plants and existing infrastructure in various model regions of Japan by providing detailed estimation methods [27,28]. In Karatsu City, Saga Prefecture, Japan, there is an example of evaluating greenhouse gas reduction and maintenance costs when a waste incineration plant and a sewage treatment plant are linked [28]. In this paper, we evaluate and discuss the results of introducing the MBT system while considering the heat supply to industrial plants.

2. Materials and Methods

2.1. Goal and Scope Definition

This study aimed to investigate the social impact of introducing the MBT system while the waste incineration plant and sewage treatment plant were cooperating. In this paper, Ichihara, Chiba Prefecture, was set as the model city, and the MBT system was studied in light of Japan’s unique regional characteristics. Therefore, a new waste incineration plant was established around the Keiyo Coastal Industrial Zone. While performing heat interchange, we evaluated the introduction of an MBT system that utilizes Ichihara City’s MSW and sewage sludge. The evaluation items were CO2 emissions and maintenance costs. The system boundary examined the point where household waste and sewage sludge are transported to the waste incineration plant and the sewage treatment plant and where they are disposed of as ash or discharged into the sewage. The detailed methodology is shown below.

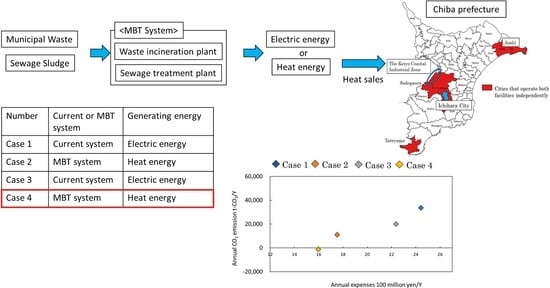
2.1.1. Model Area Settings

The authors conducted a questionnaire survey of local governments across Japan in 2019, identified the issues for cooperation between waste incineration plants and sewage treatment plants, and presented the conditions under which local governments with a high possibility of cooperation can be achieved [29]. Japan’s waste incineration plants may be operated by a union that brings together multiple local governments or be operated independently by a single local government. However, in union operation, cooperation with the sewage treatment plant cannot be considered without the agreement of all participating local governments, which is a barrier to cooperation between the two facilities. In addition, there are two types of sewage treatment plants: the “public sewerage system” operated by each local government and the “watershed sewerage system” operated by the prefecture. The watershed sewerage system is less likely to cooperate for similar reasons mentioned above. Japan has the most waste incineration plants in the world and has numerous subdivided organizations to manage them. This situation complicates cooperation between facilities, though cooperation is high when they are operated independently [29]. Therefore, to secure local governments’ cooperation, waste incineration plants and sewage treatment plants’ jurisdiction and management methods were input to QGIS 3.20 and visualized [30]. Figure 1 shows the results of visualizing the municipalities in Chiba Prefecture that operate both facilities independently.
In Chiba Prefecture, the following four cities corresponded to this: Ichihara City, Sodegaura City, Asahi City, and Tateyama City. The Keiyo Coastal Industrial Zone is near Ichihara City, and the city was set as the model area, considering the possibility of reducing the loss by using the waste energy generated industrially.

2.1.2. Evaluation Case Settings

Waste incineration plants generally generate boiler, turbine, generator (BTG) power in Japan, and the electricity and hot water generated may be supplied to public facilities such as pools in the vicinity. However, if there is no facility with high heat demand around the waste incineration plant, the generated heat is surplus. This study evaluates environmental and economic efficiency under the assumption that a new waste incineration plant will be built around the Keiyo Coastal Industrial Zone when the waste incineration plant reaches renewal time. Currently, Ichihara City incinerates MSW of 520 t/D totally for the first and second factories of the Ichihara City Fukumasu Clean Center. The sewage treatment facility, Matsugashima Terminal Treatment Plant, has a treatment capacity of 53,200 m3/D.
The cases to be evaluated in Ichihara City were divided into four. Cases 1 and 2 were divided into those in which MSW was incinerated without the MBT system and where generated heat was used for power generation or industrial utilization. In Case 3 and Case 4, biogas power was generated by the MBT system, and the heat generated by the incineration of unsuitable fermentation products was used for power generation or industrial utilization.
The treatment flow in Case 1 was the most used treatment flow in Japan and was the standard for this evaluation.

2.1.3. Establishment of Waste Quality and Sewage Sludge Components

Table 1 presents the combustible waste in Ichihara City classified into the following four items: paper, kitchen waste, plastic, and other items; the components of each waste are summarized. The weight composition ratio was set based on Ichihara City’s basic plan for general waste disposal, and the other values were set based on Ogawa et al. [28,31]. Since the three components and elemental composition of waste did not change significantly depending on the region, only the weight composition ratio was set based on the data of Ichihara City. The lower heating values other than kitchen waste were calculated from Steuer’s equation, shown in Equation (1). The lower heating value (LHV) of food waste is calculated using Equation (2) [32].
H L H V = 4.184 × { 8100 × ( ( c ) 3 8 ( o ) ) + 5700 × 3 8 ( o ) + 34,500 × ( ( h ) o 16 ) + 2500 × s 600 × 9 × ( h ) + ( w ) } ,
F L H V = 4.184 × 4500 × ( f ) 600 × ( w ) ,
where
  • HLHV = Lower heating value [kJ/kg]
  • FLHV = Lower heating value for food waste [kJ/kg]
  • (c) = Weight percentage of carbon [%]
  • (o) = Weight percentage of oxygen [%]
  • (h) = Weight percentage of hydrogen [%]
  • (s) = Weight percentage of carbon [%]
  • (w) = Weight percentage of water [%]
  • (f) = Weight percentage of combustible content [%].
The sewage sludge component was set as shown in Table 2, as stated by Ogawa et al. [28]. A total of 22.2 t/D of dewatered sludge was generated from the sewage treatment plant in Ichihara City, and the thickened sludge amount and fermentation sludge amount were calculated based on the mass percentage in Table 2.
Table 3 shows the material balance before and after fermentation when the MBT system was introduced. The VS decomposition rate was 77.5%, and the VS decomposition rate of sewage sludge was 50.0% [28]. Based on the material balance in Table 3, the amount of dewatered residue incinerated in the waste incineration plant was calculated, and the combustible waste qualities of Cases 3 and 4 are summarized in Table 1. The lower heating value of the dewatered sludge was calculated from Equation (1).

2.1.4. Calculation of Power Output and Steam Generation

The power output of the generator of the waste incineration plant was calculated by using Equation (3) based on the lower heating value shown in Table 1. The power generation efficiency of BTG power generation was assumed to be 20%.
O I = C L H V × 1000 3600 × 24 ×   S I   ×   20 % ,
where
  • OI = Output of the generator of the waste incineration plant [kW]
  • CLHV = Lower heating value of combustible waste [kJ/kg]
  • SI = Scale of incinerator treatment [t/D].
The output of biogas power generation in sewage treatment facilities was calculated using Equations (4) and (5) based on the components of sewage sludge shown in Table 2. The gas conversion of food waste was 0.84 Nm3/kg-digestion VS for food waste, the gas conversion of sewage sludge was 0.55 Nm3/kg-input VS for thickened sludge, the lower calorific value of biogas was 22,000 kJ/Nm3, and the efficiency of biogas power generation was 37%.
F o r   C a s e   1   a n d   C a s e   2 , O S = B L H V × V T × A T × 1000 3600 × 24 × O r g a n i c   c o n t e n t T o t a l × 37 % ,
F o r   C a s e   3   a n d   C a s e   4 , O S = B L H V × [ V F × A B A A × 1000 ]   +   V T × A T × 1000 3600 × 24 × O r g a n i c   c o n t e n t T o t a l × 37 % ,
where
  • OS = Output of the generator of the sewage treatment plant [kW]
  • BLHV = Lower heating value of biogas = 22,000 [kJ/Nm3]
  • VT = Gas conversion volume of thickened sludge = 0.55 [Nm3/kg-input VS for thickened sludge]
  • AT = Amount of thickened sludge [t/D]
  • VF = Gas conversion volume of food waste = 0.84 [Nm3/kg-digestion VS for food waste]
  • AB = Amount of VS for food waste before fermentation = 25.6 [t/D]
  • AA = Amount of VS for food waste after fermentation = 5.8 [t/D].
The amount of steam generated from the incinerator of the waste incineration plant was calculated from Equation (6). The boiler efficiency was assumed to be 85%.
O I = C L H V × 1000 3600 × 24 × S I × 85 % ,

2.1.5. Method for Estimating Construction Costs

The estimation formula for the construction cost of the waste incineration plant used the same calculation formula as the evaluation in Karatsu City, and the construction cost of the sewage treatment plant used the estimation formula published by the Ministry of Land, Infrastructure, Transport, and Tourism [28,33,34]. Table 4 and Table 5 present the formulas for calculating the construction costs of waste incineration plants and sewage treatment plants, respectively.

2.1.6. Method of Estimating Maintenance and Management Expenses

Similarly, the conditions for setting maintenance expenses for this evaluation were the same as those for the evaluation in Karatsu City [28]. However, costs for transportation and the conditions when energy during waste incineration was used for heat were newly set in Cases 2 and 4. Table 6 shows the inventory data and setting conditions for waste incineration plants and sewage treatment plants [28,35]. Table 7 shows the setting conditions required to calculate the transportation costs for food waste and sewage sludge in Ichihara City [28]. Table 8 shows the conditions, such as piping distance for heat utilization. The transportation distance between the newly constructed waste incineration plant and the seasonal sewage treatment plant was set to 10 km. The distance between the waste incineration plant newly constructed in the Industrial Zone and the heat supply destination was set to 3 km, and the heat loss in the piping at that time was set to 20%. In addition, assuming that the steam pipe was installed underground, the unit price of heat sales was calculated as 2 yen/MJ [36].

2.1.7. Method for Estimating CO2 Emissions

The equation for calculating the CO2 emission is shown in Equation (7).
ECO2 = E1 + E2 + E3 + E4 + E5 − S1 − S2 − S3,
where
  • ECO2 = Total annual CO2 emissions for each case [t-CO2/Y]
  • E1 = Total annual CO2 emissions from waste incineration [t-CO2/Y]
  • E2 = Total annual CO2 emissions from electricity consumption of the waste incineration plant during suspension periods [t-CO2/Y]
  • E3 = Total annual CO2 emissions from electricity consumption of biogas power generation facilities [t-CO2/Y]
  • E4 = Total annual CO2 emissions generated during transportation [t-CO2/Y]
  • E5 = Total annual CO2 emissions from N2O generated during waste incineration [t-CO2/Y]
  • S1 = Total annual CO2 emissions reduced by waste power generation [t-CO2/Y]
  • S2 = Total annual CO2 emissions reduced by biogas power generation [t-CO2/Y]
  • S3 = Total annual CO2 emissions that could be reduced through in-house consumption or heat supply to neighboring facilities. [t-CO2/Y].
Equation (8) through Equation (20) show how to calculate the values required by Equation (7). In Equation (8), paper waste and food waste are excluded because they are carbon-neutral, and only plastic and other waste are included in the calculation. In addition, the annual waste disposal volume was calculated based on the waste volume input to the waste incinerator shown in Figure 2 and Figure 3 and the number of working days shown in Table 6. For Case 1 and Case 2, it was 145,600 [t-waste/Y], and for Case 3 and Case 4, it was 128,484 [t-waste/Y].
E 1 = V W × γ p + γ o × γ p × γ p c + γ o × γ o c γ p + γ o × γ p c × C p × γ p + γ o c × C o × γ o γ p c × γ p + γ o c × γ o × 44 12 ,
where
  • VW = Annual waste disposal volume = 145,600 or 128,484 [t-waste/Y]
  • γp = Weight composition percentage of plastic = 13.7 or 15.5 [%]
  • γo = Weight composition percentage of other waste = 26.2 or 29.7 [%]
  • γpc = Percentage of combustible content of plastic = 74 [%]
  • γoc = Percentage of combustible content of other waste = 51 [%]
  • Cp = Percentage of carbon content in plastic = 74 [%]
  • Co = Percentage of carbon content in other waste = 40 [%].
In Equation (9), the waste incineration facility’s power consumption was conditioned to be purchased from outside only when the incinerator was suspended. Therefore, we used 5.5 kWh/t-waste, which was the power consumption of waste incineration during suspension periods shown in Table 6 [37].
E 2 = 5.5 × V W × Ε e ,
where
  • Εe = Electric power emission factor = 0.512 [kg-CO2/kWh].
In Equation (10), the power consumption of biogas power generation was calculated as the sum of the power required in mixing, digestion, dewatering, and incineration.
E3 = E3-1 + E3-2 + E3-3 + E3-4,
where
  • E3-1 = Total annual electricity consumption during mixing process [kWh/Y]
  • E3-2 = Total annual electricity consumption during digestion process [kWh/Y]
  • E3-3 = Total annual electricity consumption during dewatering process [kWh/Y]
  • E3-4 = Total annual electricity consumption during incineration process [kWh/Y].
E3-1 was defined as Equation (10) in the Ministry of Land, Infrastructure, Transport, and Tourism’s document [38]. The mixing tank exists only in Case 3 and Case 4 and was set to hold the mixture of thickened sludge and raw sewage for two days. Therefore, the mixing tank capacity Q1 was 1269 m3, which was twice the value of 634.2 t/D shown in Figure 3. The power generated in the digestion, dewatering, and incineration could be calculated based on the coefficients shown in Table 6 and the amount of thickened or dewatered sludge.
E3-1 = 9.45 × Q10.493 × 1000,
where
  • Q1 = Mixing tank capacity = 1269 [m3].
In Equation (12), if the round-trip distance between the two facilities was set at 20 km and 10-ton trucks make three round-trips a day, five trucks were needed to transport all the raw garbage, and three trucks were needed to transport the sewage sludge.
E 4 = D × N r × d × N t F × Ε d ,
where
  • D = round-trip distance = 20 [km/time]
  • Nr = Number of round trips = 3 [time/unit]
  • d = Number of working days = 280 [days]
  • Nt = Number of trucks required = 5 or 3 [units]
  • F = Fuel efficiency of 10-ton truck = 4.15 [km/L]
  • Εd = Diesel fuel emission factor = 2.619 [kg-CO2/L] [39].
In Equation (13), NOx emissions were assumed to be 0.017% of the total amount of waste disposed, 24.41 t/Y per year in Case 1 and Case 2, and 21.54 t/Y per year in Case 3 and Case 4, assuming that 1.54% of these emissions were N2O, the CO2 emissions are calculated.
E 5 = E N O x × R N 2 O × E N 2 O
where
  • ENOx = Annual NOx emissions = 24.41 or 21.54 [t/Y]
  • RN2O = Ratio of N2O in NOx = 1.54 [%]
  • ΕN2O = N2O warming coefficient = 298 [t-CO2/t-N2O] [40].
We assumed that the power required for waste incineration was 140 kWh/t-waste. Also, the Ministry of Land, Infrastructure, Transport, and Tourism stated that the power consumption required by the mechanical sorter could be calculated by Equation (16) [38].
S 1 = ( O I × 24 × d P S 1 P m ) × Ε e ,
where
  • OI = Output of the generator of the waste incineration plant [kW]
  • PS1 = Annual power consumption required for waste incineration [kWh/Y]
  • Pm = Annual power consumption required for machine sorting [kWh/Y].
P S 1 = 140 × V W ,
P m = 94.575 × Q 2 0.4298 × 1000 ,
where
  • Q2 = Amount of food waste disposed = 177.8 [t/D].
In Case 1 and Case 3, the heat supply was assumed to be 60% of the power generated by the incineration plant, and all the heat was supplied. In Case 2 and Case 4, the heat supply was calculated based on the steam generation shown in Figure 2 and Figure 3, as well as the heat loss of the piping shown in Table 8. For the biogas power generation system, the total efficiency was assumed to be 75%, and the heat supply was calculated to be 38% after subtracting the power generation efficiency. Finally, all the heat supply was converted to kerosene, and CO2 reduction was calculated based on the kerosene emission factor [40].
S 2 = O S × 24 × d × Ε e ,
F o r   C a s e   1   a n d   C a s e   2 , S 3 = { ( O I × 24 × d × 3600 1000 × 0.6 ) + ( O S × 24 × d × 3600 1000 × 75 37 37 ) Q 3 } ÷ V k × E k 1000
F o r   C a s e   3   a n d   C a s e   4 , S 3 = { [ V S × 24 × d × 3600 × 1 0.2 ] + ( O S × 24 × d × 3600 1000 × 75 37 37 ) Q 3 } ÷ V k × E k 1000
where
  • OI = Output of the generator of the waste incineration plant [kW]
  • OS = Output of the generator of the sewage treatment plant [kW]
  • Q3 = Heat demand (Required heating value for biogas power generation facility) [MJ/Y]
  • Vk = Kerosene calorific value = 36.49 [MJ/L]
  • Εk = Kerosene emission factor = 2.489 [kg-CO2/L] [40]
  • VS = Steam heating value = 44.5 or 42.0 [MJ/s].
Q3 was calculated using Equation (20).
Q 3 = m c T T × 1 + A × 1 1000 ,
where
  • m = Amount of sludge input to the fermenter [t]
  • c = Specific heat [kJ/kg °C]
  • T = Fermenter temperature (wet medium temperature) = 35 [°C]
  • T’ = Atmospheric temperature = 15 [°C]
  • A = Heat dissipation = 20 [%].

2.2. Inventory Data Analysis

2.2.1. Treatment Flow and Material Balance in Each Case

The process flow and material balance of Case 1 and Case 2 are shown in Figure 2; those of Case 3 and Case 4 are shown in Figure 3. The machine sorting rate for food waste in Cases 3 and 4 was set at 80%, similar to the evaluation in Karatsu City [28]. In Case 1, calculated using Equations (3) and (4), the waste incineration plant could generate 10,400 kW of electricity, and the sewage treatment plant side could generate 290 kW. Similarly, in Case 3, the waste incineration plant could generate 9900 kW of electricity, and the sewage treatment plant could generate 1800 kW. In Case 4, 42 MJ/s of steam could be obtained.

2.2.2. Energy Balance in Each Case

The energy balance of each case was calculated based on the setting conditions shown above. The energy balance is shown in Figure 4. The amount of thermal energy stated in Figure 4 was estimated from the data of the Ministry of the Environment [41].

2.3. Inventory Data Analysis

In many Asian countries, 50% or more of its waste is organic waste, but in Japan, there are a few cities where the ratio of organic waste in MSW is 50% or greater [42]. In addition, it has been predicted that the number of plastic emissions will increase in the future [43]. Based on these findings, it is highly likely that the food waste ratio, the plastic ratio, and the length of piping distance will also change as the model region changes. Furthermore, changes in these values will result in changes in the amount of biogas generated by the MBT, the amount of heat generated by the refuse incineration plant, and the amount of heat supplied to the industrial plant. Therefore, to analyze the results of the estimation of the annual cost and CO2 emissions in detail, we performed sensitivity analysis when the values of the food waste ratio, the plastic ratio, and the length of the pipe distance are varied and present the estimation method for discussion.

2.3.1. Sensitivity Analysis Method for Food Waste Ratio and Plastic Ratio

The sensitivity analysis of the food waste ratio was conducted by calculating the CO2 emission and annual cost when the ratio of food waste to be collected was varied between 10.0%, 20.0%, 34.2%, and 50.0%. The sensitivity analysis of the plastic ratio was conducted by calculating the CO2 emission and annual cost when the ratio of plastic to be collected was varied between 10.0%, 13.7%, 20.0%, and 30.0%. By changing the food waste ratio and the plastic ratio, the weight composition ratio of other waste also changes. The values were adjusted by taking the average values of the changes in the ratios and adding them to the weight composition ratio of each waste. Table 9 summarizes the weight composition ratio of each waste when the food waste ratio and the plastic ratio are changed.

2.3.2. Sensitivity Analysis Method for Steam Transport Piping Distance

The sensitivity analysis of the steam transport piping distance was conducted by calculating the CO2 emissions and annual cost when the steam transport piping distance was changed to 2 km, 3 km, 4 km, 5 km, and 6 km. In the sensitivity analysis, the piping loss was set to 6.7%/km because it was set to 20% when the piping distance was 3 km in Table 8.

3. Results and Discussion

3.1. Results of CO2 Emissions and Economic Evaluation

Table 10 and Figure 5 show the results of calculating CO2 emissions of each case, Table 11 and Figure 6 show the results of calculating the economic efficiency, and Figure 7 shows the results of both cases.

3.2. Sensitivity Analysis of Food Waste Ratio

We calculated the values when the food waste ratio was changed to 10.0%, 20.0%, 34.2%, and 50.0%, and summarized them in a graph. The results are shown in Figure 8.

3.3. Sensitivity Analysis of Plastic Ratio

Figure 9 shows the evaluation results when the plastic ratio was changed to 10%, 13.7%, 20%, and 30%.

3.4. Sensitivity Analysis of Piping Distance

The results of the sensitivity analysis for the piping distance are shown in Figure 10.

3.5. Discussion on Evaluation Results

It could be seen that CO2 emissions were superior in the descending order of Case 4, Case 2, Case 3, Case 1, using Figure 5. This reduction was due to the heat supply to the Keiyo Coastal Industrial Zone being as large as 58745 t-CO2/Y in Case 2 and 57376 t-CO2/Y in Case 4. In Cases 3 and 4, the reduction due to biogas power generation was 6391 t-CO2/Y, and this value resulted in a negative CO2 emission in Case 4.
It could be seen that the economic efficiency was superior in the order: Case 4 > Case 2 > Case 3 > Case 1, in Figure 6. This was because the reduction due to heat sales was as large as 1.72 billion yen/Y in Case 2 and 1.63 billion yen/Y in Case 4, as in the case of CO2 emissions. In addition, the reduction in biogas power generation due to electricity sales was contributed by the fact that Case 3 was larger than Case 1 and Case 4 was larger than Case 2. In Cases 3 and 4, the depreciation expenses were higher than in Cases 1 and 2 because the depreciation costs for utilization as heat are included. However, this result was obtained because the reduction due to heat sales was larger than the rate of increase.
It could be said that the case was superior as the plot goes to the lower left from Figure 7, so it could be said that it was superior in the descending order of Case 4, Case 2, Case 3, Case 1.
Comparing Cases 1 and 2 in Figure 5, the reduction in Case 1 was 37,118 t-CO2/Y, including incinerator power generation and heat supply, whereas Case 2 can reduce 59789 t-CO2/Y, which was approximately 1.6 times higher. Comparing Case 3 and Case 4, the reduction in Case 3 is 42528 t-CO2/Y due to the addition of fermentation power generation, but Case 4 was 63767 t-CO2/Y, which is approximately 1.5 times higher. Since the heat use cases are the first and second best, it could be seen that the effect of reducing the social cost of supplying heat to the Keiyo Coastal Industrial Zone was large. Comparing Case 1 and Case 3, the reduction in CO2 emissions was approximately 1.1 times greater in Case 3, indicating that even in the case of power generation, the introduction of the MBT system results in a bigger CO2 emission reduction. This was because it not only reduces the amount of food waste incinerated and the amount of CO2 emitted during waste incineration but increases the amount of digestion gas generated by mixed methane fermentation of food waste and sewage sludge and increases CO2 reduction. This was also the case when comparing Cases 2 and 4.
It could be seen that the annual cost reductions in Cases 2 and 4 are large at 1.80 billion yen/Y and 2.11 billion yen/Y, respectively, and the income from heat sales by using the heat was excellent, as established in CO2 emissions evaluation presented in Figure 6. Comparing Cases 1 and 3, Case 3 performs mixed biogas power generation of food waste and sewage sludge and has an annual cost reduction of 1.11 billion yen/Y, which was approximately 1.5 times greater than that of Case 1. The annual cost could be reduced when the MBT system was introduced.
Summarizing the above results and evaluating the CO2 emissions and economic efficiency of the introduction of the MBT system in Ichihara City, it was confirmed from Figure 7 that Case 4, Case 2, Case 3, and Case 1 are superior in descending order.
In developing countries, MSW was often treated by landfill and incinerators, and a study that evaluated LCA when the MBT system was introduced found that the case of landfilling MSW produced the worst evaluation result, and the energy efficiency was high when the MBT system was introduced; however, it could be said that the same evaluation results were obtained in this study when the MBT system was introduced in Ichihara City [21]. In addition, a study comparing the case of landfill disposal and the introduction of MBT in Greece indicated the superiority of introducing the MBT system [22]. A study by Fei et al. showed that the introduction of an MBT system required financial support in 2018, but in Ichihara City, Cases 3 and 4 with the MBT system were superior to Case 1, a general waste treatment case in Japan; therefore, it can be said that the introduction of the MBT system was economically superior, differing from the results of the existing research [21]. In Japan, there were few cases of landfill disposal of MSW, and it was often incinerated and used for power generation. The evaluation presented in this study indicated that the observed results were better when the MBT system was introduced. Maki et al. has evaluated the steam supply potential from the waste treatment field to the industrial world, and the results showed the potential of Aichi Prefecture, Japan, in 2021, but this study was an evaluation of Ichihara City, Chiba Prefecture, which was different from Aichi Prefecture, and was considered for the construction of an industrial use model of waste energy in Chiba prefecture [6].

3.6. Discussion on Sensitivity Analysis of Food Waste Ratio

From Figure 8, it could be seen that as the ratio of food waste increased, CO2 emissions decreased in all patterns, but annual costs increased. The trade-off relationship between CO2 emissions and annual expenses due to changes in the food waste ratio was evident, and Case 4 had an advantage in most conditions. However, comparing Cases 2 and 4, it could be seen that when the food waste ratio was close to 50%, Case 2 had an advantage in annual expenses.
In Case 4, when the food waste ratio was 10%, the heat sales expenses amounted to 2.28 billion yen/Y, while when the food waste ratio was 50%, the heat sales expenses amounted to 1.18 billion yen/Y. In addition, electricity sales expenses at 10% amounted to 197 million yen/Y, while the expenses amounted to 676 million yen/Y at 50%. As a result, in Case 4, the annual cost when the food waste ratio was 1.07 billion yen/Y at 10%, whereas when the food waste ratio was 50%, it was 1.94 billion yen/Y; this was the largest increase in annual expenses. As the food waste ratio increased, the calorific value of waste decreased, and the amount of heat obtained during waste incineration decreased. Hence the heat sales expenses due to heat utilization decreased. As the food waste ratio increased, the amount of biogas power generation increased, but the amount of decrease in heat sales expenses was larger than the amount of increase in electricity sales expenses due to methane fermentation; hence, the annual cost increased.
Case 4 used heat, and the annual cost changed significantly considering the change in food waste ratio. This suggests that if the waste quality is unstable, the annual cost may also be unstable. In addition, since it is necessary to supply stable steam to supply heat to the Industrial Zone, if the waste quality is unstable, it may greatly impact the supply chain. Accounting for changes in waste quality due to population decline is necessary when implementing a plan like Case 4.
The results of this evaluation indicated that the annual cost tended to increase as the food waste ratio increased. This tendency reflected the result calculated by utilizing the estimation formula of construction expenses considering land and personnel costs when introduced in Japan or electricity sales and price of heat sales in Japan as shown in Table 4 and Table 5; similar trends are not always seen in Asian countries. However, when heat is mainly used for peripheral facilities such as industrial facilities, the lack of heat in waste incineration due to the high food waste ratio can be an issue.

3.7. Sensitivity Analysis of Plastic Ratio

Figure 9 established that the annual cost decreased as the plastic ratio increased in all cases, but the CO2 emissions increased, indicating a trade-off relationship.
Cases 2 and 4 have a larger rate of decrease in annual expenses than Cases 1 and 3. However, this was because the heat sales expenses were increasing due to the increase in the calorific value of waste due to the increase in plastics. In Cases 1 and 3, even if the amount of heat generated by waste increases, it could only be used for waste incineration power generation, which was less efficient than the case where heat was used, and electricity sales could only be carried out at 13 yen/kWh. Therefore, annual cost reduction did not increase.
When the plastic ratio increased, CO2 emissions increased significantly because the plastic was incinerated in all cases. Therefore, it could be seen from this sensitivity analysis that considering methods other than thermal recycling of plastic waste for reducing CO2 emissions due to waste incineration was necessary.

3.8. Sensitivity Analysis of Piping Distance

From the results shown in Figure 10, when the piping distance reached 5.59 km, the annual costs for Cases 3 and 4 were the same, and it was found that when the piping distance reached 5.71 km, the annual costs of Cases 1 and 2 were the same. The CO2 emissions were superior to the case of using heat, but the annual cost may be higher, so establishing a waste incineration plant assuming that heat will be used after introducing the MBT system at a point more than 5.59 km away from the heat supply destination, was difficult. Similarly, Maki et al. stated that the cost-effectiveness deteriorates when the distance between the waste incineration plant and the industrial facility increases, and the profitability decreases when the distance is 1 km or more while evaluating Aichi Prefecture in 2021 [6]. Since the piping distance that maintained profitability varied depending on the unit price of heat sales, the appropriate piping distance value varied regionally. However, when considering heat utilization, the distance between the waste incineration plant and the industrial facility could be a crucial factor in evaluating economic efficiency.

3.9. Discussion of Issues

To obtain this evaluation result, the construction cost was calculated based on the estimation formulas shown in Table 4 and Table 5. However, this estimation formula was an estimation formula that was set considering land and personal costs in Japan and was not suitable for use when considering the introduction of equipment overseas. In addition, this evaluation was conducted assuming that Keiyo Coastal Industrial Zone will purchase the heat obtained during waste incineration unconditionally for 24 h. However, since the supply destination may have conditions such as pressure, temperature, and the time zone in which it was desired to be supplied, confirming whether the heat generated during waste incineration meets these conditions were necessary. Therefore, depending on the conditions of the supply destination, the value of income from heat sales may fluctuate greatly, and the values of Cases 2 and 4 may change. Conversely, it could be said that Cases 1 and 3 that used power generation were less affected by the conditions of the Keiyo Coastal Industrial Zone.
In addition, from the sensitivity analysis results shown above, when the waste quality value was changed, as shown in Figure 8 and Figure 9, the CO2 emissions and economic values changed significantly. Therefore, when comparing with existing treatment methods, the superiority may change in some cases unless the evaluation considered future fluctuations in waste quality.
When evaluating the introduction of the MBT system in various regions, it is necessary to consider these because the waste quality and maintenance costs will change due to differences in countries and regional characteristics. In Ichihara City and Chiba Prefecture, facilities with high heat demand existed in the neighborhood, so this was added to the conditions. For example, in developing countries, there were likely no facilities with high heat demand, so it was considered less meaningful to evaluate cases centered on heat utilization.
There were some challenges in realizing the cooperation with the existing infrastructure for the integration of the waste incineration plant. For example, for linking with existing infrastructure, it was necessary to obtain the consensus of the organization that operates the infrastructure. However, obtaining an agreement may be difficult due to a lack of understanding of the residents or a lack of legislation. Furthermore, to reduce social costs, facilities with high heat demand in the neighborhood and businesses that purchase fermentation residues as fertilizer were necessary. Currently, decarbonization is gaining attention worldwide, and we hope that this growing interest in environmental issues will solve the issues mentioned above.

4. Conclusions

We evaluated CO2 emissions and the economic efficiency of introducing the MBT system in Ichihara City, Chiba Prefecture, Japan, considering the heat accommodation in the Keiyo Coastal Industrial Zone where petroleum and chemical industries are concentrated. Four cases were examined, and it was found that the case of supplying heat to the Keiyo Coastal Industrial Zone after introducing the MBT system was the most highly evaluated. The worst evaluation result was observed in the case where power was generated at both facilities without introducing MBT, a general processing method in Japan. The introduction of the MBT system in Ichihara City was superior to the current processing method considering both CO2 emissions and economic efficiency. Based on sensitivity analysis results, the quality of waste and maintenance costs will change depending on the differences in countries and regional characteristics when evaluating the introduction of MBT systems in various regions.

Author Contributions

All the authors have contributed substantially to the work reported. Conceptualization, A.O. and H.O.; Methodology, A.O. and S.O.; Formal analysis, A.O. and S.O.; Investigation, A.O.; Data curation, A.O. and S.O.; Writing—Original Draft Preparation, A.O. and H.O.; Writing—Review and Editing, A.O., S.O., and H.O. All authors have read and agreed to the published version of the manuscript.

Funding

This research received no external funding.

Institutional Review Board Statement

Not applicable.

Informed Consent Statement

Not applicable.

Data Availability Statement

The data presented in this research are available on request from the corresponding author.

Conflicts of Interest

The authors declare no conflict of interest.

References

  1. Sekiguchi, T.; Hayashi, N.; Sugino, H. The Effects of Differences in Individual Characteristics and Regional Living Environments on the Motivation to Immigrate to Hometowns: A Decision Tree Analysis. Appl. Sci. 2019, 9, 2748. [Google Scholar] [CrossRef] [Green Version]
  2. Wider Area of Waste Treatment and Integration of Waste Treatment Facility to Ensure Sustainable Proper Treatment. Available online: https://www.env.go.jp/hourei/11/000652.html (accessed on 14 August 2021). (In Japanese)
  3. Zhang, Z.; Oshita, K.; Takaoka, M.; Fujimori, T.; Nagano, A.; Koseki, T. Cooperation of Urban Metabolic Facilities by Considering Co-Incineration of Dewatered Fecal Sludge and Municipal Solid Waste. J. JSCE 2017, 73, III_275–III_286. [Google Scholar] [CrossRef] [Green Version]
  4. Okuda, T.; Nakano, A.; Yamamoto, Y.; Nakakubo, T.; Yoshda, N. Study on reduction of greenhouse gas emission with sewage sludge fuels by collaboration of industrial and environmental infrastructures. J. JSCE 2016, 72, II_57–II_66. [Google Scholar]
  5. Nakakubo, T. Building energy system in a msw incineration plant by linking up with a neighboring sewage treatment plant. J. JSCE 2018, 74, II_129–II_140. [Google Scholar] [CrossRef]
  6. Maki, S.; Ohnishi, S.; Fujii, M.; Goto, N.; Sun, L. Technical and economic analysis of potential steam supply from waste treatment plants to industries in Aichi Prefecture, Japan. Optim. Eng. 2021, 22, 1755–1782. [Google Scholar] [CrossRef]
  7. Yoshidome, D.; Karasawa, T.; Onoda, S.; Seto, T. A Study on Waste to Energy system for Industrial heat utilization (1st Report: Investigation of actual status of heat demand in an industrial area). Symp. Environ. Eng. 2020, 2020, 30. [Google Scholar]
  8. Rebitzer, G.; Ekvall, T.; Frischknecht, R.; Hunkeler, D.; Norris, G.; Rydberg, T.; Schmidt, W.-P.; Suh, S.; Weidema, B.P.; Pennington, D.W. Life cycle Assessment: Part 1: Framework, goal and scope definition, inventory analysis, and applications. Environ. Int. 2004, 30, 701–720. [Google Scholar] [CrossRef] [PubMed]
  9. Hu, H.; Zhao, R.; Omura, K.; Onoda, H. Development of a Municipal Waste Management System from Environmental and Economic Evaluation Perspectives: A Best Available System Methodology. In Technologies and Eco-Innovation towards Sustainability II; Springer: Singapore, 2019; pp. 81–97. [Google Scholar]
  10. Bigazoli, L.; Falbo, A.; Forte, F.; Grosso, M.; Rigamonti, L. Mass balance and life cycle assessment of the waste electrical and electronic equipment management system implemented in Lombardia Region (Italy). Sci. Total Environ. 2015, 524–525, 361–375. [Google Scholar] [CrossRef] [PubMed]
  11. Menna, F.D.; Dietershagen, J.; Loubiere, M.; Vittuari, M. Life cycle costing of food waste: A review of methodological approaches. Waste Manag. 2018, 73, 1–13. [Google Scholar] [CrossRef] [PubMed]
  12. Khandelwal, H.; Dhar, H.; Thalla, A.K.; Kumar, S. Application of life cycle assessment in municipal solid waste management: A worldwide critical review. J. Clean. Prod. 2019, 209, 630–654. [Google Scholar] [CrossRef]
  13. Nabavi-Pelesaraei, A.; Bayat, R.; Hosseinzadeh-Bandbafha, H.; Afrasyabi, H.; Chau, K. Modeling of energy consumption and environmental life cycle assessment for incineration and landfill systems of municipal solid waste management—A case study in Tehran Metropolis of Iran. J. Clean. Prod. 2017, 148, 427–440. [Google Scholar] [CrossRef]
  14. Liikanen, M.; Havukainen, J.; Hupponen, M.; Horttanainen, M. Influence of different factors in the life cycle assessment of mixed municipal solid waste management systems—A comparison of case studies in Finland and China. J. Clean. Prod. 2017, 154, 389–400. [Google Scholar] [CrossRef]
  15. Ripa, M.; Fiorentino, G.; Vacca, V.; Ulgiati, S. The relevance of site-specific data in Life Cycle Assessment (LCA). The case of the municipal solid waste management in the metropolitan city of Naples (Italy). J. Clean. Prod. 2017, 142, 445–460. [Google Scholar] [CrossRef]
  16. Tahara, K.; Inaba, A.; Sakane, Y.; Kojima, T. The Effect of Garbage Separation Treatment on Municipal Waste Management. J. Jpn. Soc. Waste Manag. Experts 2004, 15, 276–282. [Google Scholar] [CrossRef] [Green Version]
  17. Zaharioiu, A.; Bucura, F.; Ionete, E.I.; Ionete, R.E.; Ebrasu, E.; Sandru, C.; Marin, F.; Oancea, S.; Niculescu, V.; Miricioiu, M.G.; et al. Thermochemical Decomposition of Sewage Sludge—An Eco-Friendly Solution for a Sustainable Energy Future by Using Wastes. Rev. Chim. 2020, 71, 171–181. [Google Scholar] [CrossRef]
  18. Farrell, M.; Jones, D.L. Critical evaluation of municipal solid waste composting and potential compost markets. Bioresour. Technol. 2009, 100, 4301–4310. [Google Scholar] [CrossRef] [PubMed]
  19. Yoshikawa, K.; Kakuta, Y. Investigative Report of MBT Technology and EU Model Facilities. J. Mater. Cycles Waste Manag. 2016, 27, 325–332. [Google Scholar] [CrossRef]
  20. Montejo, C.; Tonini, D.; Márquez, M.C.; Astrup, T. Mechanical–biological treatment: Performance and potentials. An LCA of 8 MBT plants including waste characterization. J. Environ. Manag. 2013, 128, 661–673. [Google Scholar] [CrossRef] [Green Version]
  21. Fei, F.; Wen, Z.; Huang, S.; De Clercq, D. Mechanical biological treatment of municipal solid waste: Energy efficiency, environmental impact and economic feasibility analysis. J. Clean. Prod. 2018, 178, 731–739. [Google Scholar] [CrossRef]
  22. Abeliotis, K.; Kalogeropoulos, A.; Lasaridi, K. Life Cycle Assessment of the MBT plant in Ano Liossia, Athens, Greece. Waste Manag. 2012, 32, 213–219. [Google Scholar] [CrossRef] [PubMed]
  23. Ishii, K.; Furuichi, T. Applicability of Mechanical Biological Treatment to Waste Management Systems in Japan. J. Mater. Cycles Waste Manag. 2016, 27, 355–361. [Google Scholar] [CrossRef]
  24. Tyagi, V.K.; Kapoor, A.; Arora, P.; Rajesh Banu, J.; Das, S.; Pipesh, S.; Kazmi, A.A. Mechanical-biological treatment of municipal solid waste: Case study of 100 TPD Goa plant, India. J. Environ. Manag. 2021, 292, 112741. [Google Scholar] [CrossRef]
  25. Rigamonti, L.; Borghi, G.; Martignon, G.; Grosso, M. Life cycle costing of energy recovery from solid recovered fuel produced in MBT plants in Italy. Waste Manag. 2019, 99, 154–162. [Google Scholar] [CrossRef] [PubMed]
  26. Makovetska, Y.; Omelianenko, T.; Omelchenko, A. Prospects for environmentally safe mechanical biological treatment of municipal solid waste in Ukraine. E3S Web Conf. ISCMEE 2021, 255, 01002. [Google Scholar] [CrossRef]
  27. Ogawa, A.; Watanabe, D.; Ko, K.; Onoda, H.; Watanabe, Y.; Yamaguchi, J. Environmental and economic evaluation of combined system of the garbage facility and sewage treatment facility. Symp. Environ. Eng. 2019, 2019, 29. [Google Scholar] [CrossRef]
  28. Ogawa, A.; Pandyaswargo, A.H.; Yoshidome, D.; Onoda, H. Environmental and Economic Evaluation of a Mechanical Biological Treatment System for a Small and Medium-Sized Waste Treatment Facility Considering the Karatsu Smart Disaster-Resilience Base Construction Project. Int. J. Autom. Technol. 2020, 14, 984–998. [Google Scholar] [CrossRef]
  29. Ogawa, A.; Onoda, H. Feasibility Study of Cooperation between Waste Incineration Plants and Sewage Treatment Plants ~Questionnaire Survey for Local Governments and GIS Visualization~. Pap. Environ. Inf. Sci. 2020, 34, 305–310. [Google Scholar]
  30. QGIS—The Leading Open Source Desktop GIS. Available online: https://qgis.org/en/site/about/index.html (accessed on 14 August 2021).
  31. Ichihara City Basic Plan for General Waste Disposal. 2017. Available online: https://www.city.ichihara.chiba.jp/article?articleId=602371cfece4651c88c17fed (accessed on 14 August 2021). (In Japanese).
  32. Notes on Guidance for General Waste Management Businesses. 1977. Available online: https://www.env.go.jp/hourei/11/000013.html (accessed on 14 August 2021). (In Japanese)
  33. Manual for Utilization of Local Biomass in Sewage Treatment Plants. 2017. Available online: https://www.mlit.go.jp/mizukokudo/sewerage/mizukokudo_sewerage_tk_000466.html (accessed on 14 August 2021). (In Japanese)
  34. Guidelines for Sewage Sludge Energy Conversion Technology. 2018. Available online: https://www.mlit.go.jp/mizukokudo/sewerage/mizukokudo_sewerage_tk_000364.html (accessed on 14 August 2021). (In Japanese)
  35. New Energy and Industrial Technology Development Organization (NEDO) Demonstration Project for Local Self-Sustaining System of Biomass Energy: Requirements and Technical Guidelines for Introduction of Local Self-Sustaining System of Biomass Energy, 5th ed.; New Energy and Industrial Technology Development Organization, Japan. 2021. Available online: https://www.nedo.go.jp/library/biomass_shishin.html (accessed on 14 August 2021). (In Japanese)
  36. Experimental Evaluation of Room Temperature Heat Transport and Thermal Storage for Effective Use of Waste Heat from Refuse Incineration. 2013. Available online: https://www.data.go.jp/data/dataset/env_20170508_0210/resource/6b238a15-d04f-4f45-9a65-a61450db4401 (accessed on 14 August 2021). (In Japanese)
  37. Emission Factors by Electric Utility (for Calculating Greenhouse Gas Emissions of Specific Emitters). Available online: https://www.env.go.jp/press/105720.html (accessed on 14 August 2021). (In Japanese)
  38. Sewage Sludge Wide-Area Utilization Study Manual. 2019. Available online: https://www.mlit.go.jp/common/001286384.pdf (accessed on 5 October 2021). (In Japanese)
  39. Examples of Carbon Dioxide Emissions by Fuel. Available online: https://www.env.go.jp/council/16pol-ear/y164-04/mat04.pdf (accessed on 14 August 2021). (In Japanese)
  40. Guidelines for Calculating Total Greenhouse Gas Emissions Version 1.0. Available online: https://www.env.go.jp/policy/local_keikaku/data/guideline.pdf (accessed on 14 August 2021). (In Japanese)
  41. Survey of General Waste Utilization. 2016. Available online: http://www.env.go.jp/recycle/waste_tech/ippan/h28/index.html (accessed on 14 August 2021). (In Japanese)
  42. Pandyaswargo, A.H.; Gamaralalage, P.J.D.; Liu, C.; Kanaus, M.; Onoda, H.; Mahichi, F.; Guo, Y. Challenges and an Implementation Framework for Sustainable Municipal Organic Waste Management Using Biogas Technology in Emerging Asian Countries. Sustainability 2019, 11, 6331. [Google Scholar] [CrossRef] [Green Version]
  43. Geyer, G.; Jambeck, J.R.; Law, K.L. Production, use, and fate of all plastics ever made. Sci. Adv. 2017, 3, e1700782. [Google Scholar] [CrossRef] [PubMed] [Green Version]
Figure 1. Cities in Chiba Prefecture that operate both facilities independently.
Applsci 11 10296 g001
Figure 2. Treatment flow and material balance in Case 1 and Case 2.
Applsci 11 10296 g002
Figure 3. Treatment flow and material balance in Case 3 and Case 4.
Applsci 11 10296 g003
Figure 4. Energy balance.
Applsci 11 10296 g004
Figure 5. Graph of evaluation results of CO2 emissions.
Applsci 11 10296 g005
Figure 6. Graph of economic evaluation results.
Applsci 11 10296 g006
Figure 7. Summary of CO2 emissions and economic evaluation results.
Applsci 11 10296 g007
Figure 8. Results of sensitivity analysis of food waste ratio.
Applsci 11 10296 g008
Figure 9. Results of sensitivity analysis of plastic ratio.
Applsci 11 10296 g009
Figure 10. Results of sensitivity analysis of piping distance.
Applsci 11 10296 g010
Table 1. Combustible waste quality settings.
ItemLower Heating Value (MJ/kg)Three Components (%)Elemental Composition (%)Weight Composition Percentage (%)
Combustible ContentWater ContentAsh ContentCHONSClCase 1 and 2Case 3 and 4
Paper10.7702010446490,200.020.4025.929.4
Food waste1.418784477423.80.100.4034.27.8
Plastics27.1741797411110.200.023.9013.715.5
Others7.451242405301.001.0026.229.7
Dewatered residue1.01081949737.95.40.70.3-17.7
TotalCase 1 and 28.747448.4506.9350.80.041.2100-
Case 3 and 49.351366.9496.7351.60.21.0-100
Table 2. Setting of sewage sludge components.
SewageThickened SludgeFermentation SludgeDewatered SludgeIncinerated
Moisture9933332.50
Organic content0.80.80.40.40
Inorganic content0.20.20.20.20.2
Total1003433.63.10.2
Table 3. Material balance before and after fermentation.
ItemMoisture Content (t/D)TS(t/D)VS (t/D)Unsuitable Material (t/D)
Before fermentationFood waste-31.325.65.7
Sewage sludge-7.25.71.4
Total595.838.431.37.1
After fermentationFood waste-11.55.85.7
Sewage sludge-4.292.91.4
Total595.815.78.67.1
Table 4. Material balance before and after fermentation.
ItemEstimated Formula (100 Million Yen)Notes
Acceptance and supply equipmentY = 1.4214 × A0.4344A: Acceptance amount t/D
Pre-treatment equipment
(Wet methane fermentation)
Y = 1.9481 × B0.6657B: Pre-treatment amount t/D
Incinerator and boilerY = 0.4643 × C0.8999C: Incineration amount t/D
Incinerator power generation equipmentY = 0.0438 × D0.7228D: Power generation capacity kW
Exhaust gas treatment equipmentY = 2.9569 × C0.3299C: Incineration amount t/D
Ash treatment equipmentY = 2.1337 × E0.5658E: Ash treatment amount t/D
Wastewater treatment equipmentY = 0.0767 × F0.8637F: Wastewater amount m3/D
Table 5. Estimation formula for construction expenses of the sewage treatment plant.
ItemEstimation FormulaNotes
Food waste pre-treatment equipment
Machinery and equipment expenses
Y = 98.6 × A0.475 [million yen]A: Waste treatment amount t/D
Food waste pre-treatment equipment
Electrical equipment expenses
Y = 29.6 × A0.512 [million yen]
Food waste pre-treatment equipment
Civil engineering expenses
Y = 22.4 × A0.504 [million yen]
Food waste pre-treatment equipment
Construction expenses
Y = 75.9 × A0.342 [million yen]
Mixing equipment
Machinery and equipment expenses
Y = 8.26 × B0.400 [million yen]B: Mixing tank capacity m3
Mixing equipment
Electrical equipment expenses
Y = 0.836 × B0.535 [million yen]
Mixing equipment
Construction expenses
Y = 2.01 × B0.583 [million yen]
Fermenter
Civil engineering construction facility expenses
Y = 44.1 × (C/500)0.6 [million yen]C: Fermenter capacity m3
Fermenter
Machinery and equipment
Y = 124 × (C/500)0.6 [million yen]
Desulfurization tower
Construction expenses
Y = 0.878 × D0.761 [million yen]D: Desulfurization tower processing capacity m3/h
Gas holder
Construction expenses
Y = 10.4 × E0.437 [million yen]E: Gas holder capacity m3
Gas engine
Construction expenses
Y = 0.1104 × F0.6605 [100 million yen]F: Biogas power generation function kW
Dewatering equipment
Civil engineering construction facility expenses
Y = 1.2413 × G0.35 [100 million yen]G: Sludge treatment amount before dewatering t/D
Incinerator
Machinery and equipment expenses
Y = 1.361 × H.380 [100 million yen]H: Incineration treatment scale t/D
Incinerator
Electrical equipment expenses
Y = 1.888 × H0.597 [100 million yen]
Table 6. Inventory data and setting conditions for waste incineration plant and sewage treatment plant.
ItemValue
Years of depreciation (years)20
d: Number of working days (days)280
Repair and management expenses1.5% of each construction expense
Personnel costs (10,000 yen/person)650
Number of employees at waste incineration facility (people)30
Number of employees at sewage treatment facility (people)5
Power consumption of waste incineration during operation (kWh/t)140
Power consumption of waste incineration during suspension (kWh/t)5.5
Power consumption during digestion process (kWh/m3-thickened sludge)5.3
Power consumption during dewatering process (kWh/t-wet dewatered sludge)20
Power consumption during incineration process (kWh/t-wet dewatered sludge)92
Kerosene consumption during incineration process (L/t-wet dewatered sludge)25
Electricity purchase unit price (Yen/kWh Kerosene L/t)16
Waste power generation unit price (Yen/kWh)13
Biogas power generation unit price (Yen/kWh)39
Unit price of heat sales (Yen/MJ)2
Kerosene (L/t-waste)0.66
Kerosene unit price (Yen/L)80
Chemicals usedSlaked lime (kg/t)11
Activated carbon (kg/t)0.48
Ammonia (kg/t)2.3
Clean water (m3/t)0.69
Industrial waterdle (m3/t)0.46
Sewage (m3/t)0.79
Water supply unit price (Yen/m3)380
Industrial water unit price (Yen/m3)100
Sewage unit price (Yen/m3)320
Kerosene unit price (Yen/L)80
Activated carbon unit price (Yen/kg)215
Slaked lime unit price (Yen/kg)21.4
Ammonia unit price (Yen/kg)32.3
Desulfurizing agent (Yen/m3-fermentation gas)7.3
Dewatering agent (Yen/t-water)499
Water treatment chemical unit price (Yen/t-water)91.3
Ash treatment (Yen/t)30,000
Table 7. Setting conditions for transportation of food waste and sewage sludge.
ItemValue
Distance between facilities (km)10
Sewage sludge transport volume (t/D)81.1
Food waste transportation amount (t/D)142
Number of round trips (t/D)3
Truck load capacity (t/unit)10
Truck price (10,000 Yen/unit)1500
Truck fuel consumption (km/L)4.15
Number of sewage sludge transport units (units)4
Number of food waste transportation units (units)6
Year of depreciation (years)10
Number of truck drivers (people/unit)2
Annual income (10,000 Yen/person)450
Fuel consumption (diesel fuel) unit price (Yen/L)120
Table 8. Setting conditions for using heat.
ItemValue
Steam transportation distance (km)3
Steam piping unit price (100 million Yen/km)13.95
Piping heat loss (%)20
Table 9. Setting the weight composition percentage of waste for sensitivity analysis of food waste ratio and plastic ratio.
ItemWeight Composition Percentage (%)
Food Waste Ratio 10.0%Food Waste Ratio 20.0%Food Waste Ratio 34.2%Food Waste Ratio 50.0%Plastic Ratio 10.0%Plastic Ratio 13.7%Plastic Ratio 20.0%Plastic Ratio 30.0%
Paper34.030.625.920.627.125.923.820.5
Food waste10.020.034.250.035.434.232.128.8
Plastics21.818.413.78.410.013.720.030.0
Others34.231.026.221.027.526.224.120.7
Table 10. Evaluation results of CO2 emissions.
E1 t-CO2/YE2 t-CO2/YE3 t-CO2/YE4 t-CO2/YE5 t-CO2/YS1 t-CO2/YS2 t-CO2/YS3 t-CO2/Y
Case 169,636410540011525,680102010,418
Case 269,63641054001150102058,770
Case 361,07936287989924,401639111,733
Case 461,0793628798990639157,376
Table 11. Economic evaluation results.
Depreciation ExpensesRepair ExpensesManagement ExpensesPersonnel CostsWaterway FeesElectricity Purchase CostsSubsidized Fuel CostsAsh Disposal CostsPharmaceutical ExpensesIncome from Power SalesIncome from Heat Sales
100 million/Y
Case 114.64.44.42.30.80.30.21.03.807.3
Case 214.94.54.52.30.83.60.21.03.800.8
Case 315.64.64.63.20.70.40.11.52.60.0411.1
Case 416.04.84.83.20.73.40.11.52.60.042.0
Publisher’s Note: MDPI stays neutral with regard to jurisdictional claims in published maps and institutional affiliations.

