Article

Acoustic Sensing and Noise Identification of a Heating, Ventilation and Air Conditioning Unit: Industrial Case Study

by
Stephen Grigg
1,
Zeyad Yousif Abdoon Al-Shibaany
1,2,*,
Matthew Robert Pearson
1,
Rhys Pullin
1 and
Paul Calderbank
3
1
Cardiff School of Engineering, Cardiff University, Cardiff CF24 3AA, UK
2
Biomedical Engineering Department, University of Technology-Iraq, Baghdad 10066, Iraq
3
Bergstrom (Europe) Ltd., 41 Sycamore Close, Dyffryn Business Park, Ystrad Mynach, Hengoed CF82 7RJ, UK
*
Author to whom correspondence should be addressed.
Appl. Sci. 2021, 11(21), 9811; https://doi.org/10.3390/app11219811
Submission received: 4 March 2021 / Revised: 6 October 2021 / Accepted: 12 October 2021 / Published: 20 October 2021
(This article belongs to the Section Acoustics and Vibrations)

Abstract

:
Reducing the noise and improving the sound quality of vehicles’ interior space is one of the challenges to enhance passengers’ experience. This is an ever-growing issue as entirely electric cars are becoming commonplace, making previously unnoticed noise a significant problem. Heating, Ventilation and Air Conditioning (HVAC) units are a major noise source in a vehicle’s interior space, yet automotive manufacturers only give a maximum dB specification to HVAC unit manufactures. Problematic noise is only typically identified once the unit is within the vehicle at the late stages of a project. Psychoacoustics is the study of human perception to sound, allowing unpleasant noise to be identified within recorded data. Within this study, an industrial prototype HVAC unit was analysed using a 96-channel acoustic camera capable of isolating and locating noise sources from the unit using beamforming. In addition to identifying the location of noise sources, several psychoacoustic metrics were used, such as sharpness and loudness, to identify undesirable noise within an extensive data set due to the vast range of test configurations. Testing was conducted to analyse the unit. Within the initial testing, an ‘annoying’ sound was identified at a particular motor RPM, and this was located using the camera to an area which indicated that it was a result of structural resonance. In addition, present was a high-frequency source which could not be located accurately. The results of this testing enable modifications to the unit to be made early in its’ development, either structurally to alter the resonance of the unit or within the settings to ensure certain RPMs are avoided.

1. Introduction

The sound quality of a vehicle interior space is an important aspect of a vehicle and demands special NVH (noise, vibration and harshness) attention. Noise reduction inside a vehicle improves the sound quality of the vehicle interior space, which leads to a better passenger comfort, better driving experience, and less distractions for the driver. In addition, improving vehicle interior sound quality by reducing noise will enhances perception of the vehicle brand by customers; so that the vehicle will attract more buyers and gain a competitive advantage in the market [1,2]. The primary noise sources in a vehicle can broadly be classified as powertrain noise, aerodynamic noise, and tyre-road noise [3]. The developments of quieter engines and the trend towards quiet, electric ones means power train noise is ever decreasing [4]. At lower speeds, aerodynamic noise is minimal, and the reduction in sound with increased levels of aerodynamics is also influential [5]. Furthermore, tyre-road noise can be further reduced with quieter tyres and active noise reduction systems [5]. These ongoing developments mean that secondary sources located within a vehicle cabin, such as heating, ventilation, and air-conditioning (HVAC) system, entertainment systems, and audio driver-assist systems have become more perceptible to passengers [4].
The HVAC system is one of the secondary sources and is the most dominant noise source in a vehicle’s interior space as it operates the entire time the vehicle is running. Moreover, without any sound isolation, the HVAC and blower fan noise reaches the interior space can impact passengers’ comfort especially in the hot climate of a tropical country such as where a vehicle’s HVAC system operates continuously at higher blower speeds and is one of the most important interior noise sources. Therefore, there is a real need to improve the sound quality of the vehicle interior space, and it is gaining growing attention from researchers and manufacturers [4,5,6,7,8]. One of the major noise sources in the HVAC unit is the noise of the aerodynamic blower [9,10,11,12]. Therefore, the common method for reducing the noise of the HVAC includes redesigning the blower and/or its blades [9,10,13,14]. In order to reduce the level of the noise, there are some techniques that can be used for post-production noise control. These techniques include active noise control reported in [11,15], and passive noise control using synthetic sound absorbing materials such as micro-perforates [6,7], fiberglass, glass wool and polypropylene [16]. These passive techniques help to reach up to 6–10 dB noise reduction and work best at frequencies above ≈500 Hz. However, active noise control techniques involve high-cost equipment, and are effective in specific areas of the vehicle interior space.
People may still be made to feel uncomfortable by certain aspects of the sound quality, even when the actual sound level of the air conditioners is low [17]. Therefore, both the sound levels and the sound quality of an air conditioner are essential for the user’s acoustic comfort.
Many researchers have developed methods that can correlate human annoyance with the noise within a building environment to evaluate air conditioning noise. Noise criterion (NC) curves were proposed to evaluate indoor noise, the noise from air conditioning equipment, and other noise factors [18]. The frequency range of NC curves is from 63 to 8000 Hz. Preferred noise criterion (PNC) curves are modified versions of the original NC curves [19]. The PNC curve evaluates lower frequencies than the NC curve, i.e., the PNC analyzes the 31.5 Hz band. In contrast, the NC does not analyze that band. Noise rating (NR) curves are based on similar assumptions to those of the PNC. The NC and PNC curves are used in the USA, while the NR curve is used in Europe. Balanced noise criterion (NCB) curves are a modified version of the NC and PNC curves that consider the balance between low and high frequency noises, such as rumbling and hissing noises [20]. Room criteria (RC) curves were developed and applied differently to the NC and PNC curves [21]. RC curves have a constant slope in the frequency range from 16 to 4000 Hz. RC Mark II curves are revised versions of the original RC curves and have lower values than the corresponding RC curves at 16 Hz [22,23]. Rom noise criterion (RNC) curves were proposed to allow technical compromises to be reached between the NC, NCB, and RC curves [24,25]. RNC curves involve evaluations of the temporal variations in low frequency sound.
Large numbers of noise indices have been proposed by numerous researchers for evaluating environmental noise. The A-weighted equivalent sound pressure level (SPL), denoted by LAeq, is the most widely used of the proposed indices. This index accounts for both the magnitude of noise and the sensitivity at different frequencies is simple to measure, and correlates well with many psychological responses to noise, such as annoyance [26,27,28]. The A-weighted statistical levels (denoted by LA90, LA10, and LA5) are important because they account for the noise’s time dependence. LA90 represents the background noise, while LA10 and LA5 represent the noise peaks, and the difference LA10–LA90 represents the noise fluctuations [29]. The noise pollution level (LNP) was defined as the sum of LAeq and the difference LA10–LA90 and was introduced to describe the degree of annoyance that is caused by fluctuating noise [30]. All these indices are determined on the basis of both the SPL, i.e., the quantitative aspects of the noise and the frequency characteristics of the noise.
Researchers conduct simulation and experimental work to identify or predict the noise source inside vehicles in the pre-production stage. A complete computing of the noise spectrum of a low-speed fan in an HVAC system is presented in [31] and the results suggested that there are two broadband noise mechanisms co-exist: the turbulence-interaction noise at low and medium frequencies, and the trailing-edge noise at high frequencies beyond 4 kHz. A method based on an in-vehicle subjective evaluation and vibro-acoustical measurements was applied as a noise source identification technique in [32] by performing a preliminary subjective evaluation to narrow the critical sound transmission area, and then conducting a subsystem level measurement method to better identify noise sources in critical areas, then combining continuous wavelet transform (CWT) and partial coherence analysis to identify the sources of vehicle interior noise.
In this work, an industrial prototype HVAC unit will be analysed using a 96-channel acoustic camera capable of isolating and locating noise sources from the unit using beamforming. In addition to identifying the location of noise sources, several psychoacoustic metrics will be used, such as sharpness and loudness, to identify undesirable noise within an extensive data set due to the vast range of test configurations. The rest of this paper is structured as follow: Section 2 explains in detail the methodology that will be followed in this paper; Section 3 shows the detailed results that are obtained in this work; Section 4 includes a detailed discussion regarding the obtained results; then paper is concluded with Section 5.

2. Methodology

2.1. Test Setup

Testing was conducted within an acoustic chamber in Cardiff University School of Engineering. The test setup changed based on which part of the unit was being monitored, however, the majority of testing was conducted at the rear of the unit, i.e., the passengers’ position inside the car, this setup is shown in Figure 1. The HVAC unit was mounted on a study table to make it to the height of the microphones, it was restrained using clamps and acoustically decoupled as best as possible using foam. For this testing, a gfai tech Fibonacci96 AC Pro acoustic camera was used. This consisted of 96 Electret condenser capsule microphones with a flat frequency response (<3 dB) between 20 Hz and 20 kHz. These microphones were arranged in a Fibonacci array which enables beamforming to locate acoustic sources to a high level of accuracy. For this testing the camera was positioned 1 m from the unit.
To reduce noise within the acoustic chamber, the 30-amp power generator for the HVAC unit was removed from the room. This was because its cooling fan was deemed by the testing engineers to be producing significant noise. It was not possible to also remove the laptop due to the cable length. However, the noise produced by this was deemed to be insignificant by the testing engineers. All data were recorded with the chamber door shut, and no one in the room. A variety of configurations were tested, influenced by four factors which were changed throughout testing. Firstly, the orientation of the unit relative to the acoustic camera. In Figure 1, the rear of the unit faces the camera, this was the setup tested the most however the front, side and top were also tested. Another change made was which vents were open, the options for this were face, feet, diffuser and defrost. Testing was performed for each vent on its own and combinations of vents. The level of inlet recirculation was also modified; this was either set to half or full. Finally, for each test configuration, a range of inlet fan speeds (RPM) was tested. For most testing, this was between 1000 and 4000 at 500 RPM increments. In total, 91 tests were conducted. The sample rate of the 96 microphones within the acoustic camera array was set to 96 kHz; this ensured the ability to record frequencies well above the audible range, without recording excessive quantities of data. For each test, three seconds of data were recorded once the HVAC system had reached steady state.

2.2. Maintaining Observations during Testing

The aim of the testing was not only to understand the sound levels of the HVAC unit during different configurations but to identify and analyse annoying’ noises produced by the unit. To achieve this during testing, any noise that was identified by the two testing engineers from Cardiff and Bergstrom as annoying was noted, this was based on their perception of the noise at steady state. By identifying any slightly annoying noises it enables the metrics to be assessed on their applicability, i.e., if a metric says noise is fine, but in fact, it was very annoying, then it is not an effective metric. During the testing, 1500 RPM was identified to give a slightly ‘annoying’ sound; this was the case during all configurations.

2.3. Psychoacoustic Metrics

The data were processed to calculate several metrics for each configuration. These are outlined below:
  • Sound pressure level
The sound pressure level is a measure of the effective pressure of a sound. This is predicted by taking root mean square (RMS) of a recorded wave and using a reference pressure converted into decibels (dB). This metric does not consider the different frequencies present within a wave, and therefore the human ears perception of them.
2.
A-weighted sound pressure level
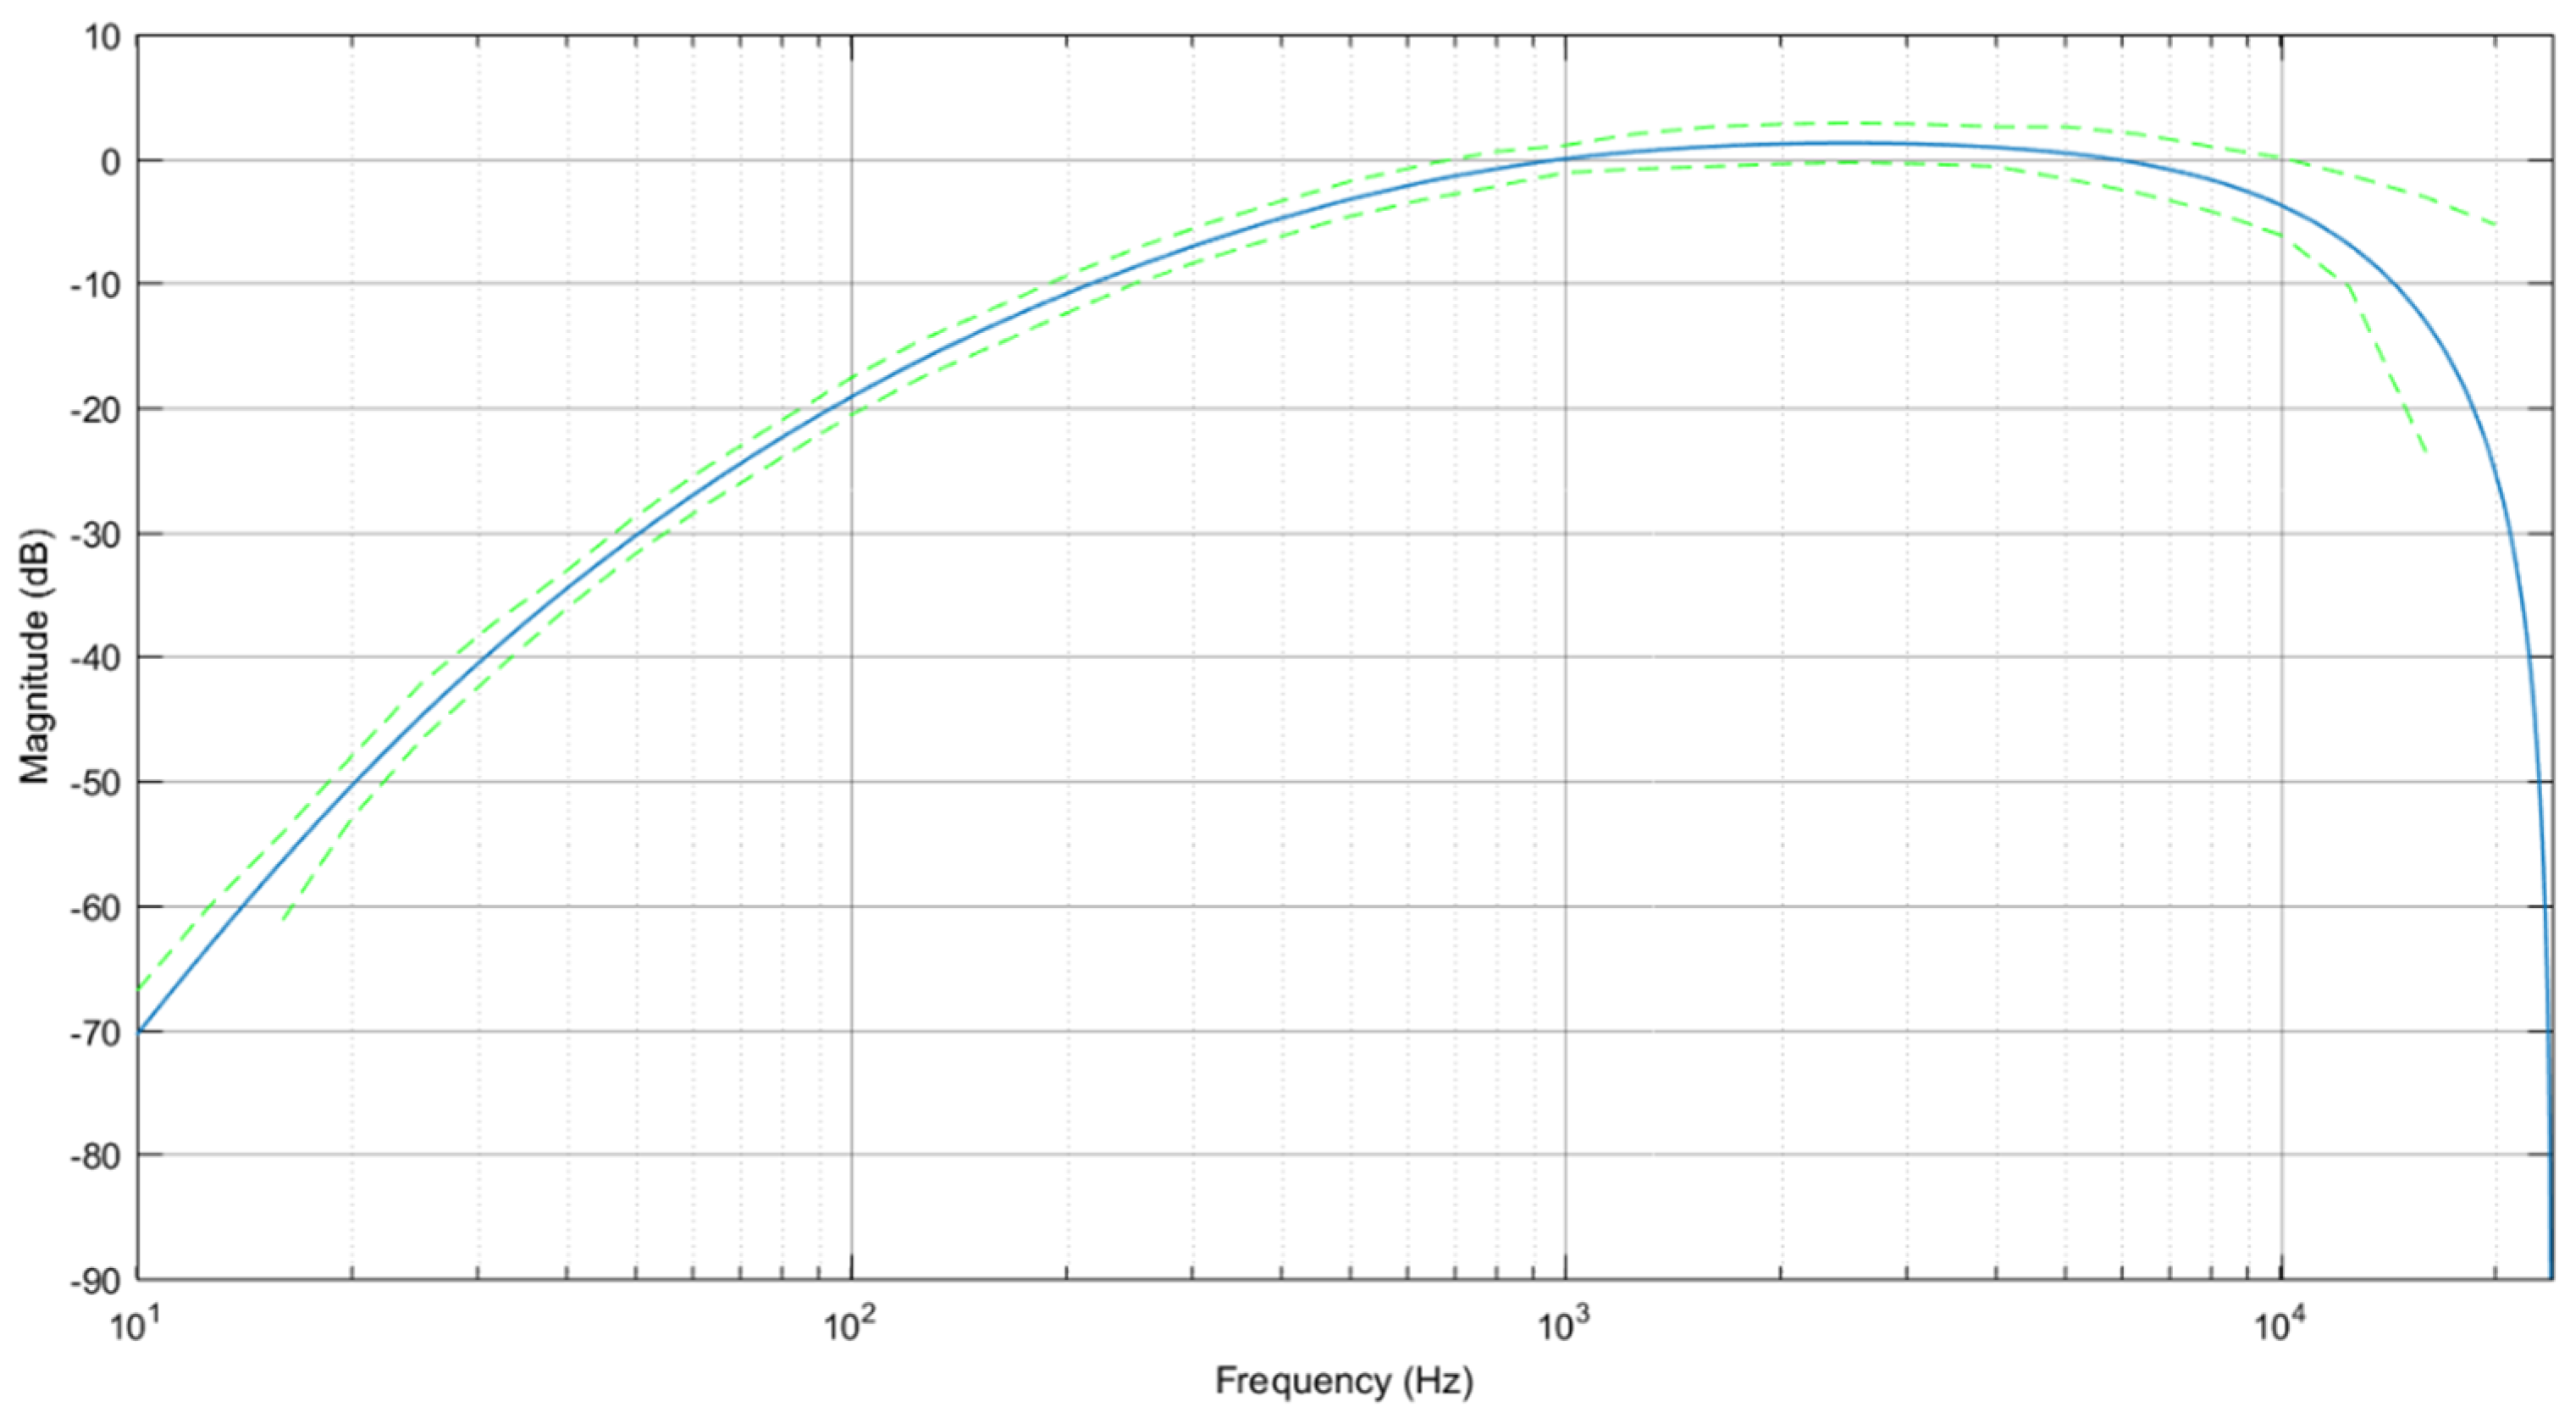
The frequency of a sound significantly affects the ears perception of it. Therefore, an ‘A weighting’ (ANSI® S1.42 Standard) filter was used to acquire dB(a), as per customer specification. This involves passing the waveform through a filter (Figure 2) to better align it with the human ears’ ability to hear the sound.
3.
Loudness
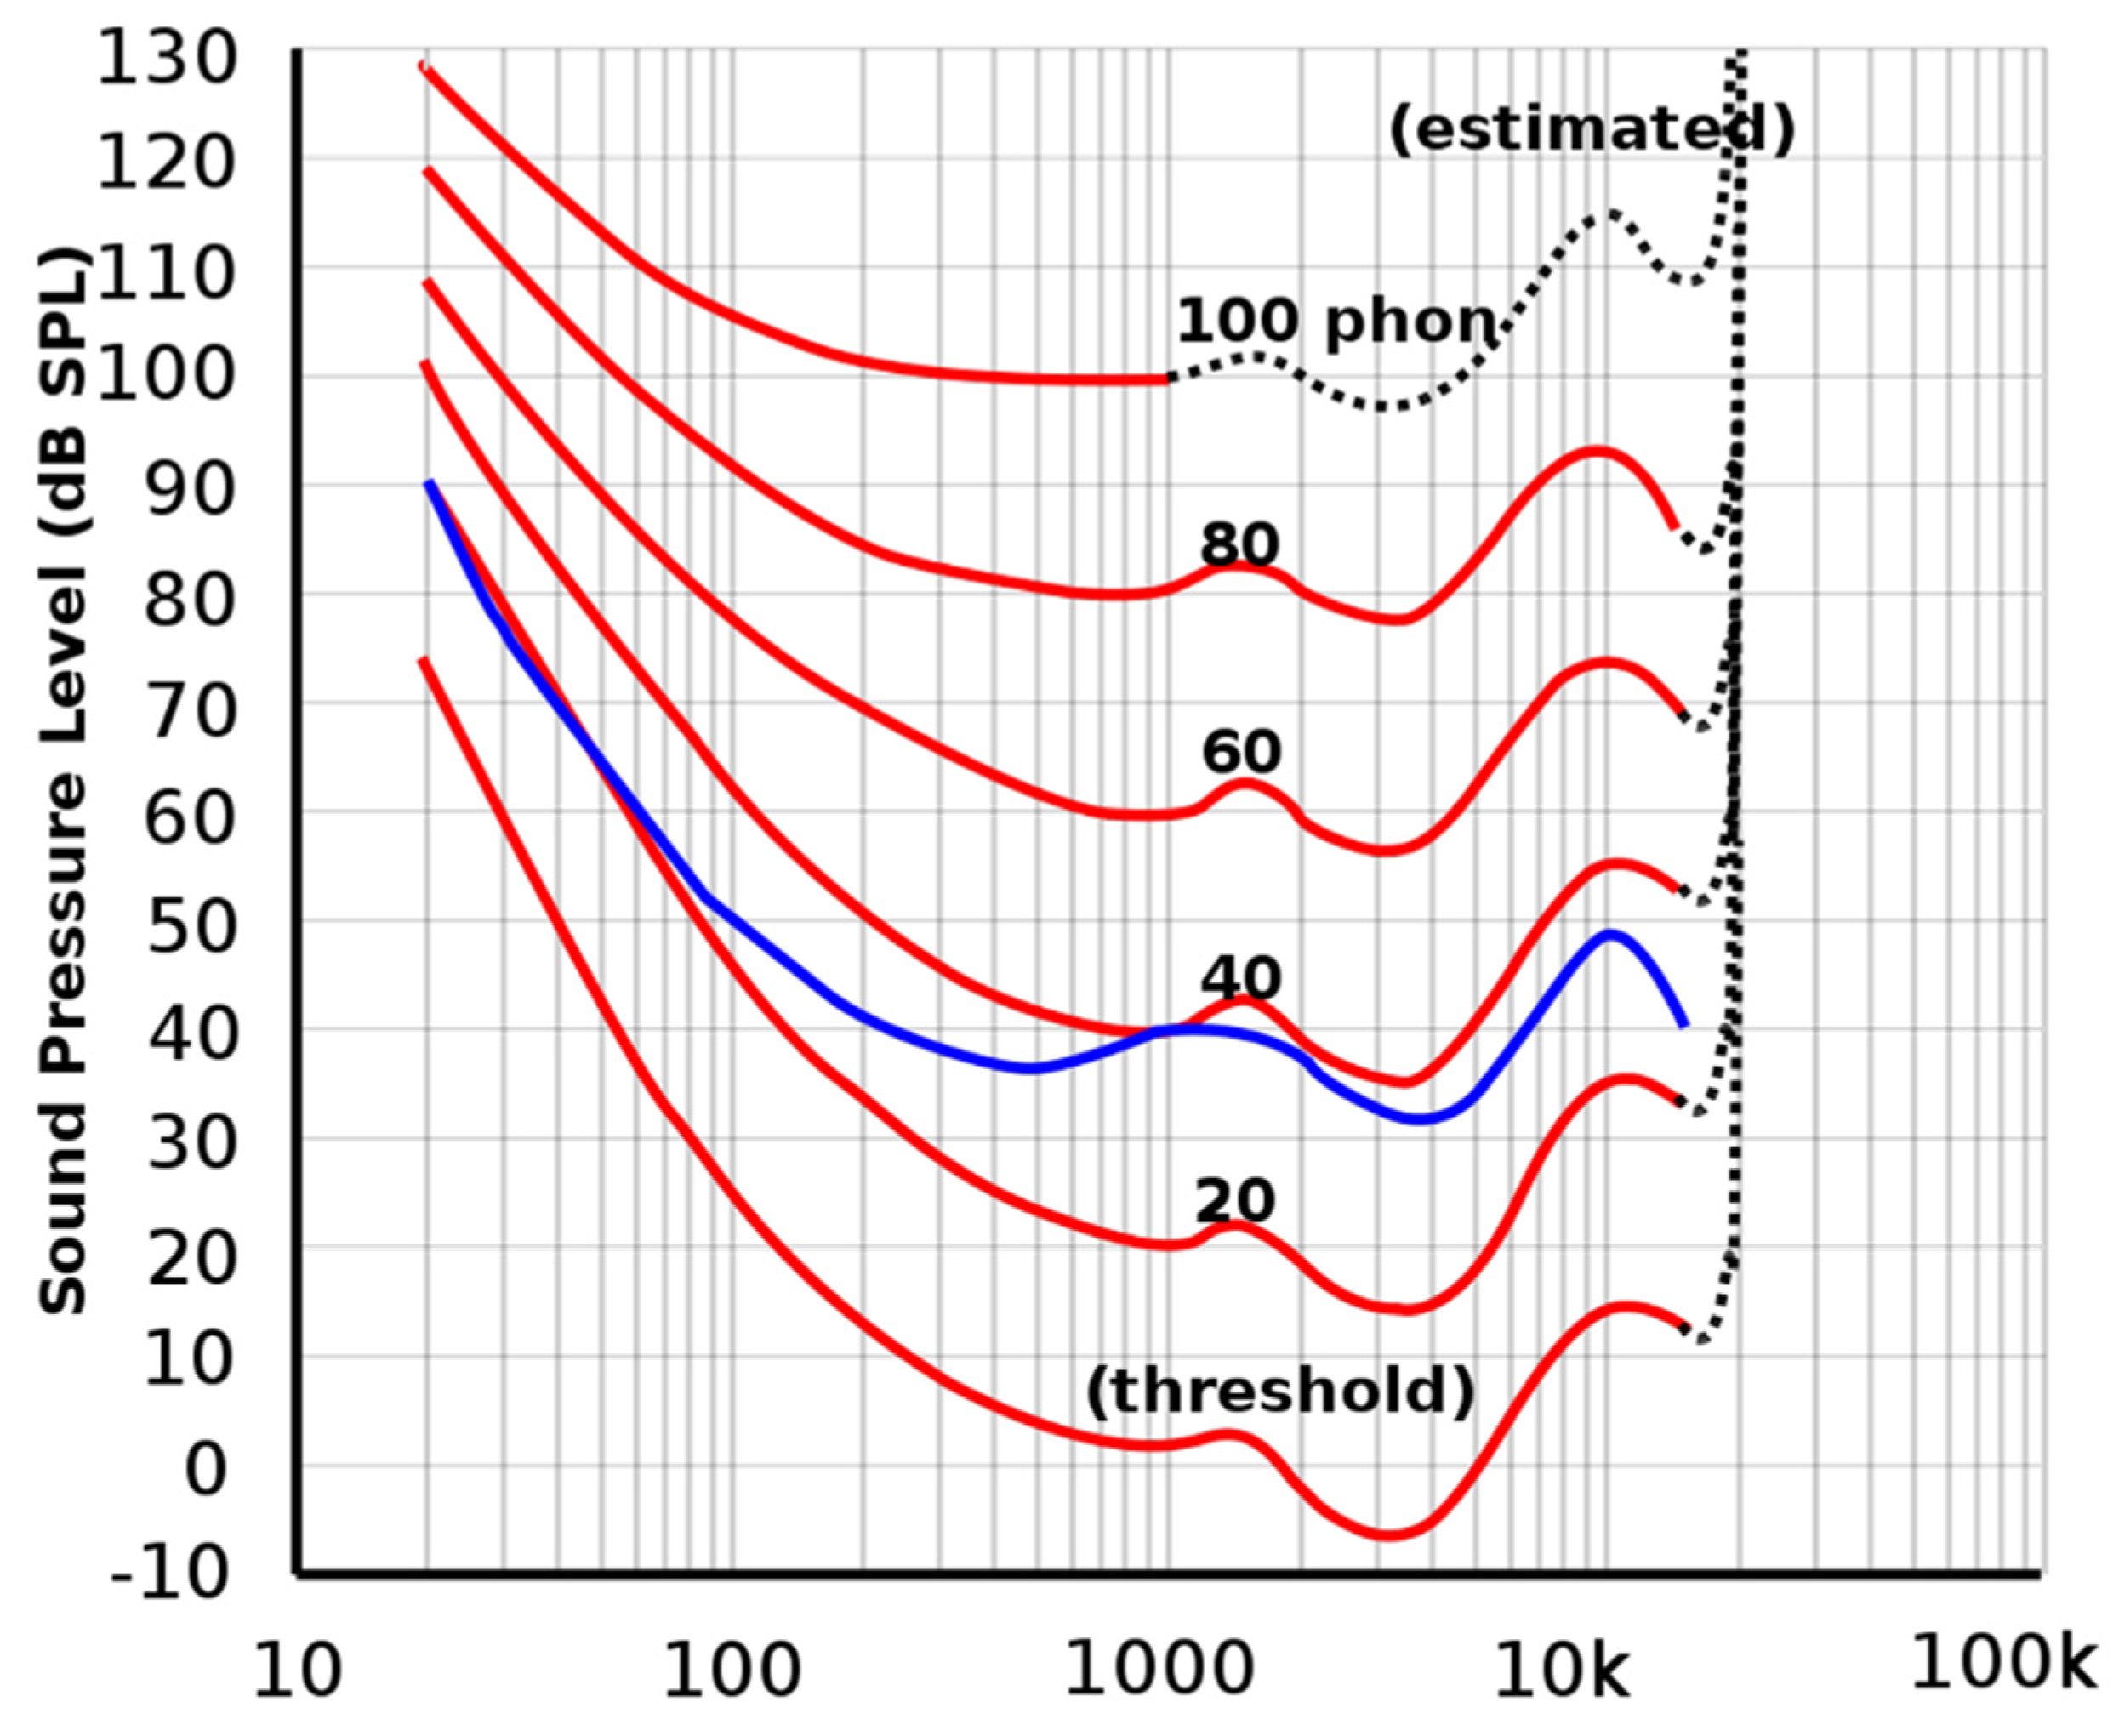
Although an A weighted filter gives a better idea of how a human ear interoperates sound pressure, there are alternative options that are more effective. Figure 3 shows equal loudness curves, which show the sound pressure levels at each frequency which are perceived as having equal ‘loudness’, loudness being a perceptual measure of the sounds effect of the ear [33].
Within this report loudness will be represented in two ways. Firstly, specific loudness (N’). N’ is the loudness unit of Sone, which a linear measure of loudness, at each Bark level. The Bark scale ranges from 1 to 24, representing the 24 critical bands of hearing which broadly speaking is the range in which two tones will interfere with each other through auditory masking [33].
The relationship between the Bark scale and frequency is relatively linear between 0 Hz and 500 Hz and logarithmic above that. The total loudness (N), which gives an overall loudness metric of a sound can be calculated by the integration of the critical bands N’. This gives a more representative measure than sound pressure level, or A-weighted pressure, of how load the human ear hears a sound, however, does not identify if a sound is unpleasant. Although neither of these metrics identify ‘annoying’ sounds, they are more representative of what a human hears than sound pressure level or using a fast Fourier transform (FFT) of the signal for frequency analysis. By comparing specific loudness plots it is possible to identify why a certain sound is different than others.
4.
Sharpness
Sharpness gives a measure of the high-frequency content of a sound in proportion to the rest of the frequency content. There is not yet a standardised unit of sharpness; within this work, the unit ‘acum’ will be used, which is calculated through the Zwicker and Fastl method [35].

3. Results

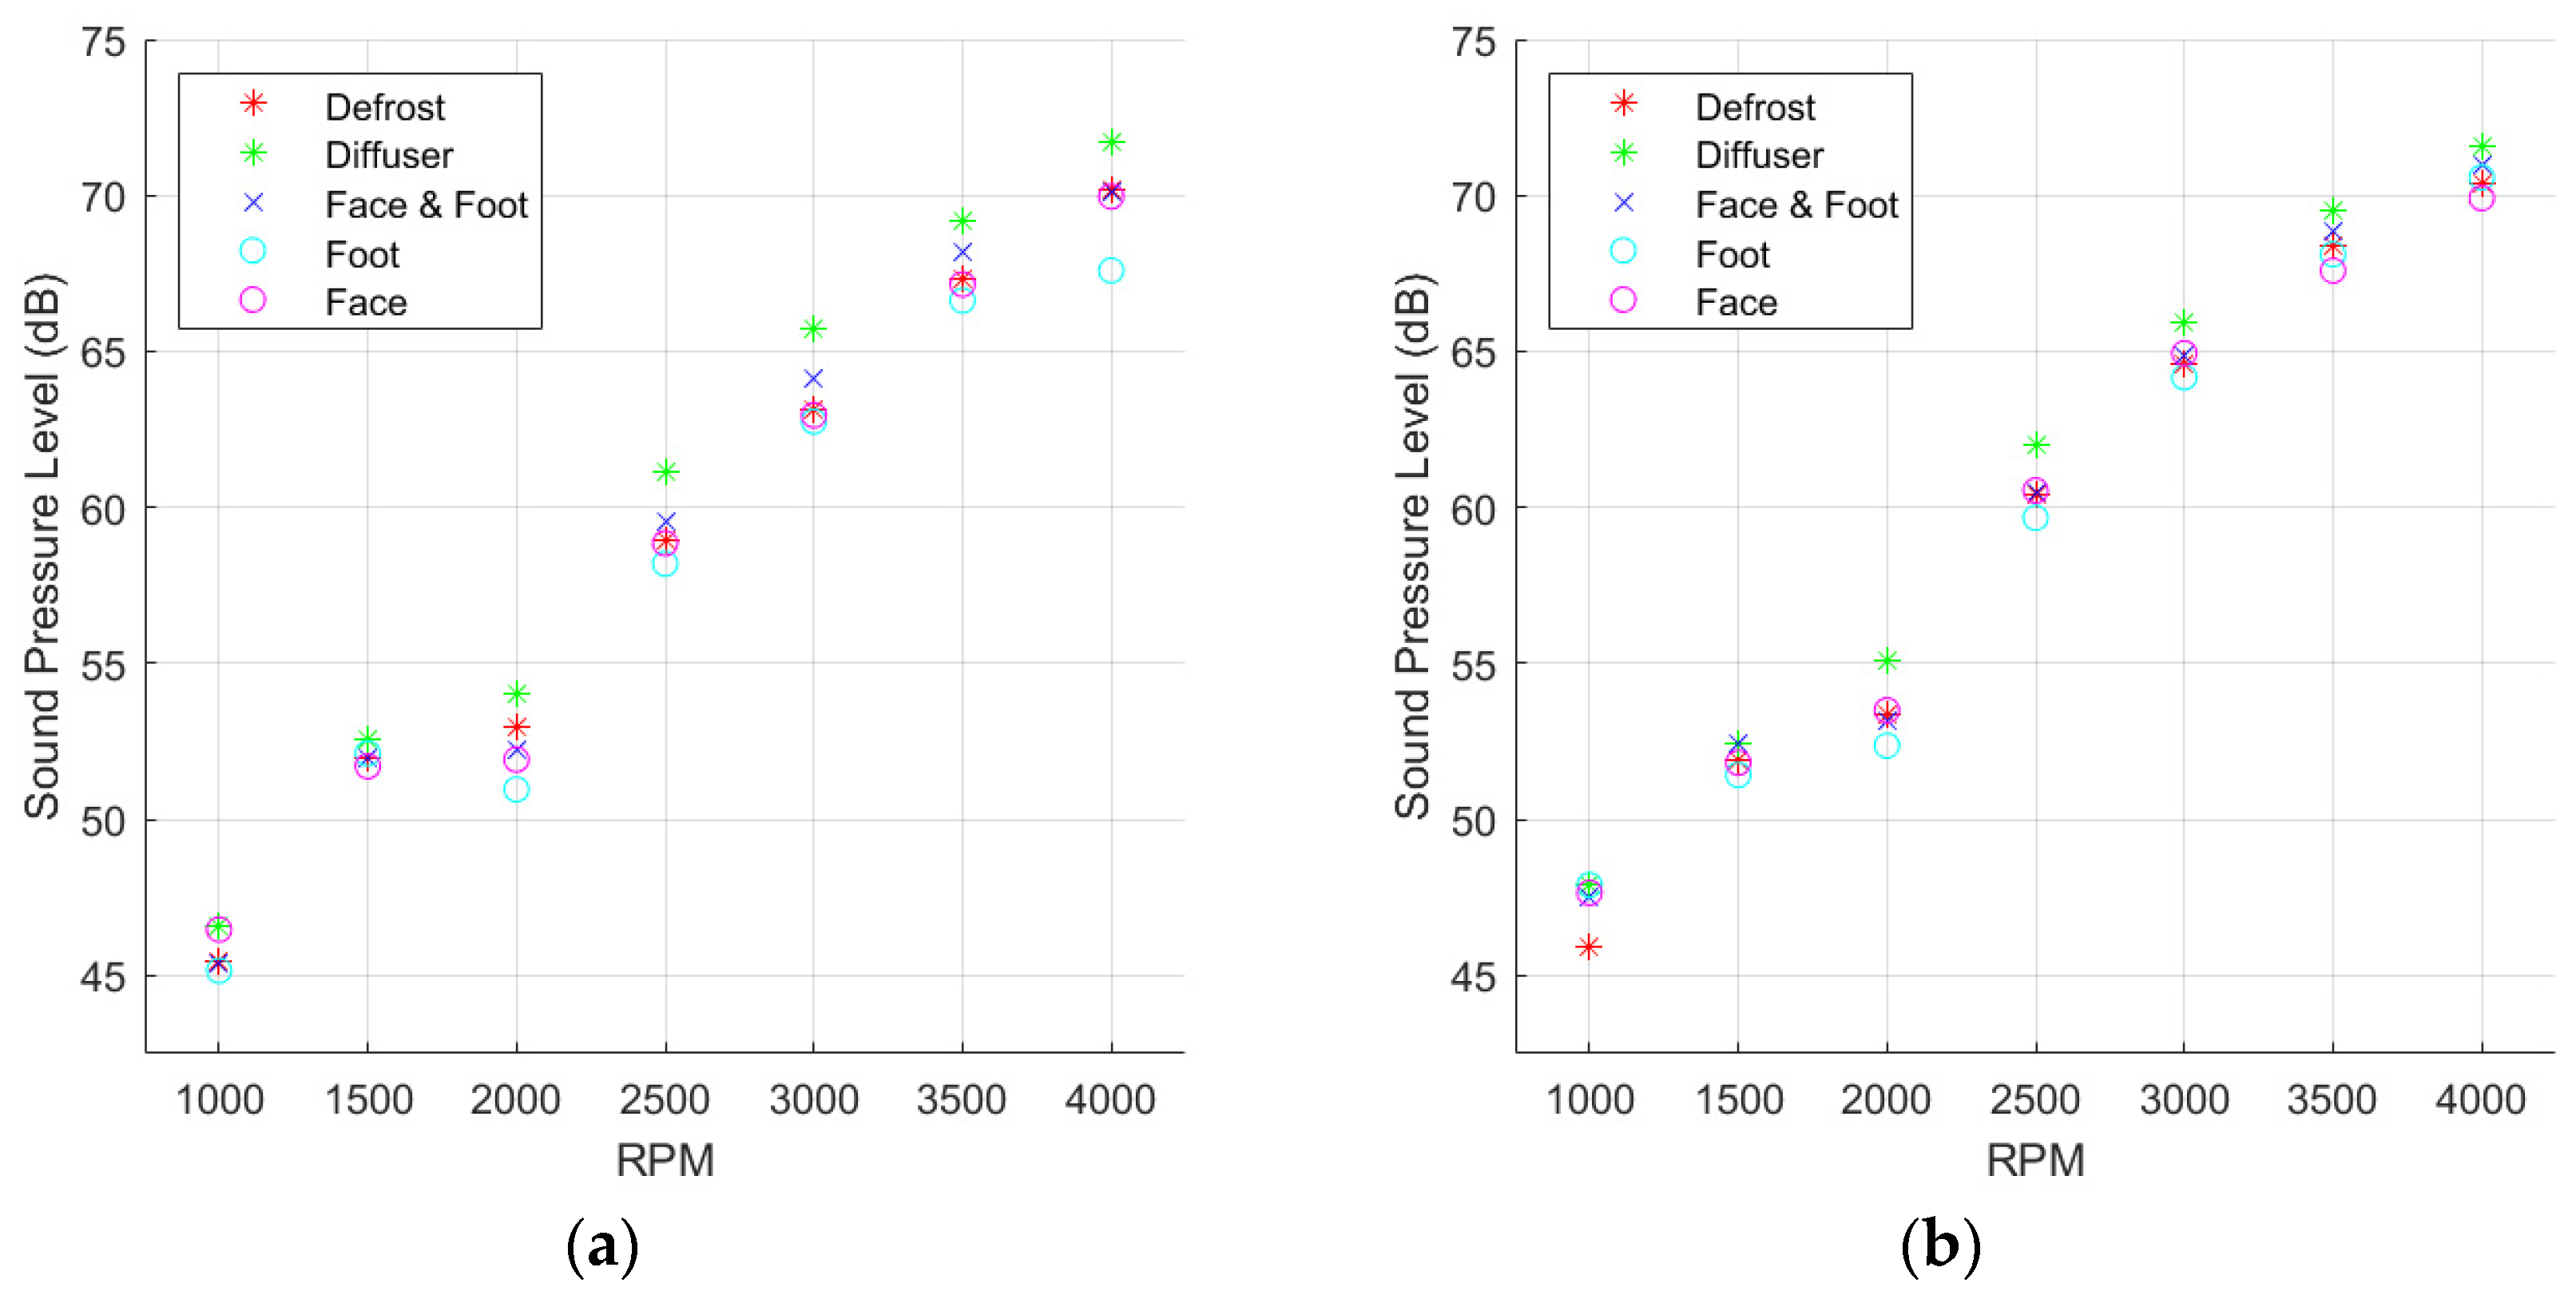
In order to meet the requirements of car manufacturers, the HVAC units must have a sound pressure level below a specified level. The sound pressure levels for each RPM in each vent configuration recorded 1m from the rear of the unit are shown in Figure 4a,b, where both half recirc and full recirc are presented.

3.1. A-Weighted Sound Pressure Level

The car manufacture also requires sound pressure in dB(A), provided using the aforementioned A-weighted filter. The sound pressure levels in dB(A) for each RPM in each vent configuration recorded 1m from the rear of the unit are shown in Figure 5a,b.

3.2. Loudness

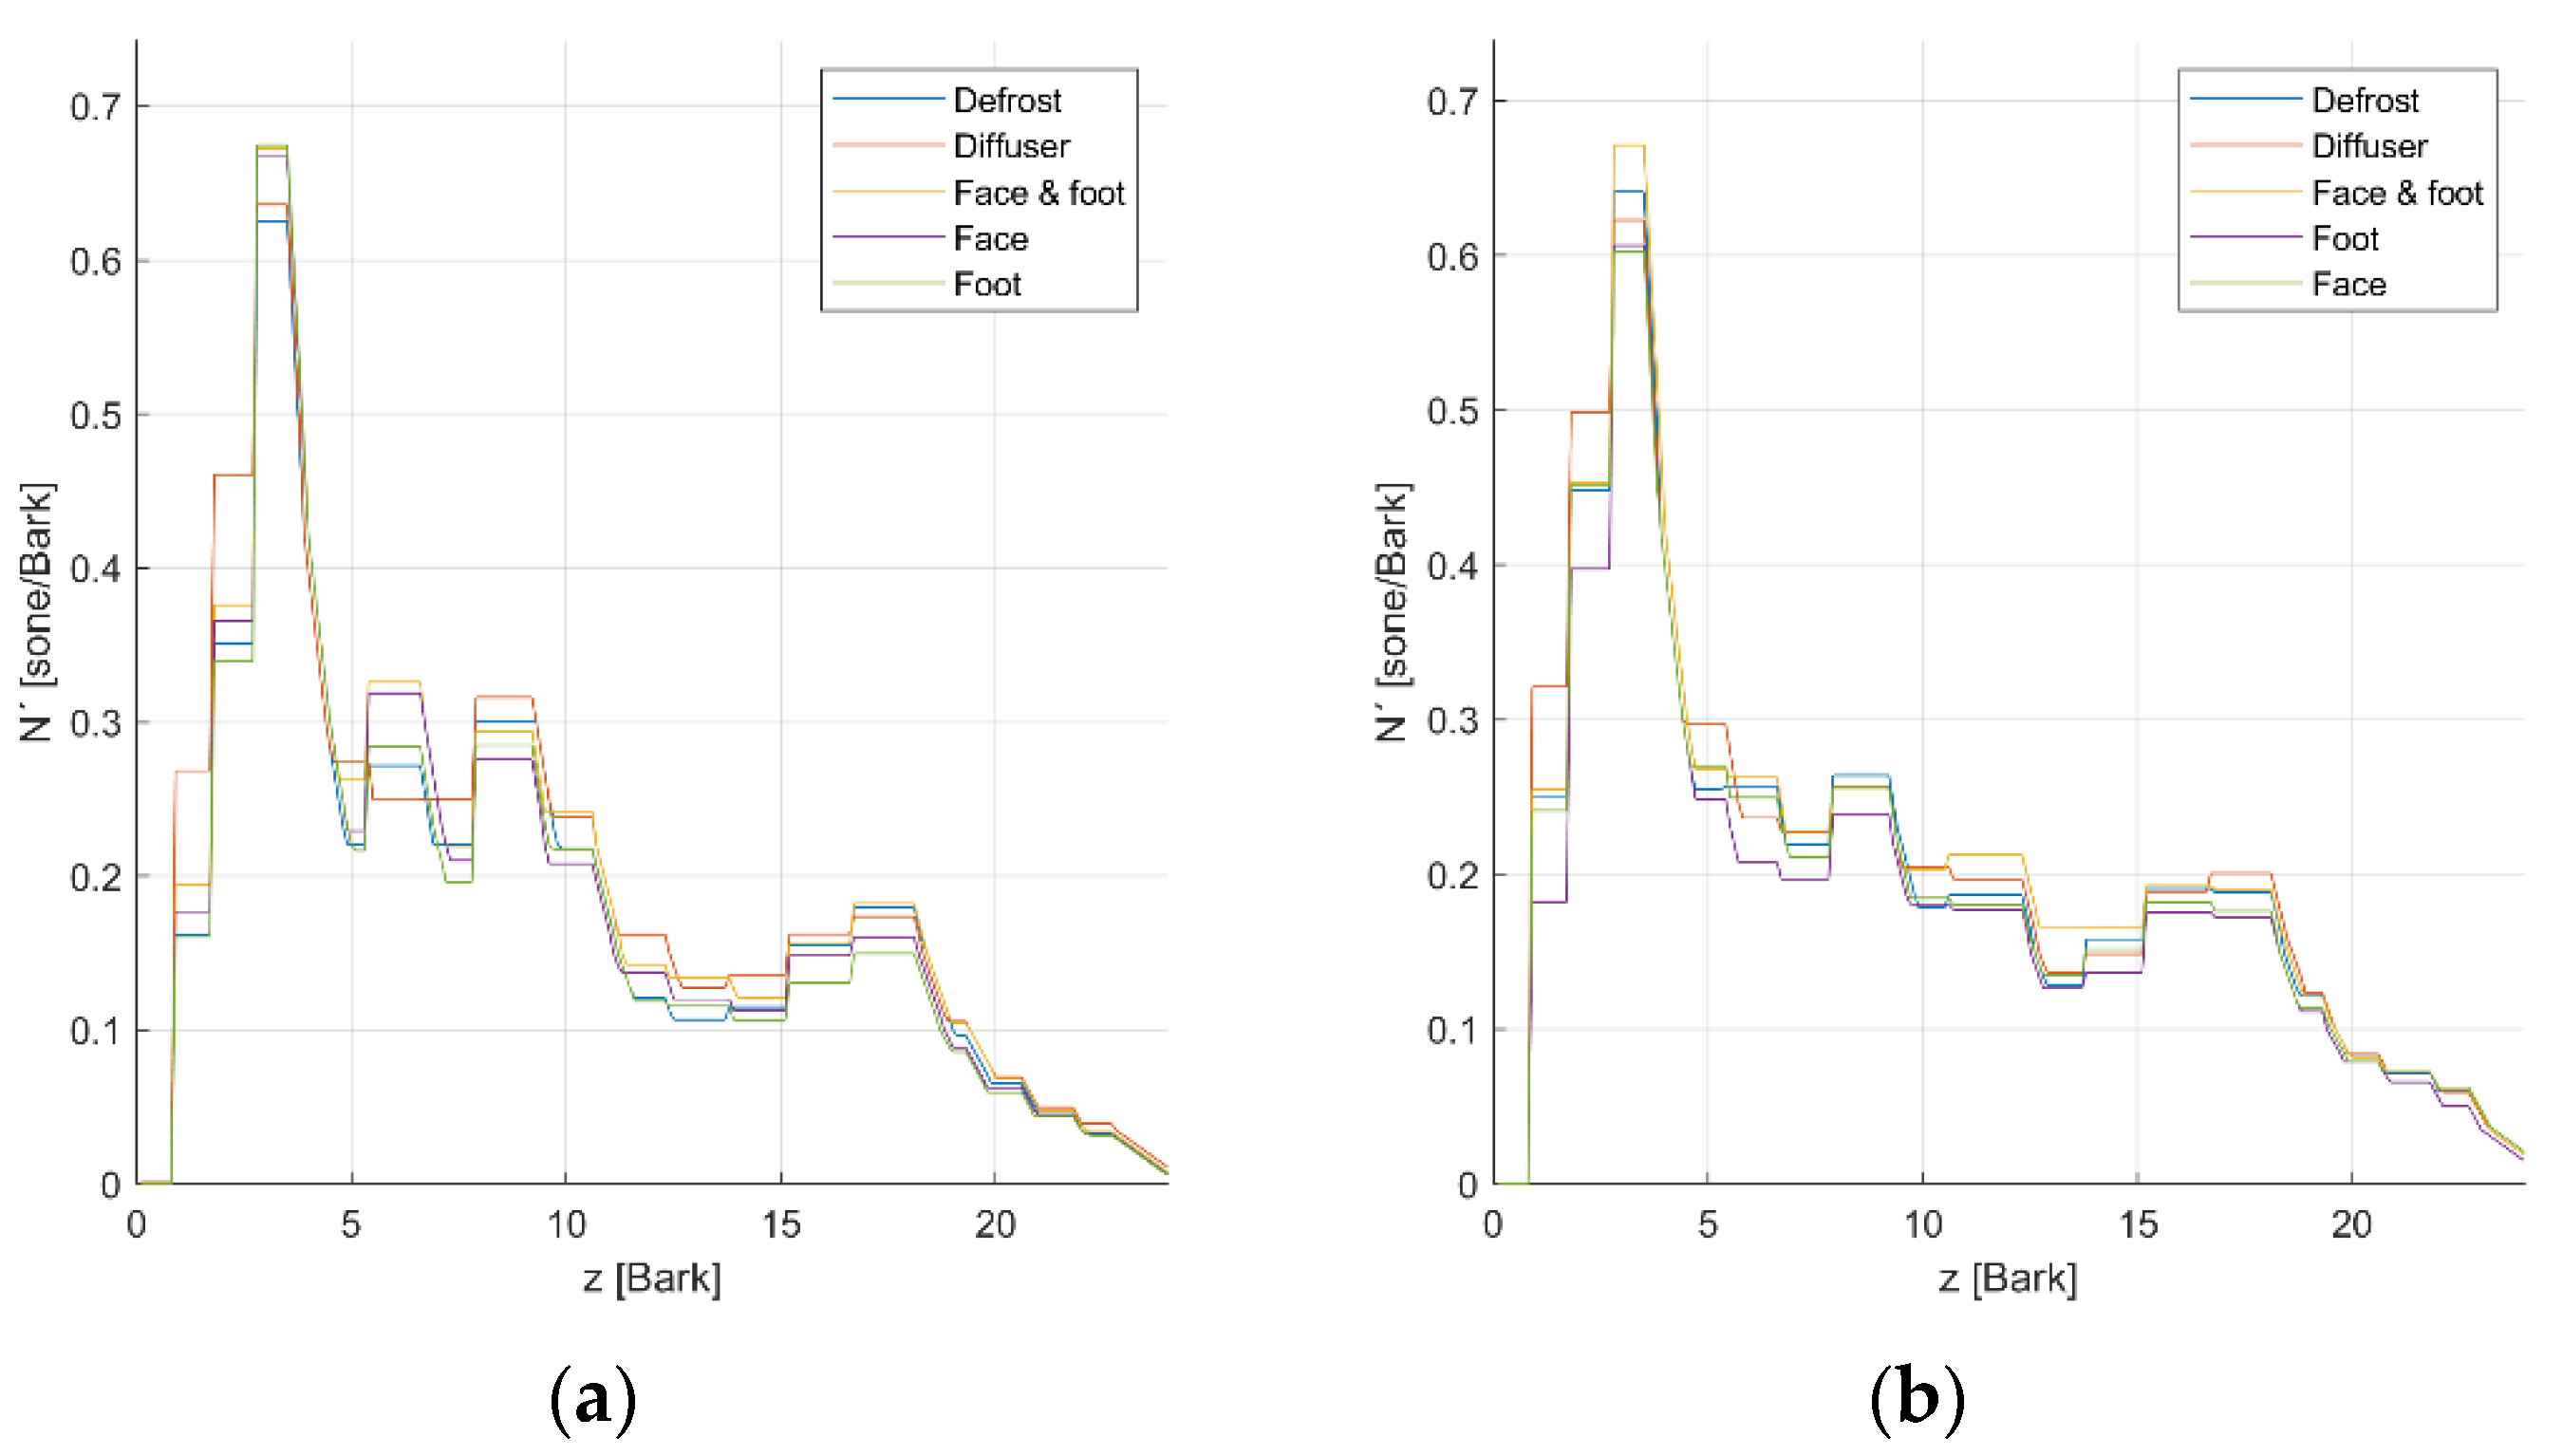
Total loudness is a similar metric to sound pressure; however, it considers the frequency within the wave and the human ears’ ability to hear each frequency band. The total loudness for each RPM in each vent configuration recorded 1m from the rear of the unit is shown in Figure 6a,b. Total loudness does not, however, give any idea of what frequency is present within the wave, to perform this, the specific loudness must be viewed. Due to the quantity of data, only a selection of relevant plots will be shown. Figure 7a,b show the specific loudness for each vent configuration of rear recorded data at 2000 RPM in both half and full recirc.
Figure 8a,b show the specific loudness for each RPM of half and full recirc with the face vent open.
In Figure 8, an out of place peak can be seen for the 1500 RPM test at 3 Bark (~250Hz) which is not visible in the other recordings. It can be seen in Figure 9a,b that this peak exists for all vent configurations.

3.3. Sharpness

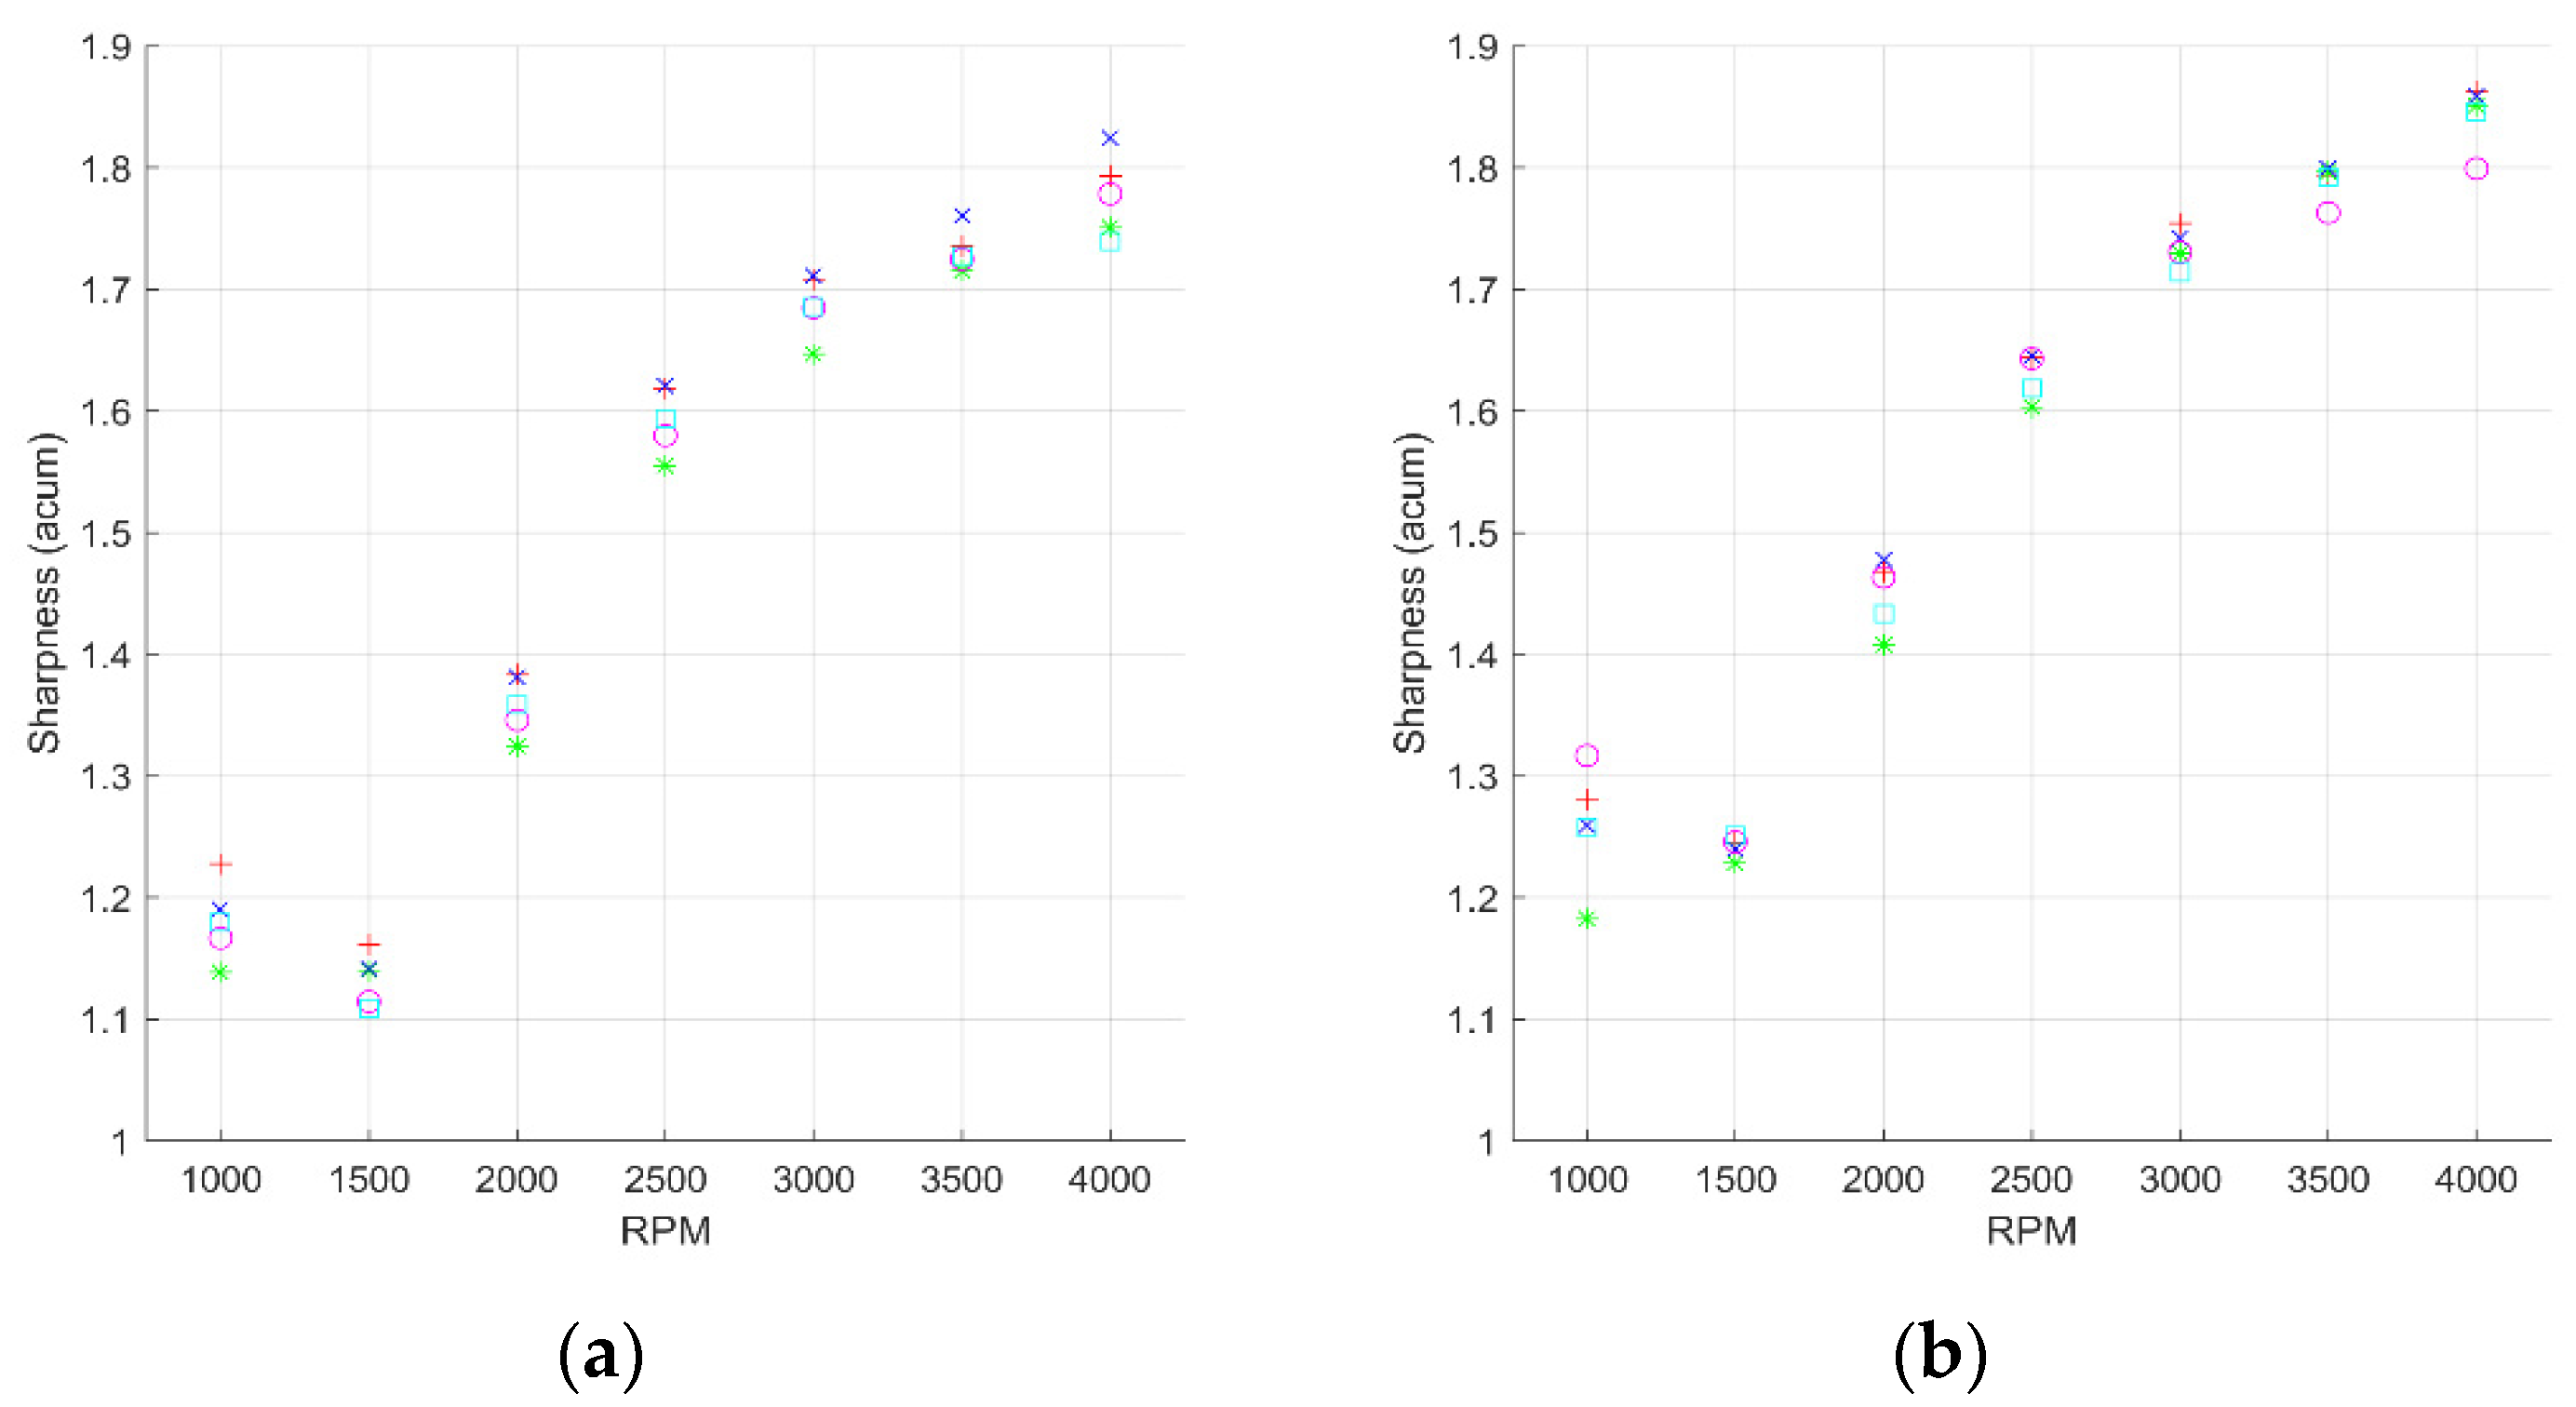
The metric of sharpness is a measure of the high-frequency content within a noise relative to the rest of the signal. Figure 10a,b show the sharpness value for each RPM with half and full recirc at each vent configuration recorded from the unit’s rear.

3.4. Acoustic-Camera Noise Localization

The gfai tech GmbH Noise Image software which accompanies the acoustic camera is capable of a range of post-processing, primary of which is producing sound pressure maps to identify the source location. By analysing a selection of data, it was clear that the majority were similar; hence a general example will be given outlining the cause of certain peaks visible on the frequency spectrum. Additionally, the peak in specific loudness for 1500 RPM (shown in Figure 8) at 3 Bark has been analysed. This configuration had the face vent open, half recirc and at 2000 RPM.
The test selected for general analysis was the front view of the unit, with face vent open and half recirc at 2000 RPM. FFT of the waveforms recorded in this test is shown in Figure 11a, a zoomed-in image in Figure 11b. Figure 11a shows several high magnitude peaks between 0 and 1 kHz with additional peaks up to 10 kHz. A high magnitude of energy is also present at 20 kHz. Figure 11b is zoomed between 0 and 8 kHz. In this Figure peak, frequencies of 23 Hz, 190 Hz, 550 Hz, 720 Hz, 1020 Hz, 1800 Hz, 2800 Hz, and 3100 Hz can be seen. Although the exact frequencies in other tests vary, they typically look similar.
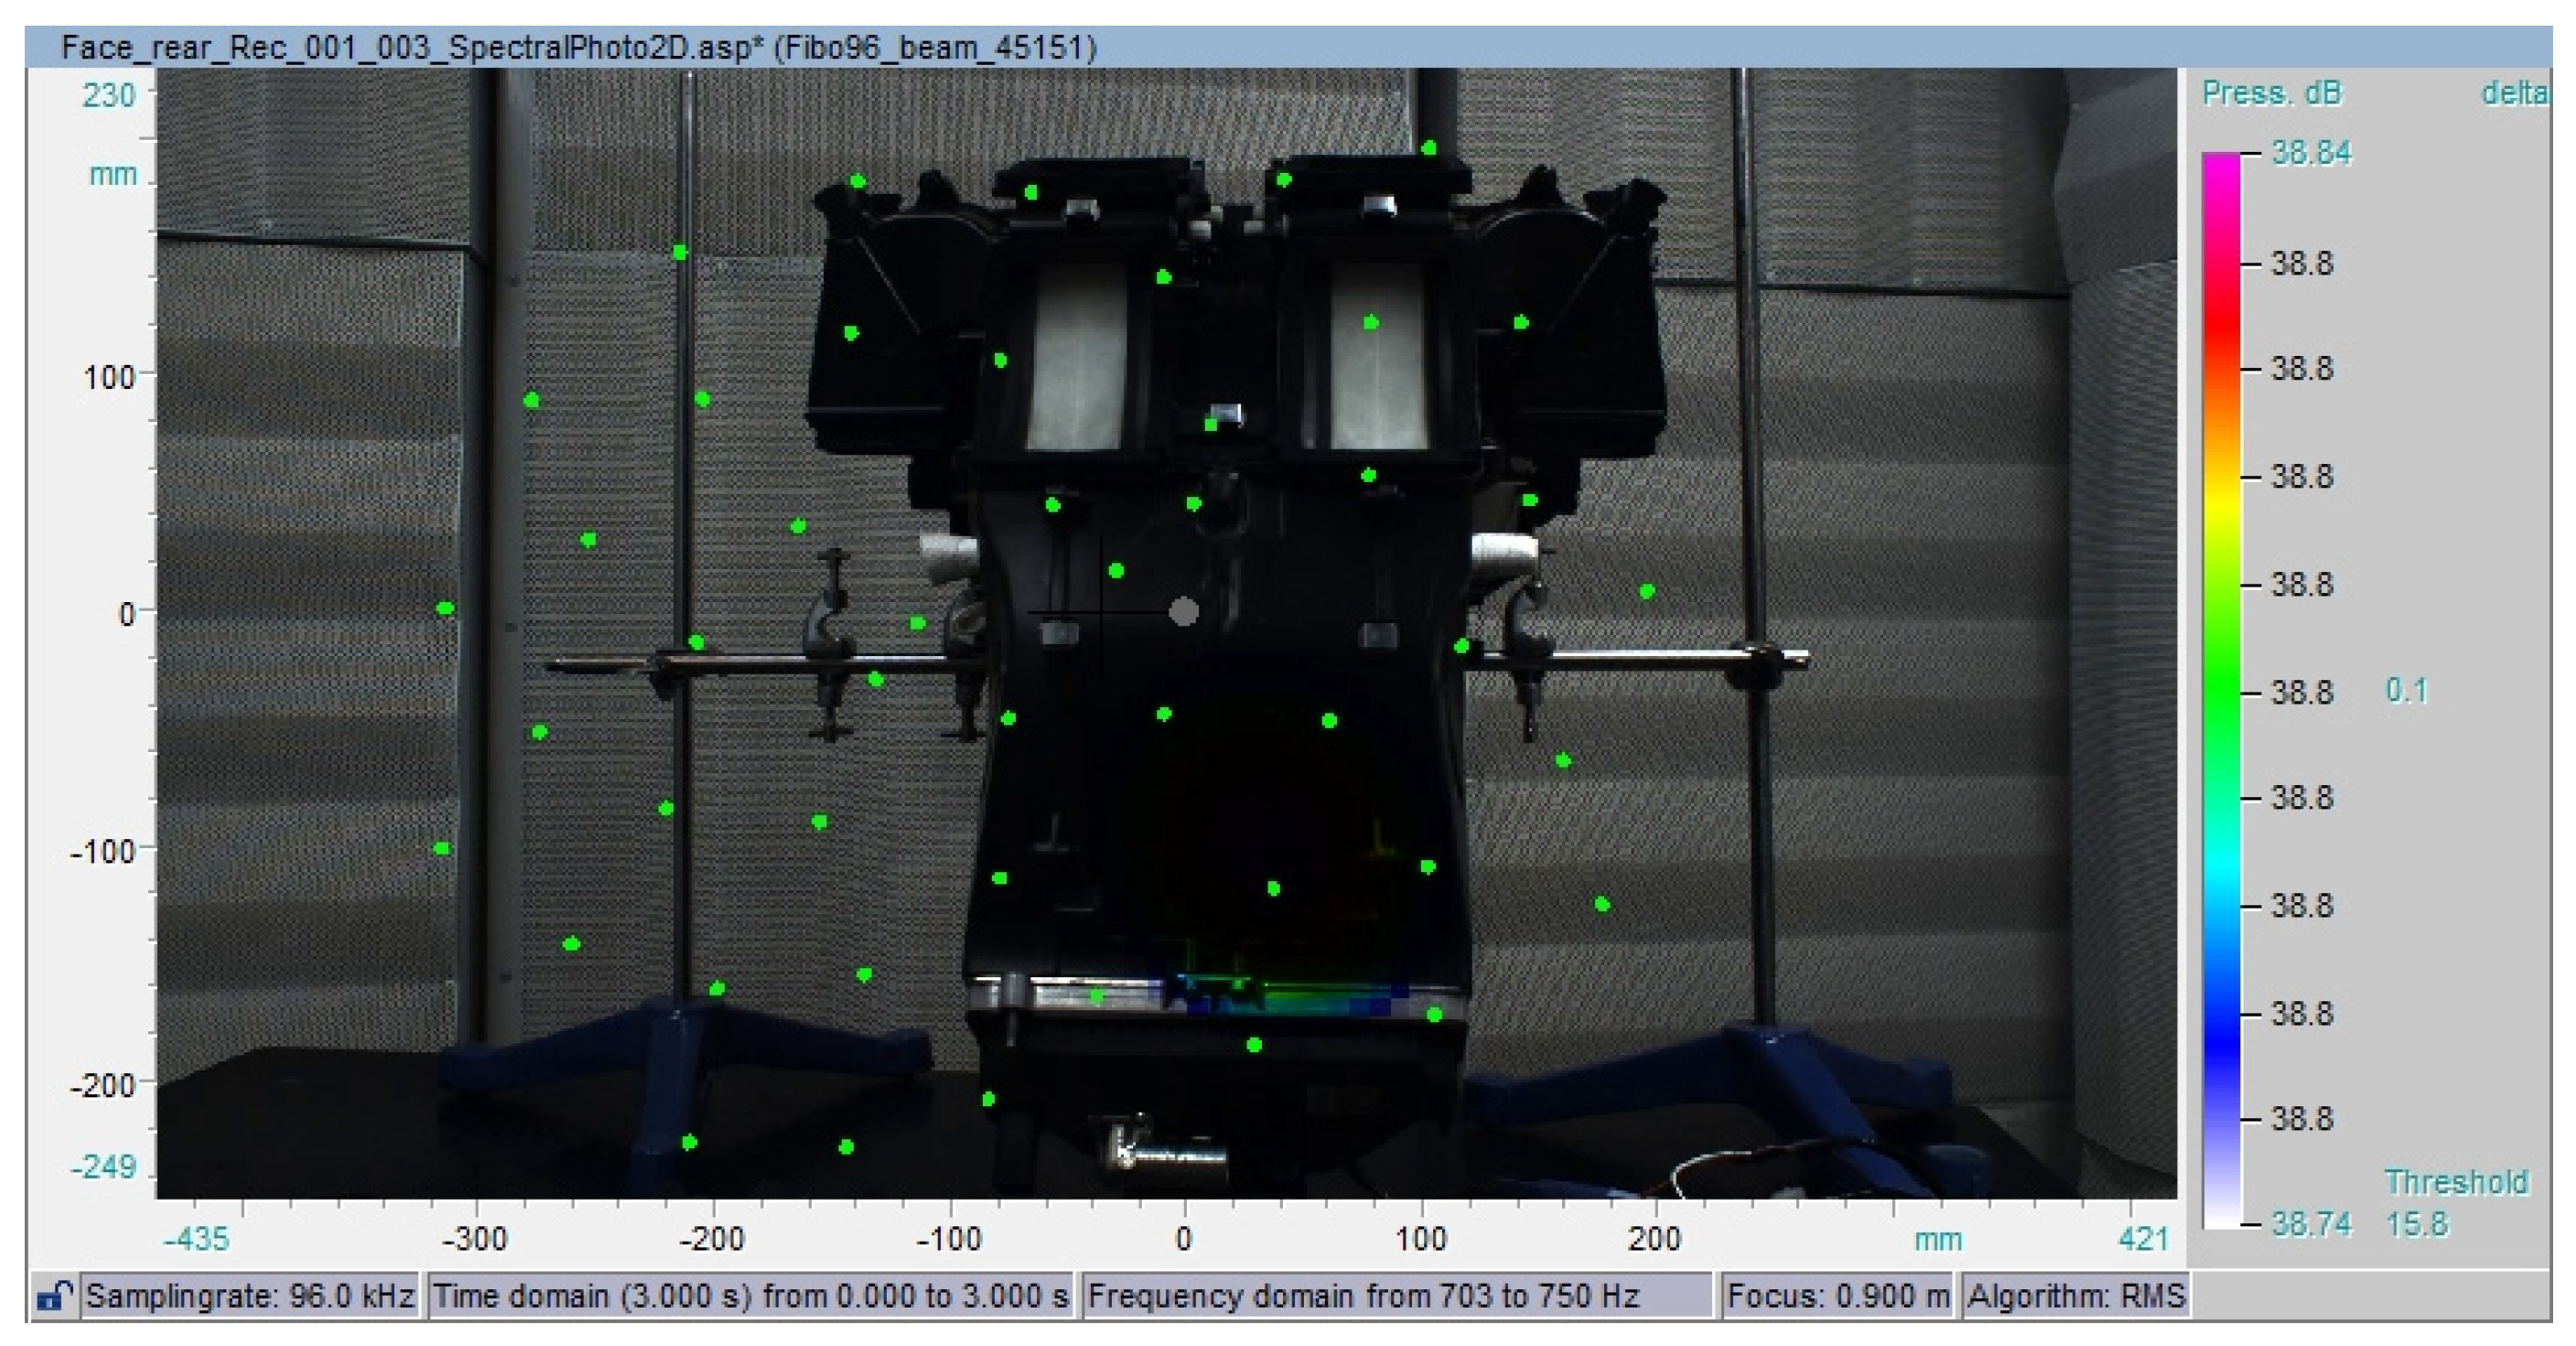
The noise image software is able to isolate a frequency and identify its location. Unfortunately, when very low frequencies are concerned, such as 23 Hz, the wavelength is too large for accurate localisation. As the frequency increases, reliable localisation also increases. Figure 12, Figure 13 and Figure 14 show sound pressure maps for the other eight identified frequency peaks. It must be noted that the scales in these plots vary. During testing, it was noticed that 1500 RPM caused an ‘annoying’ noise which was different to that of the other, often louder, fan speeds. This was reinforced by the specific loudness plot in Figure 8 where a 3 Bark (~300 Hz) peak was present in 1500 RPM but not the other rates.
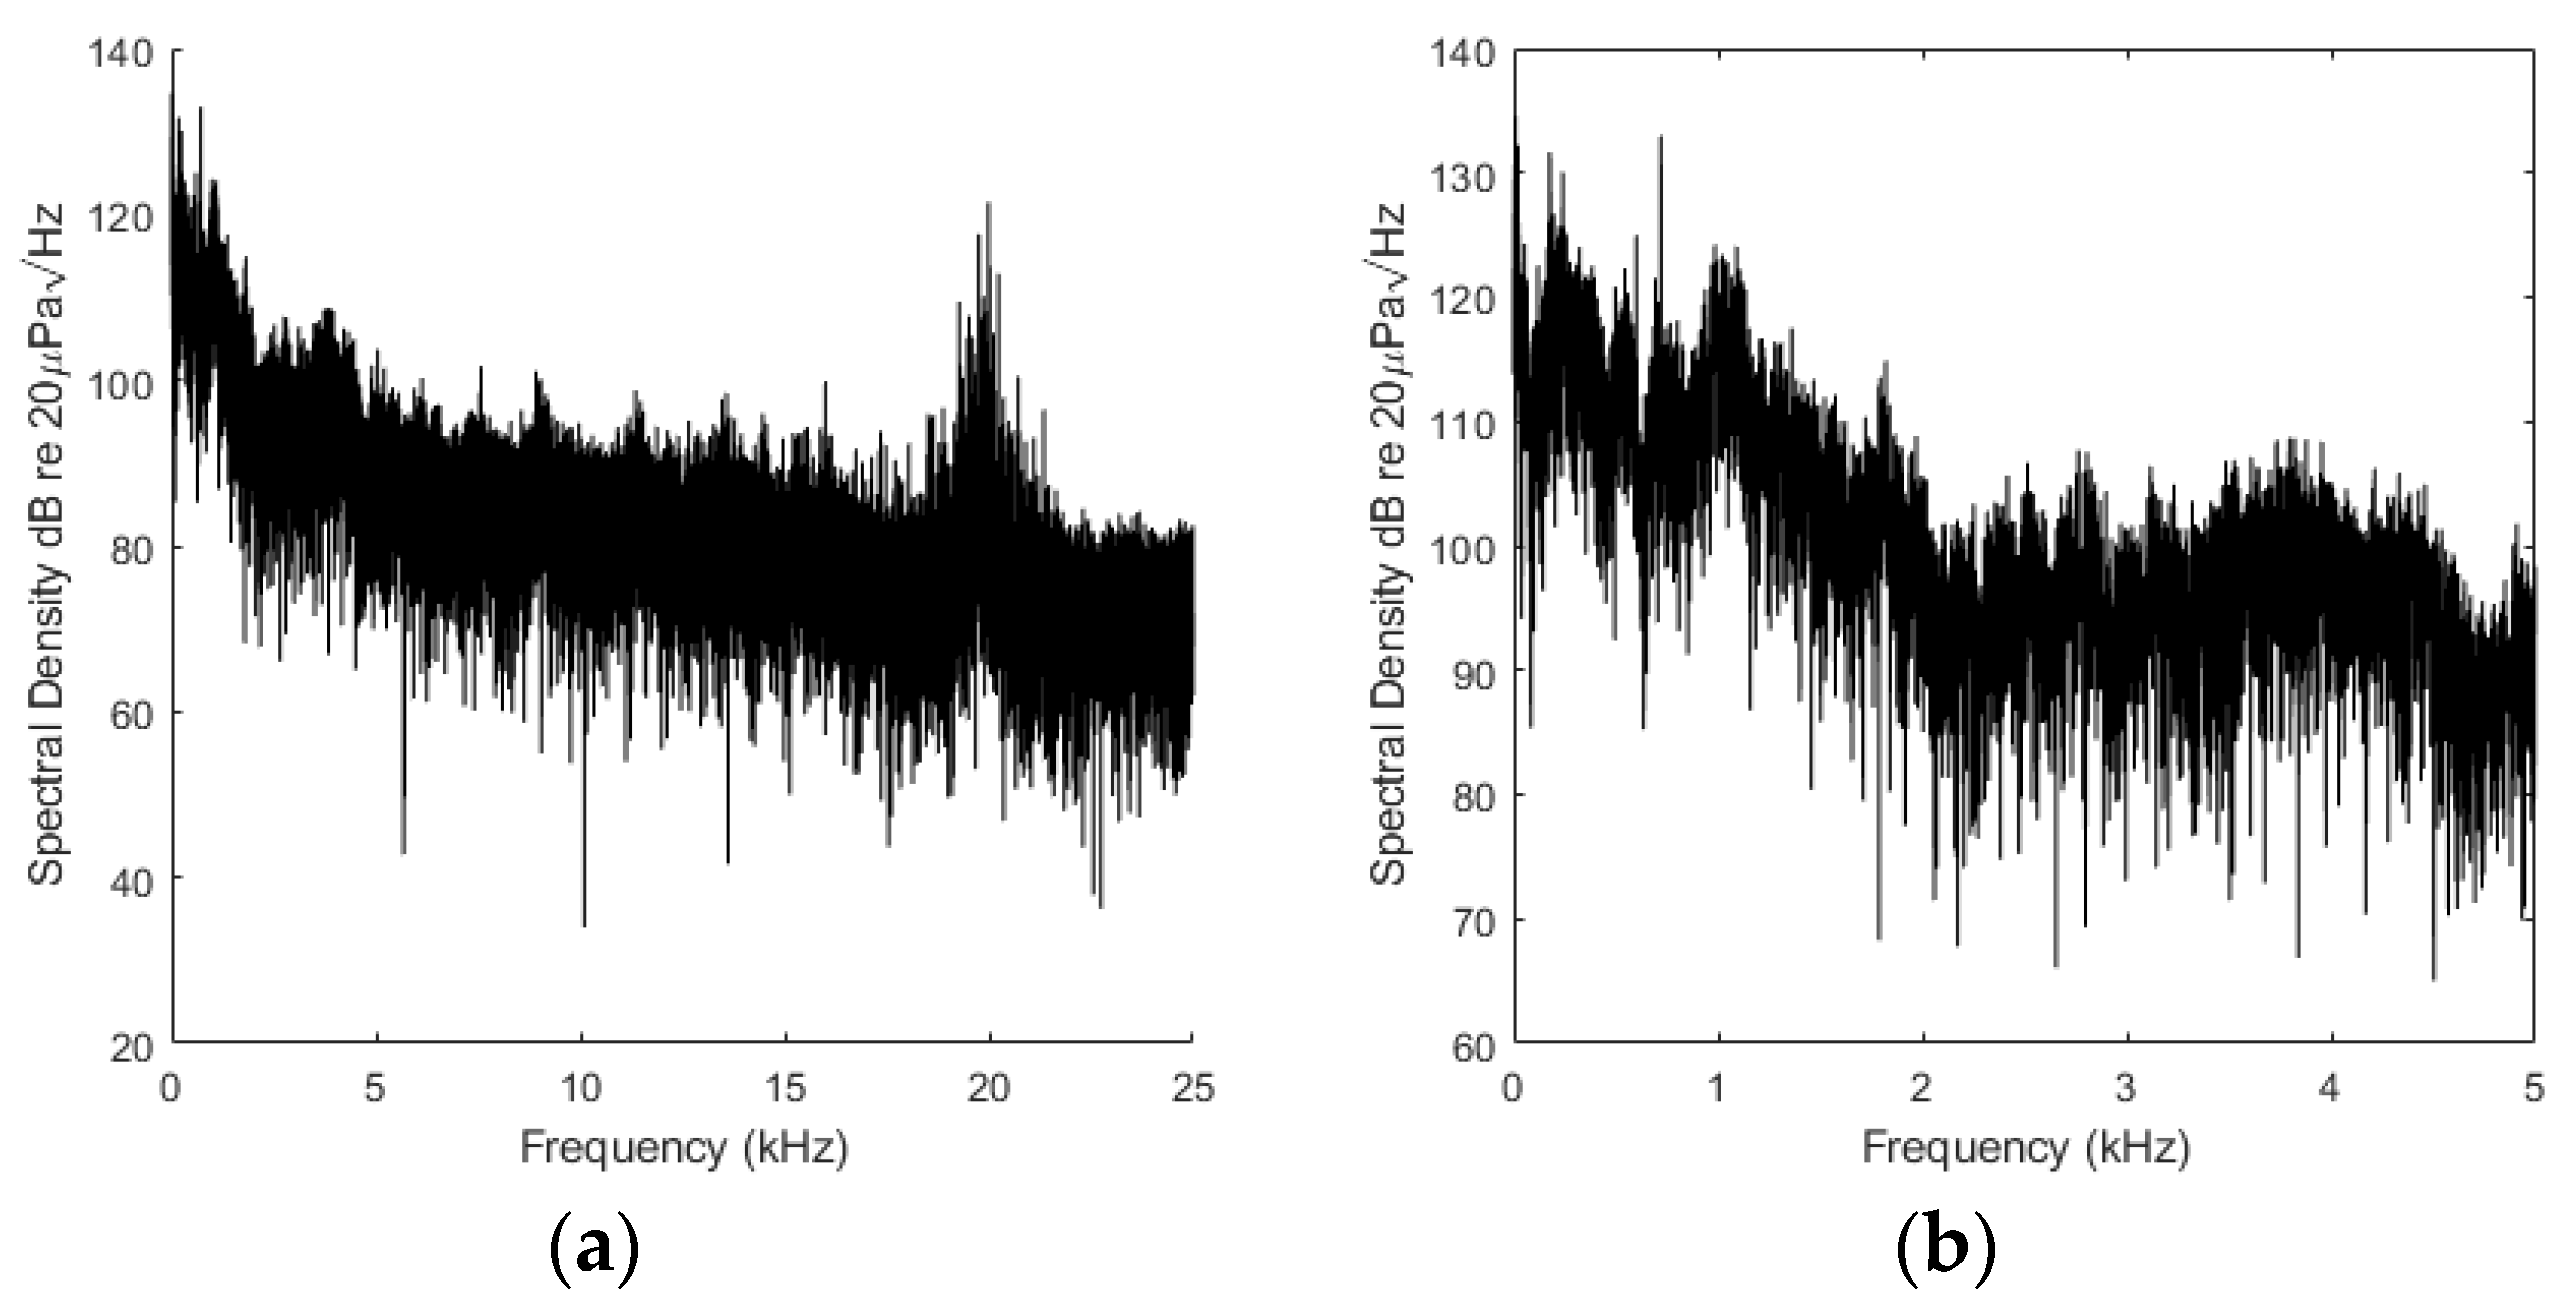
To assess the cause of the 3 Bark peak at 1500 RPM, shown in Figure 8 and Figure 9 the data from the front test of face vents at half recirc were analysed. The FFTs for this is shown in Figure 15 a,b where a clear peak at 300 Hz, which is significantly higher magnitude than any other frequency, can be seen.
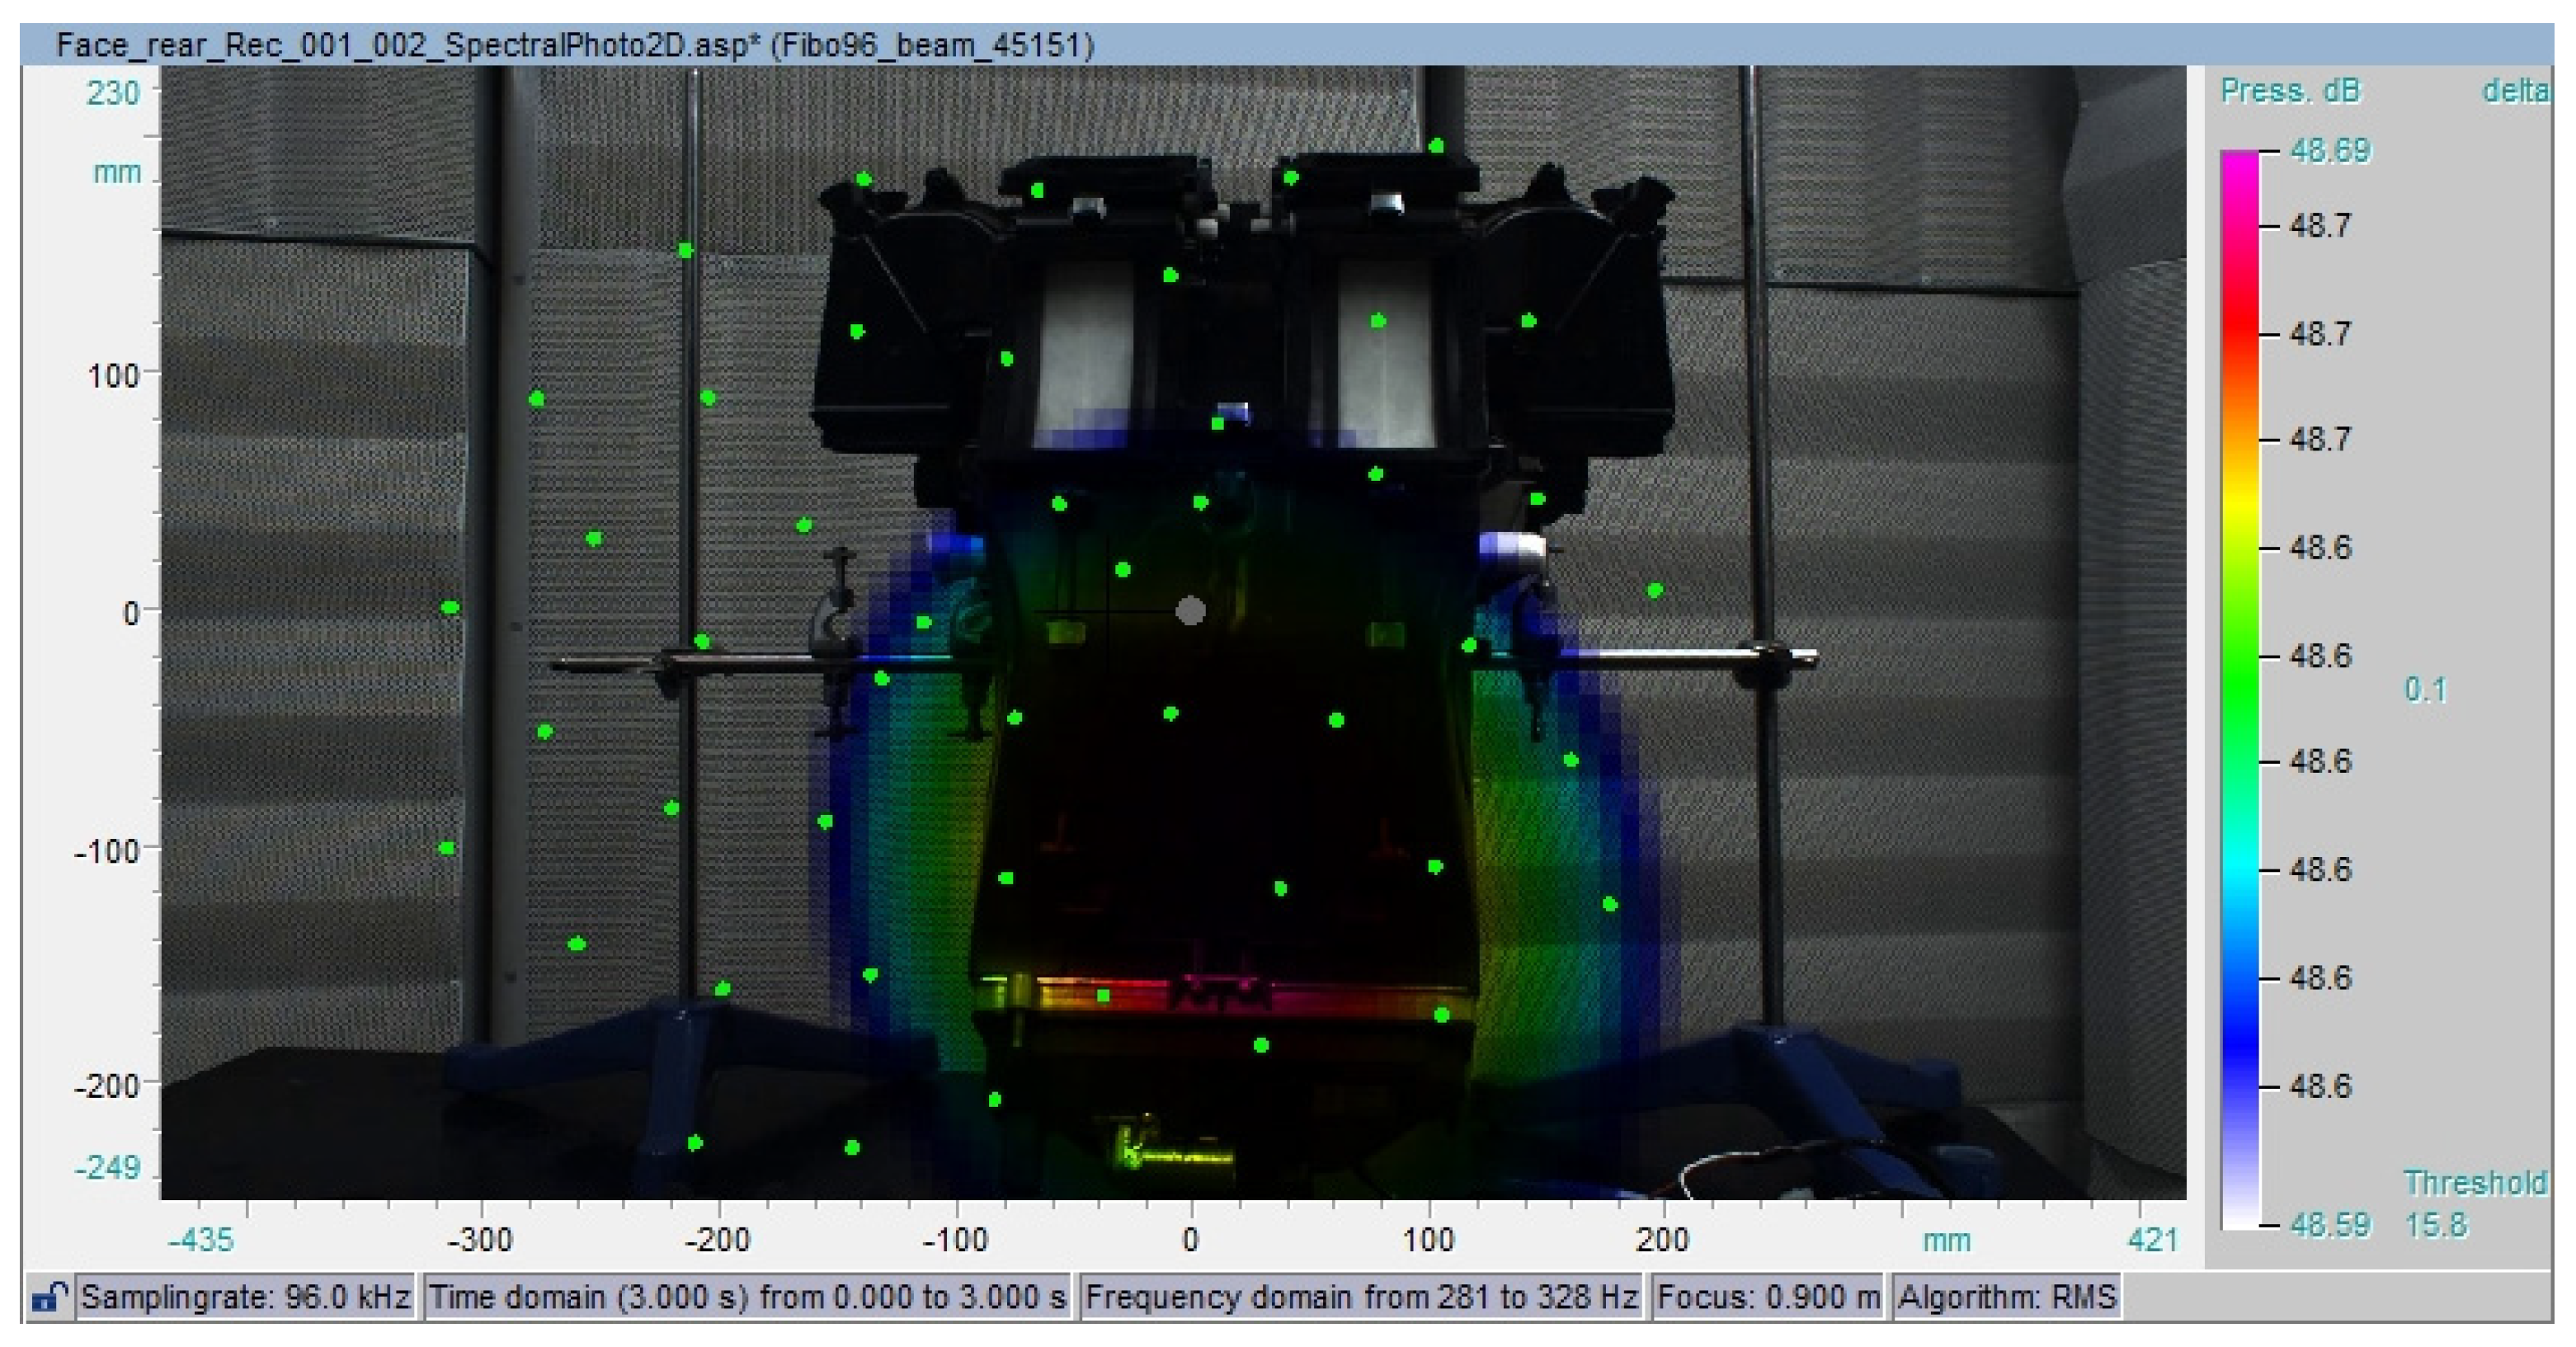
Figure 16 shows the sound pressure map for this frequency, locating its source towards the bottom of the unit.

4. Discussion

The sound pressure levels show in Figure 4 identify the peak level to be 72 dB, occurring at 4000 RPM with the diffuser open. This was the case for either half or full recirc. The sound pressure level with the diffuser open is only slightly higher than the other configurations and is to be expected, as the diffuser vent is closest to and directed towards the microphones. Full and half recirc had little variation between them; the only difference being full had a slightly higher level at lower RPMs. Most of the data fitted a relatively linear relationship (between RPM and sound pressure level) however all the data at 2000 RPM were slightly lower. Loudness showed similar findings to the sound pressure level. This non-linearity is likely a result of noise sources that are not dependent on RPM, such as the motor, whose noise will have greater influence at lower fan speeds, however no evidence was found that these had any significant effect.
The metric sharpness (shown in Figure 10) did not reveal any problems with the data, the only interesting finding being that the fan speed 1500 RPM was shown to drop in sharpness. During testing the engineers noted that this speed produced what they deemed to be an ‘annoying’ sound, combined with the drop, shows that sharpness was not the reason for its annoyance. The drop in sharpness at 1500 RPM is explained by Figure 15, where the FFT shows that there is a high lower frequency component not present in the 2000 RPM FFT shown in Figure 11. Given sharpness is a measure of the proportion of high-frequency wave, a drop would be expected if either less high frequency was present or an increase in lower frequency was present. The specific loudness plots in Figure 8 show that at 1500 RPM a spike at around 3 Bark (~300 Hz) was present, which could not be seen at other frequencies. Figure 9 confirmed that this was present for each test configuration. The acoustic camera was then used to isolate the location of this frequency, which can be seen in Figure 16 to be emitted from near the bottom of the unit with a sound pressure of almost 49 dB. This is a sound wave with an overall sound pressure level of 52 dB (shown in Figure 4) is very significant. The FFT in Figure 15 confirms that this is much higher than any other frequency in the wave. At 2000 RPM a much lower magnitude frequency peak occurs in a similar location at 720 Hz, shown in Figure 14. The presence of this indicates that what is causing the noise is present in other tests, but at a different frequency and significantly lower magnitude. The reason for this noise is not fully clear and would require further analysis and potentially testing to understand. The use of acoustic camera to isolate the location will speed up any further testing. It is likely due to vibrational resonance of part of the unit being achieved, however this is only speculative at this point. The use of the acoustic camera to locate this source enables the redesign of the component to avoid this resonance or alternatively avoiding this RPM once the HVAC unit is in use.

5. Conclusions

This article has presented experimentation on a prototype HVAC unit which aimed to identify the presence of undesirable noises and to locate the source of them using an acoustic camera. The measure of sharpness was used to assess the recoded waveforms and 1500 RPM was identified as not fitting the trend of the rest of the data. This corresponded with the frequency being assessed as ‘annoying’ by the testing engineers. Further analysis of loudness plots reviled a 3 Bark (300 Hz) peak which was located with the acoustic camera to be at the bottom of the unit and is likely due to resonance of the structure. This knowledge of not only the frequency that is undesirable which could be achieved using only a single microphone, but its location enables the potential for physical modifications to be made to the unit to reduce its influence.

Author Contributions

Conceptualization, P.C. and R.P.; methodology, S.G. and M.R.P.; software, S.G.; validation, S.G. and P.C.; formal analysis, S.G.; investigation, S.G. and P.C.; resources, M.R.P. and P.C.; data curation, S.G.; writing—original draft preparation, S.G. and Z.Y.A.A.-S.; writing—review and editing, Z.Y.A.A.-S.; visualization, S.G.; supervision, M.R.P. and R.P.; project administration, Z.Y.A.A.-S.; funding acquisition, M.R.P. and Z.Y.A.A.-S. All authors have read and agreed to the published version of the manuscript.

Funding

This work (Advanced Sustainable Manufacturing Technologies (ASTUTE) Project) is part funded from the EU’s European Regional Development Fund through the Welsh European Funding Office, in enabling the research upon which this paper is based.

Acknowledgments

The authors would like to acknowledge the support of the ASTUTE project, which was part funded from the EU’s European Regional Development Fund through the Welsh European Funding Office, in enabling the research upon which this paper is based. The authors thank Bergstrom Europe Ltd for supplying the HVAC unit as part of an ASTUE collaborative project.

Conflicts of Interest

The authors declare no conflict of interest.

References

  1. Jennings, P.A.; Dunne, G.; Williams, R.; Giudice, S. Tools and techniques for understanding the fundamentals of automotive sound quality. Proc. Inst. Mech. Eng. Part D J. Automob. Eng. 2010, 224, 1263–1278. [Google Scholar] [CrossRef]
  2. Singh, S.; Payne, S.R.; Jennings, P.A. Toward a Methodology for Assessing Electric Vehicle Exterior Sounds. IEEE Trans. Intell. Transp. Syst. 2014, 15, 1790–1800. [Google Scholar] [CrossRef]
  3. Lalor, N.; Priebsch, H.H. The prediction of low-and mid-frequency internal road vehicle noise: A literature survey. Proc. Inst. Mech. Eng. Part D J. Automob. Eng. 2007, 221, 245–269. [Google Scholar] [CrossRef]
  4. Leite, R.P.; Paul, S.; Gerges, S.N. A sound quality-based investigation of the HVAC system noise of an automobile model. Appl. Acoust. 2009, 70, 636–645. [Google Scholar] [CrossRef]
  5. Jung, W.; Elliott, S.J.; Cheer, J. Local active control of road noise inside a vehicle. Mech. Syst. Signal Process. 2019, 121, 144–157. [Google Scholar] [CrossRef] [Green Version]
  6. Allam, S.; Abom, M. Fan Noise Control Using Microperforated Splitter Silencers. J. Vib. Acoust. 2014, 136, 031017. [Google Scholar] [CrossRef]
  7. Allam, S.; Abom, M. Noise control for cooling fans on heavy vehicles. Noise Control. Eng. J. 2012, 60, 707–715. [Google Scholar] [CrossRef]
  8. Yoon, J.-H.; Yang, I.-H.; Jeong, J.-E.; Park, S.-G.; Oh, J.-E. Reliability improvement of a sound quality index for a vehicle HVAC system using a regression and neural network model. Appl. Acoust. 2012, 73, 1099–1103. [Google Scholar] [CrossRef]
  9. Neise, W. Noise reduction in centrifugal fans: A literature survey. J. Sound Vib. 1976, 45, 375–403. [Google Scholar] [CrossRef]
  10. Neise, W. Review of Noise Reduction Methods for Centrifugal Fans. J. Eng. Ind. 1982, 104, 151–161. [Google Scholar] [CrossRef]
  11. Wu, J.-D.; Bai, M.R. Application of feed forward adaptive active-noise control for reducing blade passing noise in centrifugal fans. J. Sound Vib. 2001, 239, 1051–1062. [Google Scholar] [CrossRef]
  12. Velarde-Suárez, S.; Ballesteros-Tajadura, R.; Hurtado-Cruz, J.P.; Santolaria-Morros, C. Experimental determination of the tonal noise sources in a centrifugal fan. J. Sound Vib. 2006, 295, 781–796. [Google Scholar] [CrossRef]
  13. Envia, E. Fan noise reduction: An overview. Int. J. Aeroacoustics 2002, 1, 43–64. [Google Scholar] [CrossRef] [Green Version]
  14. Choi, M. Noise Attenuating Device for a Heating-Ventilation-Cooling System of a Motor Vehicle. U.S. Patent No. 8,166,775, 1 May 2012. [Google Scholar]
  15. Yang, I.H.; Kwon, O.C.; Lee, J.Y.; Oh, J.-E. Sound quality evaluation for the vehicle HVAC system after active noise control. In Proceedings of the ASME 2008 International Mechanical Engineering Congress and Exposition, Boston, MA, USA, 31 October–6 November 2008; pp. 603–607. [Google Scholar]
  16. Arenas, J.P.; Crocker, M.J. Recent trends in porous sound-absorbing materials. Sound Vib. 2010, 44, 12–17. [Google Scholar]
  17. Kitamura, T.; Sato, S.; Shimokura, R.; Ando, Y. Measurement of temporal and spatial factors of a flushing toilet noise in a downstairs bedroom. J. Temporal Des. Arch. Environ. 2002, 2, 13–19. [Google Scholar]
  18. Beranek, L.L. Criteria for Office Quieting Based on Questionnaire Rating Studies. J. Acoust. Soc. Am. 1956, 28, 833–852. [Google Scholar] [CrossRef]
  19. Beranek, L. Noise and Vibration Control; McGraw-Hill: New York, NY, USA, 1971. [Google Scholar]
  20. Beranek, L.L. Balanced noise-criterion (NCB) curves. J. Acoust. Soc. Am. 1989, 86, 650–664. [Google Scholar] [CrossRef]
  21. Blazier, W.E. Revised noise criterion for application in the acoustical design and rating of HVAC systems. Noise Control. Eng. J. 1981, 162, 64–73. [Google Scholar] [CrossRef]
  22. Blazier, W.E. Sound quality consideration in rating noise from heating, ventilating and air-conditioning (HVAC) systems in buildings. Noise Control Eng. J. 1995, 43, 53–63. [Google Scholar] [CrossRef]
  23. Blazier, W.E. RC Mark II: A refined procedure for rating the noise of heating, ventilating, and airconditioning (HVAC) systems in buildings. Noise Control Eng. J. 1997, 45, 243–250. [Google Scholar] [CrossRef]
  24. Shomer, P.D. Proposed revisions to room noise criteria. Noise Control Eng. J. 2000, 48, 85–96. [Google Scholar] [CrossRef]
  25. Schomer, P.D.; Bradley, J.S. A test of proposed revisions to room noise criteria curves. Noise Control Eng. J. 2000, 48, 124–129. [Google Scholar] [CrossRef] [Green Version]
  26. Namba, S.; Kuwano, S. Psychological study on Leq as a measure of loudness of various kinds of noises. J. Acoust. Soc. Jpn. (E) 1984, 5, 135–148. [Google Scholar] [CrossRef] [Green Version]
  27. Kuwano, S.; Namba, S.; Miura, H. Advantages and disadvantages of A-weighted sound pressure level in relation to subjective impression of environmental noises. Noise Control. Eng. J. 1989, 33, 107–115. [Google Scholar] [CrossRef]
  28. Ayr, U.; Cirillo, E.; Fato, I.; Martellotta, F. A new approach to assessing the performance of noise indices in buildings. Appl. Acoust. 2003, 64, 129–145. [Google Scholar] [CrossRef]
  29. Kryter, K. The Effects of Noise on Man; Academic Press: New York, NY, USA, 1970. [Google Scholar]
  30. Robinson, D. Towards a unified system of noise assessment. J. Sound Vib. 1971, 14, 279–298. [Google Scholar] [CrossRef]
  31. Moreau, S.; Henner, M.; Casalino, D.; Gullbrand, J.; Iaccarino, G.; Wang, M. Toward the prediction of low-speed fan noise. In Proceedings of the Summer Program, 9 July–4 August 2006; Center for Turbulence Research: Stanford, CA, USA, 2006; p. 519. [Google Scholar]
  32. Huang, H.B.; Huang, X.R.; Yang, M.L.; Lim, T.C.; Ding, W.P. Identification of vehicle interior noise sources based on wavelet transform and partial coherence analysis. Mech. Syst. Signal Process. 2018, 109, 247–267. [Google Scholar] [CrossRef]
  33. Rossing, T. (Ed.) Springer Handbook of Acoustics; Springer Science & Business Media: New York, NY, USA, 2007. [Google Scholar]
  34. International Organization for Standardization. Acoustics—Normal Equal-Loudness Contours; ISO 226; International Organization for Standardization: Geneva, Switzerland, 2003. [Google Scholar]
  35. Marui, A.; Martens, W.L. Predicting perceived sharpness of broadband noise from multiple moments of the specific loudness distribution. J. Acoust. Soc. Am. 2006, 119, EL7–EL13. [Google Scholar] [CrossRef] [Green Version]
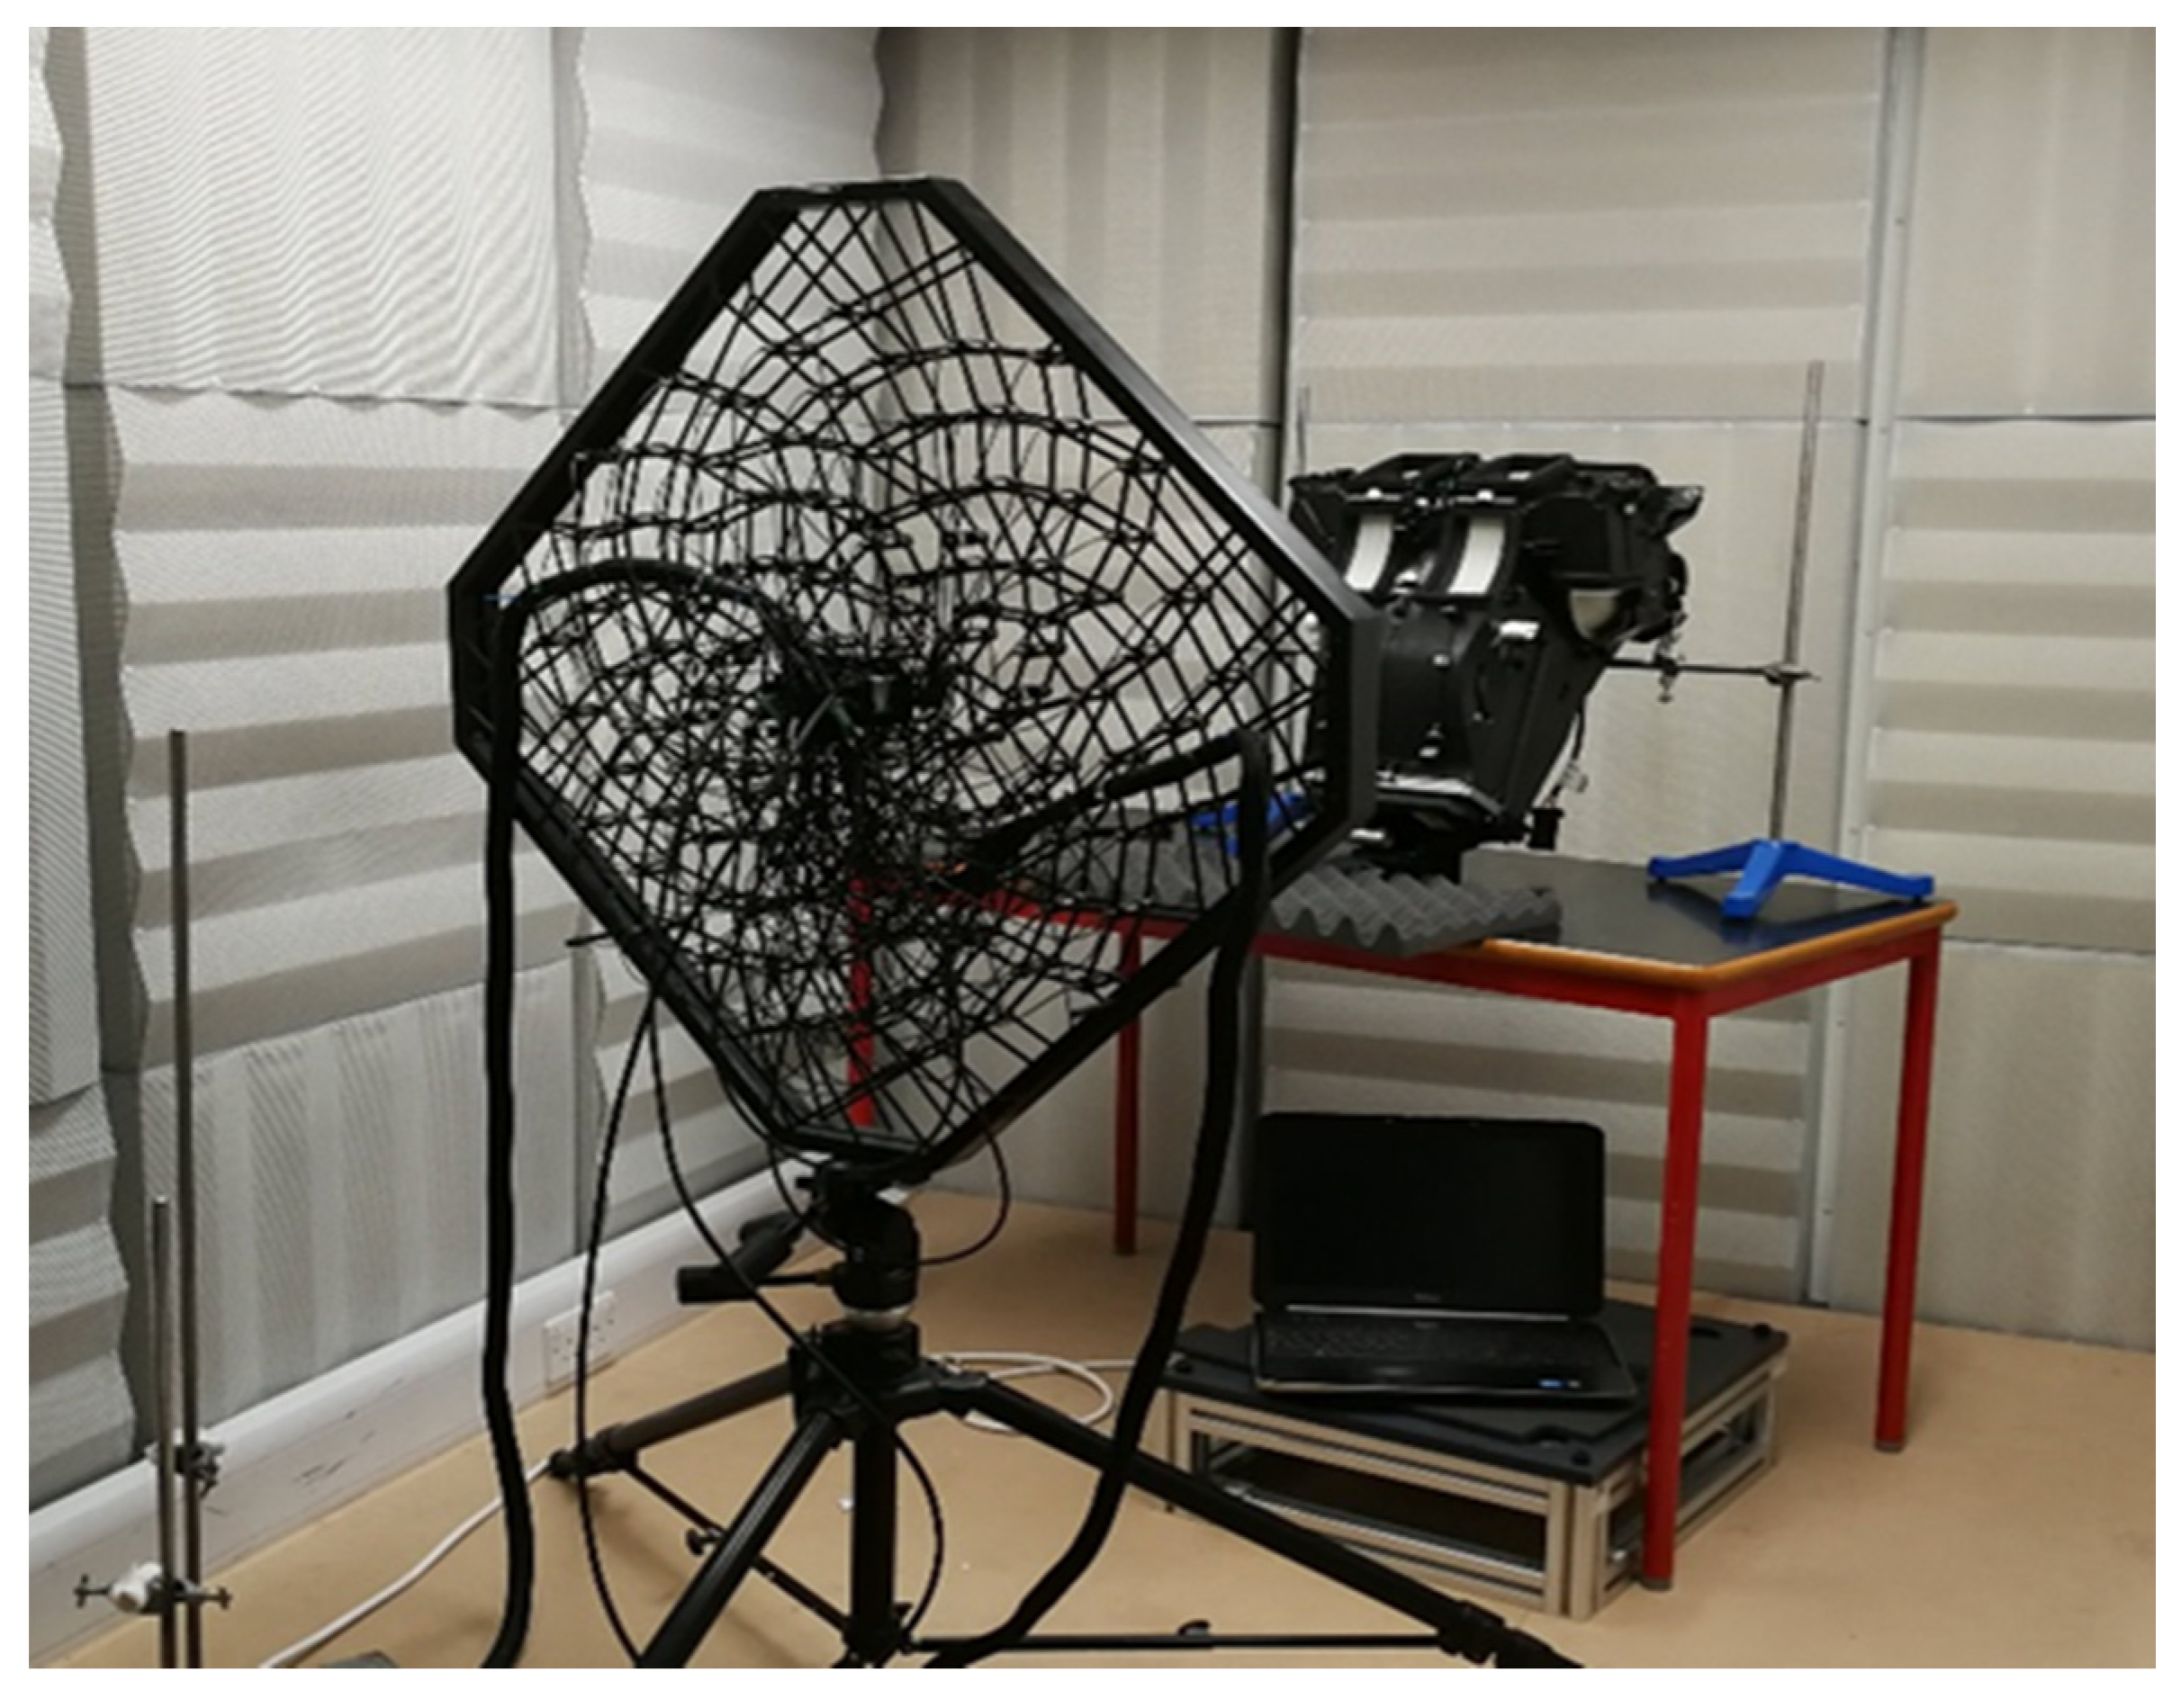
Figure 1. Experimental Setup.
Applsci 11 09811 g001
Figure 2. ‘A weighting’ filter.
Applsci 11 09811 g002
Figure 3. Equal loudness contours red (from ISO 226:2003 revision [34]). Original ISO standard shown (blue) for 40-phons.
Applsci 11 09811 g003
Figure 4. Sound pressure level at all RPMs of each vent configuration in rear view with half recirc (a) and full recirc (b).
Applsci 11 09811 g004
Figure 5. Sound pressure level after ‘A-weighting’ at all RPMs of each vent configuration in rear view with half recirc (a) and full recirc (b).
Applsci 11 09811 g005
Figure 6. Total loudness at all RPMs of each vent configuration in rear view with half recirc (a) and full recirc (b).
Applsci 11 09811 g006
Figure 7. Specific loudness for all rear data at 2000 RPM with half recirc (a) and full recirc (b).
Applsci 11 09811 g007
Figure 8. Specific loudness for all rear data of face vent with half recirc (a) and full recirc (b).
Applsci 11 09811 g008
Figure 9. Specific loudness for all rear data at 1500 RPM with half recirc (a) and full recirc (b).
Applsci 11 09811 g009
Figure 10. Sharpness at all RPMs of each vent configuration in rear view with half recirc (a) and full recirc (b).
Applsci 11 09811 g010
Figure 11. FFT of front face test at 2000 RPM, FFT up to 25 kHz (a) and up to 9 kHz (b).
Applsci 11 09811 g011
Figure 12. Sound pressure map of front face test at 2000 RPM, frequency between 160 Hz and 210 Hz.
Applsci 11 09811 g012
Figure 13. Sound pressure map of front face test at 2000 RPM, frequency between 1700 Hz and 1900 Hz.
Applsci 11 09811 g013
Figure 14. Sound pressure map of front face test at 2000 RPM, frequency between 700 Hz and 750 Hz.
Applsci 11 09811 g014
Figure 15. FFT of front face test at 1500 RPM, FFT up to 25 kHz (a) and up to 5 kHz (b).
Applsci 11 09811 g015
Figure 16. Sound pressure map of front face test at 1500 RPM, frequency between 280 Hz and 330 Hz.
Applsci 11 09811 g016
Publisher’s Note: MDPI stays neutral with regard to jurisdictional claims in published maps and institutional affiliations.