Article

An Aerosol Sensor for Multi-Sized Particles Detection Based on Surface Acoustic Wave Resonator and Cascade Impactor

1
Institute of Acoustics, Chinese Academy of Sciences, No. 21, North 4th Ring West Road, Beijing 100190, China
2
School of Electronic, Electrical and Communication Engineering, University of Chinese Academy of Sciences, Beijing 100049, China
*
Author to whom correspondence should be addressed.
Appl. Sci. 2021, 11(21), 9833; https://doi.org/10.3390/app11219833
Submission received: 22 August 2021 / Revised: 11 October 2021 / Accepted: 19 October 2021 / Published: 21 October 2021
(This article belongs to the Special Issue Wireless and Passive Surface Acoustic Wave Sensor)

Abstract

:
This research proposed the design, fabrication, and experiments of a surface acoustic wave resonator (SAWR)-based multi-sized particles monitor. A wide range selection and monitoring of large coarse particles (LCP), inhalable particles (PM10), and fine inhalable particles (PM2.5) were achieved by combining high-performance 311 MHz SAWRs and a specially designed cascade impactor. This paper calculated the normalized sensitivity distribution of the chip to the mass loading effect, extracted the optimal response area for particle attachment, analyzed the influence of the distance between nozzle and chip surface on the particle distribution, and evaluated the collection efficiency of the specially designed 2 LPM (L/min) impactor through computational fluid dynamics simulation software. An experimental platform was built to conduct the response experiment of the sensor to particle-containing gas generated by the combustion of leaf fragments and repeatability test. We verified the results of the particle diameter captured at each stage. This research suggests that the sensor’s response had good linearity and repeatability, while the particles collected on the surface of the SAWR in each impactor stage met the desired diameter, observed through a microscope.

1. Introduction

Liquid or solid suspended particles are often present in the atmosphere. PM10 can enter the human throat and chest cavity through the nose and mouth; PM2.5 can enter the human trachea, bronchi, and alveoli, seriously affecting human health and causing respiratory, cardiovascular, and cerebrovascular diseases [1,2,3,4]. The World Health Organization states that when the annual average mass concentration of PM2.5 exceeds 35 μg/m3, the risk of human mortality increases by about 15% compared to the annual average mass concentration of 10 μg/m3 [5].
One of the priorities of air quality monitoring in various countries is to achieve accurate monitoring of the mass concentration of airborne particles such as large coarse particles (LCP, diameter ≥ 10 μm), PM10 (diameter ≤ 10 μm), and PM2.5 (diameter ≤ 2.5 μm). The mainstream particulate matter monitoring devices include the gravimetric method [6], the tapered element oscillating microbalance (TEOM) method, the β-ray attenuation method, and the light scattering method [7]. The gravimetric method has high measurement accuracy, and its data are often used as reference standards and calibration data for automatic monitoring equipment, but it requires manual operation and takes a longer time than other methods [8]. The β-ray attenuation method analyzes the particles based on their absorption intensity of the β-rays, but the measurement accuracy is usually not high. The light scattering method detects the intensity of the scattered light from the sampled particles to deduce the concentration of the particles, but this method relies on the nature of the particles, and thus, it has relatively low accuracy. Table 1 listed devices based on the above methods. Since the devices manufactured by these methods generally have the disadvantages of being expensive, time-consuming, and bulky, designing and producing highly sensitive, small, and low-cost aerosol particle monitoring devices is one of the goals for researchers.
The surface acoustic wave (SAW) is an elasticity acoustic wave traveling along the surface of a material. In 1885, Lord Rayleigh demonstrated the existence of the Surface Acoustic Wave [9]. In 1965, R.M. White and F.W. Voltmer designed and fabricated the interdigital transducer (IDT) for excitation and detection of the Surface Acoustic Wave [10], laying the foundation for the rapid development of applied research on the Surface Acoustic Wave sensors since the 1970s. SAW sensors have the characteristics of small size, high sensitivity, low cost, and simple signal processing, which are consistent with the development direction of aerosol particulate monitoring equipment.
W.D. Bowers et al. used SAW sensors for fine particle mass monitoring and showed that the sensitivity of the 158 MHz SAW sensor has 266 times the sensitivity of a 10 MHz quartz crystal micro-balance (QCM) sensor [11]. Hao et al. combined the SAW device with a virtual impactor, using the thermophoretic sedimentary method to obtain a miniature personal PM2.5 monitor with a flow rate of 13.5 mL/min [12]. Wang et al. reported a 3D-printing technology-based virtual impactor for a PM1 monitor with a 147.24 MHz SAW resonator, and the result shows a sensitivity of 7.446 Hz/min per μg/m3 [13]. Kuo et al. combined a flow rate of 0.125 LPM cyclone sampler with a 122 MHz shear-horizontal surface acoustic wave (SH-SAW) device, and its sensitivity to cigarette particles reached 9 Hz/ng [14]. Zhao et al. designed a QCM particle sensor based on a 3D printed virtual impactor and successfully separated silicon dioxide particles under 8 μm [15]. All of these studies have demonstrated the potential of mass-sensitive piezoelectric sensors, especially SAW sensors, for environmental particulate detection applications. However, most of the current studies focused on separating and detecting a single range of particles, while few studies focused on multi-sized particles detection. Djoumi et al. investigated the combination of cascade sampling and SAW delay lines for PM10 and PM2.5 monitoring [16]. Zhu et al. proposed a low flowrate Film Bulk Acoustic Resonator (FBAR) PM sensor using the thermophoretic sedimentary method and a double-stage designed virtual impactor to separate PM10 and PM2.5 [17]. These studies have attempted to measure two different ranges of particulate matter, extending the application scenario of mass-sensitive piezoelectric PM sensors.
In this paper, we used SAWRs, which were highly sensitive to the particle mass loading effect, and a specially designed cascade impactor to separate various diameter ranges of airborne particles. We proposed a PM sensor’s design, fabrication, and experiments based on SAWRs for multi-sized aerosol particles detection, including large coarse particles (LCP), PM10, and PM2.5. In Section 2.1 and Section 2.2, an innovatively theoretical simulation of the SAWR was performed to extract an optimal response area for particle attachment, and the influence of the distance between the nozzle and the surface of the chip on the particle distribution was researched. We theoretically calculated and designed the 2 LPM cascade impactor we describe in Section 2.3. An experimental platform was built to conduct a series of experiments, including the sensor’s response test for the combustion of leaf fragments and a repeatability test, and we verified the sampling performance of each stage of the impactor in the last section.

2. Design and Simulation

The schematic diagram of the multi-sized particles sensor based on the surface acoustic wave resonator with a cascade sampler we designed is shown in Figure 1. The SAW chip is the fundamental functional element of the sensor and can be classified as a resonator and delay-line structure. Although the SAW delay-line can provide a larger area for coating sensitive films, the insertion loss of the chip is usually high. The resonator has the characteristics of high Q-value and low insertion loss, which is beneficial to improve the detection limit in mass sensing [18,19]. The particulates in the air were selected by an impactor and deposited on the sensitive area of the SAWR placed on the impaction plate, changing the propagation velocity of the surface acoustic wave with the mass loading effect, resulting in changes in chip amplitude and phase frequency response. The phase signal was discriminated by the phase discriminating circuit and converted into a voltage signal (mV) for output. The changed value of the output voltage represented the mass of the detected particulate matter.
In this study, we designed a three-stage cascade impactor combined by the LCP stage, PM2.5–10 stage, PM1–2.5 stage, inlet stage, and outlet stage. Figure 2 shows the schematic diagram of our cascade impactor. We label the first stage “LCP” because it will collect and measure particles larger than 10 μm, which are large coarse particles; the second stage will collect and measure particles between 2.5 and 10 μm, which we label “PM2.5–10”; the third stage was labeled “PM1–2.5”, and will collect and measure finer particles between 1 and 2.5 μm.

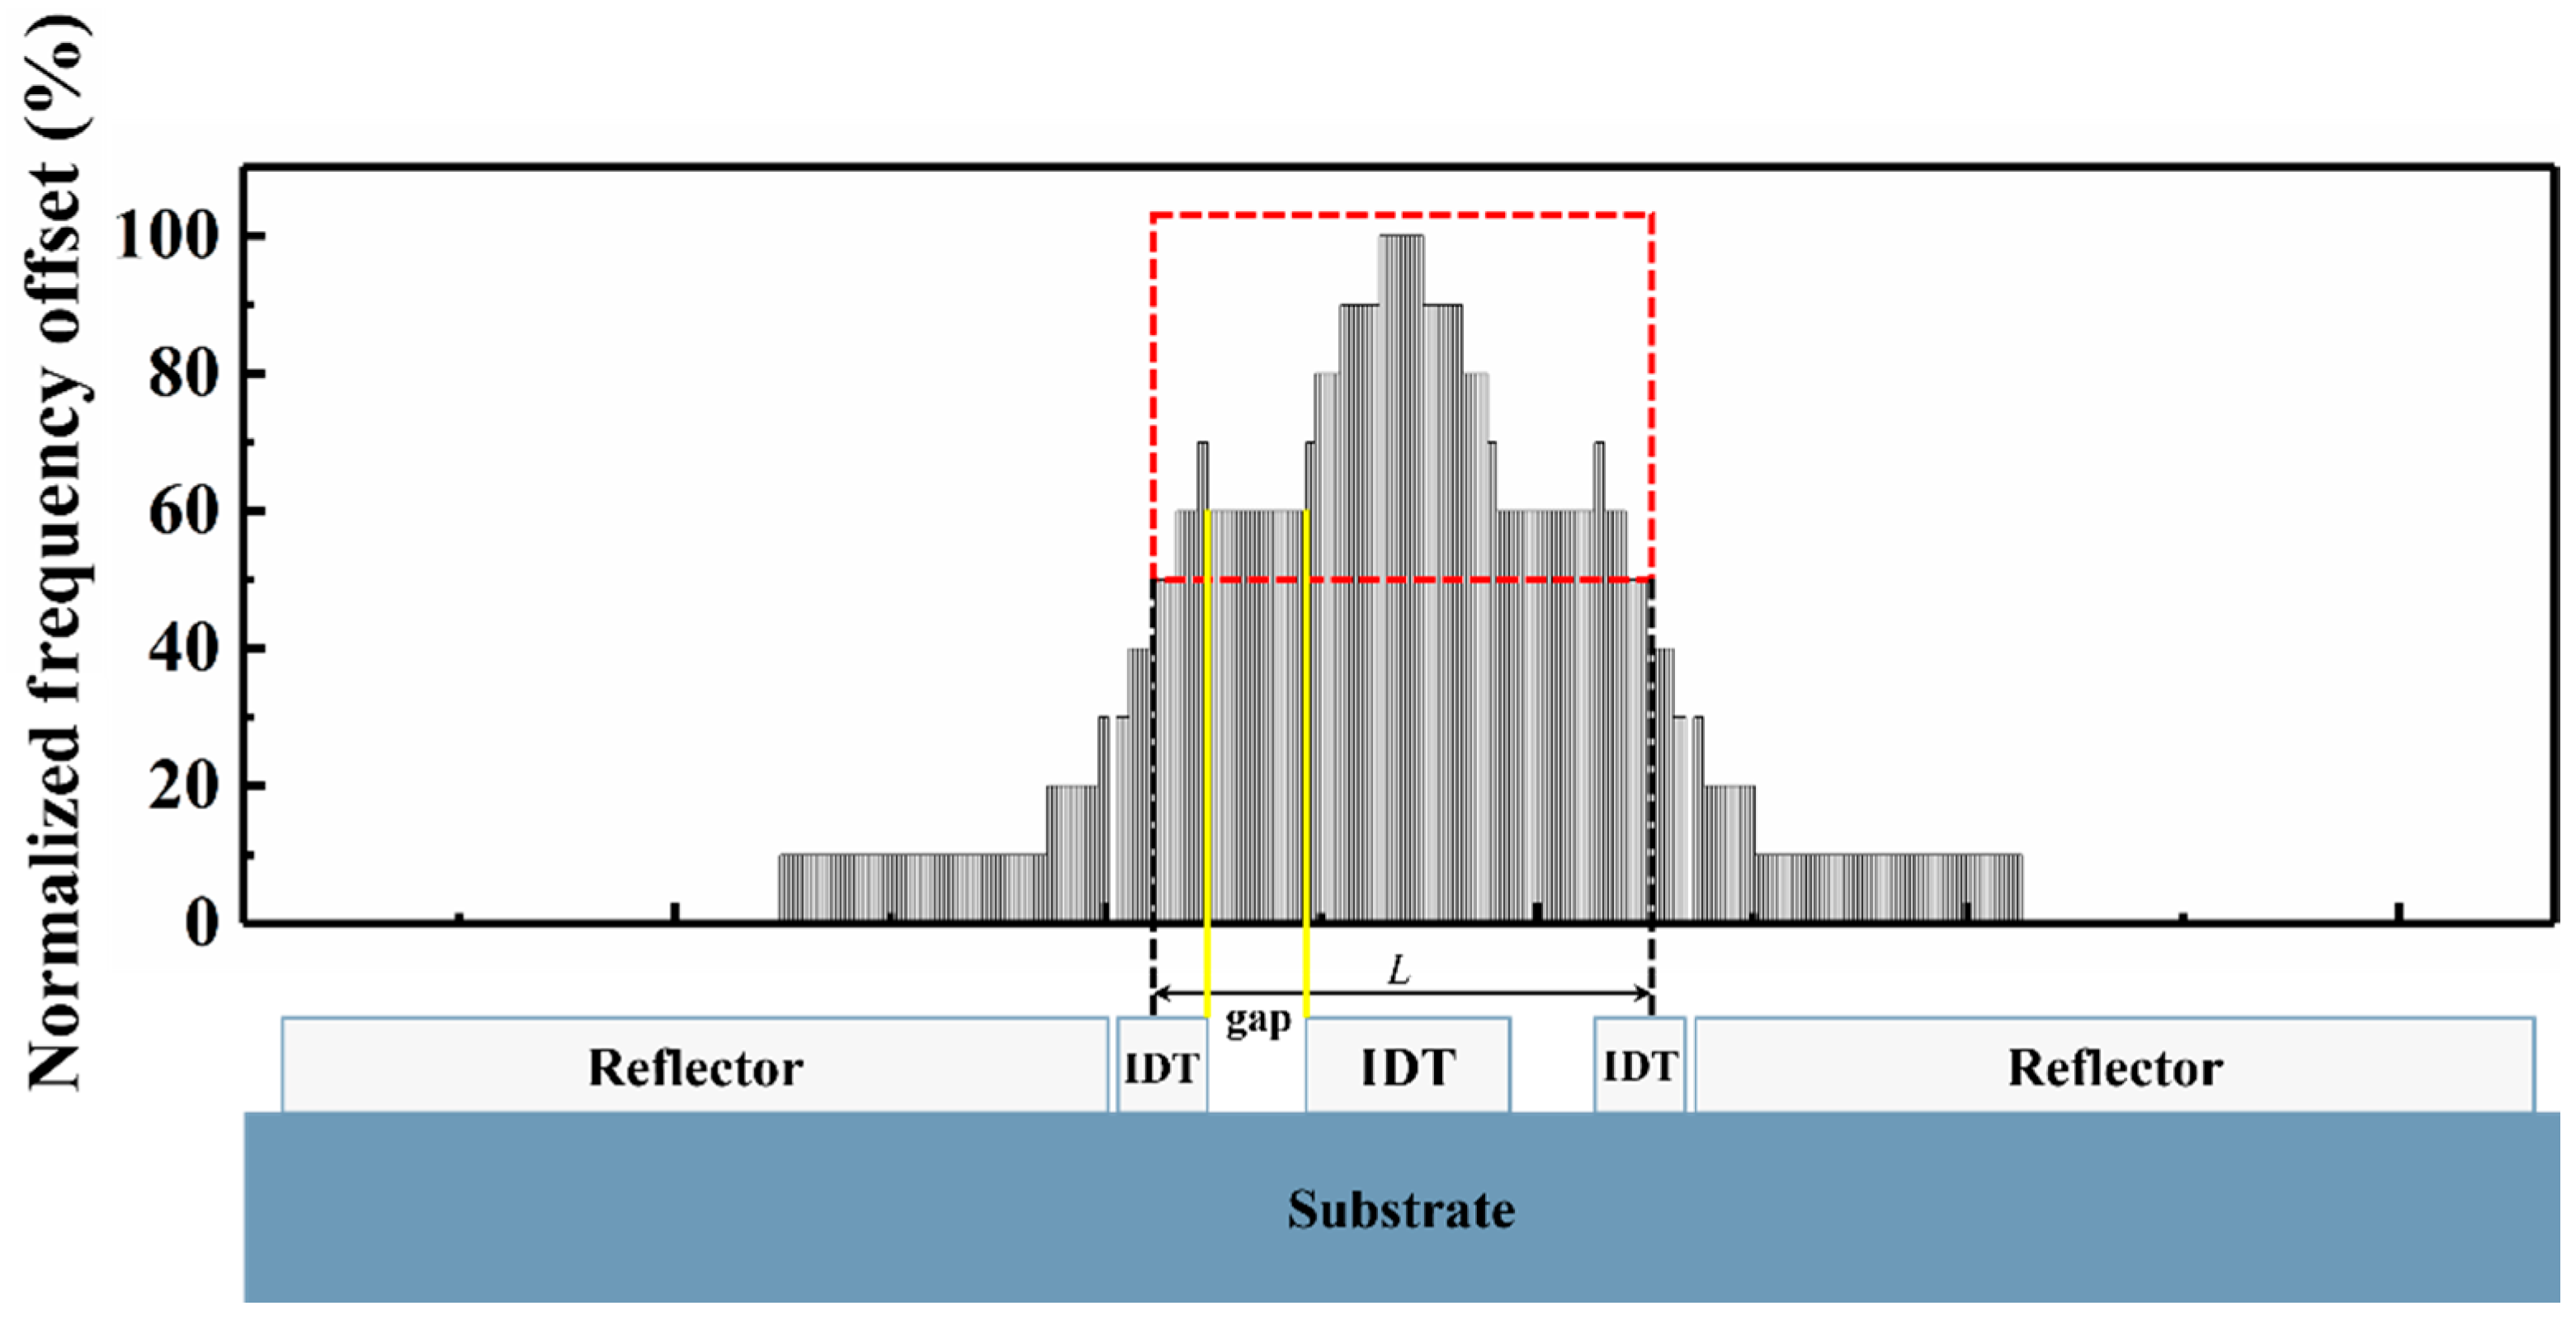
2.1. Simulation of the Relative Sensitivity with Different Loaded Areas on Surface of SAWR

In order to extract the areas where the SAWR has higher sensitivity to particle mass loading effect and minor response differences, the frequency response generated by the mass loading effect on each area of the device surface was obtained through simulation. In this contribution, we used high-performance dual-port SAWRs constructed with three IDTs and two shorted grating reflectors as a sensing core of our sensor for a sizeable sensitive area. The schematic of our chip is shown in Figure 3. The aluminum interdigital transducer and shorted reflectors were patterned on ST-X quartz, the common electrical port of lateral IDTs (IDT2 and IDT3) was designated as an input port, and the electrical port of central IDT (IDT1) as an output port. The density ρ of aluminum material is 2700 kg/m3, and elastic stiffness constants C 12 and C 44 are 5.11 and 2.63 [20]. The structure parameters of our SAWR are shown in Table 2.
First, the non-loaded and loaded 3D finite element models were simulated by the commercial software COMSOL MULTIPHYSICS. The coupling model parameters were extracted and put into the P-matrix for calculation [21]. In order to save model computing resources, the periodic model of the electrodes on the piezoelectric substrate was simplified to a half-period model imposed with periodic boundary conditions for obtaining numerical results of infinitely large periodic structures. Figure 4 shows the schematic diagram and mesh geometry of the half-period model of electrodes on the piezoelectric substrate. Table 3 shows the coupling-of-modes (COM) parameters extracted from the simulation before and after mass loaded on the interdigital transducer. We simulated the situation of particles loaded on the surface of the SAWR by loading the IDT with a 300 nm thick SiO2 layer [22].
The non-loaded center frequency of dual-port SAWR with three IDTs we used was 311 MHz. A comparison of the simulated amplitude-frequency response and phase-frequency response curve with the actual response measurement was shown in Figure 5, and the simulated response corresponded in shape between testing results, especially the peak and slope at the center frequency. In order to optimize the impactor design parameters and chip placement, we obtained the areas on the surface of SAWR that are sensitive to the mass loading effect while having a minor variation in response. We simulated the variation of the frequency response generated by the particle loaded on each area of the SAWR’s surface. Additionally, a 300 nm dense SiO2 layer was used to cover the IDT as the particle loaded on the chip surface, and the loaded area was set as a pair of interdigital electrodes. The response of each area of the chip was calculated numerically and compared with the center frequency before loading to obtain the normalized sensitivity distribution of the chip to the mass loading effect in Figure 6.
It can be seen from Figure 6 that when the particles fall onto each area of SAWR’s surface, the response was different: The chip’s central transducer was the most sensitive area of the mass loading effect. As the distance between the particle and the chip center increased, the frequency offset decreased accordingly. The yellow line in the figure indicated a gap area between the central and lateral transducers. This area produced the same frequency offset for the loading effect under the same particle mass. The reflector area near the outer edge of the chip was almost insensitive to the mass loading effect. Taking the corresponding area within 50% of the highest frequency offset fluctuation as the optimal responding area, we can produce the most sensitive response to the particle while having a larger attachment area. The optimal particle attachment area is indicated by L in Figure 6. Therefore, we should let most of the particles fall within this range after being ejected from the acceleration nozzle of the impactor to obtain a good response effect.

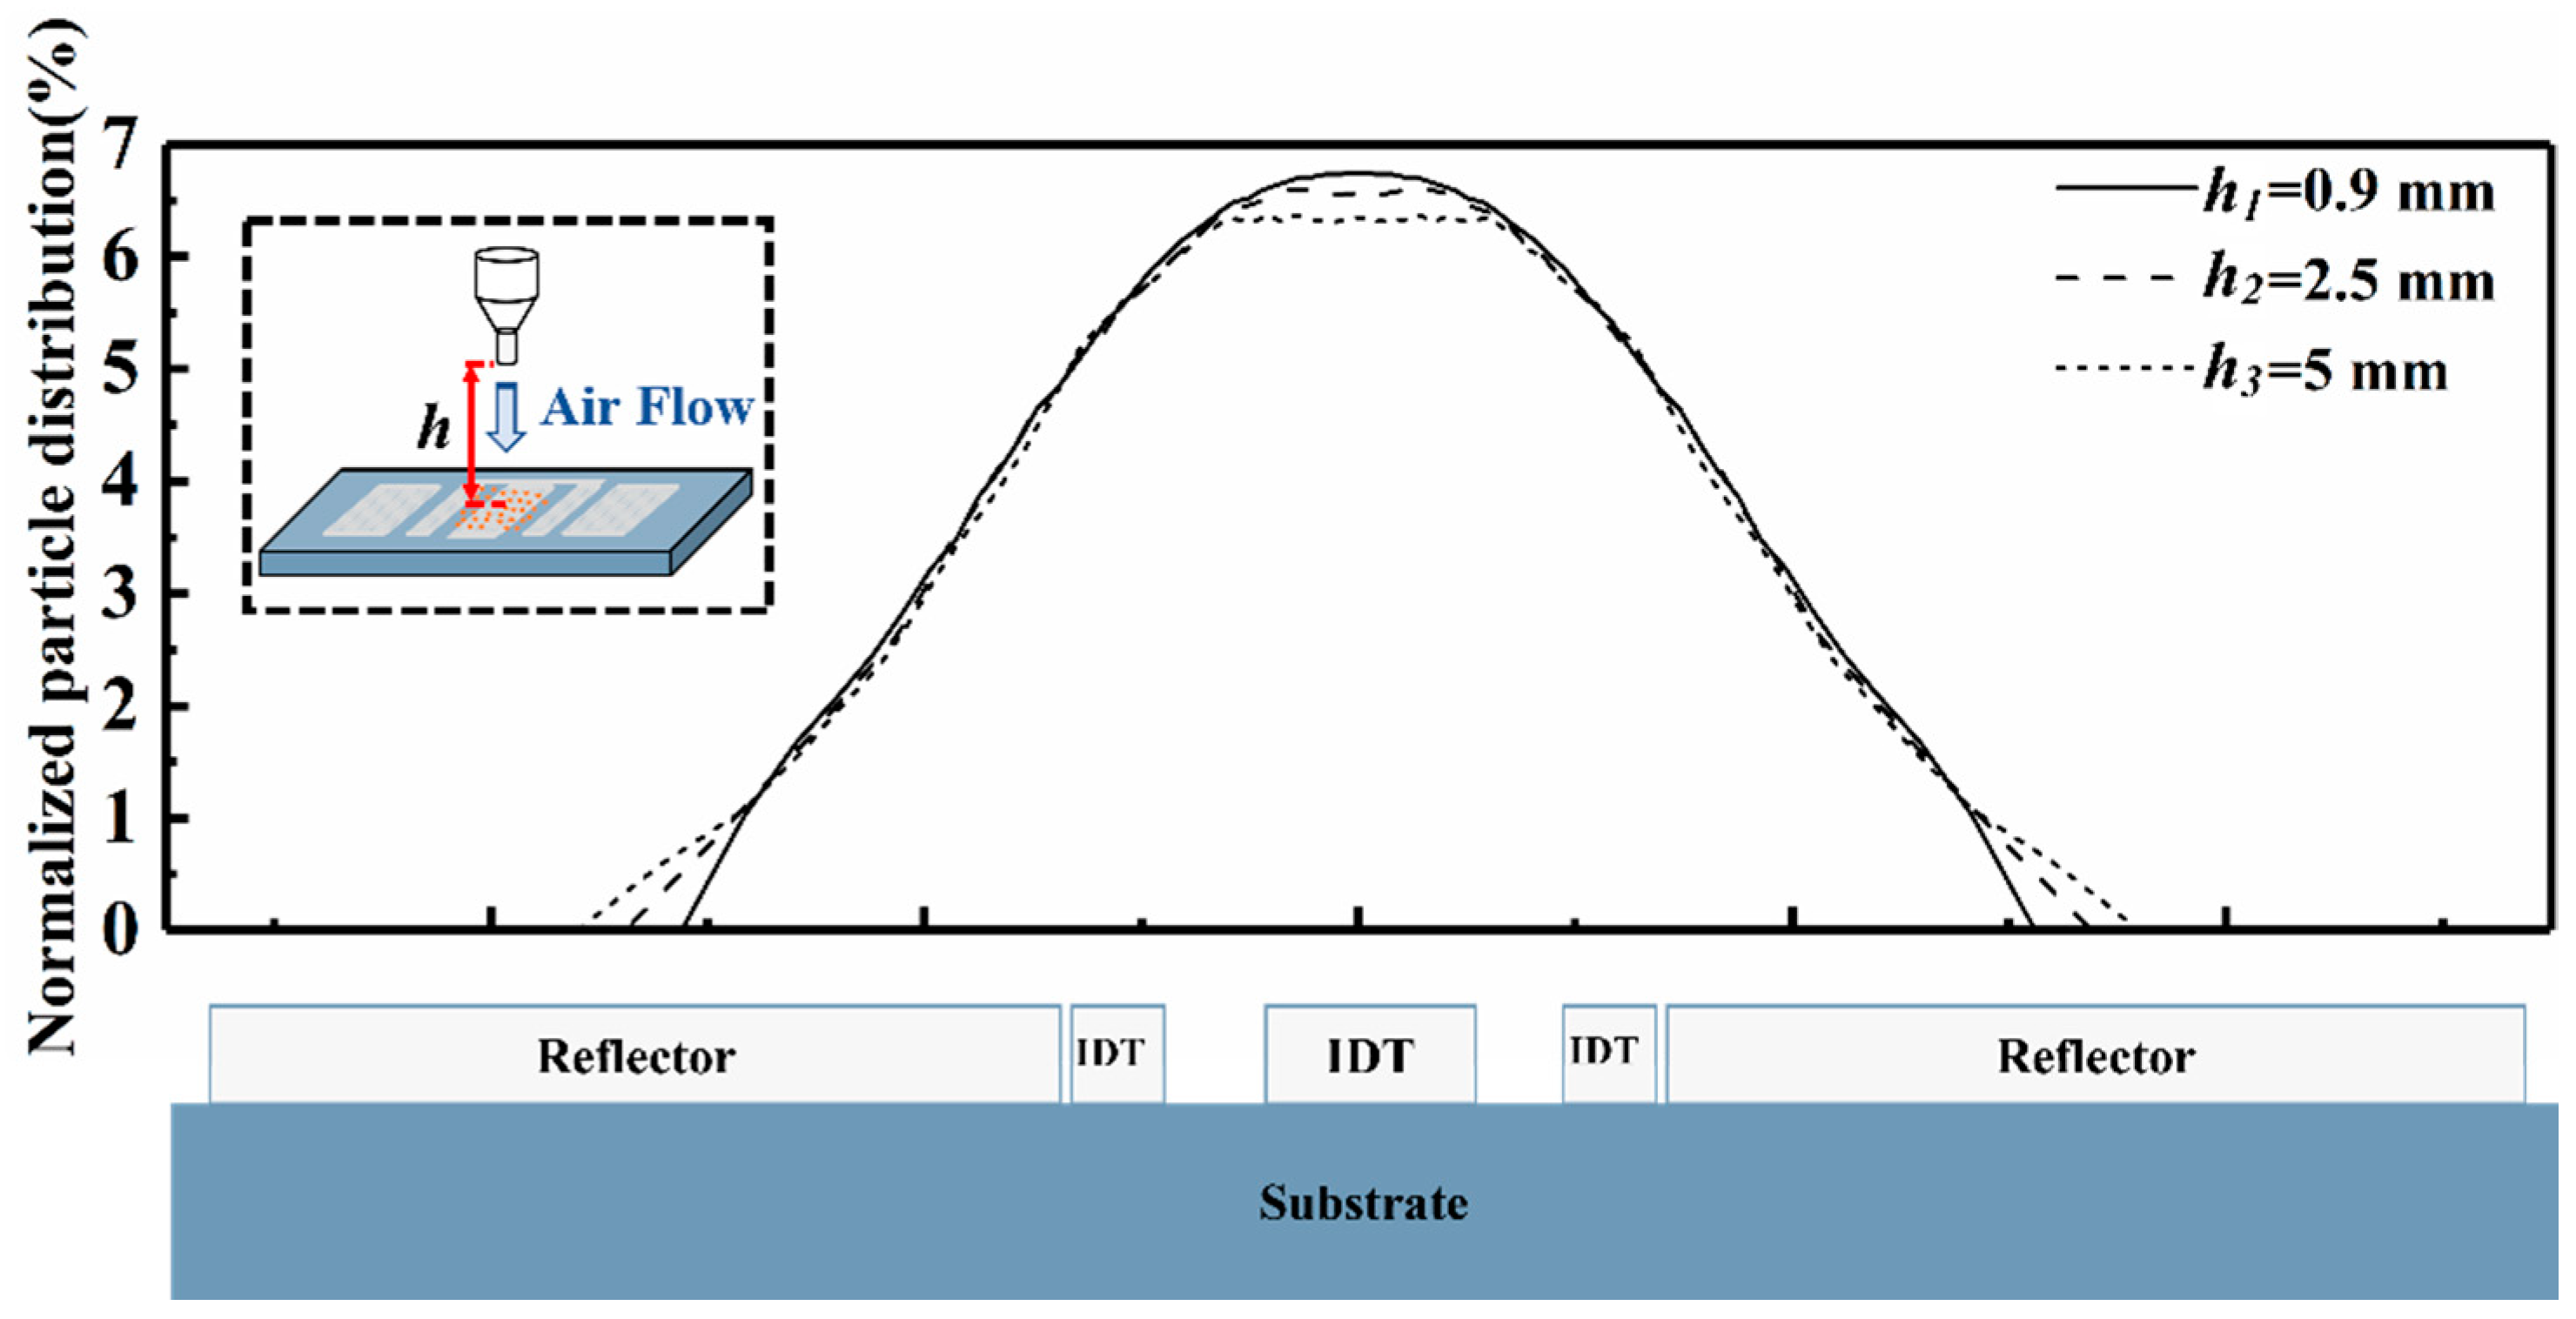
2.2. Simulation of Particle Position Distribution with a Different Impact Distance

In order to obtain the relationship between the particle attachment position distribution on the surface of the chip and the distance from the nozzle to the surface, we used the computational fluid dynamics (CFD) module and particle tracking module of the commercial software COMSOL MULTIPHYSICS to conduct the simulation. A schematic diagram is shown in Figure 7. All particles were set to be spherical with the same density and were uniformly distributed at the entrance of the nozzle for the convenience of simulation. The particle distribution on the surface with different impact distances was calculated by adjusting the distance between the nozzle and the chip surface ( h ).
With the change of distance (h1 = 0.9 mm, h2 = 2.5 mm, h3 = 5 mm), the area and distribution density of the same amount of particles falling from the nozzle to the surface were significantly different: when impacting the chip from a shorter distance, particles were more concentrated in the center of the chip surface, and the impaction range was small; as the distance increased, the particle attachment range on the surface was larger, while the number of particles fell on the center area were relatively lower. The above analyzed conclusions guided the design of a SAWR-appropriate cascade impactor to ensure its particle selecting performance and chip response characteristics were good.

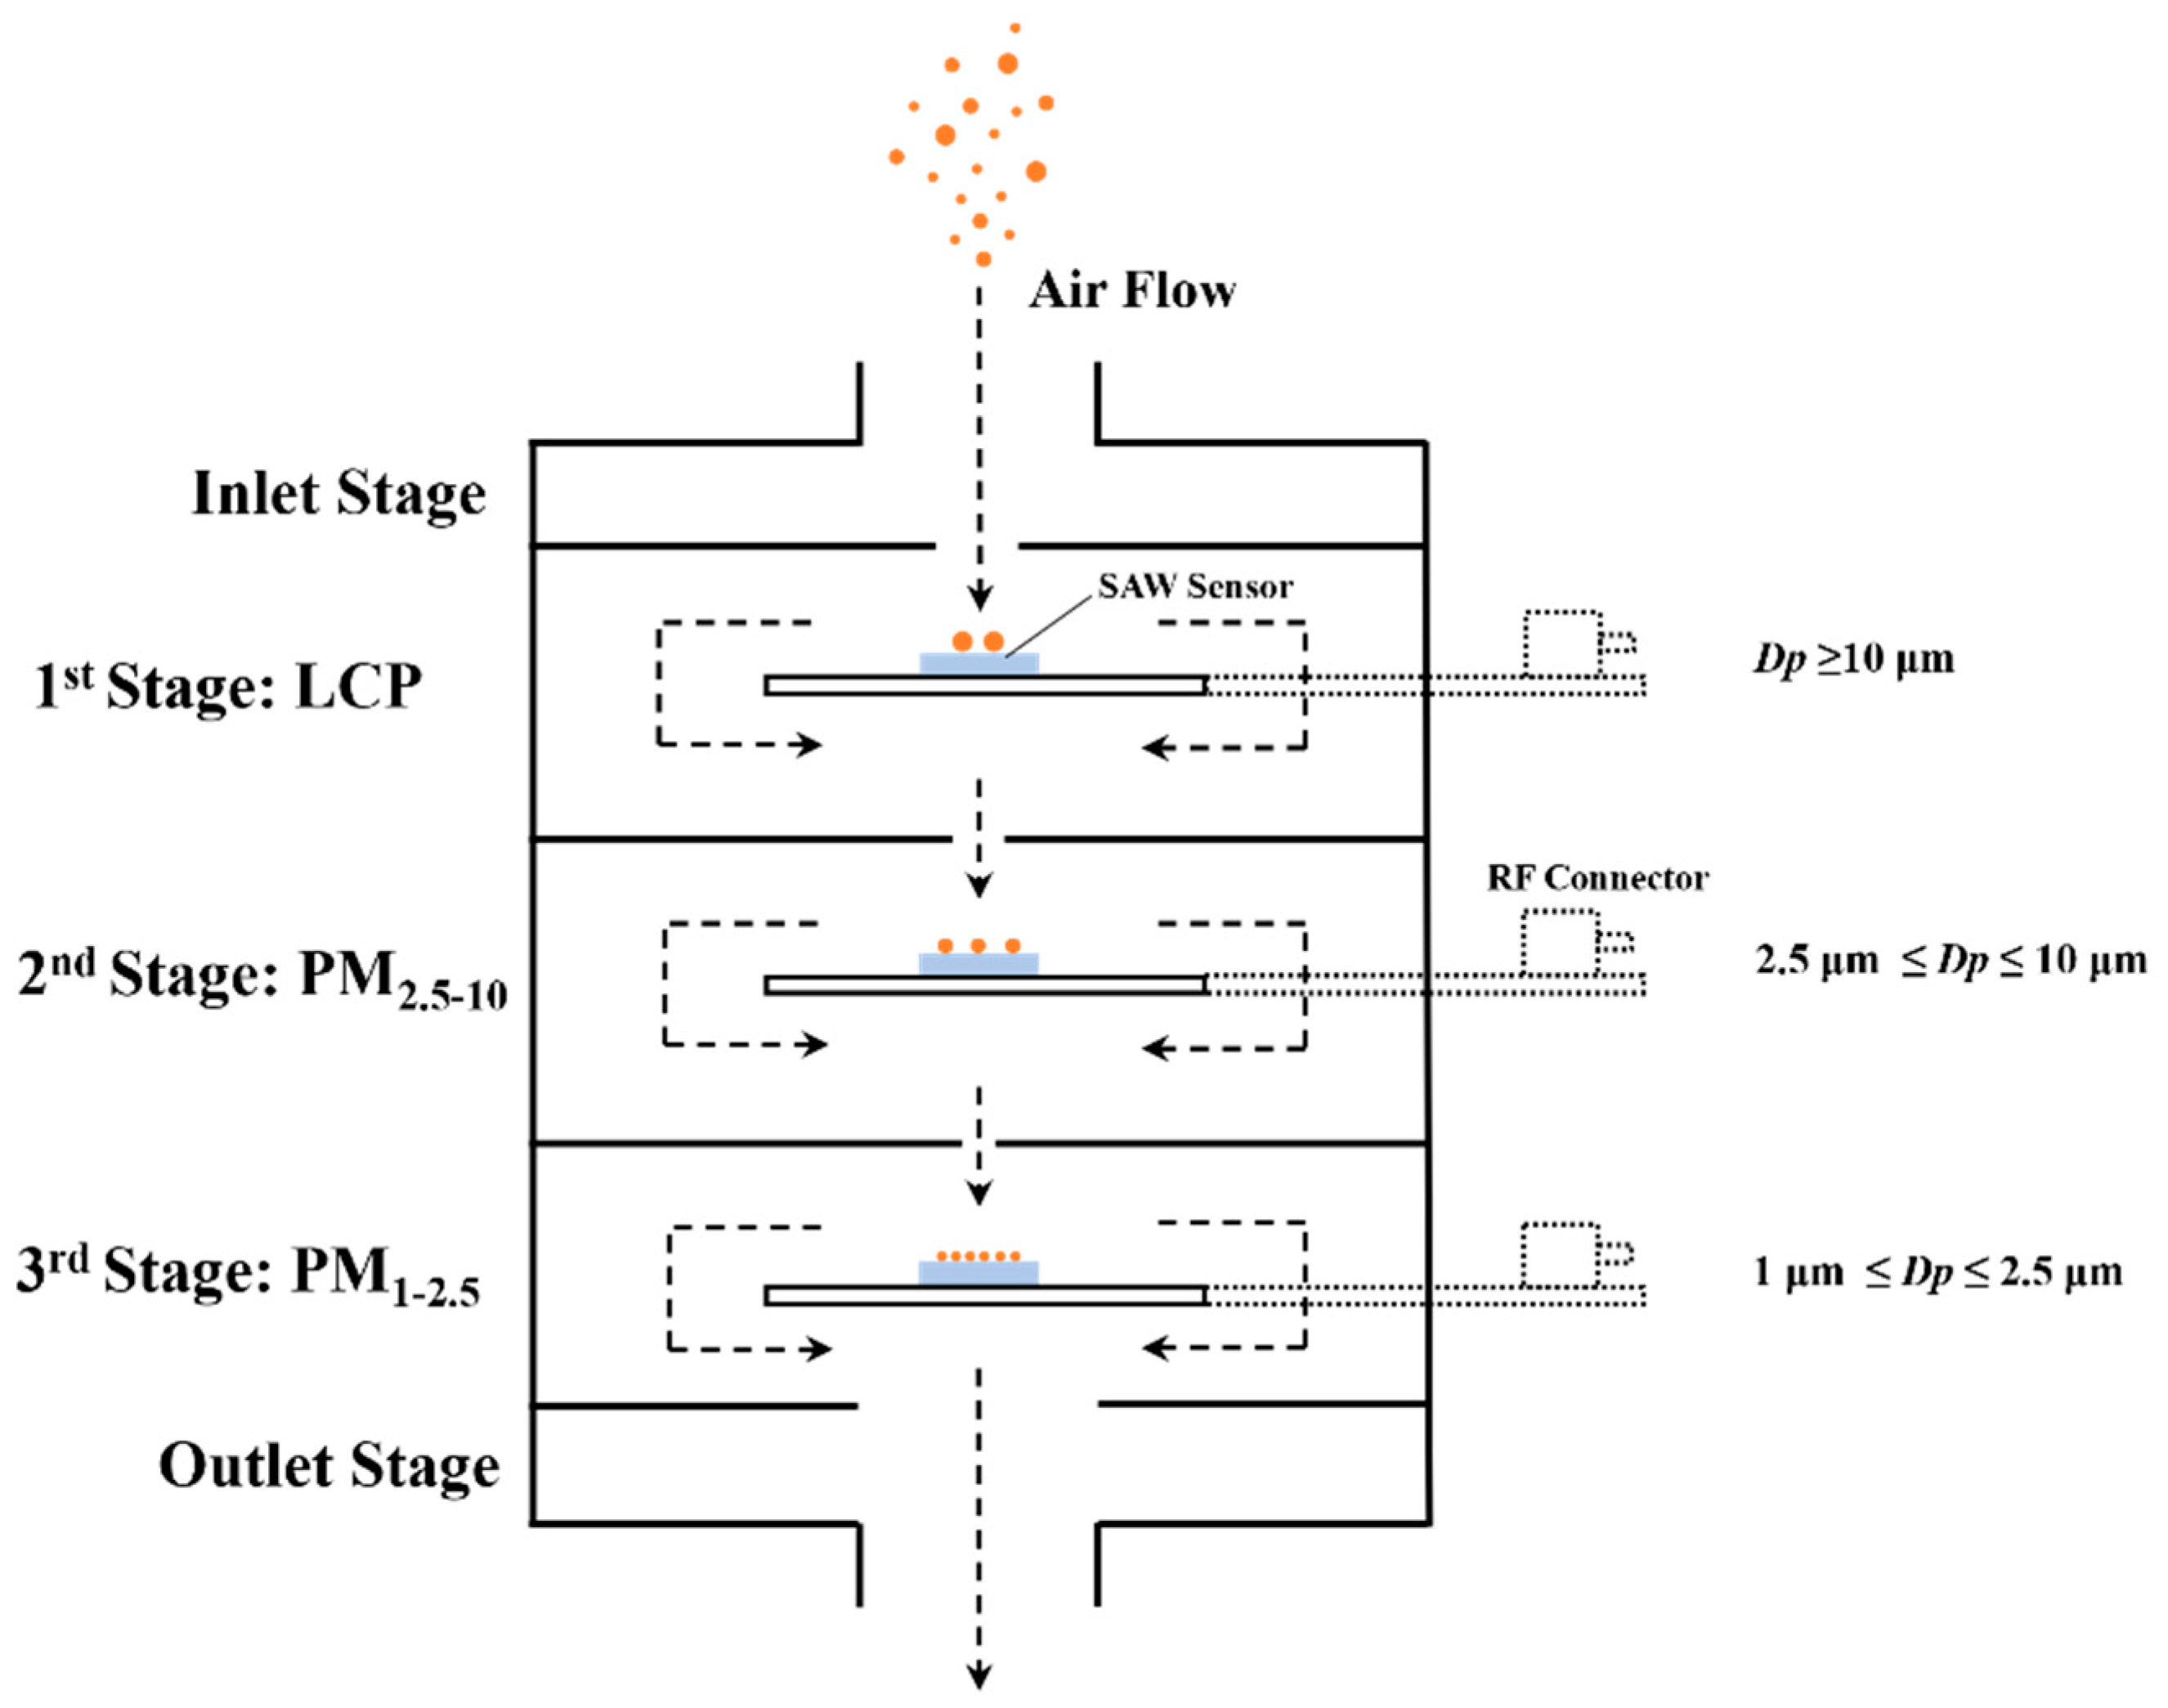
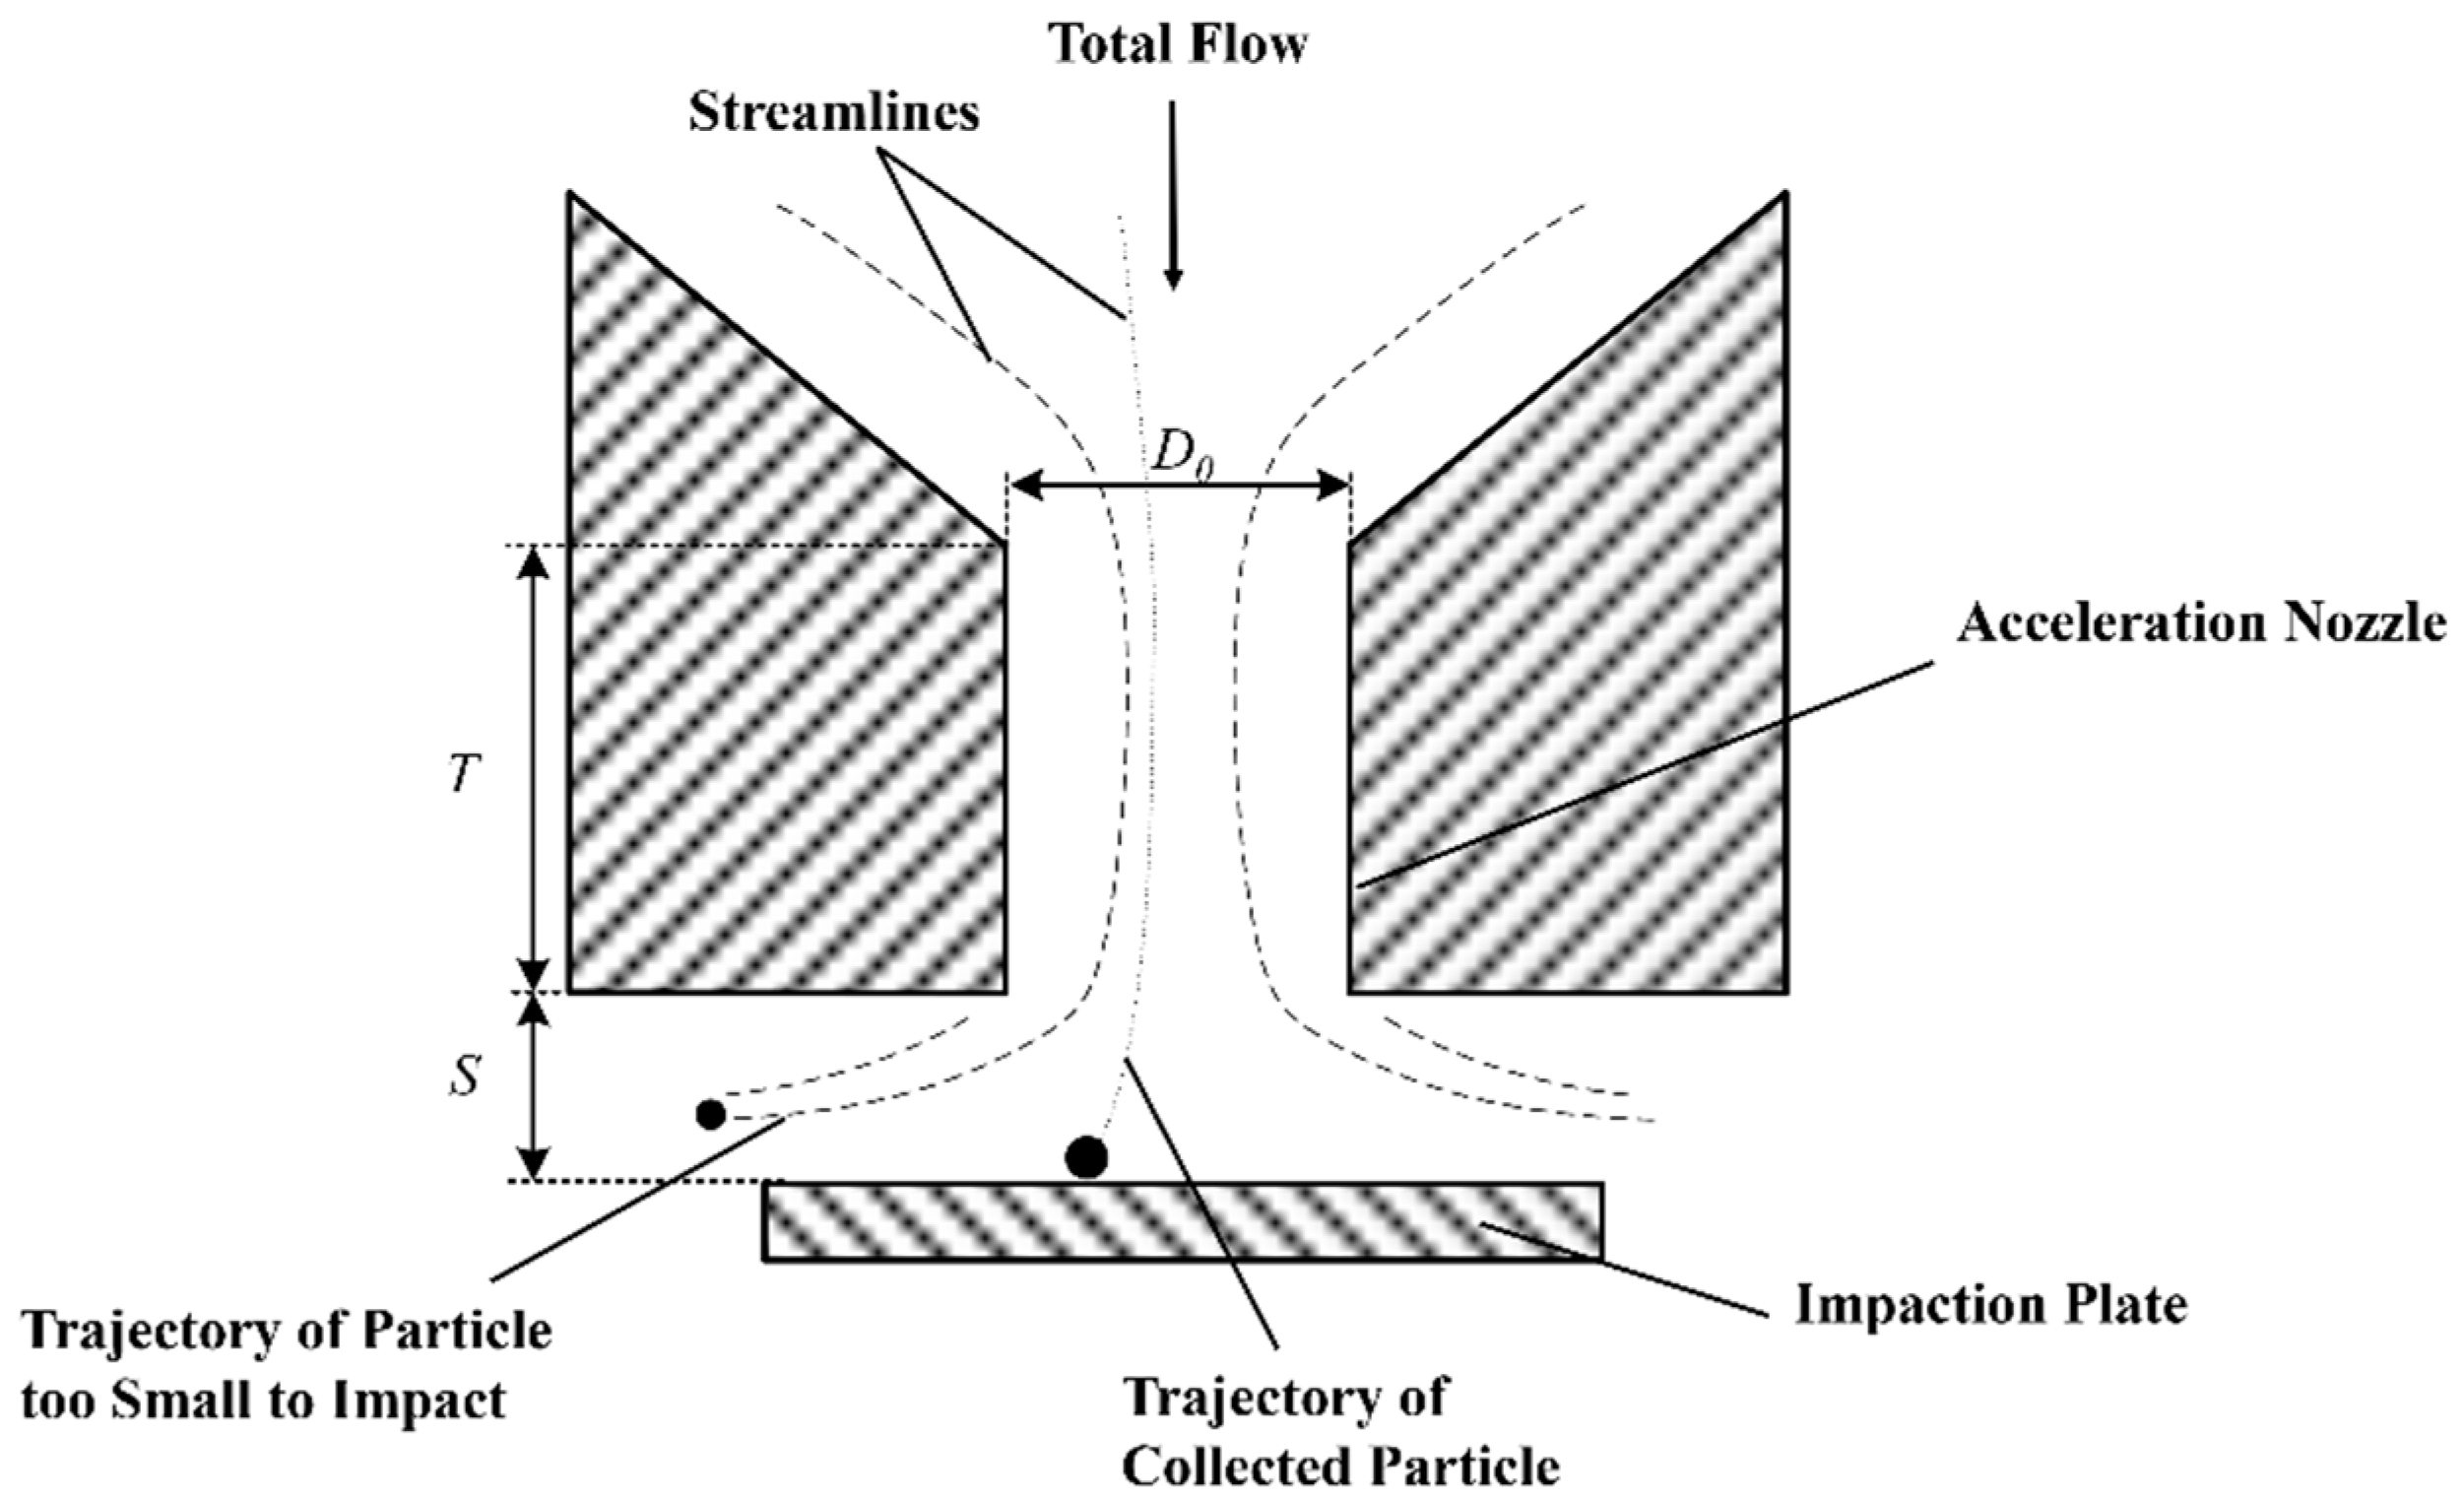
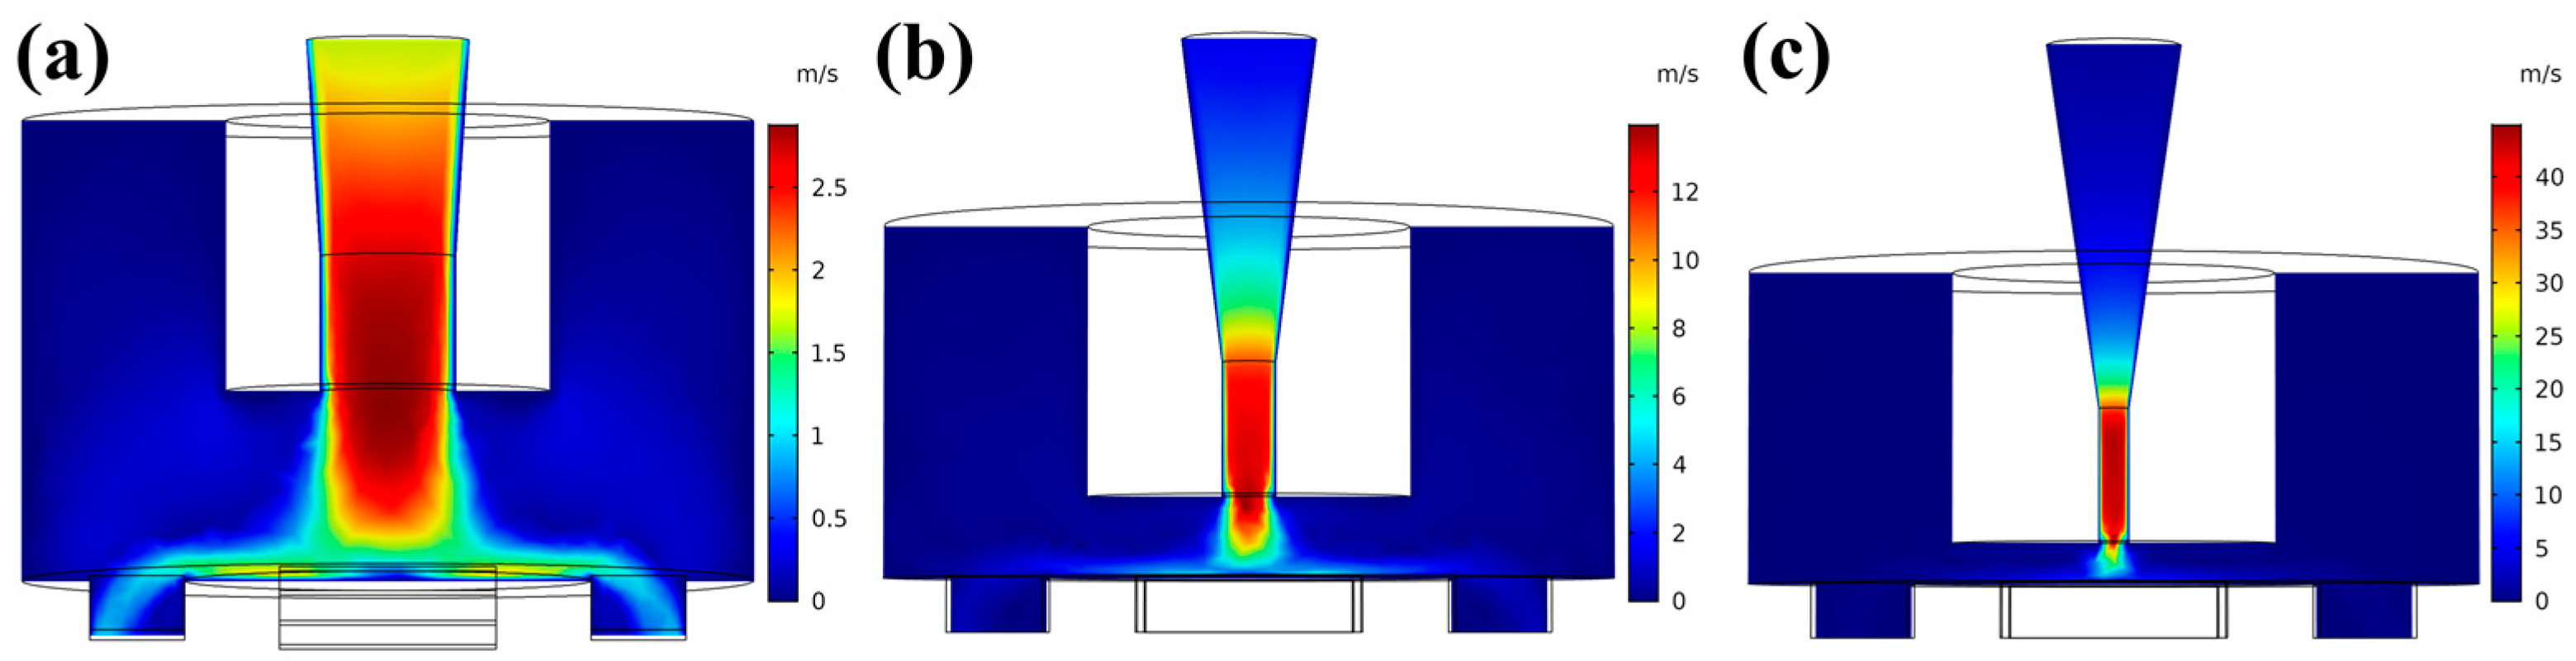
2.3. Impactor Design

Inertial separation, gravity settling, thermal precipitation, and centrifugal settling were the main techniques of particle sampling technology. The most commonly used aerosol sampling is inertial separation, which includes conventional impactors, virtual impactors, and cyclone samplers [23]. Figure 8 shows the schematic diagram of a conventional impactor with a circular nozzle. Particles smaller than the cut-size of the impactor will follow the streamlines, while larger particles will slip across the streamlines and impact upon the impaction plate to be collected. Theoretical studies of conventional impactors have been relatively well developed and have achieved theoretically accurate predictions of the impactor’s cut-off diameter, such as Willeke and Nevalainen [24] and Marple and Willeke [25]; their theories have been compared to the experimental results with good agreement.
The conventional impactor’s cut-off diameter depends on the flow rate Q , Stokes number S t k , Reynolds number R e , nozzle diameter D 0 , and jet-to-plate distance S . Among these parameters, the dimensionless S t k is a critical parameter, its relationship with cut-off point ( D 50 ) is:
D 50 = 9 η D 0 ρ p C c U S t k 50
where U is the average air velocity in the nozzle outlet, η is the air viscosity coefficient, ρ p is the particle density, and C c is the Cunningham slip correction factor. For 10, 2.5, and 1 μm particles, their Cunningham slip correction factors were calculated to be 1.0164, 1.0658, and 1.1644, respectively. Substituting the average flow velocity of the circular nozzle into the Equation (1), a design formula for the diameter of the circular nozzle can be derived:
D 0 = ρ p R e 9 ρ a S t k 50 C c D 50
According to the above theory and considering the size of the optimal response area of the resonator for particle attachment, we designed a three-stage cascade impactor with a total flow of 2 LPM, combined by the LCP stage, PM2.5–10 stage, and PM1–2.5 stage. The design parameters of the impactor were shown in the Table 4 below. We calculated the Reynolds numbers of each stage as 563.8, 1398.4, and 2210, respectively, which meet the requirement of 500 ≤ R e   ≤ 3000 for a steep collection efficiency curve.
We used the computational fluid dynamics module of the commercial software COMSOL MULTIPHYSICS to simulate each stage of the impactor. Figure 9 shows the 3D simulation of flow velocity distribution inside the impactor. The average flow velocity at the acceleration nozzle was increased in successive stages, and the values were 1.68, 10.8, 34.2 m/s, respectively.
In order to evaluate the impactor’s selecting effect on particles, we simulated the particle collection efficiency curve for each stage using the particle tracking module of COMSOL MULTIPHYSICS, as shown in Figure 10. When the particle collection efficiency was 50%, the fitted cut-off diameter for each stage was 1.06, 2.48, and 9.94 μm, with a small deviation from the designed value, indicating that the cascade impactor has a good particle collection efficiency, meeting the sampling requirements.

3. Experiment and Results

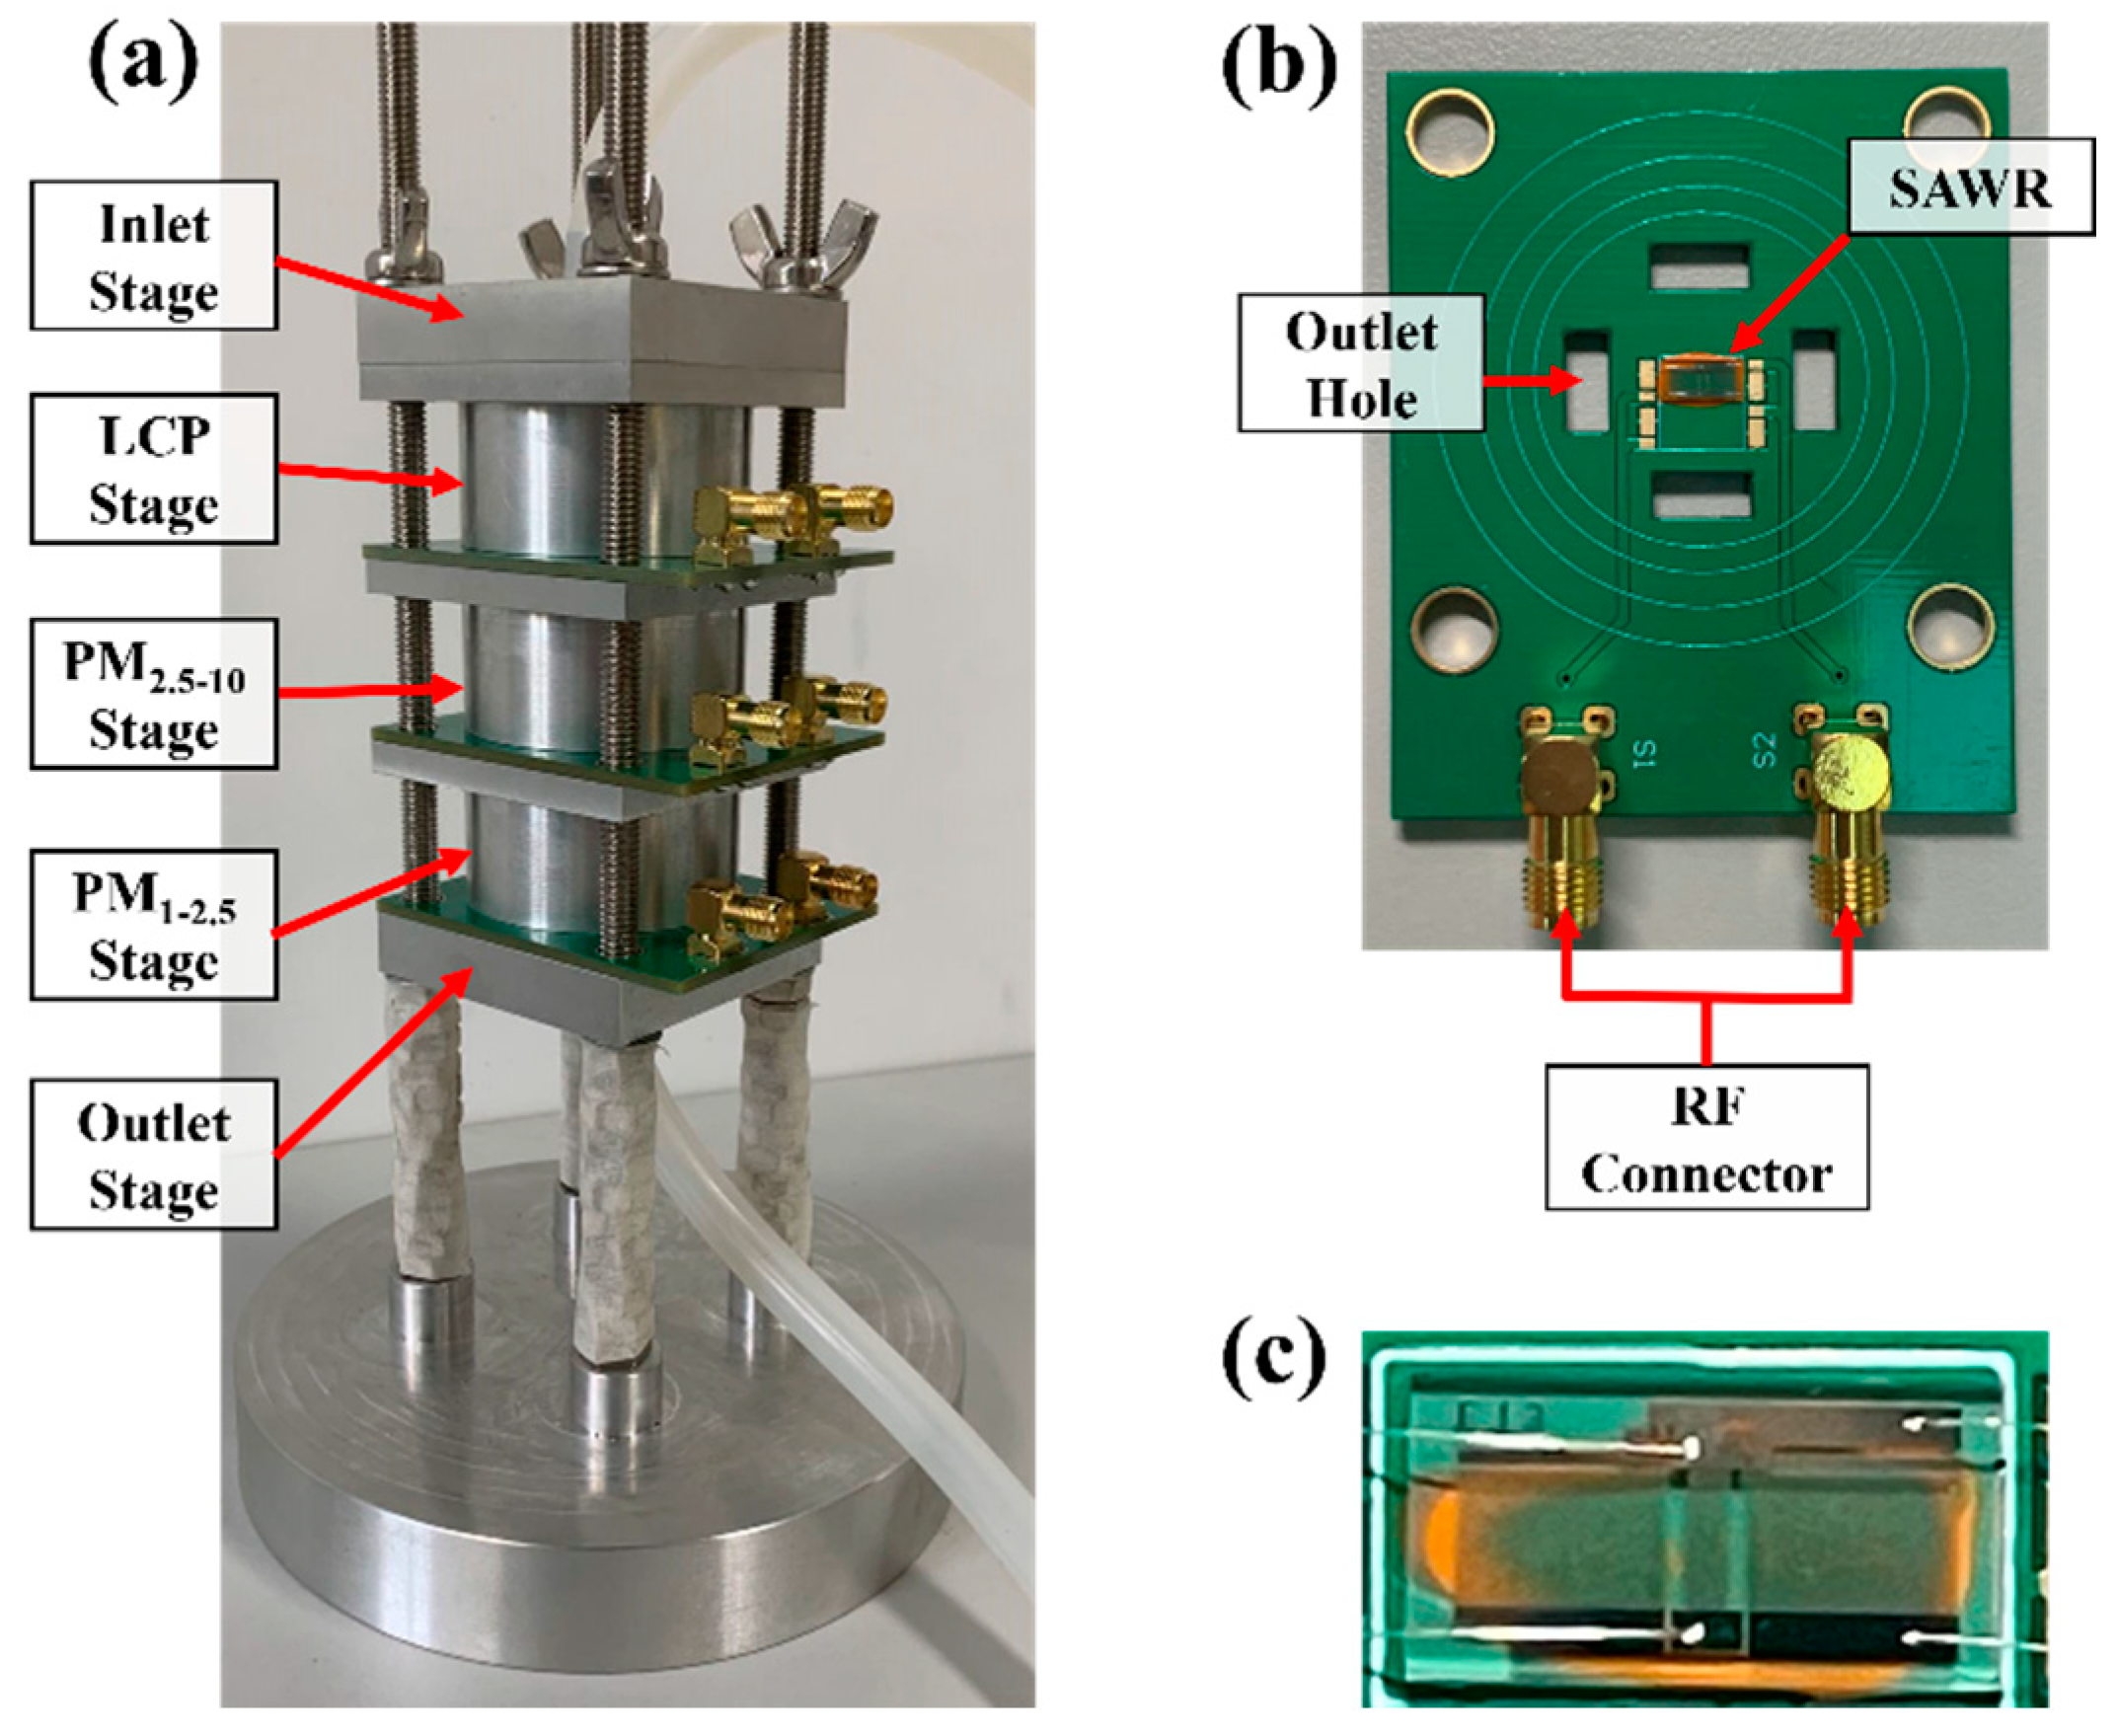
3.1. Sensor Fabrication

The fabrication process of the SAWR is shown in Figure 11. First, we cleaned the ST-X quartz wafer, and the Al (thickness 250 nm) film was coated on the wafer surface using an E-beam evaporator (MODEL #6100, Johnsen Ultravac, ON, Canada). Second, the wafer’s surface was spin-coated with a photoresist (AZ® 5214E, MicroChemicals GmbH, Ulm, Germany), then exposed and developed by a mask plate. The photoresist was cured to obtain the 311 MHz SAWR pattern, which protected the Al electrodes it covered. Third, the Al film was removed from the non-patterned area by wet etching, at which point only the pattern of electrodes was covered with cured photoresist. Finally, we removed the cured photoresist by soaking in the photoresist stripper, which gave us the metallization pattern of the designed SAWR. After the above process, we placed the wafer under the RF probe station for observation confirming, performance testing, dicing, and wire-bonding.
According to the optimal response area of the SAWR, the designed result of the impactor, and the feasibility of machining, we used the commercial software SOLIDWORKS to draw 3D models and then manufactured each stage of the cascade impactor. A specially designed printed circuit board was used as an impaction plate in each stage to facilitate the signal acquisition of the SAW sensor. Upon cascade assembly, the 311 MHz SAWR was placed in the center of the impaction circuit board, and the impactor nozzle was directly facing the center of the chip to obtain the largest matching area. The assembled sensor is shown in Figure 12.

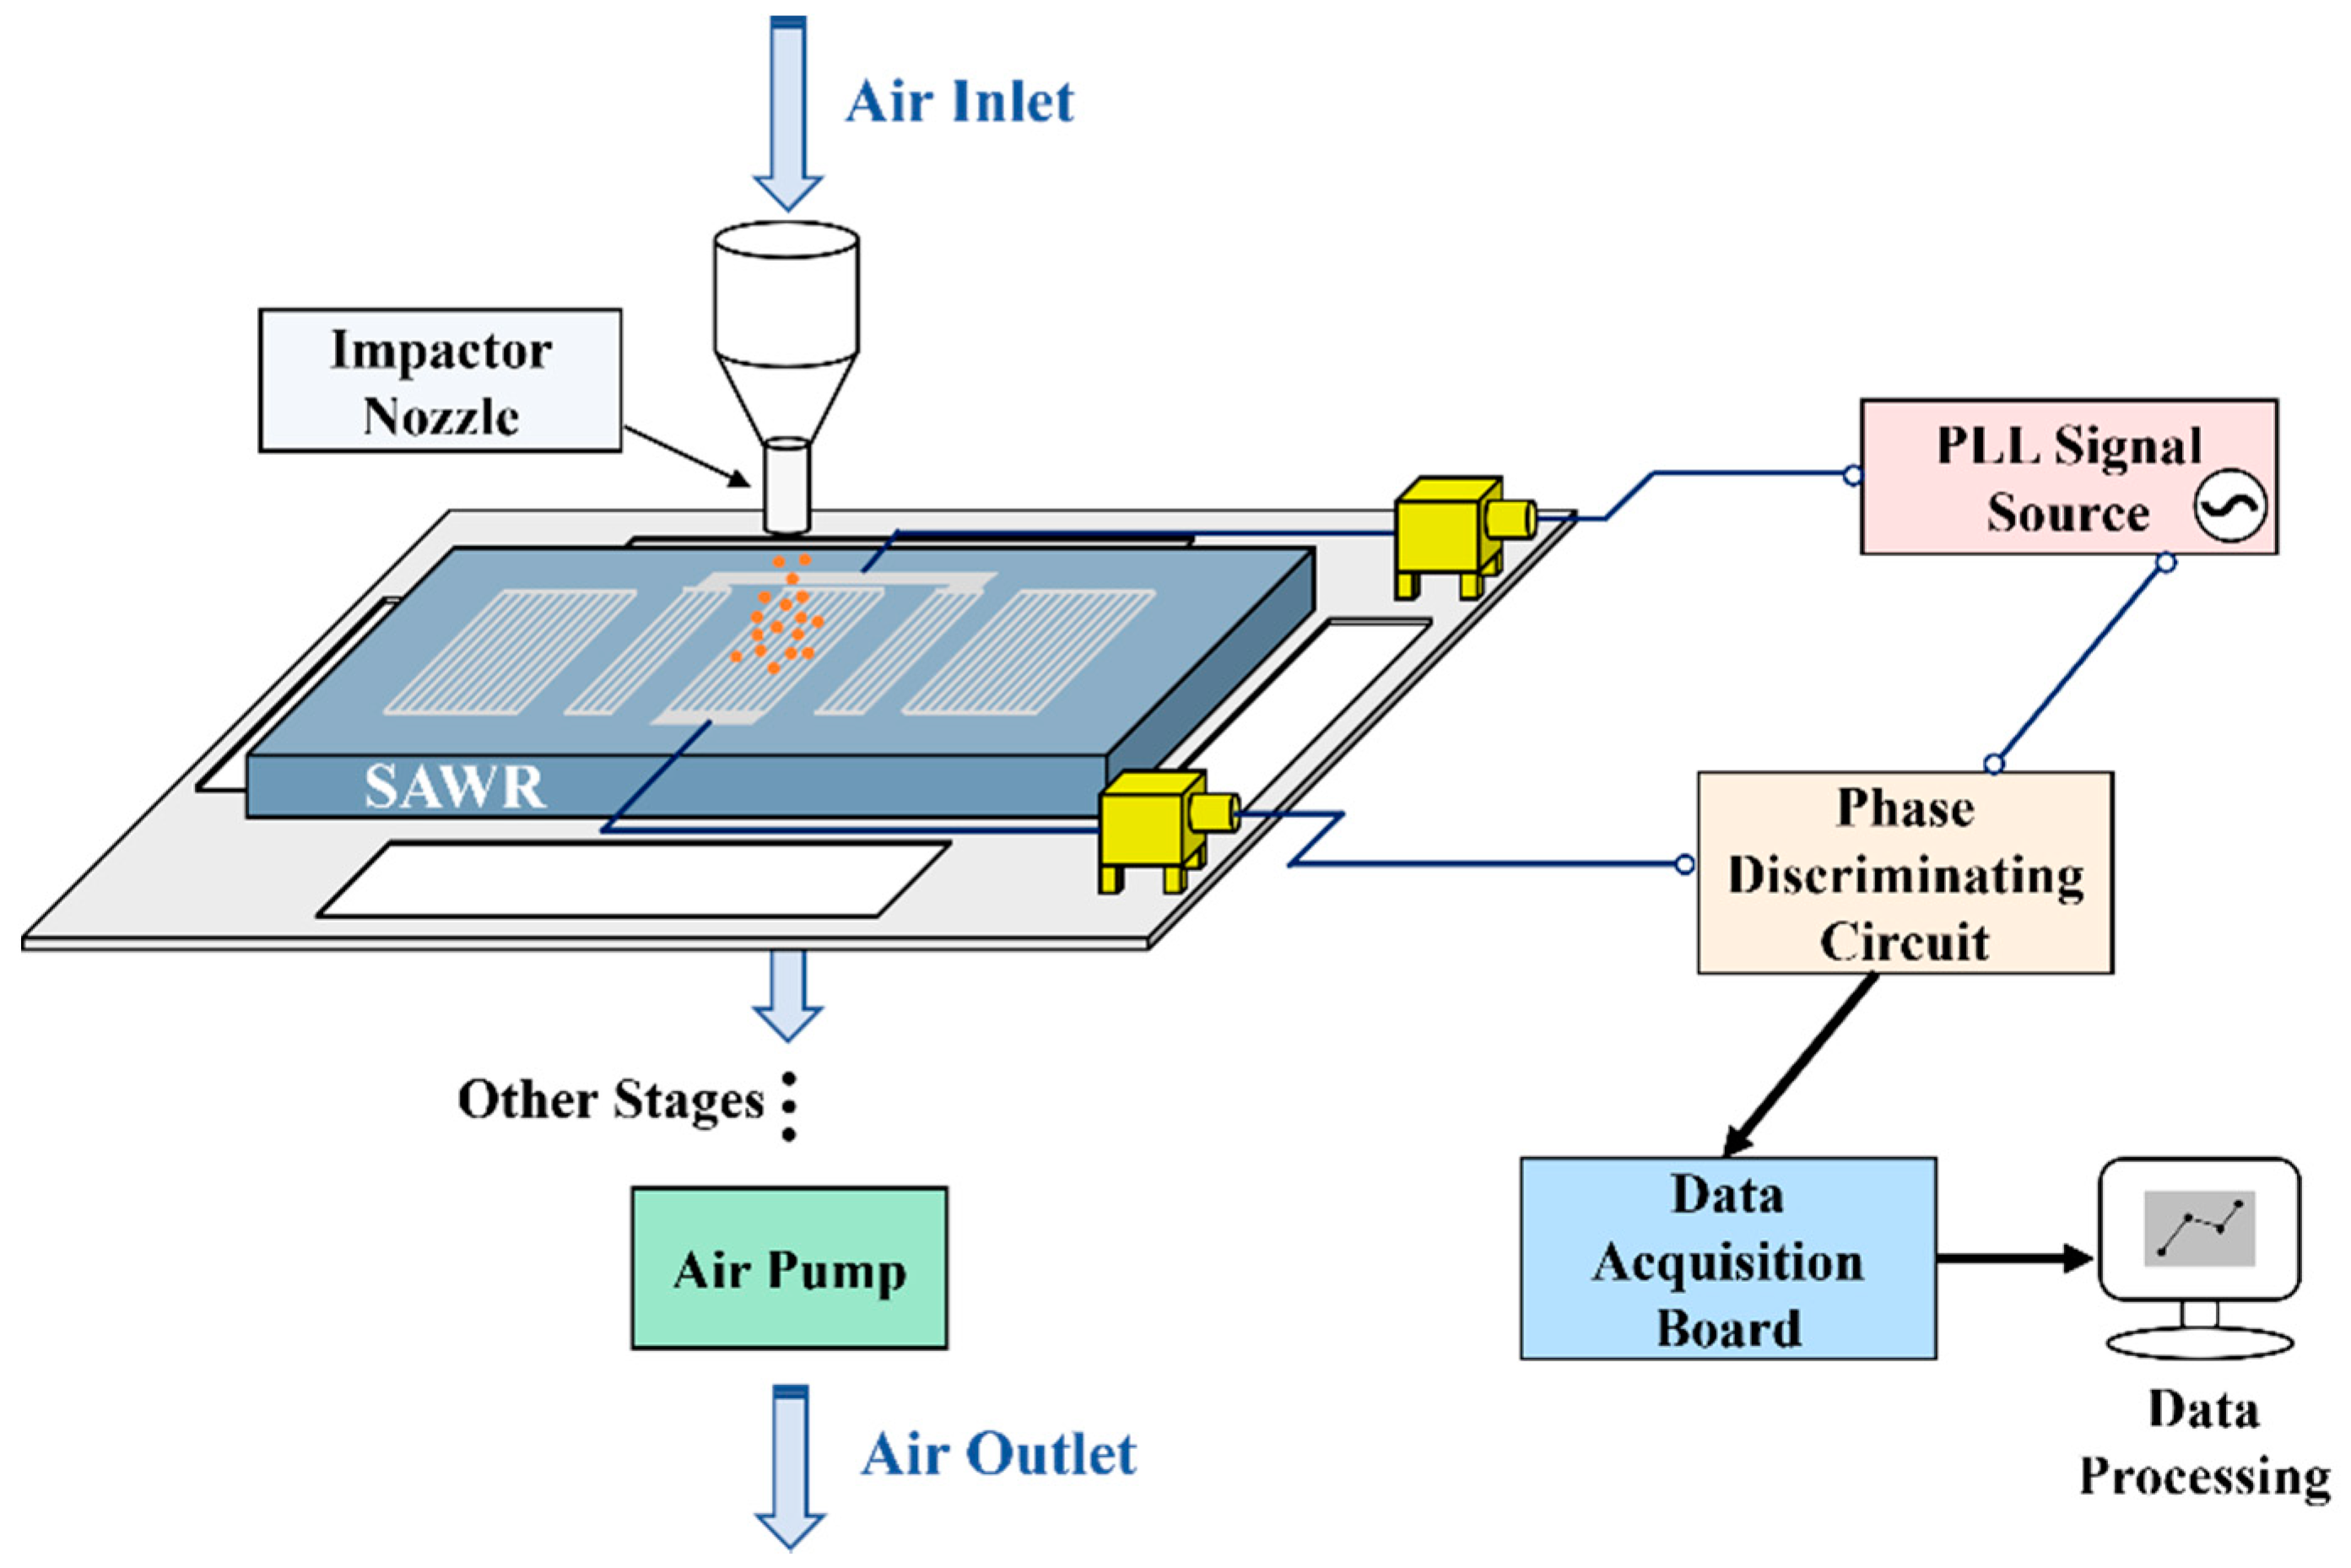
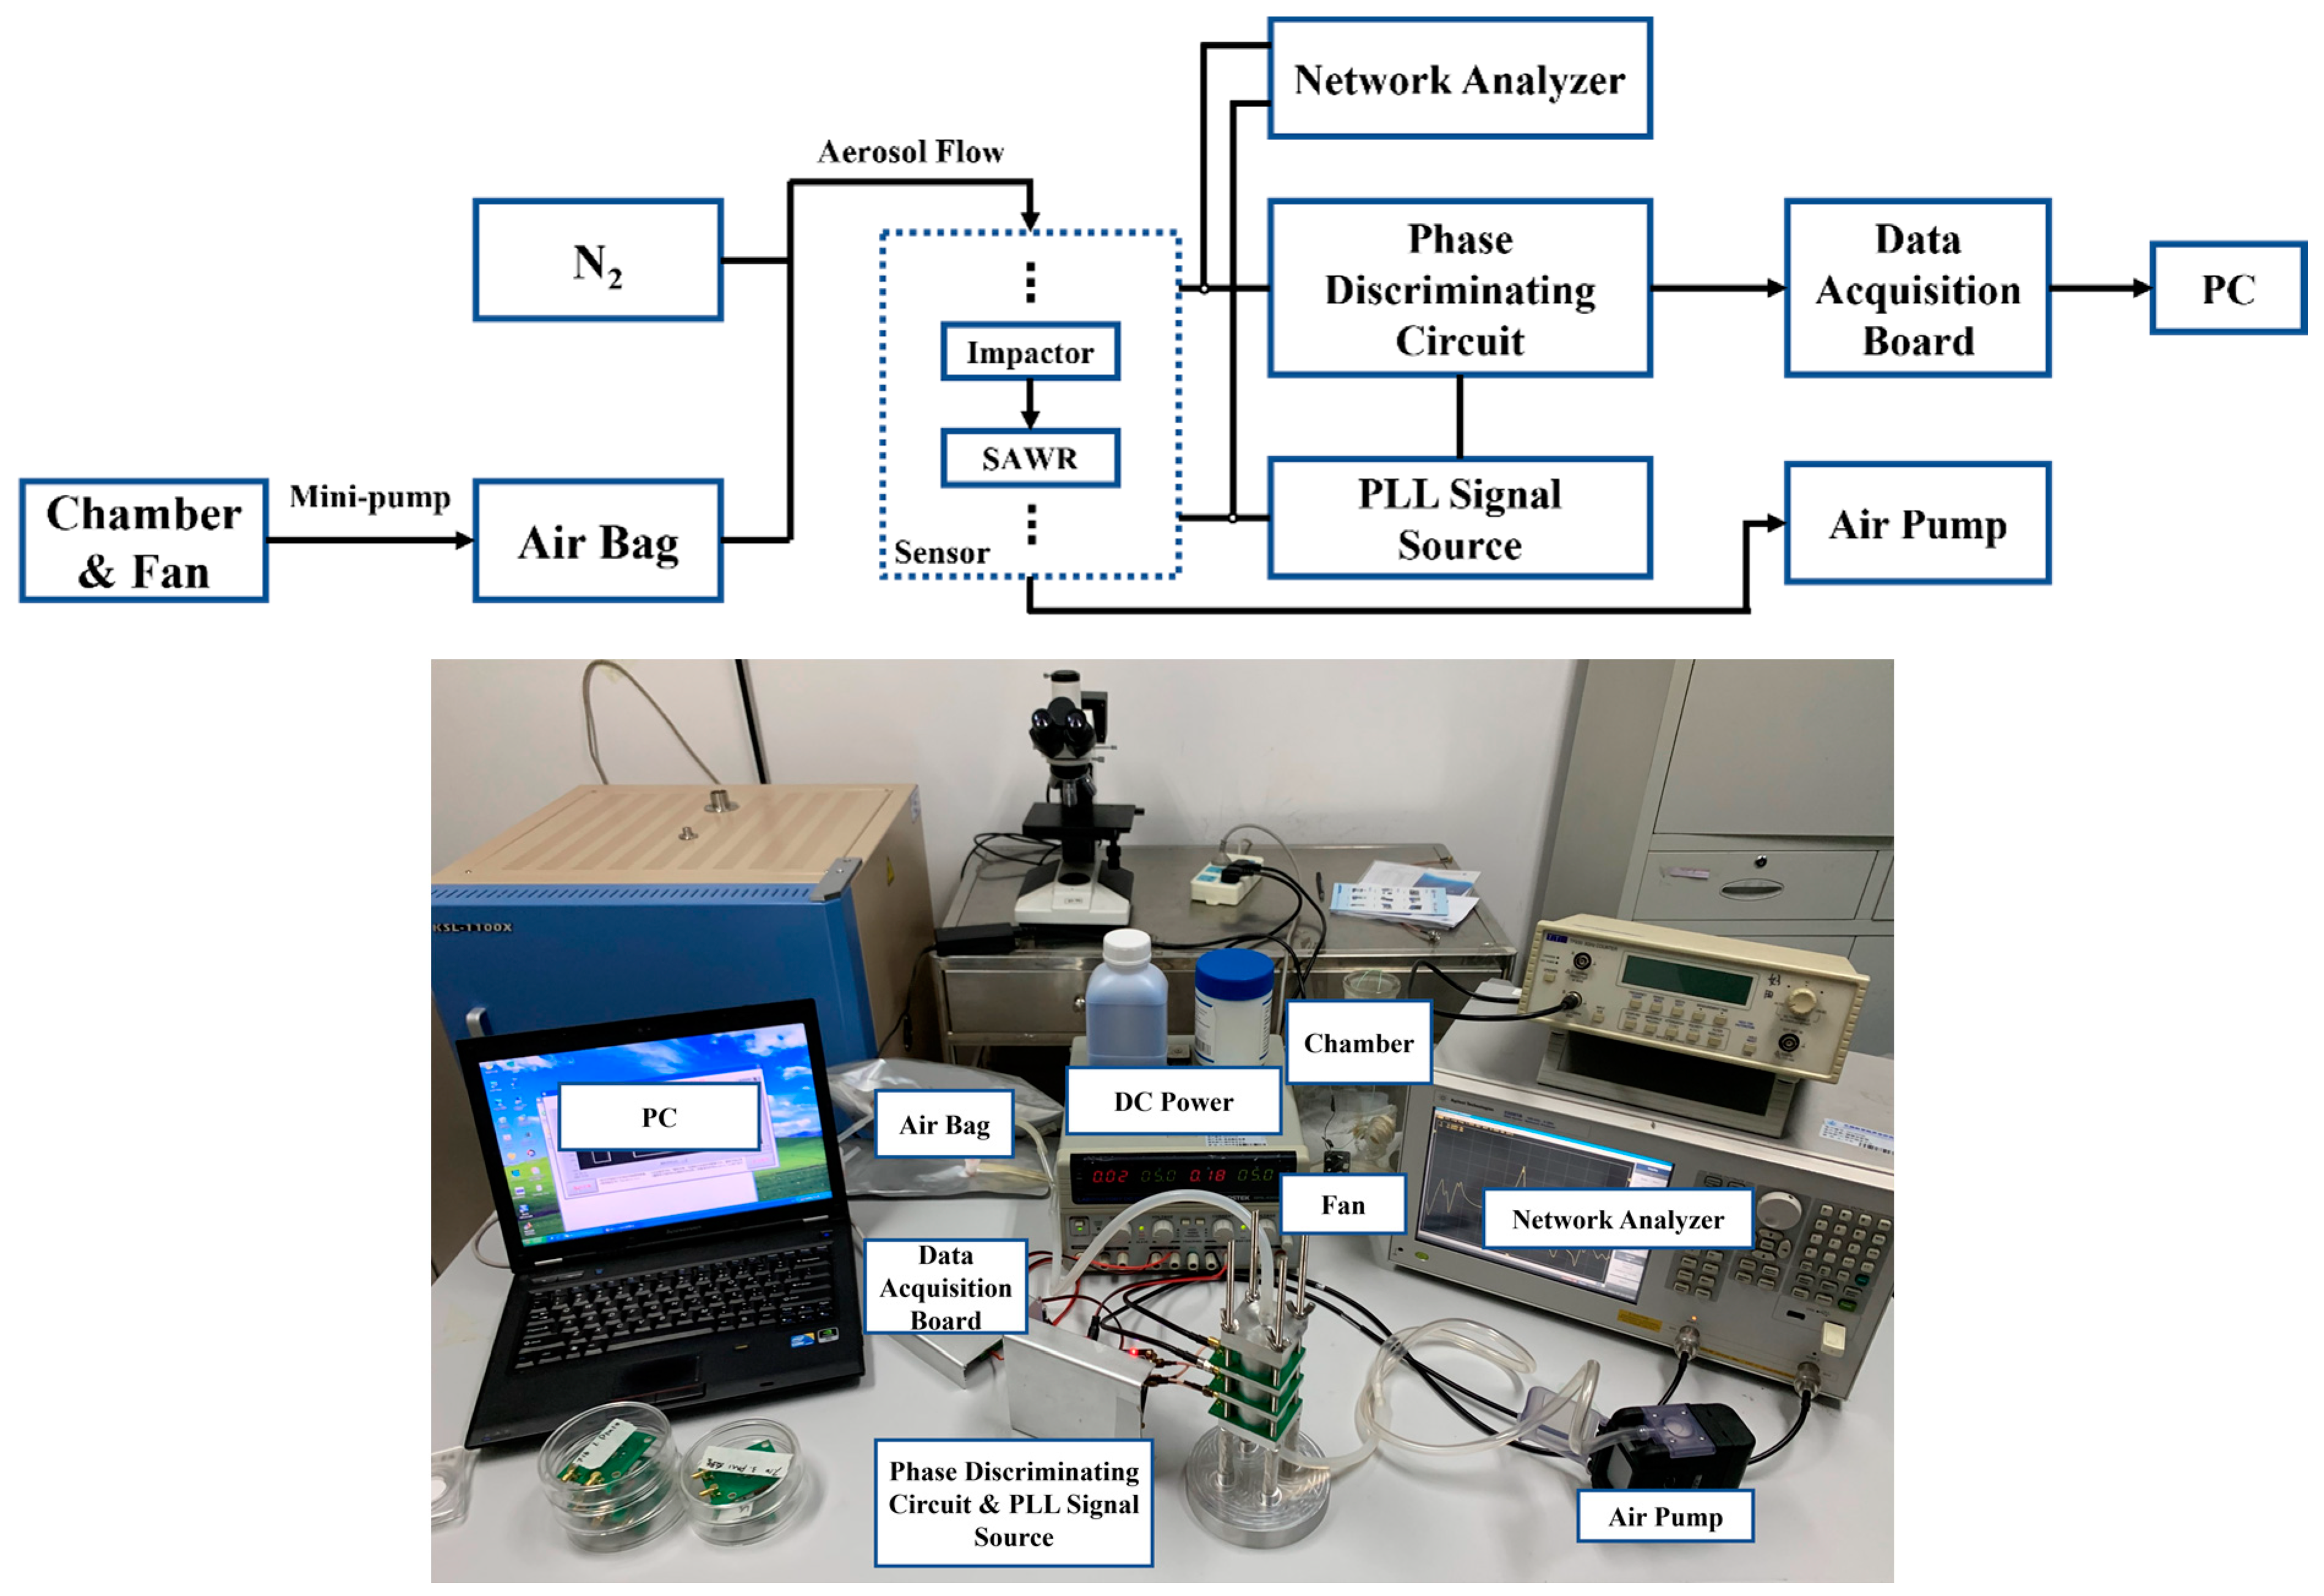
3.2. Experimental Platform

The experimental setup depicted in Figure 13 was used to evaluate the proposed sensor. Particles were generated by burning the sample in the chamber while using a fan to mix the exhausted gas with air thoroughly, then pumped into the airbags. For the sample, we chose leaf fragments whose combustion could produce particles of various diameter from 0.5 μm to larger than 10 μm, with a median of about 1 μm, which met our needs [26]. We set the air pump (AirChek TOUCH, SKC Inc., PA, USA) to pump particle-containing gas at a constant flow rate of 2 LPM. Before each use, we pumped in nitrogen to clean the airflow pipes to prevent interference of the particles in the remaining airflow. The dual ports of the surface acoustic wave resonator were connected to RF connectors on the impaction plate. The phase response change caused by the particle attached to the sensitive surface of the SAWR was discriminated by the phase discriminating circuit. The result was showed in voltage (mV) on the PC in real-time. A network analyzer (E5061B, Agilent Technologies, CA, USA) was used to observe the chip’s amplitude-frequency and phase-frequency response curve.
The SAWRs placed on impaction plates will have different phase shifts due to the different particles loaded on the surface; therefore, the voltage signal change rate (mV/s) represents the particulate mass change per second. We linear fitted the voltage signal when processing response data, and its slope was the change rate of the voltage.

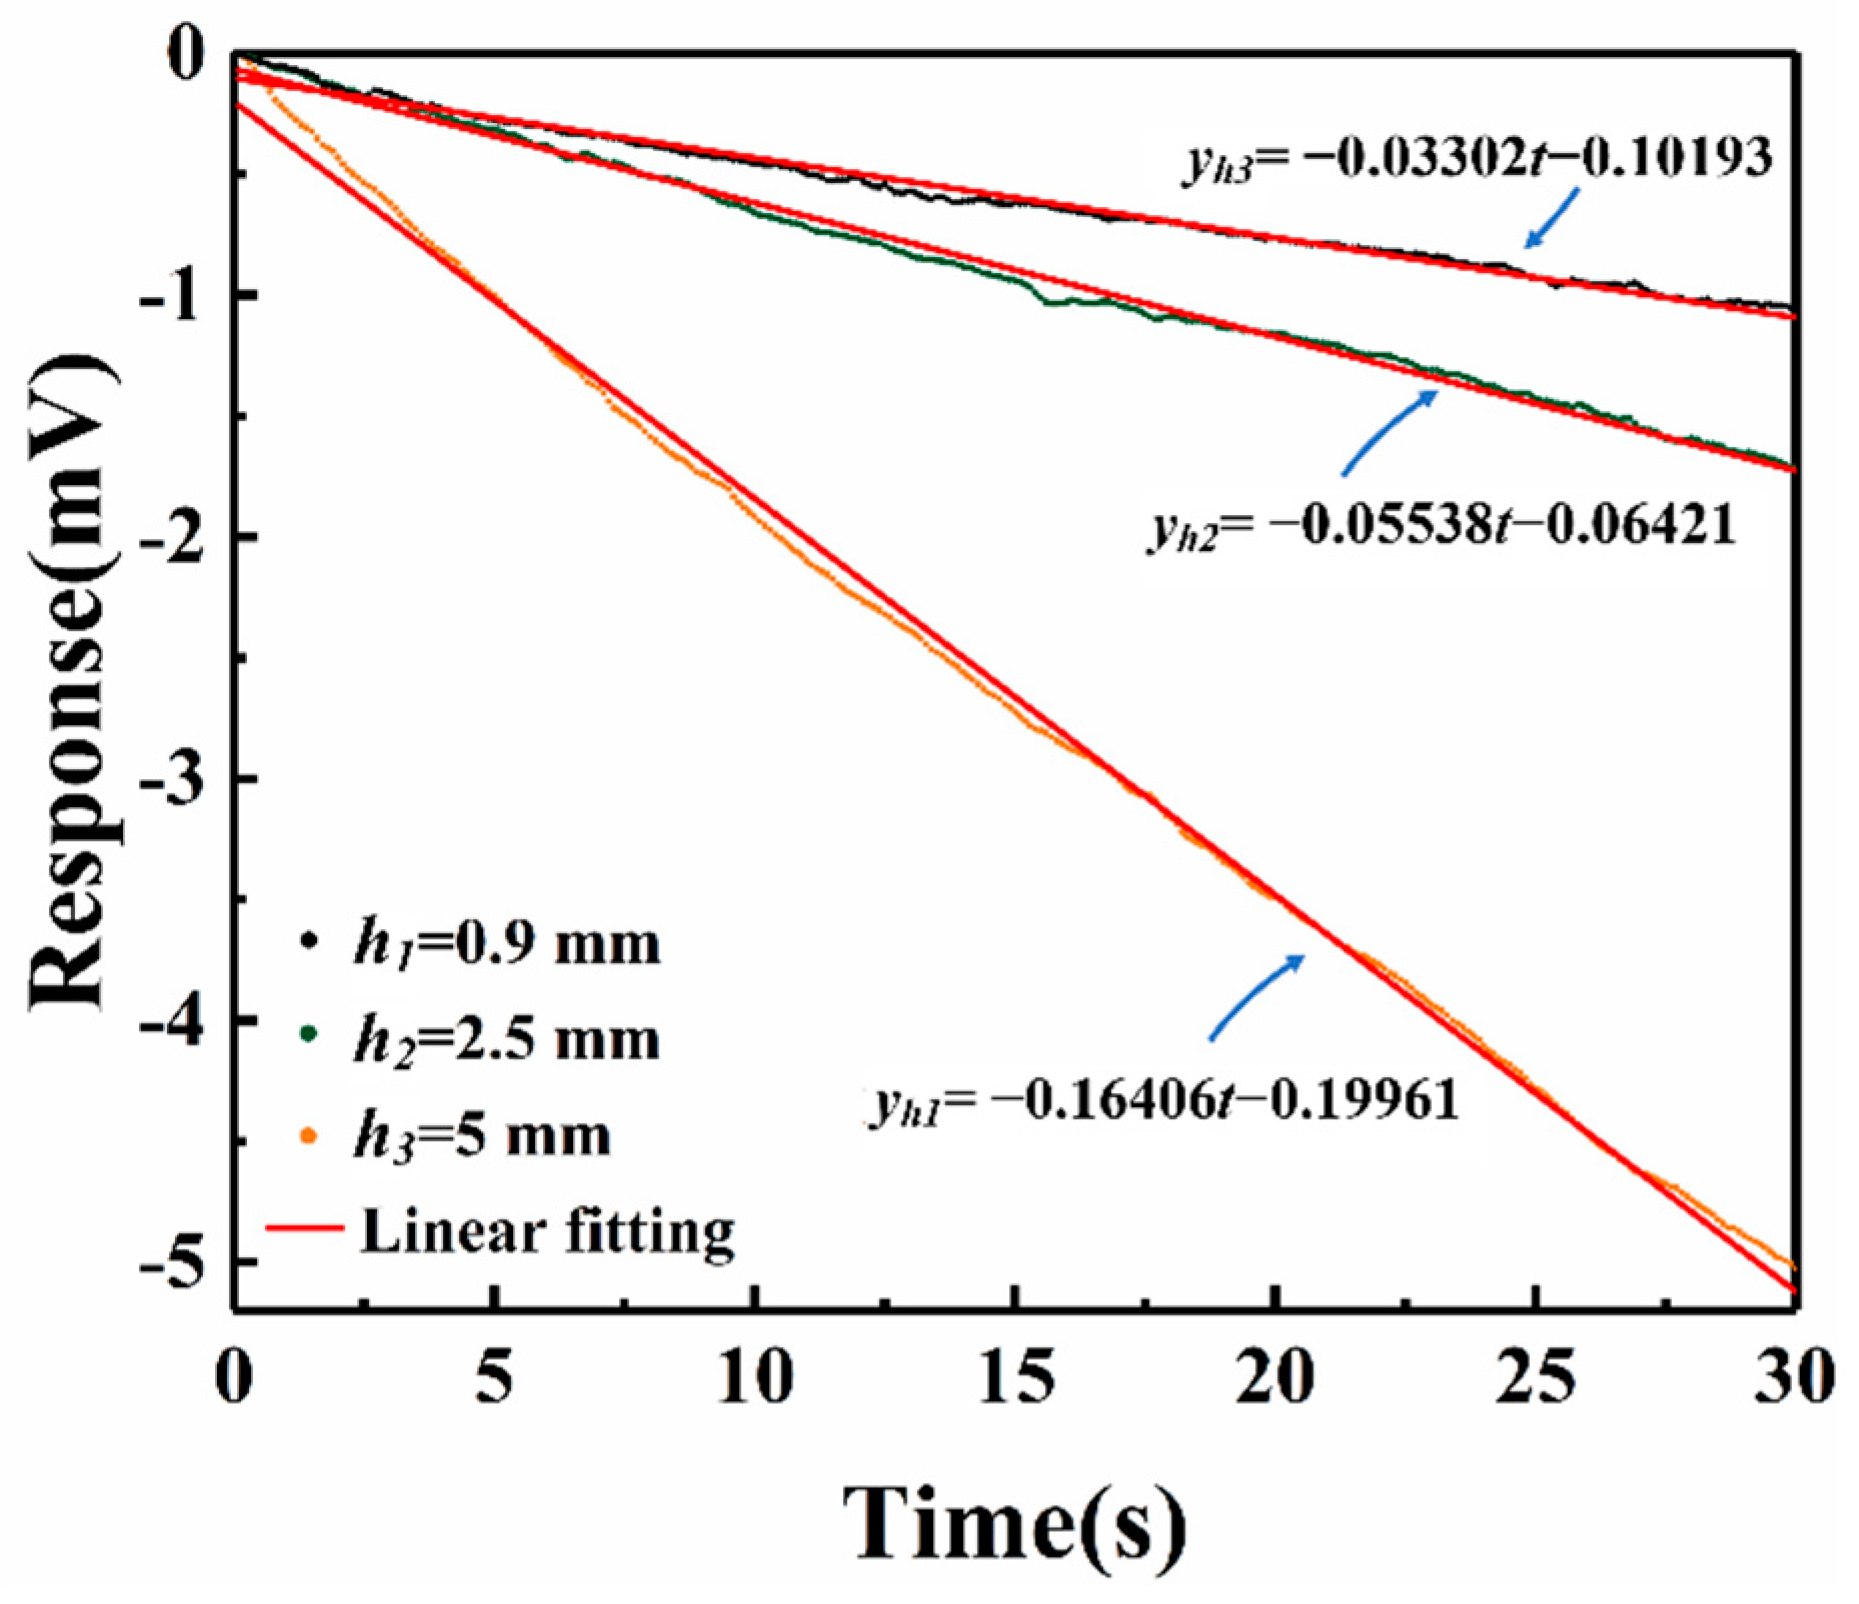
3.3. Respond Experiment on Different Distances from the Nozzle to Chip Surface

First, we used PM2.5–10 single stage to verify the influence of the distance from the nozzle to the surface on the chip’s response. We adjusted the distance h, as h1 = 0.9 mm, h2 = 2.5 mm, and h3 = 5 mm. After passing the particle-containing gas of the same amount of burned leaf fragments, linear responses with different slopes were generated, as shown in Figure 14. It can be seen from the figure that when the distance was h1, the slope of the response linear regression line was the largest, followed by the distance h2, and the slope was the smallest when the distance was h3. Under the combined effect of the SAWR’s surface sensitivity distribution characteristics to mass loading effect on the one hand and more particles concentrated in the center of the chip with lower impact height on the other, the resonator produced a greater response, which was consistent with the simulation result.

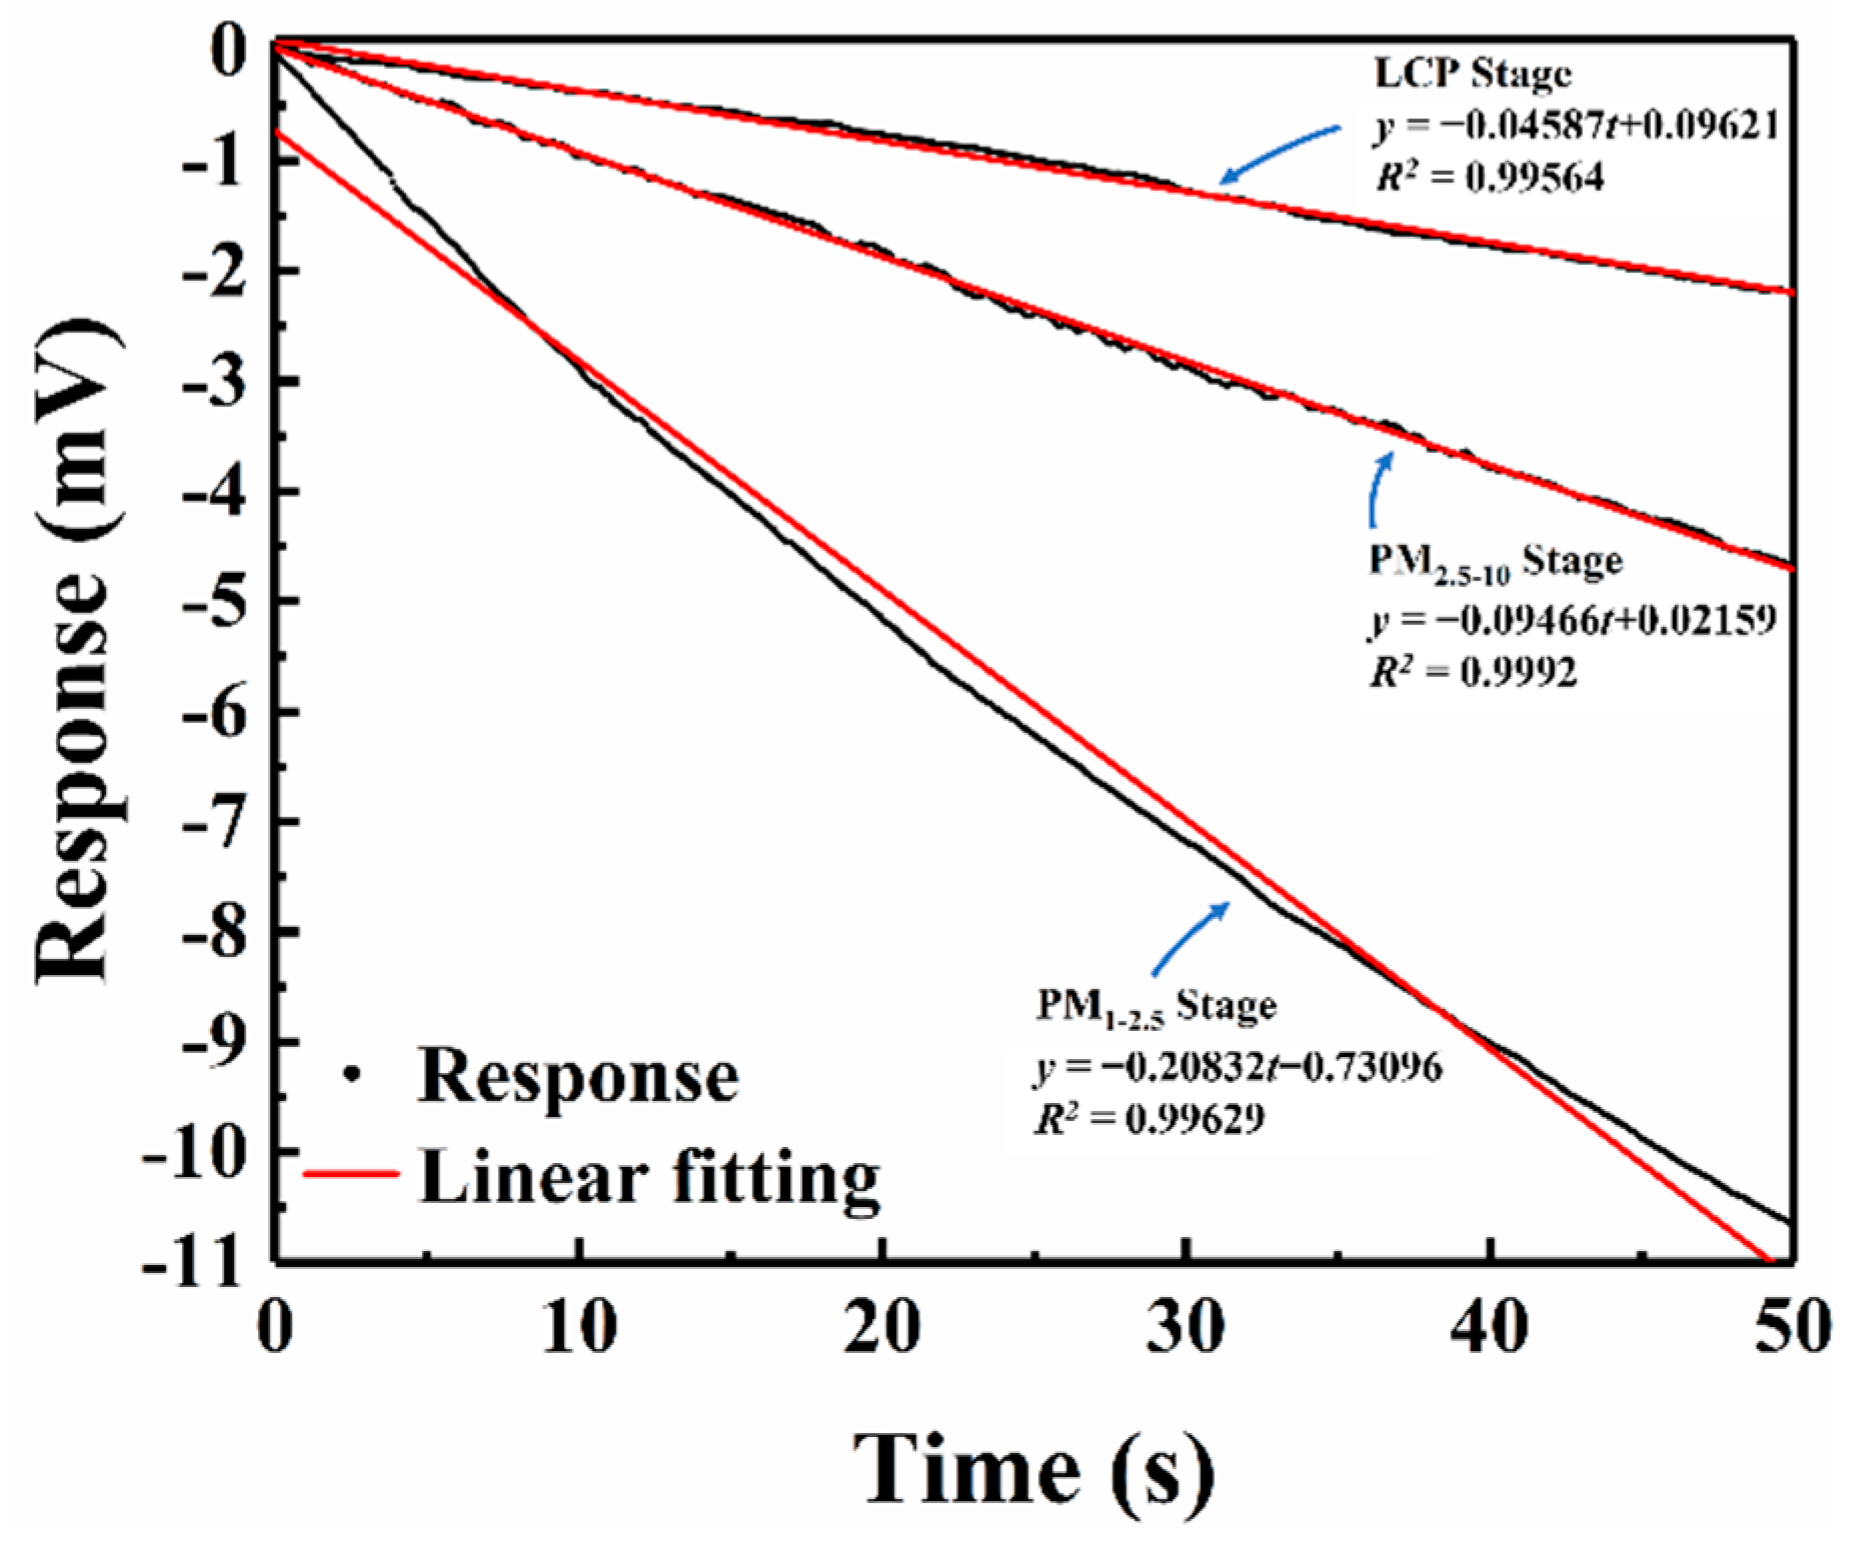
3.4. System Experiment and Repeatability Test

The test results of passing the sampled gas into the monitor are shown in Figure 15. The surface acoustic wave sensors placed on the impaction plates of different stages all produced phase shifts with different slopes. The slope of the linear fitting line of the response increased in successive stages from top to bottom: The LCP stage has a minor slope compared to other stages, and the linear fitting result shows that the rate of change was −0.04587 mV/s, while the PM2.5–10 stage had a rate of −0.09466 mV/s and the PM1–2.5 stage had a larger rate of −0.20832 mV/s. The above results indicated that the collected PM2.5 had a greater mass than PM10 and LCP, reflecting that PM2.5 had the highest number of particles in exhausted gas from burning leaves, which was consistent with the particle diameter and quantity distribution of leaves’ burning gas [26].
To test its repeatability, we set the monitor in a room maintaining air circulation. Taking the third stage as an example, Figure 16 shows the response of particles in the range of 1–2.5 μm in indoor conditions and its linear fitting results. It can be seen from the resulting graph that for indoor air sampling in the same condition, the trend of test results is basically the same, with good repeatability.

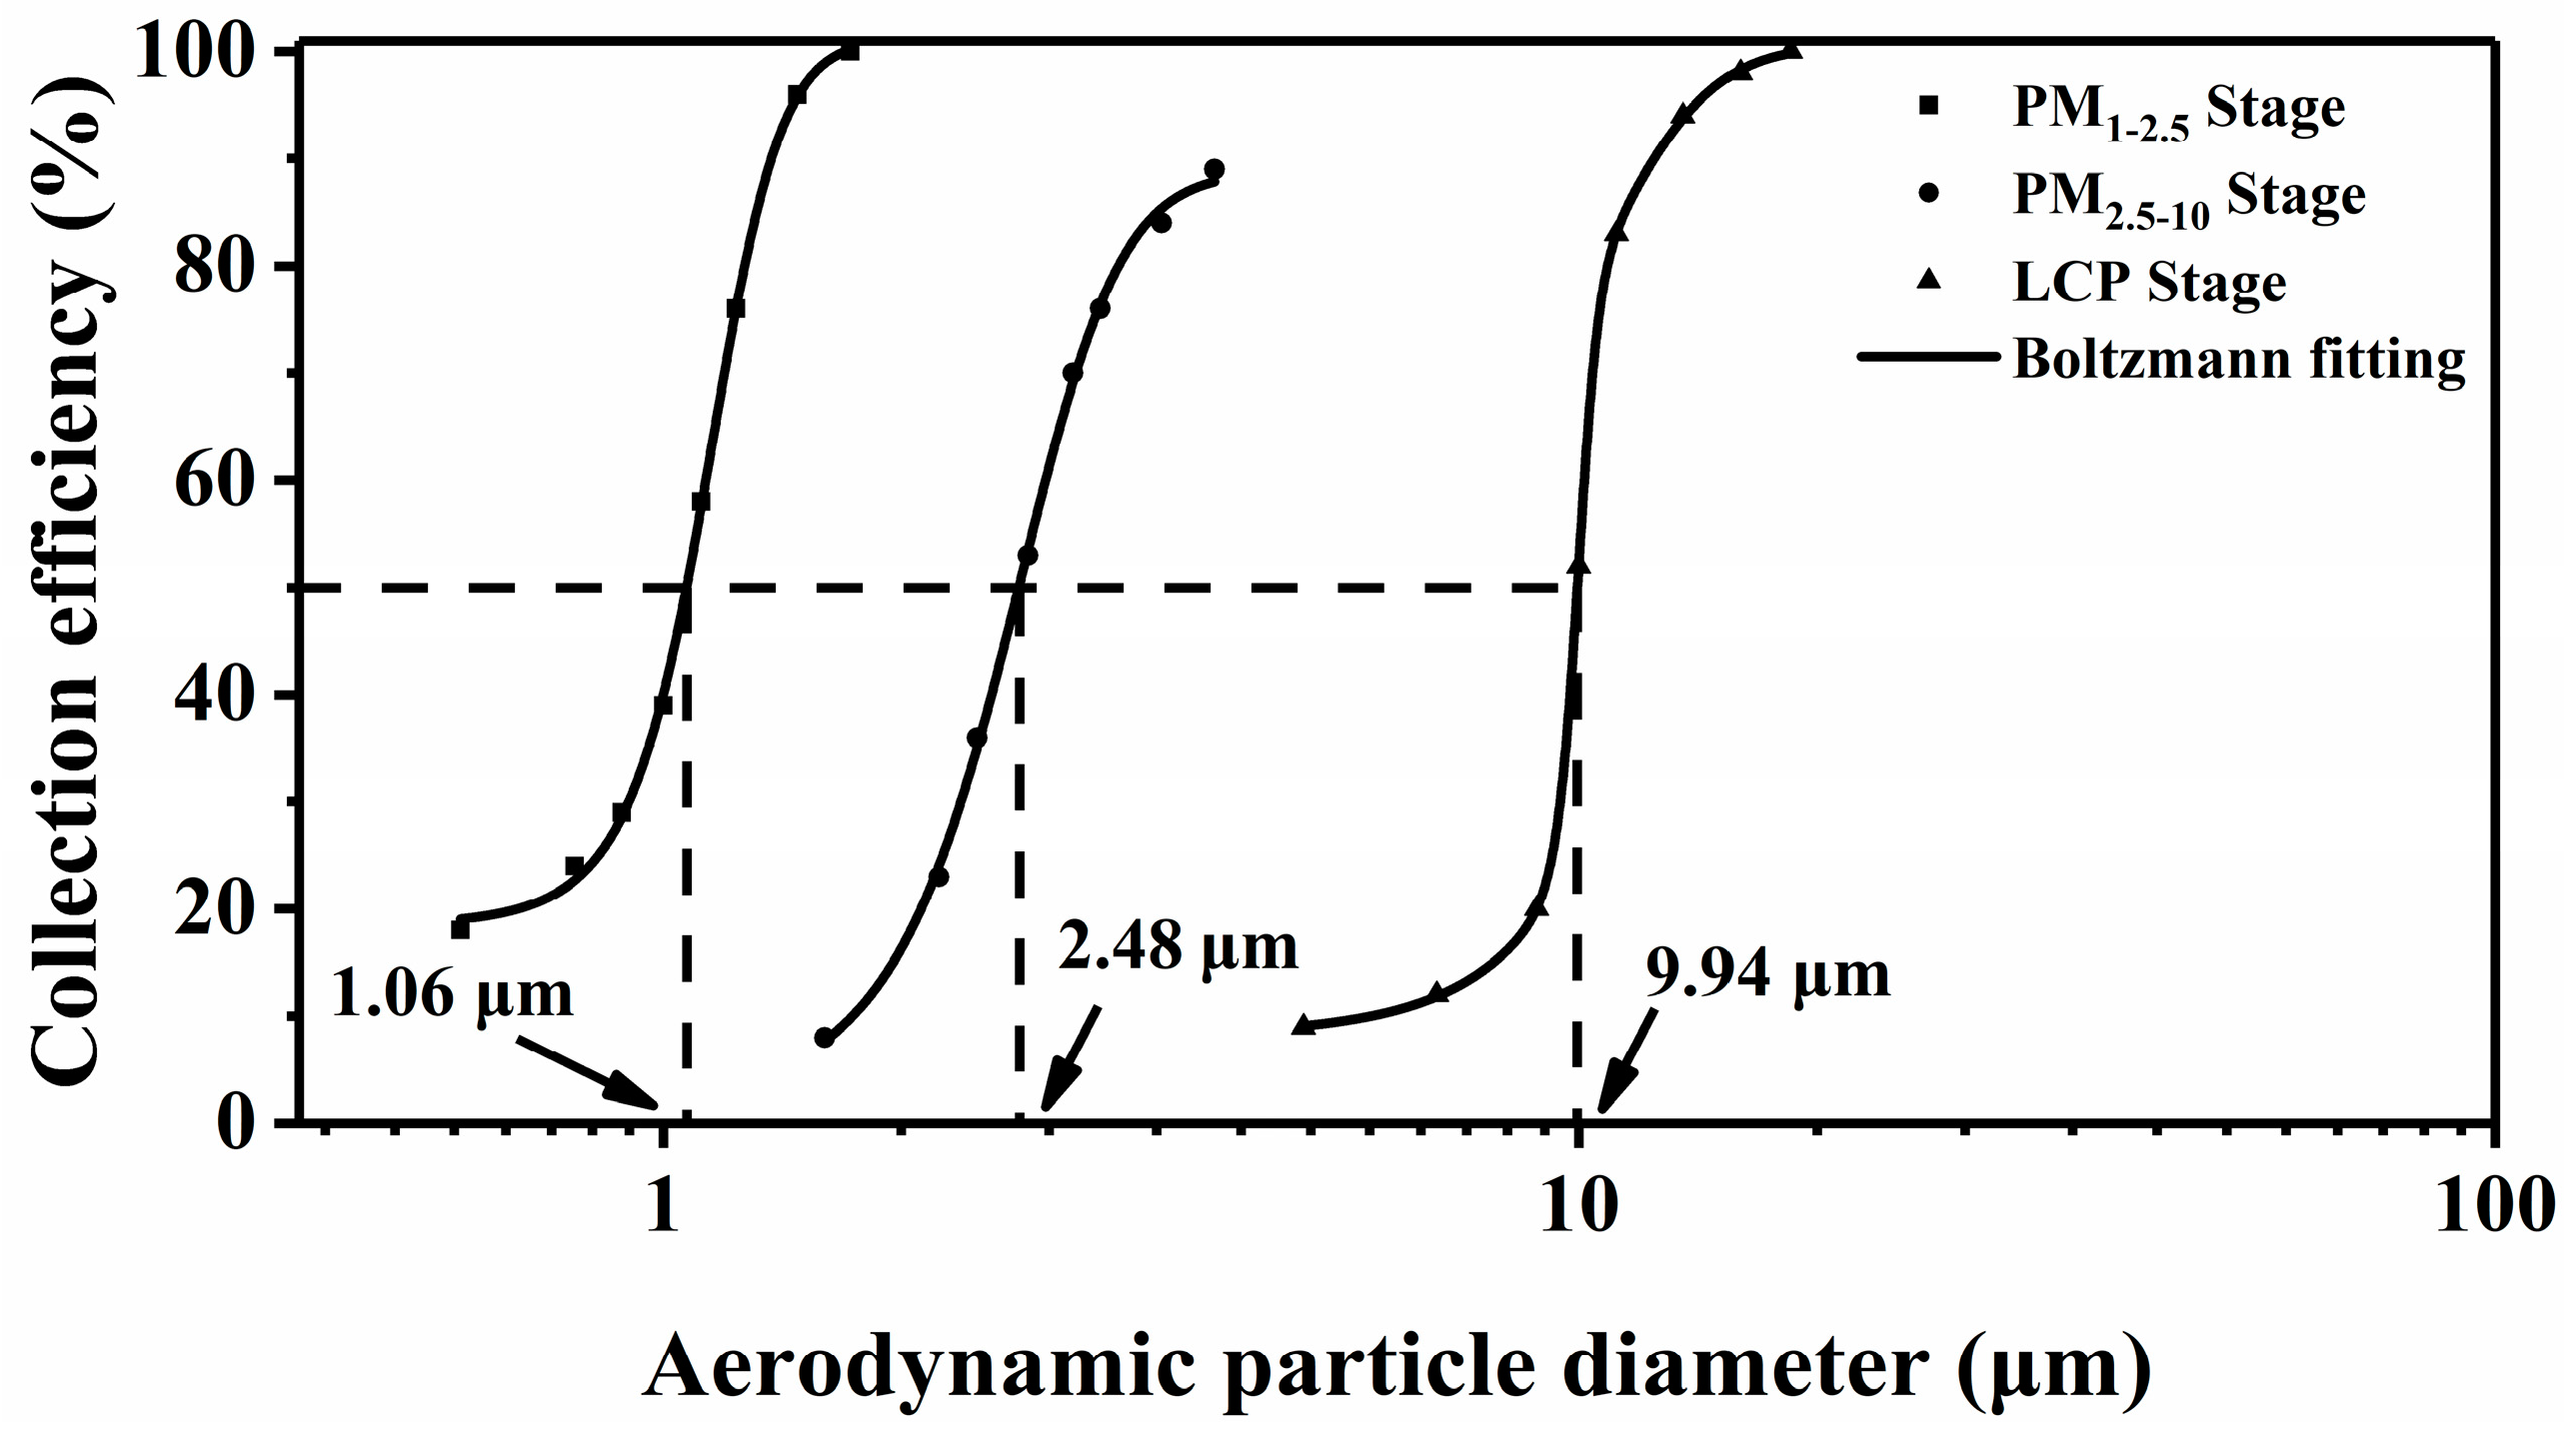
3.5. Impactor’s Performance

Furthermore, to verify the separation performance of the cascade impactor, we observe the particulate matter collected on the surface of the SAWR through a microscope, as shown in Figure 17. The SAW sensor on the LCP stage’s impaction plate collected fewer particles, but the particle size was relatively large; the second stage collected the particle’s size mainly in the range of 2.5 to 10 μm; the third stage collected the most significant number of particles, most of them were smaller than 2.5 μm. Therefore, the collected particles on the surface of the SAWR on the impaction plate of the three different impactors were in line with the design expectations.

4. Conclusions

In this paper, a multi-sized particle sensor based on surface acoustic wave resonators and a cascade impactor was designed and manufactured. We used 311 MHz surface acoustic wave resonators with low insertion loss and high performance as sensitive components. A wide range of aerosol particle diameters (LCP, PM10, and PM2.5) can be separated and detected by combining a match-designed cascade impactor. Through the simulation analysis of the finite element method, the optimal sensitive area of the surface acoustic wave resonator to the mass loading effect was obtained and analyzed the influence of the distance from the nozzle to chip surface on particle distribution. A 2 LPM cascade impactor suitable for our resonators was designed based on theoretical analysis, and its particle collection efficiency curve was simulated using CFD software. The fitting results showed that its cutting characteristic points all met the requirements. An experimental platform was set up. The results of experiments on monitoring aerosol particulate matter from burning leaf fragments and repetitive experiments showed that the SAWR on different impaction plates all have significantly different linear responses, and the response repeatability was good. Finally, we used the microscope observation method to verify that the performance of designed cascade impactor meets the requirements. The results suggested that the particles collected on the surface of the sensor chip met expectations.

Author Contributions

Conceptualization, Z.C. and J.L.; methodology, Z.C.; simulation, Z.C. and R.Y.; experiments, Z.C., R.Y., and M.L. data acquisition, R.Y. and M.L.; writing—original draft preparation, Z.C.; writing—review and editing, J.L. and S.H.; visualization, Z.C. and R.Y.; funding acquisition, J.L. All authors have read and agreed to the published version of the manuscript.

Funding

This work was funded by the National Natural Science Foundation of China, grant number [12074404].

Institutional Review Board Statement

Not applicable.

Informed Consent Statement

Not applicable.

Data Availability Statement

Data is contained within the article.

Conflicts of Interest

The authors declare no competing interests.

References

  1. Ostro, B.; Malig, B.; Broadwin, R.; Basu, R.; Gold, E.B.; Bromberger, J.T.; Derby, C.; Feinstein, S.; Greendale, G.A.; Jackson, E.A.; et al. Chronic PM2.5 Exposure and Inflammation: Determining Sensitive Subgroups in Mid-Life Women. Environ. Res. 2014, 132, 168–175. [Google Scholar] [CrossRef] [PubMed] [Green Version]
  2. Lavigne, É.; Talarico, R.; van Donkelaar, A.; Martin, R.V.; Stieb, D.M.; Crighton, E.; Weichenthal, S.; Smith-Doiron, M.; Burnett, R.T.; Chen, H. Fine Particulate Matter Concentration and Composition and the Incidence of Childhood Asthma. Environ. Int. 2021, 152, 106486. [Google Scholar] [CrossRef]
  3. Lee, D.-W.; Han, C.; Hong, Y.-C.; Oh, J.-M.; Bae, H.-J.; Kim, S.; Lim, Y.-H. Long-Term Exposure to Fine Particulate Matter and Incident Asthma among Elderly Adults. Chemosphere 2021, 272, 129619. [Google Scholar] [CrossRef] [PubMed]
  4. Tecer, L.H.; Alagha, O.; Karaca, F.; Tuncel, G.; Eldes, N. Particulate Matter (PM2.5, PM10-2.5, and PM10) and Children’s Hospital Admissions for Asthma and Respiratory Diseases: A Bidirectional Case-Crossover Study. J. Toxicol. Environ. Health Part A 2008, 71, 512–520. [Google Scholar] [CrossRef] [PubMed]
  5. World Health Organization (Ed.) Air Quality Guidelines: Global Update 2005: Particulate Matter, Ozone, Nitrogen Dioxide, and Sulfur Dioxide; World Health Organization: Copenhagen, Denmark, 2006; ISBN 978-92-890-2192-0. [Google Scholar]
  6. Wilson, W.E.; Chow, J.C.; Claiborn, C.; Fusheng, W.; Engelbrecht, J.; Watson, J.G. Monitoring of Particulate Matter Outdoors. Chemosphere 2002, 49, 1009–1043. [Google Scholar] [CrossRef]
  7. White, R.M.; Paprotny, I.; Doering, F.; Cascio, W.E.; Solomon, P.A.; Gundel, L.A. Sensors and ‘Apps’ for Community-Based Atmospheric Monitoring. EM Air Waste Manag. Assoc. Mag. Environ. Manag 2012, 5, 36–40. [Google Scholar]
  8. Chung, A.; Chang, D.P.Y.; Kleeman, M.J.; Perry, K.D.; Cahill, T.A.; Dutcher, D.; McDougall, E.M.; Stroud, K. Comparison of Real-Time Instruments Used To Monitor Airborne Particulate Matter. J. Air Waste Manag. Assoc. 2001, 51, 109–120. [Google Scholar] [CrossRef] [PubMed]
  9. Strutt, J.W. (Ed.) On Waves propagated along the Plane Surface of an Elastic Solid. In Scientific Papers: Volume 2: 1881–1887; Cambridge Library Collection—Mathematics; Cambridge University Press: Cambridge, UK, 2009; Volume 2, pp. 441–447. ISBN 978-1-108-00543-2. [Google Scholar]
  10. White, R.M.; Voltmer, F.W. Direct Piezoelectric Coupling to Surface Elastic Waves. Appl. Phys. Lett. 1965, 7, 314–316. [Google Scholar] [CrossRef]
  11. Bowers, W.D.; Chuan, R.L. Surface Acoustic-wave Piezoelectric Crystal Aerosol Mass Microbalance. Rev. Sci. Instrum. 1989, 60, 1297–1302. [Google Scholar] [CrossRef]
  12. Hao, W.; Liu, J.; Liu, M.; He, S. Development of a New Surface Acoustic Wave Based Pm2.5 Monitor; Wang, X., Wang, Y., Li, H., Eds.; IEEE: New York, NY, USA, 2014; pp. 52–55. ISBN 978-1-4799-6425-3. [Google Scholar]
  13. Wang, Y.; Wang, Y.; Liu, W.; Chen, D.; Wu, C.; Xie, J. An Aerosol Sensor for PM1 Concentration Detection Based on 3D Printed Virtual Impactor and SAW Sensor. Sens. Actuators A Phys. 2019, 288, 67–74. [Google Scholar] [CrossRef]
  14. Kuo, F.-Y.; Lin, Y.-C.; Ke, L.-Y.; Tsai, C.-J.; Yao, D.-J. Detection of Particulate Matter of Size 2.5 Μm with a Surface-Acoustic-Wave Sensor Combined with a Cyclone Separator. Micromachines 2018, 9, 398. [Google Scholar] [CrossRef] [PubMed] [Green Version]
  15. Zhao, J.; Liu, M.; Liang, L.; Wang, W.; Xie, J. Airborne Particulate Matter Classification and Concentration Detection Based on 3D Printed Virtual Impactor and Quartz Crystal Microbalance Sensor. Sens. Actuators A Phys. 2016, 238, 379–388. [Google Scholar] [CrossRef]
  16. Djoumi, L.; Vanotti, M.; Blondeau-Patissier, V. Real Time Cascade Impactor Based On Surface Acoustic Wave Delay Lines for PM10 and PM2.5 Mass Concentration Measurement. Sensors 2018, 18, 255. [Google Scholar] [CrossRef] [Green Version]
  17. Zhu, X.; Jia, Y.; Sun, J.; Zhao, P.; Liu, J.; Zhang, Y.; Ning, Z. Configuration of Air Microfluidic Chip for Separating and Grading Respirable Dust. In Proceedings of the 19th Annual Conference and 8th International Conference of Chinese Society of Micro/Nano Technology (csmnt2017), Dalian, China, 26–29 October 2017; Iop Publishing Ltd.: Bristol, UK, 2018; Volume 986, p. UNSP 012017. [Google Scholar]
  18. SAW Gas Sensors: Comparison between Delay Line and Two Port Resonator. Sens. Actuators B Chem. 1995, 26, 187–190. [CrossRef]
  19. Rapp, M.; Reibel, J.; Stahl, U.; Stier, S.; Voigt, A. Influence of Phase Position on the Chemical Response of Oscillator Driven Polymer Coated SAW Resonators. In Proceedings of the 1998 IEEE International Frequency Control Symposium (Cat. No.98CH36165), Pasadena, CA, USA, 27–29 May 1998; pp. 621–629. [Google Scholar]
  20. Auld, B.A.; Green, R.E. Acoustic Fields and Waves in Solids: Two Volumes 1. Phys. Today 1974, 27, 63–64. [Google Scholar] [CrossRef]
  21. Plessky, V.; Koskela, J. Coupling-of-Modes Analysis of Saw Devices. Int. J. High Speed Electron. Syst. 2000, 10, 81. [Google Scholar] [CrossRef]
  22. Hao, W.; Liu, J.; Liu, M.; Liang, Y.; He, S. Mass Sensitivity Optimization of a Surface Acoustic Wave Sensor Incorporating a Resonator Configuration. Sensors 2016, 16, 562. [Google Scholar] [CrossRef] [PubMed] [Green Version]
  23. Baron, P.A.; Kulkarni, P.; Willeke, K. (Eds.) Aerosol Measurement: Principles, Techniques, and Applications, 3rd ed.; Wiley: Hoboken, NJ, USA, 2011; ISBN 978-0-470-38741-2. [Google Scholar]
  24. Nevalainen, A.; Pastuszka, J.; Liebhaber, F.; Willeke, K. Performance of Bioaerosol Samplers: Collection Characteristics and Sampler Design Considerations. Atmos. Environment. Part A Gen. Top. 1992, 26, 531–540. [Google Scholar] [CrossRef]
  25. Marple, V.A.; Willeke, K. Impactor Design. Atmos. Environ. 1976, 10, 891–896. [Google Scholar] [CrossRef]
  26. Zhang, N. Study on the Characteristics of Particulate Emissions from Eight Typical Indoor or Outdoor Combustion Behaviors; Zhejiang Normal University: Zhejiang, China, 2018. [Google Scholar]
Figure 1. Schematic diagram of the multi-sized particles sensor based on the surface acoustic wave resonator and cascade impactor (single stage).
Applsci 11 09833 g001
Figure 2. Schematic diagram of cascaded impactor with SAW sensors.
Applsci 11 09833 g002
Figure 3. The schematic of a two-port SAWR with three IDTs.
Applsci 11 09833 g003
Figure 4. Schematic diagram (a) and mesh geometry (b) of the periodic model.
Applsci 11 09833 g004
Figure 5. The contrast of the theoretical results and measured results: (a) Amplitude-frequency response; (b) Phase-frequency response.
Applsci 11 09833 g005
Figure 6. The normalized sensitivity distribution of the SAWR’s surface to the mass loading effect.
Applsci 11 09833 g006
Figure 7. The normalized distribution of particles at different impact distances.
Applsci 11 09833 g007
Figure 8. Schematic of the conventional impactor.
Applsci 11 09833 g008
Figure 9. 3D simulation of velocity distribution of impactors: (a) LCP stage; (b) PM2.5–10 stage; (c) PM1–2.5 stage.
Applsci 11 09833 g009
Figure 10. Particle collection efficiency curves of the cascade impactor simulated by COMSOL MULTIPHYSICS.
Applsci 11 09833 g010
Figure 11. Fabrication process of SAWR’s electrodes.
Applsci 11 09833 g011
Figure 12. The photograph of the cascade impactor assembled with the surface acoustic wave resonator: (a) sensor; (b) SAWR placed on the impaction circuit board; (c) 311 MHz SAWR.
Applsci 11 09833 g012
Figure 13. Schematic and photograph of the experimental setup.
Applsci 11 09833 g013
Figure 14. The response changed with different distances from the nozzle to the chip surface.
Applsci 11 09833 g014
Figure 15. The response of collecting particulate aerosol and its linear fitting result.
Applsci 11 09833 g015
Figure 16. PM1–2.5 stage collecting results in indoor condition and its linear fitting: (a) Partial figure of repeated sampling results; (b) Results of the first test; (c) Results of the second test; (d) Results of the third test.
Applsci 11 09833 g016
Figure 17. Photograph of the SAWR’s surface under microscope: (a) LCP stage; (b) PM2.5–10 stage; (c) PM1–2.5 stage.
Applsci 11 09833 g017
Table 1. Comparison of particulate matter monitoring equipment.
MethodComplexityInstrumentAccuracyResolution Measurement Cycle Time
GravimetricHighBETTERSIZE BTPM-AS110 μg (electronic balance)0.01 L/min (Airflow)1–100 h
TEOMLowThermo Scientific 1405-F TEOM<±1 μg/m3 (24 h)0.1 μg/m31–24 h
β-ray attenuationLowMETONE BAM 1020<±2 μg/m30.1 μg/m31 h
Light scatteringLowAeroQual Dust Sentry Pro<±5 μg/m30.1 μg/m31 min–24 h
Table 2. Structure parameters of SAWR.
Structural ParameterValue
Electrical period λ (μm)10
Finger width a (μm)2.5
Metallization ratio η 0.5
Acoustic aperture W 150 λ
Finger thickness h (nm)250
Grid period p g (μm)5
Length between IDT1 and IDT2  g 1 22.5 λ
Length between IDT and reflector g 2 λ
number of IDT1 finger pairs45
number of IDT2 and IDT3 finger pairs23
number of reflector finger pairs200
Table 3. Extraction results of COM parameters before and after being loaded.
COM-ParameterValue (Non-Loaded)Value (Loaded)
SAW Velocity (m/s)3146.0453124.873
Normalized static capacitance C n (F/m)4.290 × 10−115.150 × 10⁻¹¹
Normalized reflectivity κ λ 0 −0.023−0.031
Normalized transduction coefficient α   −1/2)2.570 × 10−52.282 × 10−5
Table 4. Design parameters of cascade impactor.
StageD0 (mm)T (mm)S (mm)
LCP4.9495
PM2.5–101.9953
PM1–2.51.1252
Publisher’s Note: MDPI stays neutral with regard to jurisdictional claims in published maps and institutional affiliations.

