Article

An Investigation of Surface-Enhanced Raman Scattering of Different Analytes Adsorbed on Gold Nanoislands

1
Department of Experimental Physics, Institute of Physics, Faculty of Science and Technology, University of Debrecen, H-4026 Debrecen, Hungary
2
Department of Electronics Technology, Faculty of Electrical Engineering and Informatics, Budapest University of Technology and Economics, H-1521 Budapest, Hungary
3
Institute for Solid State Physics and Optics, Wigner Research Centre for Physics, H-1121 Budapest, Hungary
4
Department of Solid State Physics, Institute of Physics, Faculty of Science and Technology, University of Debrecen, H-4026 Debrecen, Hungary
5
Department of Biomaterials and Prosthetic Dentistry, Faculty of Dentistry, University of Debrecen, H-4032 Debrecen, Hungary
*
Author to whom correspondence should be addressed.
Appl. Sci. 2021, 11(21), 9838; https://doi.org/10.3390/app11219838
Submission received: 8 September 2021 / Revised: 11 October 2021 / Accepted: 15 October 2021 / Published: 21 October 2021
(This article belongs to the Special Issue Raman Spectroscopy: Novel Advances and Applications)

Abstract

:
In this study, metallic nanoislands were prepared by thermal annealing of gold thin film produced by vacuum evaporation on a glass substrate to investigate the surface-enhanced Raman scattering (SERS) effect on them. The influence of the analyte on the enhancement factor of SERS was studied with riboflavin and rhodamine 6G dye. Two laser excitation sources at 532 and 633 nm wavelengths were used for SERS measurements. We found that the enhancement factors of the gold nanoisland SERS substrates were influenced by the analytes’ adsorption tendency onto their surfaces. The SERS amplification was also found to be dependent on the electronic structure of the molecules; higher enhancement factors were obtained for rhodamine 6G with 532 nm excitation, while for riboflavin the 633 nm source performed better.

1. Introduction

Raman spectroscopy is a branch of vibrational spectroscopy that allows highly sensitive structural identification of various chemical and biological materials based on their unique vibrational characteristics, all without destroying the sample. Raman spectroscopy is an effective tool for analytical studies, but the low intensity of Raman signals is a major disadvantage of the method [1]. Surface-enhanced Raman scattering (SERS) is a commonly used technique to enhance the signal, that allows the analysis of low-concentration samples or even the detection of a single molecule. The SERS effect can occur when the analyte is in close vicinity of a nanoscale-structured metal surface. By using metal surfaces with optimal parameters, the intensity of Raman signals can be enhanced by several orders of magnitude [2,3,4].
It is now accepted that two types of mechanisms play a role in an increase in the intensity of Raman signals: the electromagnetic (EM) enhancement [5] derived from electromagnetic fields generated by plasmon excitation of metal particles serving as SERS substrates, and the chemical amplification [6,7], which allows the target molecule to transfer electrons to the metal particles, often leading to the formation of a chemical bond between the metallic surface and the molecule [2].
For SERS measurements, plasmonic metal substrates made of silver, gold, or copper are used in most cases [8], which are synthesized by various methods. SERS active agents can be divided into three categories: (1) metal nanoparticles (MNPs) in suspension, (2) MNPs immobilized on solid substrates, (3) nanostructured surfaces fabricated directly on solid substrates by using nanolithography and template synthesis [9]. Manufacturing technologies allow tuning of the size and shape of the nanoparticles, which can also greatly influence the degree of enhancement [10,11]. To produce substrates with optimal parameters providing maximum SERS enhancement [12], it is necessary to understand how the material, size, shape, and arrangement of nanoparticles, or the excitation source, affect SERS efficiency [13,14,15].
If the particle size is too small, the light scattering properties will decrease, resulting in a decrease in SERS enhancement. As the particle size increases, the SERS effect also increases as the number of available free electrons is higher, which plays an important role in the excitation of plasmons [8]. In our previous work, examining the effect of size and distance of Au and Ag nanoparticles generated by heat treatment of a thin metallic layer produced by vacuum evaporation, we found that the SERS effect increases linearly with particle size, as larger particles function as larger scattering centers [12]. In addition, by reducing the distance between the particles, hot spots will be located closer to each other, leading to the formation of highly concentrated EM fields, which results in the enhancement of Raman signals [12,16,17,18].
To effectively optimize nanoparticles for SERS, the plasmon wavelength of the particle must be considered as well. The localized surface plasmon resonance (LSPR) peak of the plasmonic material must be close to the wavelength of the excitation source or the inelastically scattered light. The LSPR wavelength of a plasmonic material depends on the material, size, and shape of the particle. In the case of gold and silver, the plasmon wavelength is between 500 and 800 nm, and 400 and 700 nm, respectively. Furthermore, the plasmon peak shows a redshift with increasing size of the nanostructures and distance between the particles. If the wavelength of the excitation source is far from the LSPR peak of the plasmonic material, the extent of EF also decreases [12,13].
In addition to the parameters of the nanoislands, the adsorption of the analyte to their surface should play an important role in the SERS process. However, there are no systematic studies concerning how the analytes affect the optical parameters of the SERS substrates, only the initial parameters and their effect on enhancement factors are studied. Many different analyte molecules are used for SERS developments and measurements. For example, heterocyclic aromatic compounds such as melamine [19,20], or explosives such as TNT [21,22], or drugs and pharmaceuticals such as methamphetamine [23,24]. For our studies, we selected two frequently used compounds, riboflavin and rhodamine 6G, which are both widely used in SERS research, to study and understand the SERS process, and as an analyte molecule to optimize the production of different SERS substrates and to determine the enhancement factor [2,25,26,27,28,29,30]. However, no systematic studies have been performed before concerning how the properties of the analyte influence the enhancement factor at different excitation wavelengths. As the electronic structure of the selected analytes is different, the obtained results could add important knowledge about the influence of the analyte on the SERS enhancement.
In this study, SERS enhancement was investigated on gold nanoislands made by heat treatment of a gold thin film formed on a glass substrate by thermal vacuum evaporation. The enhancement factor was studied for two different analytes and two excitation wavelengths, and the role of the adsorption and electronic structure of the analytes in the SERS enhancement was examined.

2. Materials and Methods

2.1. Preparation of Gold Nanoislands as SERS Substrates

The SERS active surfaces used for the measurements were formed on substrates cut from microscope slides with a glass cutter. The glass plates were cleaned in an EMMI-20HC ultrasonic bath in 96% ethanol, and then wiped dry with a sterile paper towel. The amount of gold to be evaporated was measured on a Sartorius Micro M3p semi-micro analytical balance. A gold thin layer of a given thickness was prepared by thermal vacuum evaporation. The thickness of the film, which was measured with an Ambios XP-1 profilometer, was found to be 9 and 12 nm. The layer deposition was followed by heat treatment of the gold film in an oven saturated with Ar:H precursor gas. The high temperature causes diffusion on the surface, which results in cracking of the layer, followed by nanoscale island formation. The heat treatment was performed at different temperatures (450, 500, and 550 °C) and for different periods (15, 30, 60, and 120 min), which led to the formation of gold nanoparticles having different parameters (e.g., particle diameter, interparticle distance and so, plasmon wavelength) [12]. The following table (Table 1) summarizes the production parameters of the 18 substrates that were examined in our study.

2.2. Characterization of SERS Substrates

The obtained samples were investigated with a SHIMADZU UV-3600 (Kioto, Japan, Shimadzu Corporation) spectrophotometer to study their plasmon wavelength. The optical transmittance of the samples was measured in the air before and after the adsorption of the analytes. The freshly prepared and washed metallic nanoislands were examined by using a scanning electron microscope (SEM). SEM images were recorded with a Hitachi S4300-CFE (Chiyoda City, Tokyo, Hitachi Corporation) instrument (see Figure 1).

2.3. Sample Preparation for SERS Measurements

Two different analyte solutions were used for SERS measurements. The first was an aqueous solution of riboflavin (St. Louis, MO, USA, Sygma Aldrich Coorporation) at a concentration of 10−5 mol/dm3. The gold nanoisland substrates were immersed in the riboflavin solution overnight, then, washed with distilled water, and dried in the air [31]. The other analyte was an aqueous solution of rhodamine 6G (R6G) (St. Louis, MO, USA, Sygma Aldrich Coorporation) at a concentration of 10−5 mol/dm3. In this case, the solution was dripped onto the SERS substrate so that it was completely spread on it, and then dried in air [32].
The same gold nanoisland substrates were used during the experiments, thus, between measurements with the two analytes, they were cleaned by soaking in cc. HNO3 for 30 min. This was followed by washing with distilled water to remove any acid residue remaining on the surface, and then dried in air. The cleaned substrates were verified by optical transmittance spectra, and there was no difference as compared with the as-deposited substrates.

2.4. SERS Measurements

A Horiba LabRam Raman spectrometer was used for SERS measurements with two different excitation sources of 532 and 633 nm wavelength. The excitation beam was focused on the surface of the sample with a 50× lens in both cases. For reference measurements, the analyte solution was applied to a clear glass plate under the same conditions. For riboflavin and R6G, the measurement parameters are summarized in Table 2.
Eighteen different gold nanoisland SERS substrates were investigated in this study. The SERS and normal Raman spectra shown in the following figures were measured on the same gold nanoisland substrate, obtained using the production parameters mentioned in Table 1. Each sample, each analyte with each excitation laser were examined in 10 different points. The presented results are the average value of the EF, and the standard deviation of these values was found to be 1–3%.
The contact angles of the two analytes’ aqueous solutions were analyzed on pure glass and gold nanoisland substrates. A DSA 30 Drop Shape Analyzer (Krüss GmbH, Hamburg, Germany) was used for the contact angle measurements. The sessile drop method was applied to measure the water, rhodamine, and riboflavin contact angle (CA) on glass and gold nanoisland glass surfaces at room temperature (25 °C). The rhodamine and riboflavin droplets (5 µL) were deposited on glass and modified glass surfaces with a manual dosing system, the water droplets (5 µL) were deposited with an automatic dosing system. The diameter of a used needle was 0.5 mm. The contact angles were calculated by Krüss Advance software by fitting the captured droplet shape to the degree calculated from the Young–Laplace equation. The mean contact angles were calculated from 10 individual droplet measurements (n = 10).

3. Results and Discussion

Figure 2 compares the Raman spectra of riboflavin measured on the gold nanoisland SERS substrate described above, on a pure glass substrate as a reference and in solid form. All spectra were recorded with the same measurement conditions. The spectra were recorded with 633 nm excitation, as in the case of riboflavin, a higher SERS enhancement was obtained with this excitation wavelength. The following characteristic peaks of riboflavin can be detected in the spectra: high-intensity bands at 1174 and 1222 cm−1 corresponding to the C–N bending vibrations of the uracil ring and the C-CH3 bond of the benzene ring, respectively. The peak at 1402 cm−1 can be assigned to C-C vibrations and the peak at 1496 cm−1 can be assigned to the -CH3 group. Furthermore, the peak appearing as a shoulder at 1530 cm−1 and the high-intensity band at 1562 cm−1 can be linked to the vibration of the C-N bond [24,31,33].
Figure 3 shows the Raman spectra of R6G, recorded similarly to those of riboflavin in Figure 2. A comparison of the spectra shows that using gold nanoisland substrate and the SERS process, the main bands of rhodamine 6G appear with a higher intensity than in other samples. The spectra shown were recorded with 532 nm excitation, since in the case of R6G a higher degree of enhancement was achieved with this laser. In the SERS spectrum, the C-C vibration of the aromatic ring appears at 1650, 1599, and 1363 cm−1. The band at 1312 cm−1 can be related to the stretching vibration of the C-O-C group of the carbon skeleton, and the peaks at 1189 and 773 cm−1 are the vibrations of the -CH3 group. At 614 cm−1, the vibration of the C-C-C group appears at a high intensity [34].
In our study, the magnitude of the SERS enhancement was calculated based on the enhancement factor (EF) [35] defined as follows:
E F = I S E R S / N S E R S I N R / N N R ,
where I S E R S is the intensity of the signal obtained during the SERS measurement; I N R is the intensity of the signal obtained during the normal Raman (reference) measurement; and N S E R S   and N N R   are the average number of molecules absorbed on the surface during the SERS and normal Raman measurements, respectively [35]. For riboflavin, the magnitude of SERS EF was calculated from the intensity of the peak at ~1575 cm−1, corresponding to the vibration of the C-N bond. For R6G, the EF value was calculated from the intensity of the peak at ~1650 cm−1, arising from the vibrations of the C-C bond of the aromatic ring.
Figure 4 compares the surface-enhanced Raman spectra measured on a given gold nanoisland sample with two excitation wavelengths. The main peaks of riboflavin can be detected in both spectra in the Figure; however, the degree of the enhancement of the Raman signal is more pronounced while using the 633 nm laser. The EF value for the 532 nm laser was found to be 9, while, for 633 nm excitation, it was 42.
The same comparison for the other analyte, i.e., R6G, is provided in Figure 5. The characteristic peaks of R6G can be detected for both excitations. In terms of the enhancement, it is better with 532 nm excitation; the EF for R6G is 110 for the 532 nm excitation and only 14 for 633 nm.
In the case of gold nanoisland substrates, a higher enhancement would be expected for 532 nm excitation, since the magnitude of the SERS enhancement is influenced by the plasmon wavelength of the substrate. We know that the LSPR peak of the active surface must fall close to the wavelength of the excitation source [12]. This is true in the case of rhodamine 6G, where a higher enhancement was observed with the green laser, but the opposite occurs for riboflavin. This may be explained by the fact that the adsorption process of riboflavin is different as compared with R6G, which results in a greater plasmon wavelength of the gold substrate. As a result, the LSPR peak will be closer to the wavelength of the red laser and a greater enhancement can be achieved with this excitation source. Figure 6a shows the normalized absorbance of the gold nanoisland substrate without analyte and with R6G and riboflavin adsorbed on the surface. It can be seen how the plasmon wavelength of the gold substrate is redshifted by the different analytes. Initially, the LSPR wavelength of the clean substrate is at 532 nm, which is shifted to 551 nm with rhodamine 6G, and to 585 nm with riboflavin. The latter is closer to the wavelength of the 633 nm excitation source than to 532 nm. Furthermore, Figure 6b shows the spectra of the normalized absorbance of the two analyte solutions. In the 400–750 nm region, the absorption peak of riboflavin is located below 510 nm, while R6G has strong band in the 425–600 nm region. Comparing this with the excitation wavelengths, it can be concluded that a resonant Raman scattering could occur mainly for the R6G and for that only with 532 nm excitation. As a consequence, the SERS spectrum of this analyte can also be of resonant with 532 nm excitation.
Table 3 summarizes the plasmon wavelengths of the gold nanoisland substrates after the riboflavin and R6G solution was adsorbed on their surface. Furthermore, the table contains average EF values calculated for both riboflavin and rhodamine 6G based on the intensities of the peaks described above as a function of the two excitation sources (green and red). The standard deviation of these values was 3–5%. The initial plasmon wavelength of the gold nanostructures was in the range of 510–550 nm, which was already shown earlier [12,36]. The cleaned substrates were verified, and there was no difference in the plasmon wavelength as compared with the as-deposited substrates.
The data in the table demonstrate that, for the rhodamine 6G and riboflavin, the higher EF could be achieved with different laser excitations, which could also be connected with the adsorption of the analyte on the SERS substrate. The polarity and the polar surface area (PSA) can be used to quantify the adsorption. The PSA is defined as the surface area of a molecule that arises from oxygen or nitrogen atoms, plus hydrogen atoms attached to nitrogen or oxygen atoms [32]. Roughly, PSA is the ability of a molecule to form hydrogen bonds due to the presence of nitrogen and oxygen atoms [37]. For the riboflavin, it is 155 A2, while for the R6G is 63.5 A2 [38,39]. As the PSA value is in a good connection with the contact angle [40], the latter was measured on glass and gold nanoisland substrates. It was found that for the riboflavin it is 11° +/− 2°, while for the R6G it is 33° +/− 3° on a glass substrate, and 27° +/− 3° and 45° +/+ 5° on gold nanoislands substrate, respectively. It can be seen that while the contact angle increases for both cases on the SERS substrate, the relation is similar to that of the pure glass substrate. The contact angle values could be connected with the structure of the molecule and its PSA as well. The examination of the structure of the two analyte molecules shows that riboflavin has several hydroxyl groups (-OH) in its structure, with which it can form larger secondary bonds (H-bond and/or Van der Waals bond) with the gold surface. While the side chains of the rhodamine 6g molecule contains a methyl group (-CH3) in its structure, which could not bond so easily to the Au surface. As a consequence, there is a difference in the orientation of the two analytes on the gold surface, and this has also been supported by earlier studies. It was found that rhodamine 6G molecule adsorbs on the silver surface with the xanthene plane lying parallel and both the tail of the phenyl group and the ethylamine groups pointing up from the surface [40]. In another hand, from model calculations of different orientations and characteristic bands intensities observed in SERS spectra was evident that riboflavin molecules were adsorbed on the surface via aromatic ring, heterocyclic rings II and III (N10 and O2) and heterocyclic rings II and III in the case of gold, silver, and copper, respectively [33]. The results of the contact angle measurements are in good agreement with the PSA of these materials; a larger contact angle means that the material is more hydrophobic, and the PSA value is lower, as has also been shown earlier in another study [41]. As a result of this investigation, it was found that the polarity of the molecule influences the SERS process, as it affects the absorption of the substrate.
As a consequence of the results, during the investigation of the SERS effect, not only the parameters of the nanostructure (material, shape, size, gap, and the peak of the plasmon wavelength) and the wavelength of the laser excitation should be considered [12], but the type of the studied analyte, and its adsorption on the substrate as well. It was shown in our study that different analytes have different adsorption, which affects which excitation wavelength will cause the highest SERS enhancement. Previously, there were no examples of systematic studies of the effect of the analytes on the SERS process. Rhodamine 6G and riboflavin have both been used as analyte molecules in several cases to investigate the optimization of different production of SERS substrates. Furthermore, using the optimized substrates, the detection limit is determined for both analytes [4,23,33,42,43,44,45].

4. Conclusions

SERS enhancement of gold nanoisland SERS substrates was investigated with two different analytes (riboflavin and rhodamine 6G) and two excitation wavelengths (532 and 633 nm). According to the experimental results, higher enhancement factors were obtained for rhodamine 6G with 532 nm excitation, while for riboflavin the 633 nm source performed better. This relation between the analyte and the used excitation can be associated with the different adsorption tendencies of the investigated molecules on the surface of the gold nanoislands, as well as with resonant Raman scattering of R6G with 532 nm excitation. Our results indicate that during the planning of SERS measurements, it is necessary to consider the possible differences in the adsorption of the analytes, since it might affect SERS enhancement and the optimal excitation wavelength.

Author Contributions

P.P.—Data curation, Formal analysis, Investigation, Methodology, Visualization, Writing, original draft. A.B.—Writing, review & editing. M.V.—Methodology, Conceptualization, Visualization, Writing, review & editing. L.J.—Investigation, Visualization. M.S.—Investigation, Visualization. I.C.—Conceptualization, Funding acquisition, Resources, Supervision, Writing, review & editing. All authors have read and agreed to the published version of the manuscript.

Funding

This research was funded by European Union and the European Regional Development [GINOP-2.3.2-15-2016-00041], János Bolyai Research Scholarship of the Hungarian Academy of Sciences [BO/348/20], New National Excellence Program of the Ministry of Human Capacities [ÚNKP-21-5-DE-464], NRDI Fund [BME-IE-BIO]. The APC was funded by European Union and the European Regional Development [GINOP-2.3.2-15-2016-00041].

Institutional Review Board Statement

Not applicable.

Informed Consent Statement

Not applicable.

Data Availability Statement

It is avalaible from the project leader, Istvan Csarnovics.

Conflicts of Interest

The authors declare no conflict of interest.

References

  1. Rostron, P.; Gaber, S.; Gaber, D. Raman Spectroscopy, Review. Int. J. Eng. Tech. Res. (IJETR) 2016, 6, 50–64. [Google Scholar]
  2. Langer, J.; Jimenez de Aberasturi, D.; Aizpurua, J.; Alvarez-Puebla, R.A.; Auguié, B.; Baumberg, J.J.; Bazan, G.C.; Bell, S.E.; Boisen, A.; Brolo, A.G.; et al. Present and Future of Surface-Enhanced Raman Scattering. ACS Nano 2020, 14, 28–117. [Google Scholar] [CrossRef] [PubMed] [Green Version]
  3. Muehlethaler, C.; Leona, M.; Lombardi, J.R. Towards a validation of surface-enhanced Raman scattering (SERS) for use in forensic science: Repeatability and reproducibility experiments. Forensic Sci. Int. 2016, 268, 1–13. [Google Scholar] [CrossRef] [PubMed]
  4. Ouhibi, A.; Saadaoui, M.; Lorrain, N.; Guendouz, M.; Raouafi, N.; Moadhen, A. Application of Doehlert Matrix for an Optimized Preparation of a Surface-Enhanced Raman Spectroscopy (SERS) Substrate Based on Silicon Nanowires for Ultrasensitive Detection of Rhodamine 6G. Appl. Spectrosc. 2020, 74, 168–177. [Google Scholar] [CrossRef] [PubMed]
  5. Stockman, M.I. Electromagnetic Theory of SERS. Surf.-Enhanc. Raman Scatt. Phys. Appl. 2006, 103, 47–66. [Google Scholar]
  6. Otto, A. The “chemical” (electronic) contribution to surface-enhanced Raman scattering. J. Raman Spectrosc. 2005, 36, 497–509. [Google Scholar] [CrossRef]
  7. Otto, A. Charge transfer in first layer enhanced Raman scattering and surface resistance. Q. Phys. Rev. 2017, 3, 1–14. [Google Scholar]
  8. Mosier-Boss, P.A. Review of SERS substrates for Chemical Sensing. Nanomaterials 2017, 7, 142. [Google Scholar] [CrossRef] [PubMed] [Green Version]
  9. Fan, M.; Andrade, G.F.S.; Brolo, A.G. A review on the fabrication of substrates for surface enhanced Raman spectroscopy and their applications in analytical chemistry. Anal. Chem. Acta 2011, 693, 7–25. [Google Scholar] [CrossRef]
  10. Bora, T. Recent Developments on Metal Nanoparticles for SERS. In Applications Noble and Precious Metals—Properties, Nanoscale Effects and Applications; IntechOpen: London, UK, 2018; pp. 117–133. [Google Scholar] [CrossRef] [Green Version]
  11. Ding, S.-Y.; Yi, J.; Li, J.-F.; Ren, B.; Wu, D.-Y.; Panneerselvam, R.; Tian, Z.-Q. Nanostructure-based plasmonenhanced Raman spectroscopy for surface analysis of materials. Nat. Rev. Mater. 2016, 1, 1–16. [Google Scholar] [CrossRef]
  12. Pal, P.; Bonyár, A.; Veres, M.; Himics, L.; Balázs, L.; Juhász, L.; Csarnovics, I. A generalized exponential relationship between the surface-enhanced Raman scattering (SERS) efficiency of gold/silver nanoisland arrangements and their non-dimensional interparticle distance/particle diameter ratio. Sens. Actuators A Phys. 2020, 314, 112225. [Google Scholar] [CrossRef]
  13. Israelsen, N.D.; Hanson, C.; Vargis, E. Nanoparticle Properties and Synthesis Effects on Surface-Enhanced Raman Scattering Enhancement Factor: An Introduction. Sci. World J. 2015, 2015, 124582. [Google Scholar] [CrossRef] [PubMed] [Green Version]
  14. Joseph, V.; Matschulat, A.; Polte, J.; Rolf, S.; Emmerling, F.; Kneipp, J. SERS enhancement of gold nanospheres of defined size. J. Raman Spectrosc. 2011, 42, 1736–1742. [Google Scholar] [CrossRef]
  15. Kundu, S. A new route for the formation of Au nanowires and application of shape-selective Au nanoparticles in SERS studies. J. Mater. Chem. C 2013, 1, 831–842. [Google Scholar] [CrossRef]
  16. Sharma, B.; Cardinal, M.F.; Kleinman, S.L.; Greeneltch, N.G.; Frontiera, R.R.; Blaber, M.G.; Schatz, G.C.; Van Duyne, R.P. High-performance SERS substrates: Advances and challenges. Mater. Res. Soc. 2013, 38, 615–624. [Google Scholar] [CrossRef] [Green Version]
  17. Gunnarsson, L.; Bjerneld, E.J.; Xu, H.; Petronis, S.; Kasemo, B.; Käll, M. Interparticle coupling effects in nanofabricated substrates for surface-enhanced Raman scattering. Appl. Phys. Lett. 2001, 78, 802–804. [Google Scholar] [CrossRef] [Green Version]
  18. Belhout, S.A.; Baptista, F.R.; Devereux, S.J.; Parker, A.W.; Ward, A.D.; Quinn, S.J. Preparation of polymer gold nanoparticle composites with tunable plasmon coupling and their application as SERS substrates. Nanoscale 2019, 11, 19884–19894. [Google Scholar] [CrossRef]
  19. Wang, J.F.; Wu, X.Z.; Xiao, R.; Dong, P.T.; Wang, C.G. Performance-Enhancing Methods for Au Film over Nanosphere Surface-Enhanced Raman Scattering Substrate and Melamine Detection Application. PLoS ONE 2014, 9, e97967. [Google Scholar] [CrossRef] [Green Version]
  20. Wu, W.; Liu, L.; Dai, Z.; Liu, J.; Yang, S.; Zhou, L.; Xiao, X.; Jiang, C.; Roy, V.A.L. Low-Cost, Disposable, Flexible and Highly Reproducible Screen Printed SERS Substrates for the Detection of Various Chemicals. Sci. Rep. 2015, 5, 10208. [Google Scholar] [CrossRef]
  21. Holthoff, E.L.; Stratis-Cullum, D.N.; Hankus, M.E. A Nanosensor for TNT Detection Based on Molecularly Imprinted Polymers and Surface Enhanced Raman Scattering. Sensors 2011, 11, 2700–2714. [Google Scholar] [CrossRef] [Green Version]
  22. Wackerbarth, H.; Salb, C.; Gundrum, L.; Niederkrüger, M.; Christou, K.; Beushausen, V.; Viöl, W. Detection of Explosives Based on Surface-Enhanced Raman Spectroscopy. Appl. Opt. 2010, 49, 4362–4366. [Google Scholar] [CrossRef]
  23. Sulk, R.A.; Corcoran, R.C.; Carron, K.T. Surface-Enhanced Raman Scattering Detection of Amphetamine and Methamphetamine by Modification with 2-Mercaptonicotinic Acid. Appl. Spectrosc. 1999, 53, 954–959. [Google Scholar] [CrossRef]
  24. Kline, N.D.; Tripathi, A.; Mirsafavi, R.; Pardoe, I.; Moskovits, M.; Meinhart, C.; Guicheteau, J.A.; Christesen, S.D.; Fountain, A.W., III. Optimization of Surface-Enhanced Raman Spectroscopy Conditions for Implementation into a Microfluidic Device for Drug Detection. Anal. Chem. 2016, 88, 10513–10522. [Google Scholar] [CrossRef] [PubMed]
  25. Pilot, R.; Signorini, R.; Durante, C.; Orian, L.; Bhamidipati, M.; Fabris, L. A Review on Surface-Enhanced Raman Scattering. Biosensors 2019, 9, 57. [Google Scholar] [CrossRef] [PubMed] [Green Version]
  26. Kumar, E.A.; Barveen, N.R.; Wang, T.-J.; Kokulnathan, T.; Chang, Y.-H. Development of SERS platform based on ZnO multipods decorated with Ag nanospheres for detection of 4-nitrophenol and rhodamine 6G in real samples. Microchem. J. 2021, 170, 106660. [Google Scholar] [CrossRef]
  27. Barbillon, G. Fabrication and SERS Performances of Metal/Si and Metal/ZnO Nanosensors: A Review. Coatings 2019, 9, 86. [Google Scholar] [CrossRef] [Green Version]
  28. Ogundare, S.A.; van Zyl, W.E. Nanocrystalline cellulose as reducing- and stabilizing agent in the synthesis of silver nanoparticles: Application as a surface-enhanced Raman scattering (SERS) substrate. Surf. Interfaces 2018, 13, 1–10. [Google Scholar] [CrossRef]
  29. Švecová, M.; Ulbrich, P.; Dendisová, M.; Matějka, P. SERS study of riboflavin on green-synthesized silver nanoparticles prepared by reduction using different flavonoids: What is the role of flavonoid used? Spectrochim. Acta Part A Mol. Biomol. Spectrosc. 2018, 195, 236–245. [Google Scholar] [CrossRef]
  30. Liu, F.; Gu, H.; Lin, Y.; Qi, Y.; Dong, X.; Gao, J.; Cai, T. Surface-enhanced Raman scattering study of riboflavin on borohydride-reduced silver colloids: Dependence of concentration, halide anions and pH values. Spectrochim. Acta Part A 2012, 85, 111–119. [Google Scholar] [CrossRef]
  31. Kokaislová, A.; Matějka, P. Surface-enhanced vibrational spectroscopy of B vitamins: What is the effect of SERS-active metals used? Anal. Bioanal. Chem. 2012, 403, 985–993. [Google Scholar] [CrossRef]
  32. Strelchuk, V.V.; Kolomys, O.F.; Kaganovich, E.B.; Krishchenko, I.M.; Golichenko, B.O.; Boyko, M.I.; Kravchenko, S.O.; Kruglenko, I.V.; Lytvyn, O.S.; Manoilov, E.G.; et al. Optical Characterization of SERS Substrates Based on Porous Au Films Prepared by Pulsed Laser Deposition. J. Nanomater. 2015, 2015, 203515. [Google Scholar] [CrossRef] [Green Version]
  33. Dendisova-Vyškovska, M.; Kokaislová, A.; Ončak, M.; Matějka, P. SERS and in situ SERS spectroscopy of riboflavin adsorbed on silver, gold and copper substrates. Elucidation of variability of surface orientation based on both experimental and theoretical approach. J. Mol. Struct. 2012, 1038, 19–28. [Google Scholar] [CrossRef]
  34. Dustov, M.; Golovina, D.I.; Polyakov, A.Y.; Goldt, A.E.; Eliseev, A.A.; Kolesnikov, E.A.; Sukhorukova, I.V.; Shtansky, D.V.; Grünert, W.; Grigorieva, A.V. Silver Eco-Solvent Ink for Reactive Printing of Polychromatic SERS and SPR Substrates. Sensors 2018, 18, 521. [Google Scholar] [CrossRef] [Green Version]
  35. Lee, H.K.; Lee, Y.H.; Koh, C.S.L.; Phan-Quang, G.C.; Han, X.; Lay, C.L.; Ling, X.Y.; Sim, H.Y.F.; Kao, Y.-C.; An, Q.; et al. Designing surface-enhanced Raman scattering (SERS) platforms beyond hot-spot engineering: Emerging opportunities in analyte manipulations and hybrid materials. Chem. Soc. Rev. 2019, 48, 731–756. [Google Scholar] [CrossRef]
  36. Bonyár, A.; Csarnovics, I.; Veres, M.; Himics, L.; Csik, A.; Kaman, J.; Balázs, L.; Kökényesi, S. Investigation of the performance of thermally generated gold nanoislands for LSPR and SERS applications. Sens. Actuators B Chem. 2018, 255, 433–439. [Google Scholar] [CrossRef]
  37. Clark, D.E. What has polar surface area ever done for drug discovery? Future Med. Chem. 2011, 3, 469–484. [Google Scholar] [CrossRef]
  38. National Center for Biotechnology Information. PubChem Compound Summary for CID 493570, Riboflavin. 2021. Available online: https://pubchem.ncbi.nlm.nih.gov/compound/Riboflavin (accessed on 26 March 2021).
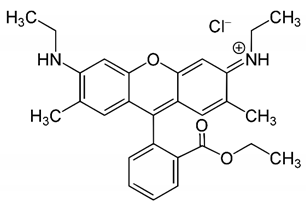
  39. National Center for Biotechnology Information. PubChem Compound Summary for CID 13806, Rhodamine 6G. 2021. Available online: https://pubchem.ncbi.nlm.nih.gov/compound/Rhodamine-6G (accessed on 26 March 2021).
  40. Van Dyck, C.; Fu, B.; Van Duyne, R.P.; Schatz, G.C.; Ratner, M.A. Deducing the Adsorption Geometry of Rhodamine 6G from the Surface-Induced Mode Renormalization in Surface-Enhanced Raman Spectroscopy. J. Phys. Chem. C 2017, 122, 465–473. [Google Scholar] [CrossRef]
  41. Monserud, J.H.; Schwartz, D.K. Effects of molecular size and surface hydrophobicity on oligonucleotide interfacial dynamics. Biomacromolecules 2012, 13, 4002–4011. [Google Scholar] [CrossRef] [Green Version]
  42. Tian, F.; Bonnier, F.; Casey, A.; Shanahan, A.E.; Byrne, H.J. Surface enhanced Raman scattering with gold nanoparticles: Effect of particle shape. Anal. Methods 2014, 6, 9116–9123. [Google Scholar] [CrossRef] [Green Version]
  43. Wang, J.; Qiu, C.; Mu, X.; Pang, H.; Chen, X.; Liu, D. Ultrasensitive SERS detection of rhodamine 6G and p-nitrophenol based on electrochemically roughened nano-Au film. Talanta 2019, 210, 120631. [Google Scholar] [CrossRef]
  44. Xu, D.; Jiang, H.; Yang, W.; Zhang, S.; Chen, J. SERS effect of Rhodamine 6G molecular probe on AgAu alloy nanowire arrays by a solid-state ionics method. Phys. E Low-Dimens. Syst. Nanostruct. 2018, 102, 132–136. [Google Scholar] [CrossRef]
  45. Volochanskyi, O.; Švecová, M.; Bartůněk, V.; Prokopec, V. Electroless deposition via galvanic displacement as a simple way for the preparation of silver, gold, and copper SERS-active substrates. Colloids Surf. A Physicochem. Eng. Asp. 2021, 616, 126310. [Google Scholar] [CrossRef]
Figure 1. SEM image of a gold nanoislands sample (Sample 7): (a) freshly prepared; (b) after washing.
Applsci 11 09838 g001
Figure 2. Raman spectra of riboflavin measured on gold nanoislands SERS and pure glass substrates, and in solid form.
Applsci 11 09838 g002
Figure 3. Raman spectra of rhodamin 6G measured on gold nanoisland SERS and pure glass substrates, and in solid form.
Applsci 11 09838 g003
Figure 4. Surfaced-enhanced Raman signal of riboflavin measured with two excitation wavelengths.
Applsci 11 09838 g004
Figure 5. Surfaced-enhanced Raman signal of rhodamine 6G measured with two excitation wavelengths.
Applsci 11 09838 g005
Figure 6. Normalized absorbance of the gold nanoisland SERS substrate: (a) clean substrate, and with riboflavin and R6G solutions; (b) normal absorbance of analyte solutions.
Applsci 11 09838 g006aApplsci 11 09838 g006b
Table 1. Production parameters of gold nanoisland substrates.
Sample No.Initial Layer
Thickness
(nm)
Annealing
Temperature
(°C)
Annealing
Time
(min)
1950015
2950060
3955015
41245015
5955060
612450120
7945060
81255060
91250060
101255015
111250030
12945030
13945015
149450120
151250015
16950030
17955060
1812550120
Table 2. Raman measurement parameters for riboflavin and rhodamine 6G.
RiboflavinRhodamin 6G
Applsci 11 09838 i001 Applsci 11 09838 i002
Excitation wavelength532 nm633 nm532 nm633 nm
Laser intensity3.2%, 0.9 mW/cm21%, 0.06 mW/cm20.1%, 0.03 mW/cm21%, 0.06 mW/cm2
Measurement time30 s40 s30 s30 s
Accumulation571010
Table 3. The plasmon wavelength of gold nanoislands SERS with different analyte solutions, and their associated EF values.
Sample
No.
Plasmon Wavelength of Gold Nanoisland Substrate with R6G, nmSERS Enhancement Factor for Different ExcitationsPlasmon Wavelength of Gold Nanoisland Substrate with Riboflavin, nmSERS Enhancement Factor for Different Excitations
532 nm633 nm532 nm633 nm
156959.98 +/− 1.811.69 +/− 0.0459310.46 +/− 0.1516.28 +/− 0.29
254585.31 +/− 2.9931.99 +/− 0.8058614.71 +/− 0.2233.76 +/− 0.89
353985.06 +/− 2.982.67 +/− 0.095702.04 +/− 0.091.89 +/− 0.03
4593145.06 +/− 2.4554.12 +/− 1.896075.93 +/− 0.2369.82 +/− 1.51
553244.85 +/− 1.571.5 +/− 0.035581.57 +/− 0.034.51 +/− 0.08
6636172.58 +/− 2.5912.30 +/− 0.186439.81 +/− 0.30207.12 +/− 4.11
758987.97 +/− 3.084.08 +/− 0.066222.71 +/− 0.11100.48 +/− 1.92
8548154.11 +/− 5.3928.15 +/− 0.625692.21 +/− 0.093.53 +/− 0.07
9582183.94 +/− 3.6810.96 +/− 0.246009.65 +/− 0.2822.37 +/− 0.42
10547259.17 +/− 10.3732.30 +/− 0.715715.50 +/− 0.2035.64 +/− 0.75
1155786.20 +/− 3.021.76 +/− 0.0459228.69 +/− 0.6721.87 +/− 0.52
1255993.40 +/− 2.343.79 +/− 0.0559515.64 +/− 0.3927.55 +/− 0.65
13557158.83 +/− 5.5654.43 +/− 1.725879.80 +/− 0.3515.29 +/− 0.35
14556104.82 +/− 2.626.58 +/− 0.2558416.90 +/− 0.4240.06 +/− 0.82
15582109.25 +/− 2.7318.09 +/− 0.416132.82 +/− 0.037.71 +/− 0.42
1661361.91 +/− 3.105.48 +/− 0.216552.75 +/− 0.04127.75 +/− 2.11
1754067.35 +/− 3.3722.45 +/− 0.4958612.33 +/− 0.2918.88 +/− 0.42
1857356.23 +/− 2.532.54 +/− 0.066274.63 +/− 0.1976.47 +/− 2.25
Publisher’s Note: MDPI stays neutral with regard to jurisdictional claims in published maps and institutional affiliations.

