Article

Effect of Micro-Textured Surfaces and Sliding Speed on the Lubrication Mechanism and Friction-Wear Characteristics of CF/PEEK Rubbing against 316L Stainless Steel under Seawater Lubrication

1
School of Mechanical Engineering, Yanshan University, Qinhuangdao 066004, China
2
Heibei Provincial Key Laboratory of Heavy Machinery Fluid Power Transmission and Control, Yanshan University, Qinhuangdao 066004, China
*
Authors to whom correspondence should be addressed.
Appl. Sci. 2021, 11(21), 9915; https://doi.org/10.3390/app11219915
Submission received: 3 September 2021 / Revised: 20 October 2021 / Accepted: 20 October 2021 / Published: 23 October 2021

Abstract

:
In this work, the lubrication mechanism and friction-wear characteristics of the friction pair between carbon-fiber-reinforced polyether ether ketone (CF/PPEK) and 316L stainless steel with a micro-hemispherical pit textured surface at different sliding speeds under seawater lubrication were studied through numerical simulation and experimental investigation. The study results indicate that the seawater moves following the sliding direction of the upper specimen, forms a vortex ring flow in the hemispherical pit of the bottom specimen, uses the convergent gap to generate a hydrodynamic effect, produces the bearing capacity, and realizes fluid lubrication. The hemispherical pit diminishes the abrasive wear during the friction process by storing the wear debris, and the main wear forms of the hemispherical-pit surface friction pair are oxidative wear and adhesive wear. The friction coefficient of the hemispherical-pit surface friction pair is 0.018–0.027, the specimen contact temperature is 40.2–55.1 °C, and it is always in the hydrodynamic lubrication state in a rotation speed ranging from 1000 r/min to 1750 r/min. As the sliding speed increases, the specimen contact temperature climbs, and the oxidation reaction gradually becomes full. Oxidative wear and adhesive wear alternately play a dominant role in the friction, and the wear rate first decreases and then increases sharply.

1. Introduction

The surface of an organism not only protects the internal tissue of the organism from the damage of the external environment but also carries on the exchange of material, energy and information with the outside world. Animals that live in different environments, such as shark, sandfish, lizard, Stenocara and Copris ochus, have beautiful macro- and orderly micro- structures on their body surfaces. These orderly non-smooth micro structures can reduce the adhesion and wear of the body surface with the surrounding water or sand in the friction process [1,2]. Inspired by this, biomimetic textured surface technology, which applies the orderly micro structures of the organisms’ body surfaces to mating surfaces of various friction pairs to improve their tribological properties, gradually developed into an attractive approach [3,4,5,6,7,8,9].
After an experimental study on thrust bearings, Salama [10] proposed that the presence of a certain roughness between two friction surfaces parallel to each other could produce a supporting load and achieve the fluid lubrication. Kramer [11] suggested that the non-smooth morphology of dolphin skin enabled water to flow steadily through the dolphin’s surface, and enabled the transformation point of turbulence to push back, so that the adhesion resistance of the dolphin’s surface could be significantly reduced. Hamilton et al. [12] found that a non-smooth surface in the form of micro-asperities could play the role of micro-hydrodynamic bearings and create a load carrying capacity. On the basis of theoretical analysis and experimental verification, Anno et al. [13,14] proposed that there was a hydrodynamic pressure distribution existing at the micro-morphologies of the relatively parallel surfaces, and the oil film separated the two parallel surfaces to reduce wear. The above-mentioned scholars built a beacon for the exploration of lubrication and friction study of textured surfaces.
Following the pioneers, Etsion carried out a systematic study of the tribological properties of biomimetic textured surfaces. They showed that a mechanical seal model of hemispherical micro-dimples evenly distributed on one of the mating surfaces could significantly improve the sealing performance [15]. Then, an experimental study on seal rings with a laser-textured surface under oil lubrication conditions was carried out. The results showed that the depth-to-diameter ratio of the dimple was the most effective parameter for the optimization of the load capacity, and there was an optimum value to maximize the oil film stiffness and the pv factor [16,17,18,19]. It was found in theoretical and experimental studies of thrust bearings and piston rings that the partial texture had better tribological properties and fewer consumptions than the full texture [20,21].
Ren et al. [22] showed that the speed, load, time, topography and distribution all influenced the wear resistance, and the wear resistance decreased according to the pit, convex hull, corrugation and scale. Wakuda et al. [23] used cylindrical hardened steel and planar silicon nitride ceramic to form pin-type friction pairs, and machined dimples with different sizes, densities and shapes on the surface of silicon nitride ceramic samples for friction-wear tests. The test results suggested that a friction coefficient reduction of samples from 0.12 (with the smooth surface) to 0.10 (with the micro-dimple surface) was successfully achieved, recommending a dimple surface with a diameter of approximately 100 μm and a density of 5–20%. Andersson et al. [3] investigated the beneficial effect of micro-texturing surfaces processed through laser ablation and polishing on lubrication in sliding. It was found that a combination of a high viscosity oil and a low density texture comprised of deep micro-cavities with small openings most significantly improved the tribological properties. Yang et al. [24] conducted an experimental study on the friction and wear characteristics of textured-surface W9Cr4V high-speed steel specimens with different sizes and distribution densities at high temperatures, and applied the experimental results to the roller surface. Wang et al. [25] designed a mixed-texture pattern on an SiC surface, which was composed of a large circle (diameter of 350 μm) and small rectangular (length of 40 μm) dimples, to improve its load carrying capacity sliding in water. It was found that such a mixed-texture pattern generated a higher critical load than that of large or small dimples only, and three times higher than that of an untextured surface. Chen et al. [26] analyzed the effects of the shape, size, distribution and arrangement of non-smooth units on drag reduction performance by calculating the aerodynamic drag coefficient of an automobile.
Faced with the two problems of the energy crisis and environmental pollution, green transmission technology using natural seawater instead of oil as the working medium has demonstrated great advantages. However, some technical problems, such as friction and wear, caused by the low viscosity, poor lubricity, and high vaporization pressure of seawater during the application process need to be solved [27,28]. This study introduced a biomimetic textured surface into slipper pairs to settle the aggravated friction and wear of seawater axial piston pumps. The CFD method was used to investigate the hydrodynamic lubrication mechanism of the slipper pair with a hemispherical-pit surface. Rotational sliding tests under seawater lubrication at different sliding speeds were conducted on the MMD-5A friction and wear tester. The experimental method was used to explore and analyze the friction and wear characteristics of CF/PEEK and 316L stainless steel friction pairs with a hemispherical-pit surface.

2. Numerical Approach

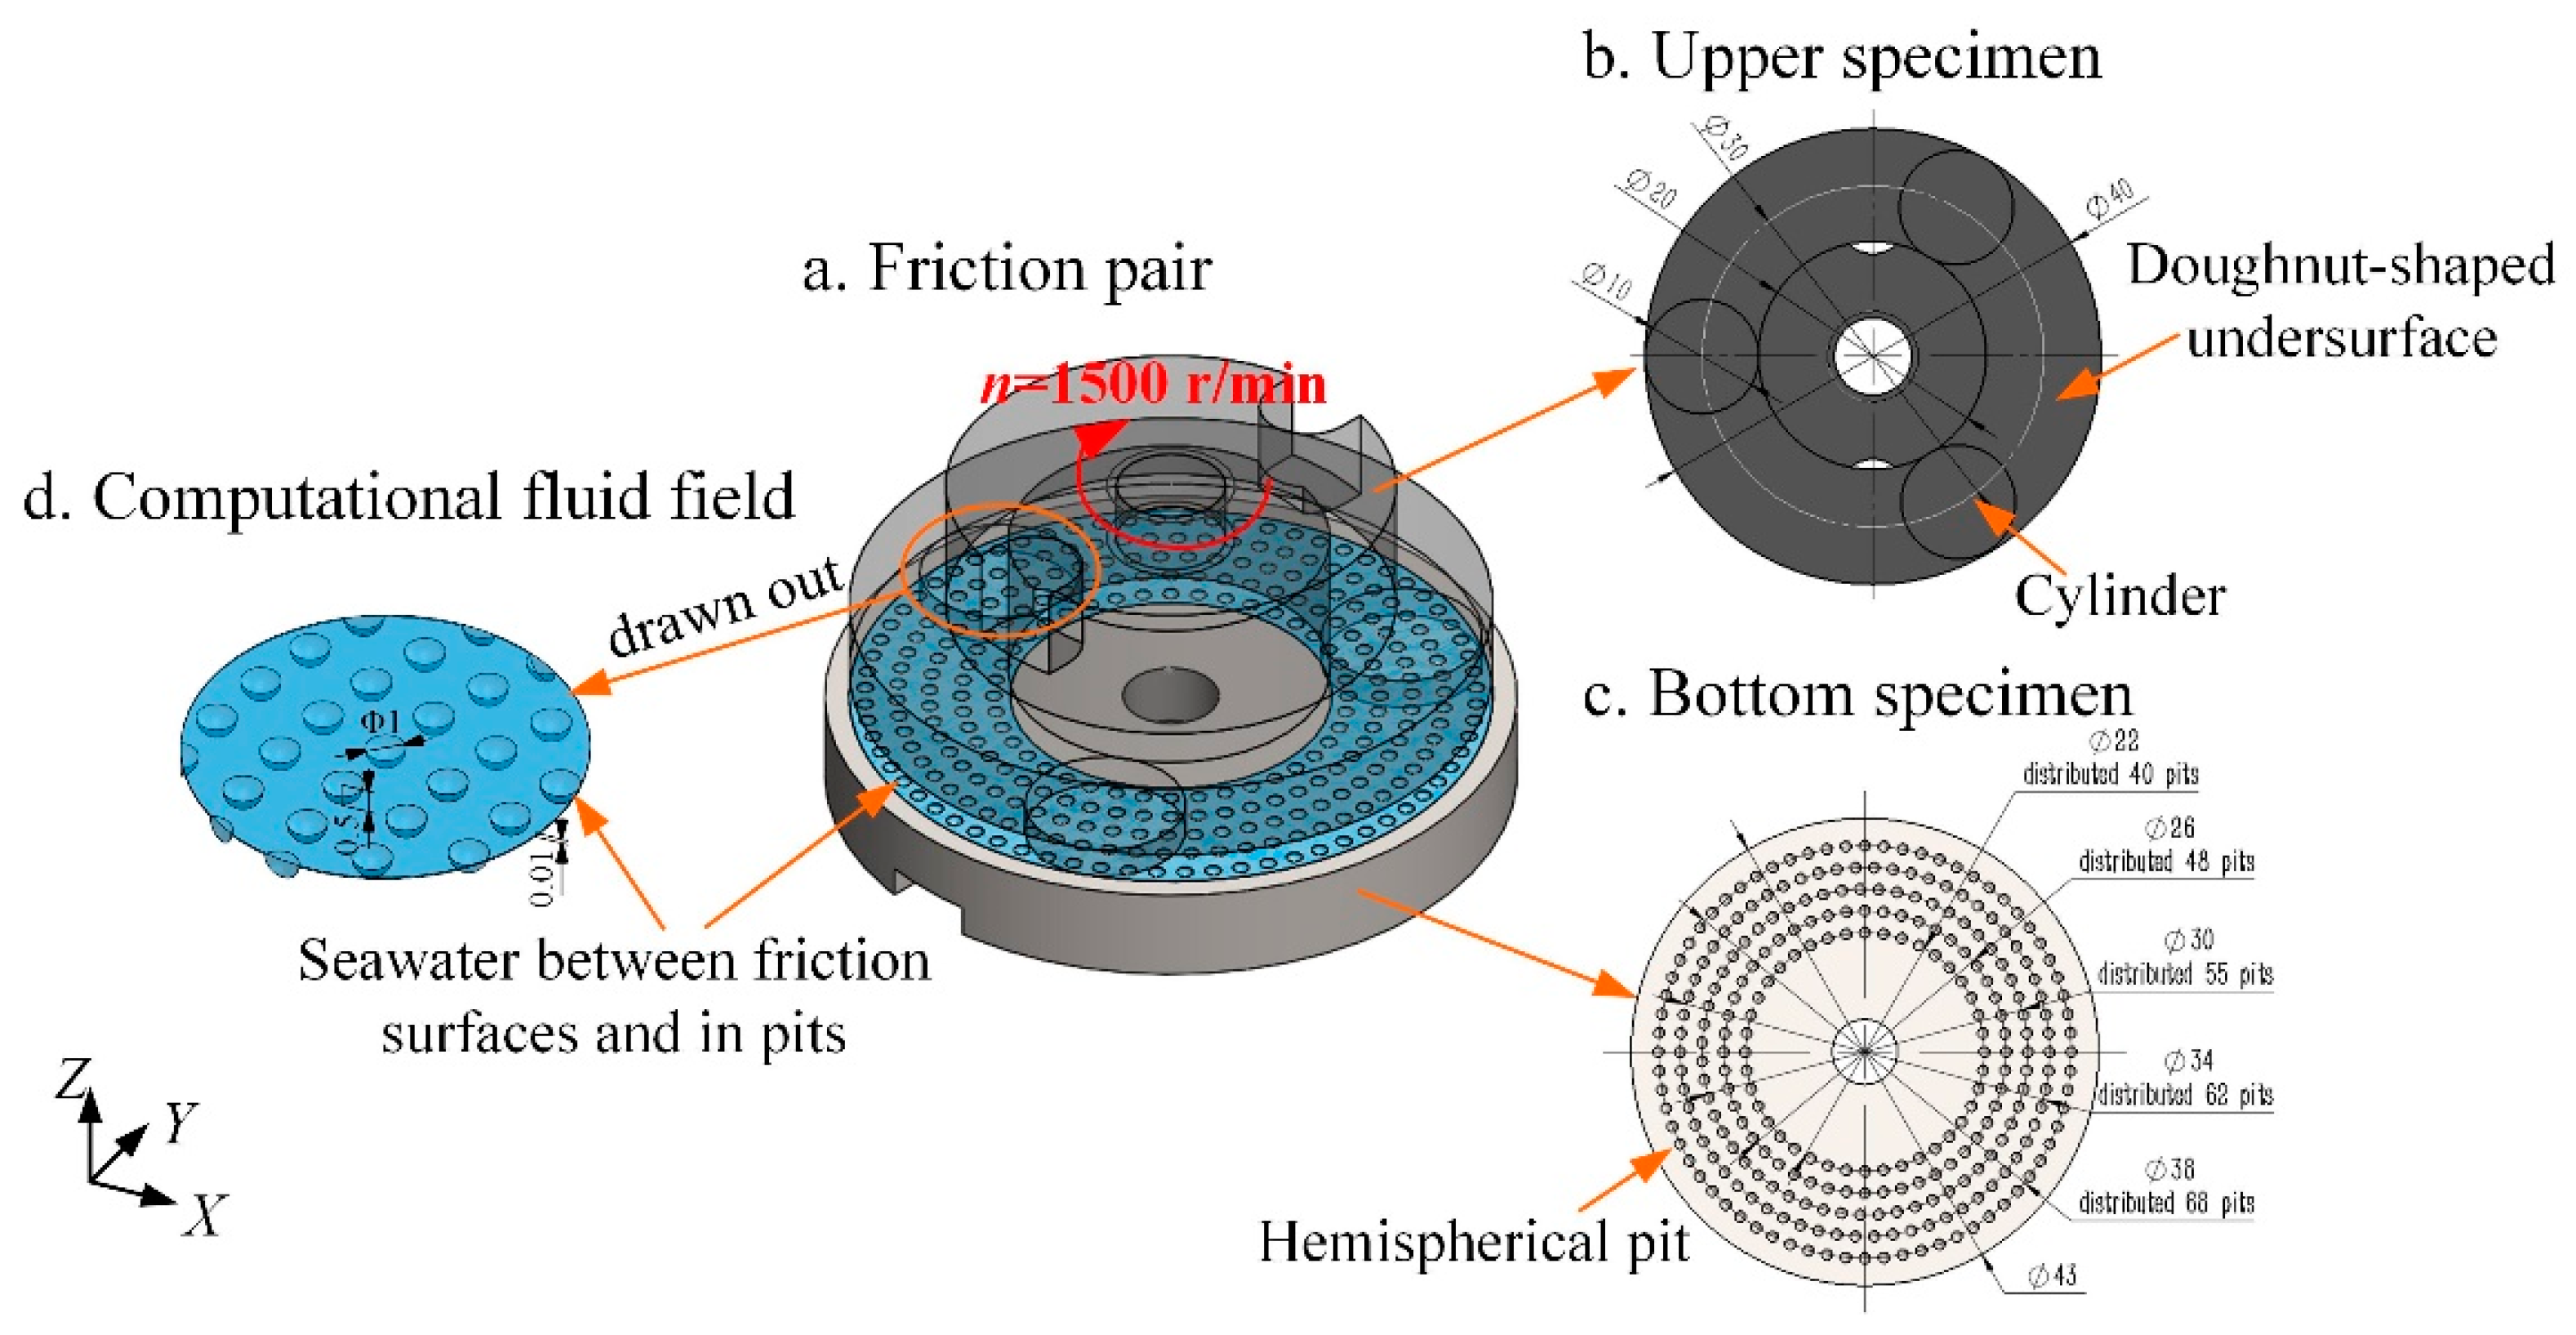
2.1. Model Description

Imitating the slipper pair of the seawater axial piston pump, a three-dimensional lubrication model of a friction pair with a hemispherical-pit surface for numerical simulation was established, as shown in Figure 1a. There were three smooth cylinders (10 mm in diameter, 2 mm in height) on the doughnut-shaped undersurface (40 mm in outer diameter, 20 mm in inner diameter) of the upper specimen, as shown in Figure 1b. Hemispherical pits (0.5 mm in radius) were arranged on the bottom specimen’s (43 mm in diameter, 6 mm in height) surface, as shown in Figure 1c. There were 40, 48, 55, 62 and 68 pits uniformly distributed on the circles of d1 = 22 mm, d2 = 26 mm, d3 = 30 mm, d4 = 34 mm and d5 = 38 mm, respectively. This arrangement allows the radial spacing and circumferential spacing between the pits to be approximately equal, and the pit area ratio is about 22.75%. Supposing that the friction pair was in a state of full water lubrication, the seawater between one of the cylinders and the bottom specimen was drawn as a computational fluid field for the numerical simulation, as shown in Figure 1d. Since the viscosity of seawater is only 1/30 that of mineral oil, the matching clearance of the slipper pair of the seawater pump can only reach 1/3 that of an oil pump, and it is about 10 μm [29]. A three-dimensional lubrication model of the friction pair with a smooth surface was used as the comparison group.

2.2. Governing Equation

The working medium is seawater, which is a Newtonian fluid. The flow of the seawater in the narrow space between friction surfaces should follow the Navier–Stokes equation. A Navier–Stokes equation is employed to describe the problem studied.
{ u x + v y + w z = 0 ρ ( u u x + v u y + w u z ) = p x + η ( 2 u x 2 + 2 u y 2 + 2 u z 2 ) ρ ( u v x + v v y + w v z ) = p y + η ( 2 v x 2 + 2 v y 2 + 2 v z 2 ) ρ ( u w x + v w y + w w z ) = p z + η ( 2 w x 2 + 2 w y 2 + 2 w z 2 )
where u, v and w are the velocity vectors in directions x, y and z; ρ is the density of seawater (1.025 g/cm3); η is the dynamic viscosity of seawater (6.15 × 10⁻⁴ Pa·s); and p is the pressure of the lubricating film.

2.3. Simulation Strategy

The commercial CFD solving software Fluent (ANSYS, Inc., Canonsburg, PA, USA) was used to conduct the numerical simulation of the friction pair with a hemispherical-pit surface. For the computational fluid field shown in Figure 1d, compared with the pit depth (0.5 mm), the seawater film thickness is extremely thin (10 μm). Therefore, the seawater between the friction surfaces and in the pits should be meshed respectively. The upper surface of the seawater film was first meshed with quadrilateral face grids, with a grid number of 98,990. Then, the face grids were stretched into volume grids along the direction of the seawater film’s thickness, with a layer number of five to avoid the distortion rate of the body grid being too large. The seawater in the pits was meshed with tetrahedron grids, with an approximate grid number of 30,000,000.
The flow of seawater film is similar to a plate differential pressure flow where Re is about 50, and can be regarded as a laminar state. On the other hand, for the seawater in the pits, considering the surface roughness of the solid, the low viscosity of seawater means that the flow inertia force is almost in the same order of magnitude as the viscosity force [30], which is vulnerable to generate local eddy currents in the pits and around the micro-peaks. The Re is about 2483, and can be regarded as a turbulence state. Therefore, the standard k-ε viscous model was selected for the calculation.
The upper surface of the seawater film was set to the moving wall boundary condition (rotational motion, clockwise around the specimen axis, n = 1500 r/min). The bottom surface of the seawater film and the upper surfaces of the pits were set to the interface boundary condition to transmit data between these two parts. The bottom surfaces of the pits were set to the stationary wall boundary condition. The front half cylinder surface of the seawater film (along the direction of rotation) was set to the pressure-inlet boundary condition, and the back half was set to the pressure-outlet boundary condition.

3. Experimental Details

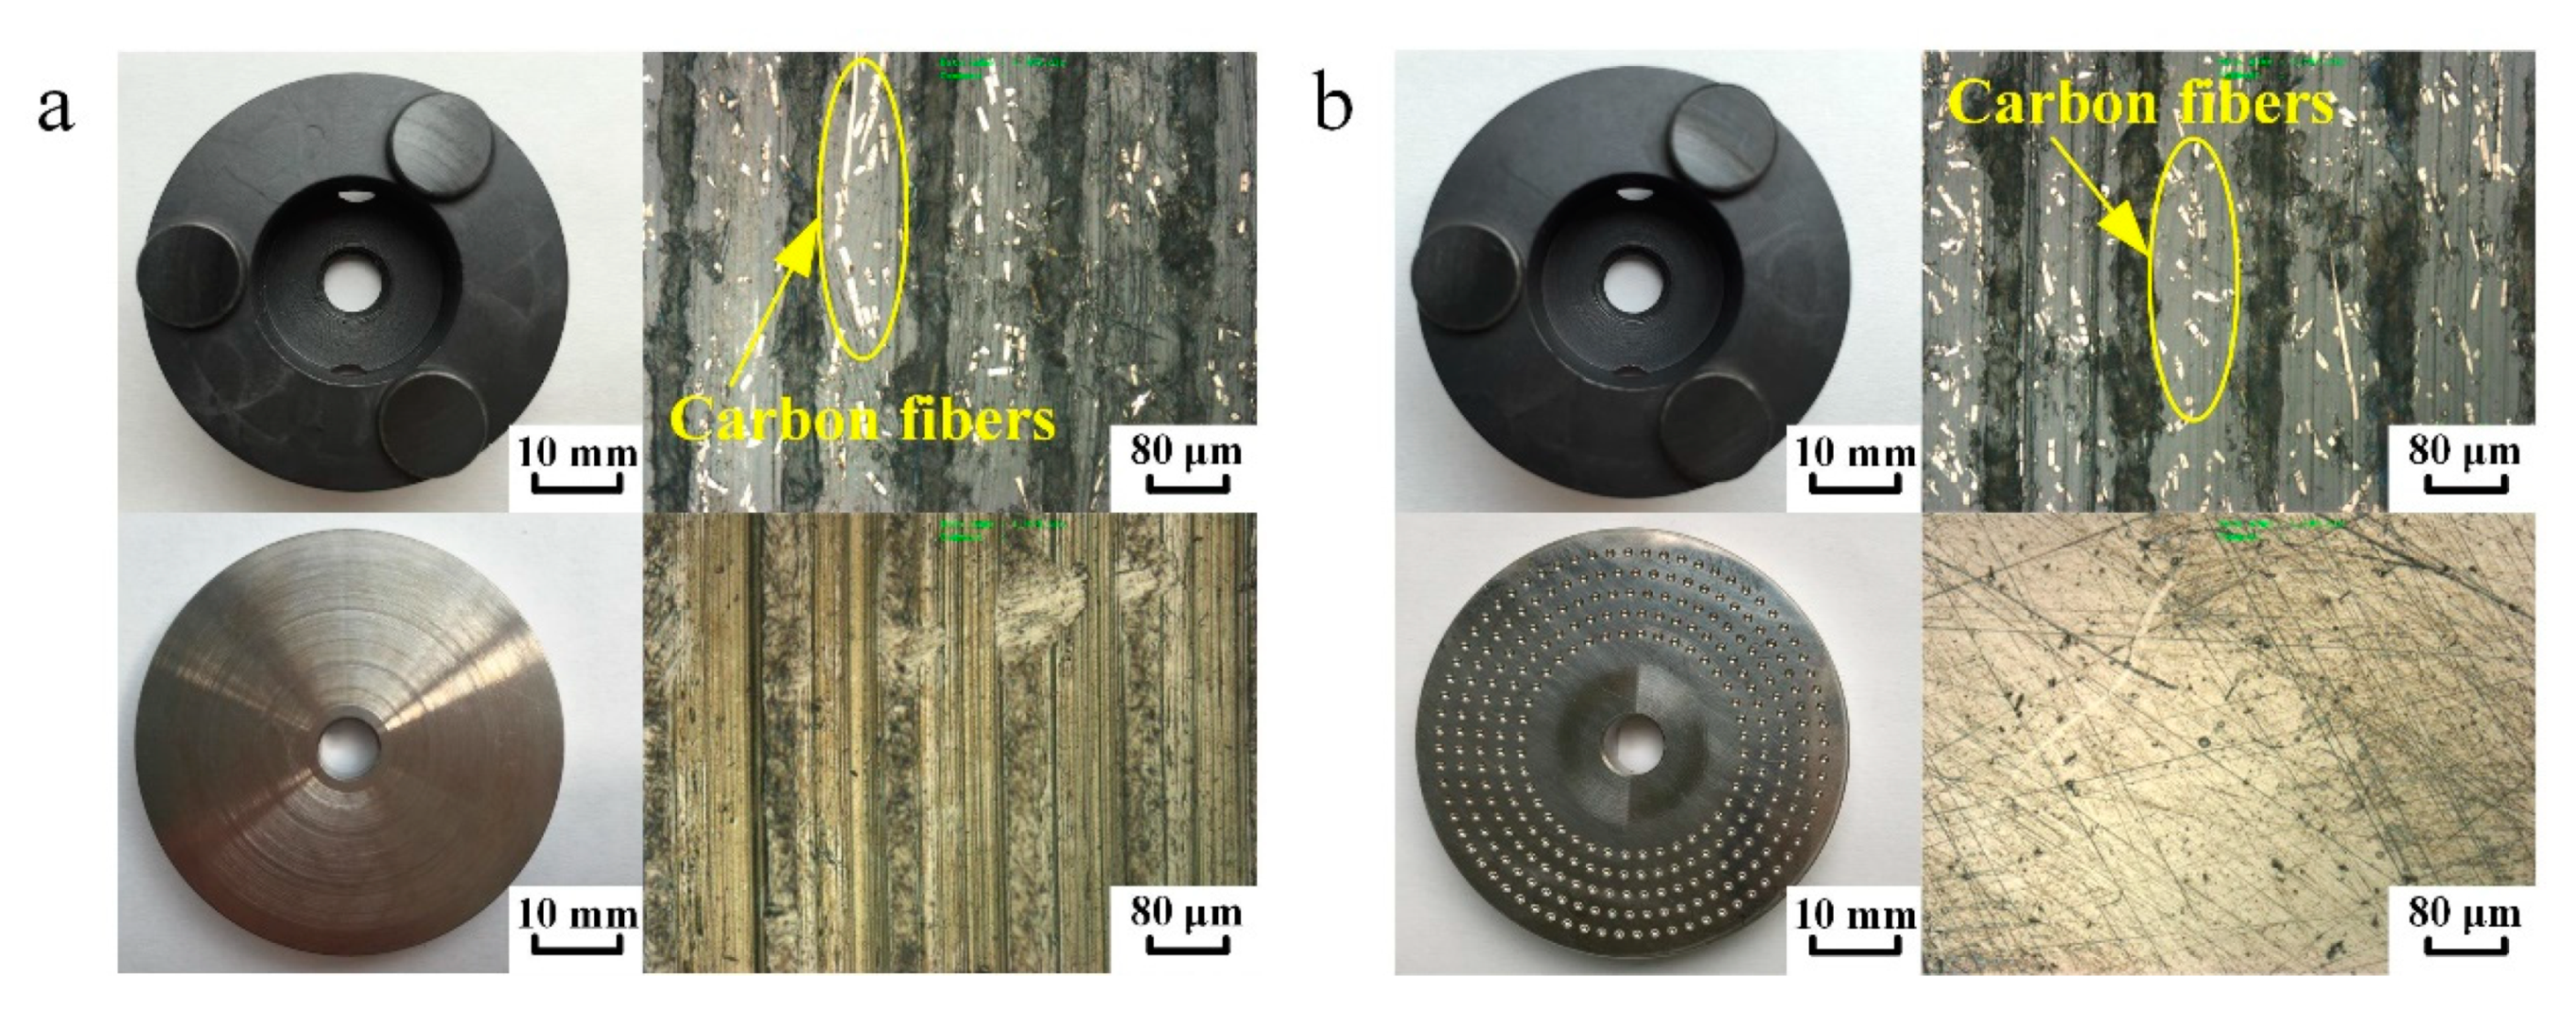
3.1. Materials and Specimens

PEEK is a good self-lubricating material, which has excellent mechanical, heat-resistance and chemical-resistance properties, and has good load-bearing meshing properties and a low friction coefficient. On this basis, the addition of carbon fiber not only increases its mechanical properties, but also has an important impact on its friction properties. Table 1 summaries the physical and mechanical properties of CK/PEEK.
Stainless steel has good corrosion resistance, heat resistance, low-temperature strength and mechanical properties. Due to the addition of the element Mo, 316L stainless steel has greatly improved corrosion resistance (it can more effectively resist the corrosion of chlorides) and high-temperature resistance strength, making it very suitable for applications in a seawater environment. Table 2 and Table 3 display the chemical constituents and the physical and mechanical properties of 316L stainless steel.
As shown in Figure 2, CF/PEEK and 316L stainless steel were selected to make the upper specimen and the bottom specimen using a CNC machine tool. The structure and size of the specimens were consistent with the lubrication model in the numerical simulation. The original surface morphology of the friction pair is also shown in Figure 2.

3.2. Lubricating Medium

Natural seawater was taken in the Qinhuangdao area of the Bohai Sea as the lubricating medium for this friction and wear test. The density of seawater is 1.025 g/cm3, the dynamic viscosity is 6.15 × 10⁻⁴ Pa·s, and the main chemical components are illustrated in Table 4, as measured according to GB 17378.4-2007 [31]. Before the tests, a series of treatments should be performed on the seawater, such as killing the microorganisms in it, letting it stand for 24 h, and filtering the saturated crystalline salt and impurities with filter papers.

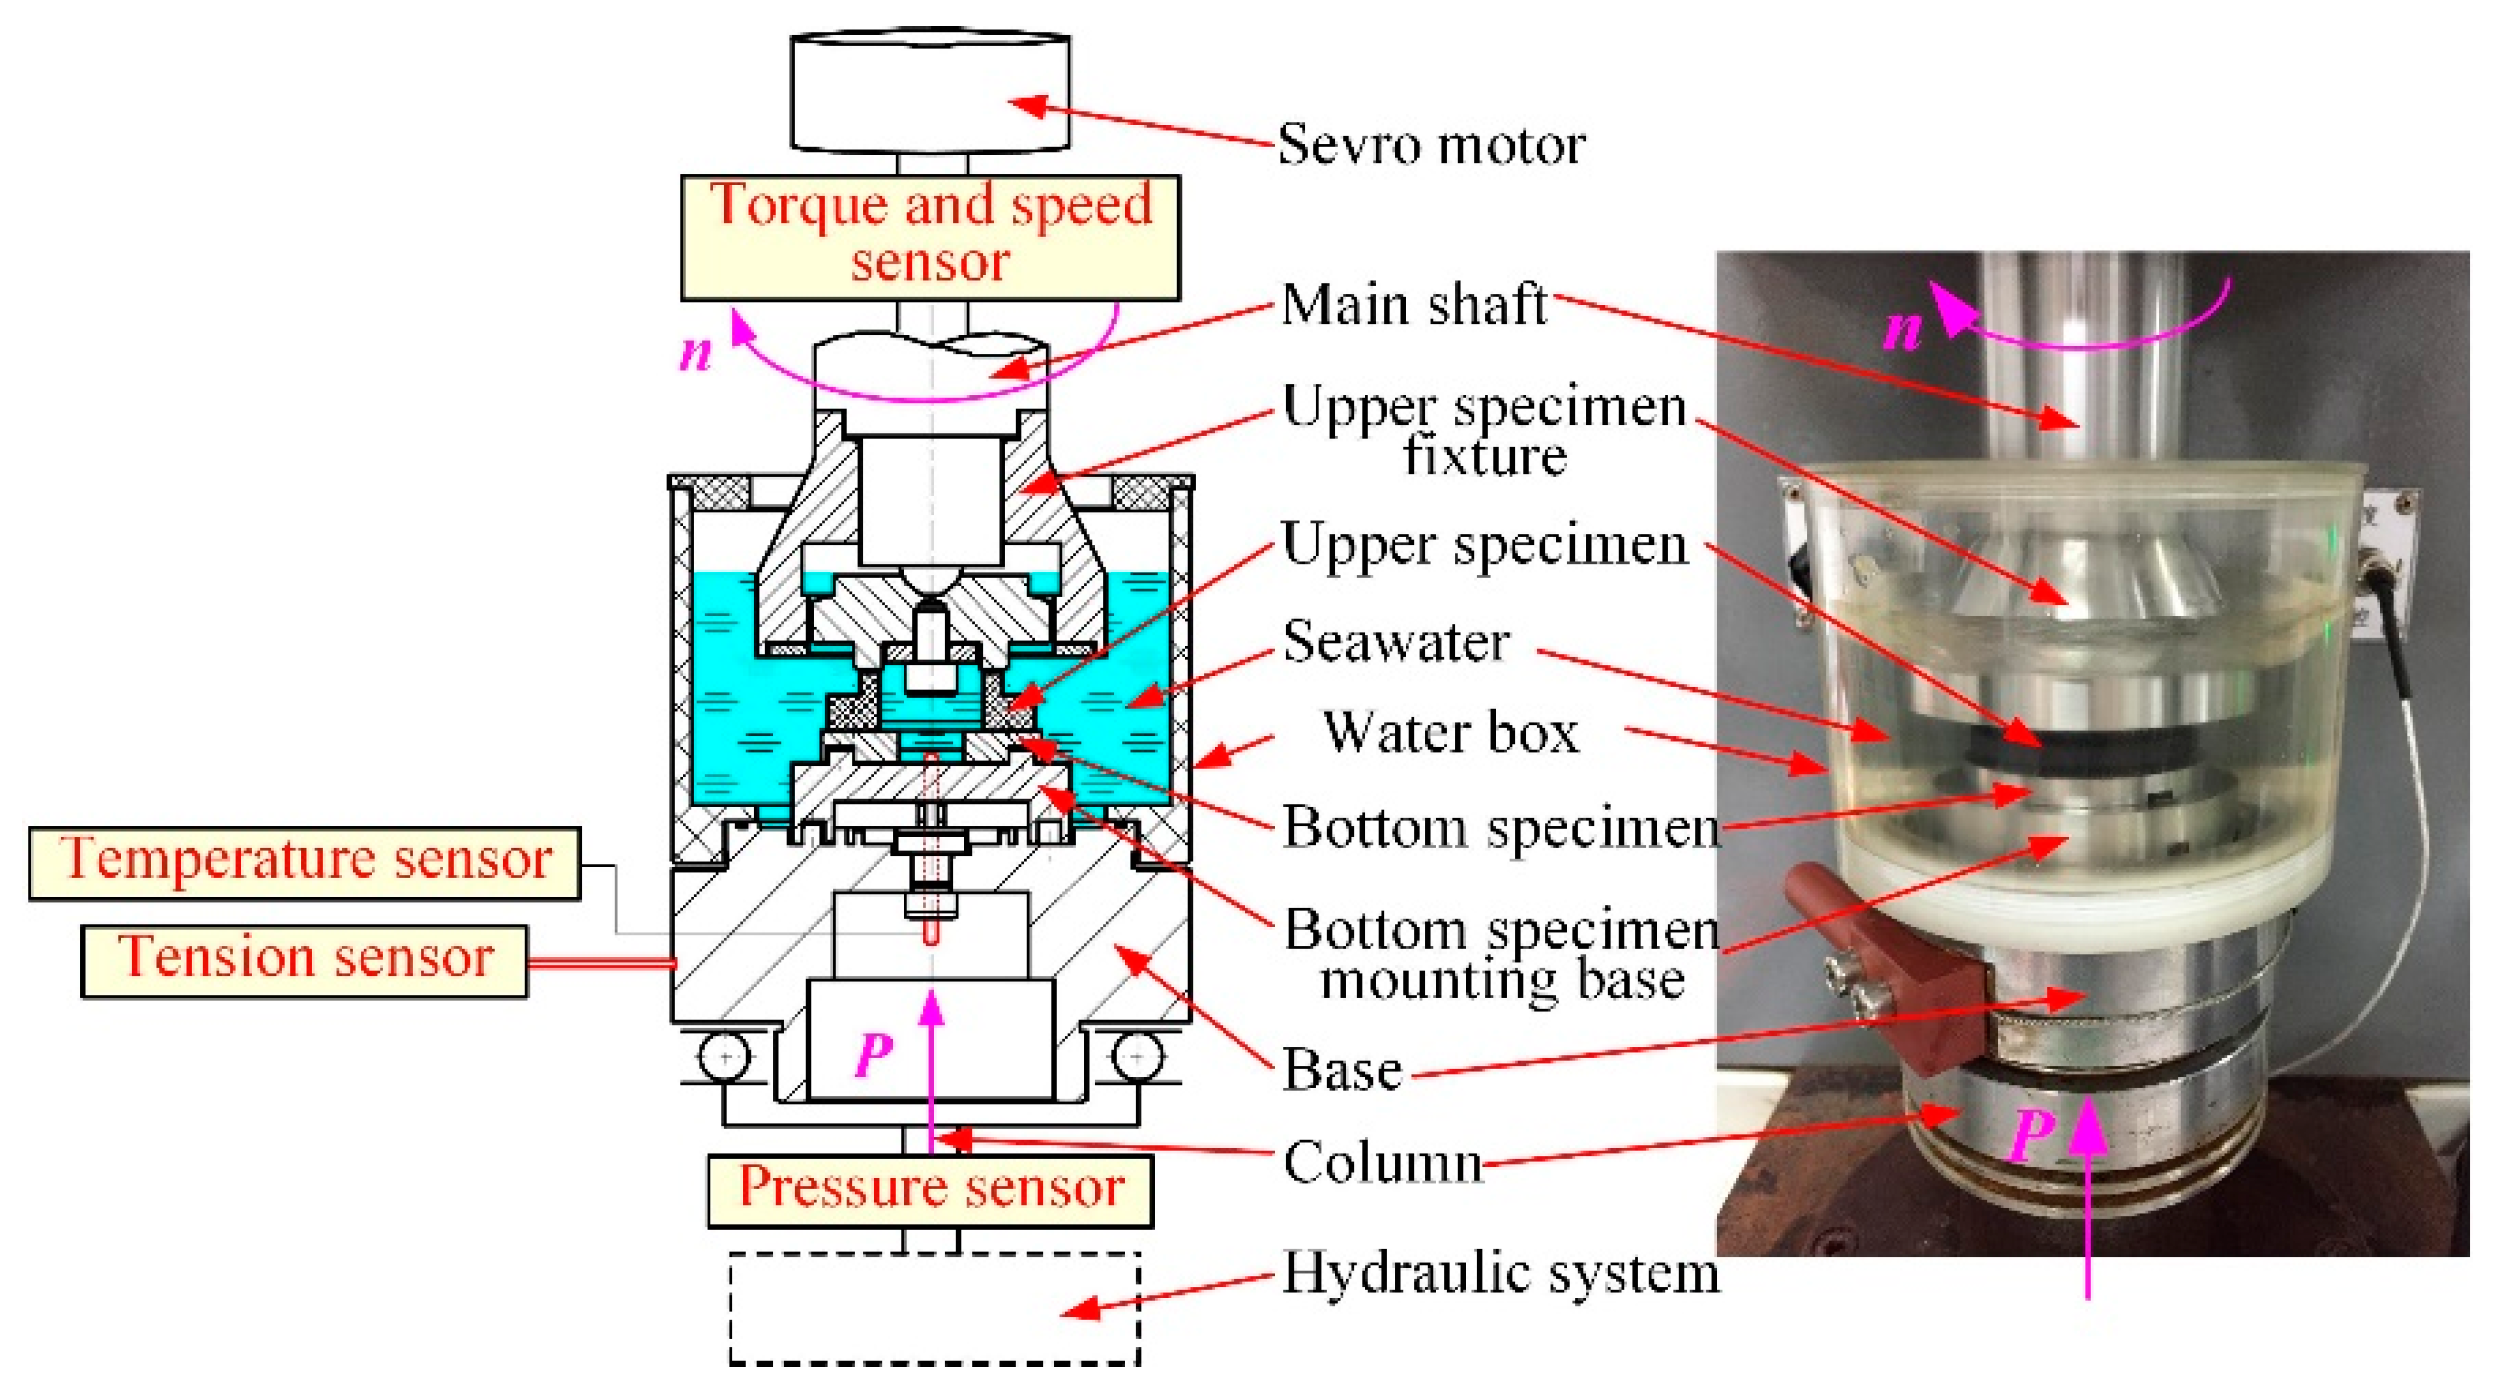
3.3. Experimental Setup and Principle

Some pre-treatments should be conducted on the specimens before the test, including cleaning them ultrasonically in an acetone solution (Youshun Chemical Co., Ltd, Taishan, China) for 20 min, drying them in the air, weighing them with an electronic balance, and observing and measuring their original morphologies using laser scanning confocal microscopy (LSCM, Olympus Manufacturing, Tokyo, Japan).
The rotating sliding test was carried out on an MMD-5A friction and wear tester (Chenda Manufacturing, Jinan, China). The test principle and specimen installation are shown in Figure 3. The servo motor is connected to the main shaft and drives it to rotate, and the speed is measured by a torque and speed sensor. The column, which is the piston rod of the hydraulic cylinder, is connected to the base, lifted and loaded by the hydraulic system, and the load is measured by a pressure sensor. The upper and bottom specimens are respectively fixed on the main shaft and the base through the upper specimen fixture and the bottom specimen mounting seat, forming a rotating-loaded motion mode which is similar to a slipper pair. A plexiglass water box is equipped on the base, and was injected with 260 mL seawater before each test to ensure that the friction pair is under seawater lubrication during the entire sliding process. The temperature of the specimen was measured by a temperature sensor which was in contact with the bottom specimen through the base. The friction force between the upper and bottom specimen was measured by a tension sensor, which was connected to the base through a steel wire.
After the test, some post-processes need to be carried out for the specimens, such as another ultrasonic cleaning, drying, weighing, and wear-surface morphology observation and measurement. Beside LSCM observation, a secondary electron signal scanning electron microscope (SEM, Hitachi Manufacturing, Tokyo, Japan) was used to observe the wear surface morphology, and to perform the energy-dispersive X-Ray spectroscopy (EDS, Hitachi Manufacturing, Tokyo, Japan) analysis under the conditions of 20 kV in the acceleration voltage, and about 10 mm in the working distance.

3.4. Working Conditions and Testing Program

The working conditions and testing program are summarized in Table 5. Four different sliding speeds were tested on the smooth-surface friction pair and the hemispherical-pit surface friction pair, respectively. According to the actual speed of the seawater axial piston pump, the rotation speed range was 1000–1750 r/min, corresponding to a sliding speed range of 1.57–2.75 m/s. Considering the hardness of CF/PEEK, the load was 300 N. The friction and wear test under the same working conditions was repeated three times, using a pair of new specimens each time.

4. Results and Discussion

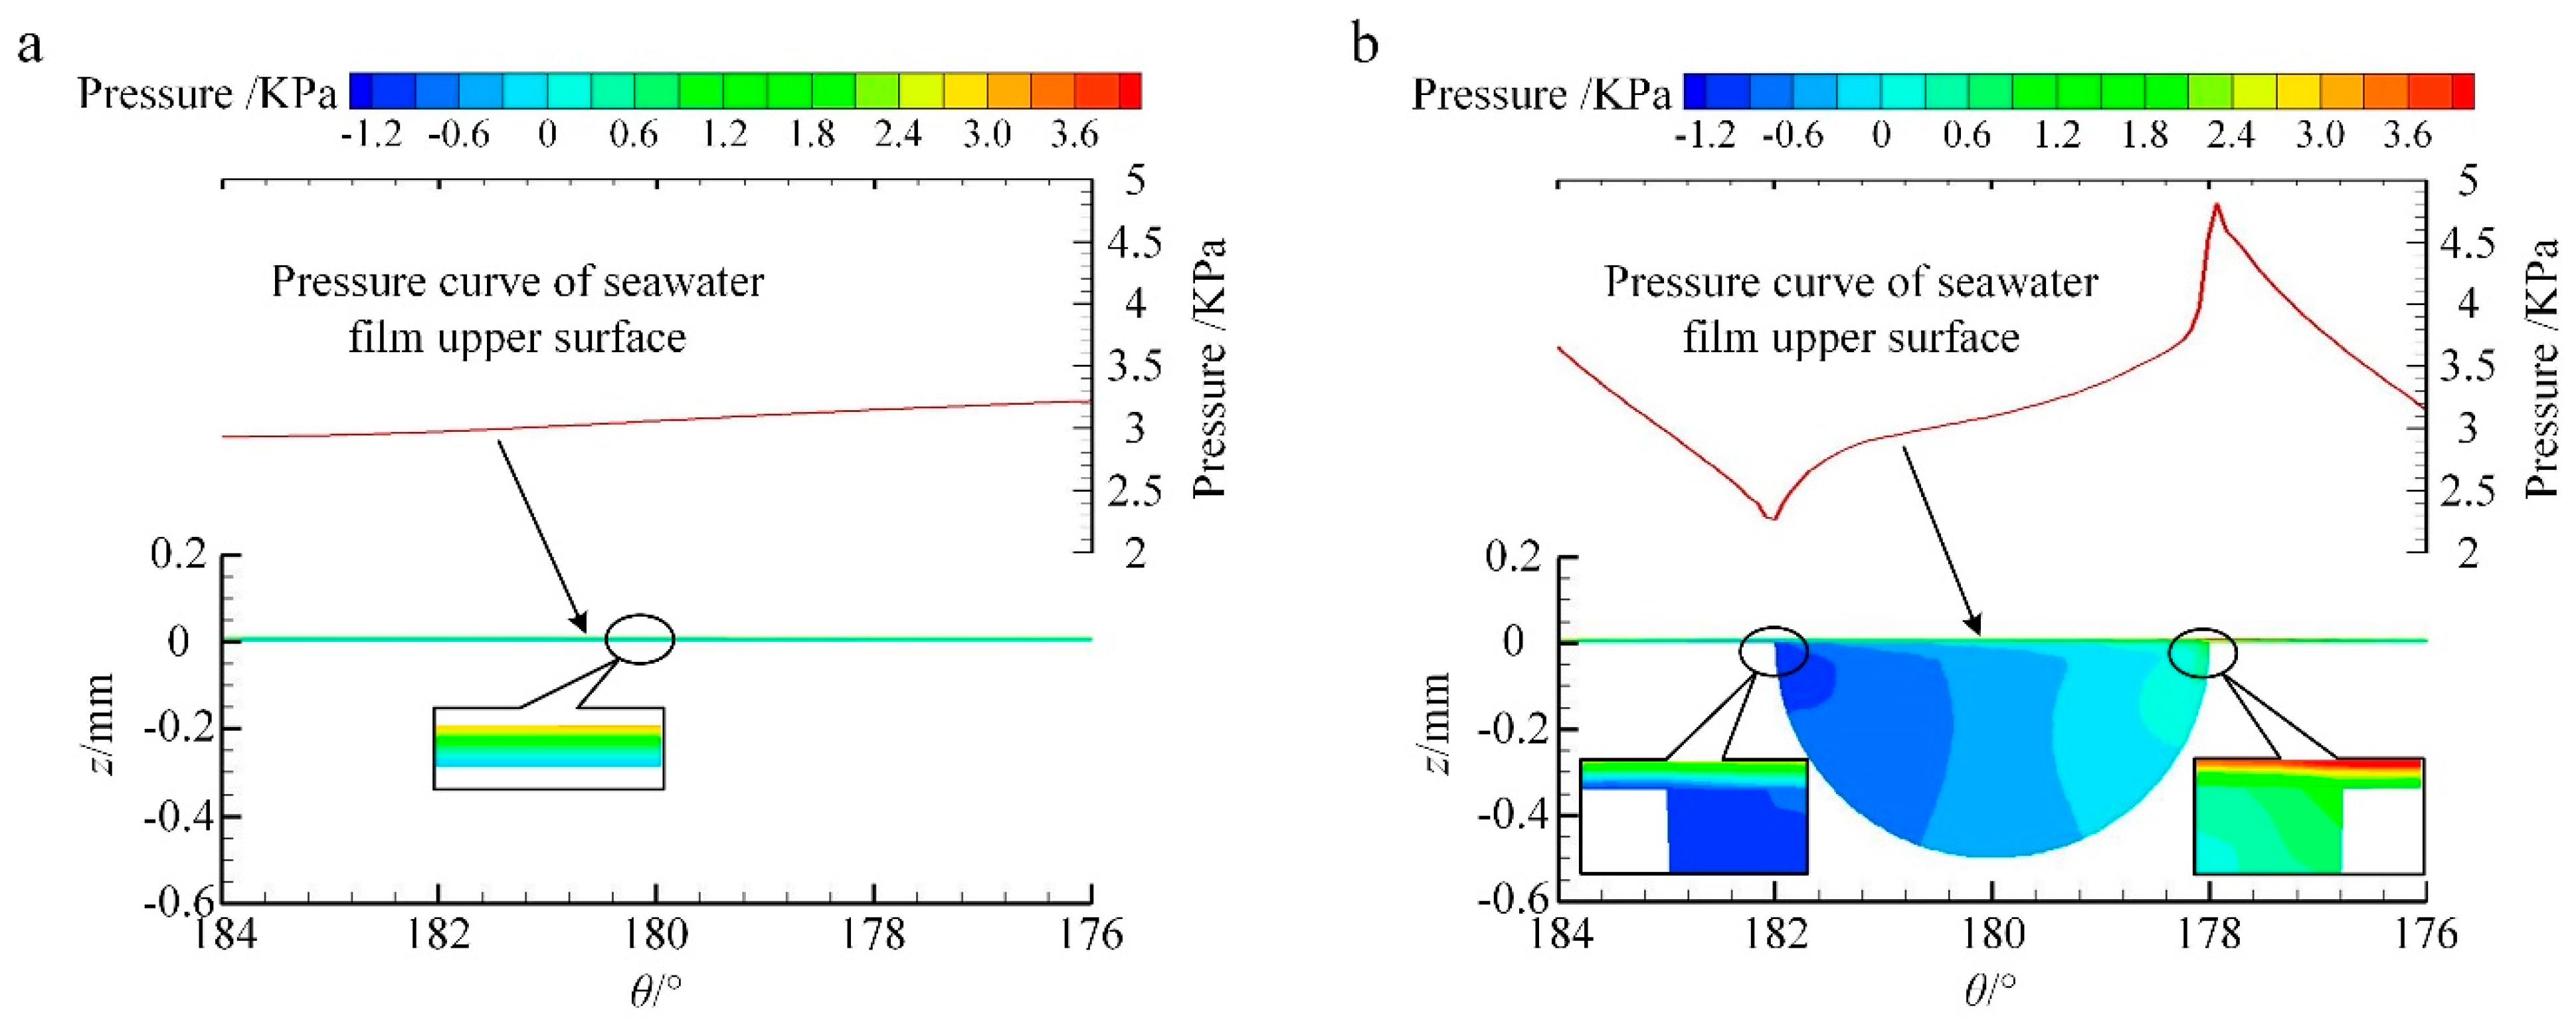
4.1. Analysis of the Lubrication Mechanism

Figure 4 presents the velocity vector of the circumferential profile at the distribution circle d5 = 38 mm. The upper specimen is rotating clockwise around the specimen axis (sliding in the direction of the decreasing polar angle). The maximum speed appears on the upper surface of the seawater film which contacts with the undersurface of the cylinder. The speed declines step by step in the direction of the seawater film’s thickness, with the direction remaining unchanged. For the smooth surface, the maximum speed only passes down layer by layer (Figure 4a). For the hemispherical-pit surface, the seawater at top of the pit first moves in the same direction, with the seawater at the bottom surface of the seawater film due to viscous force. After hitting the front half wall of the pit, the seawater turns downward and flows back along the bottom of the pit. After hitting the back half wall of the pit, the seawater turns upward and moves in the same direction as the seawater at the bottom surface of seawater film again. That is, a vortex ring is formed in the pit (Figure 4b).
Figure 5 presents the pressure contour of the circumferential profile for the distribution circle d5 = 38 mm and the pressure curve of the seawater film’s upper surface at the corresponding position. The hemispherical pit can be considered as two parts. Along the direction of the movement, the front part of the pit wall forms a convergent gap with the cylinder undersurface, where the seawater flows from a large gap to a small one; that is, the flow rate across each section caused by the velocity flow goes down by degrees. On the other hand, the back part of the pit wall forms a divergent gap with the cylinder undersurface, where the seawater flows from a small gap to a large one; that is, the flow across each section caused by the velocity flow steps up by degrees. On the basis of the flow continuity conditions—that is, the mass of fluid flowing into any section should be equal to the mass of fluid flowing out of another section—the pressure distribution, which is high pressure generated at the front edge of pit and low pressure generated at the back edge of pit (Figure 5b), will be produced. It can be seen that the friction surfaces have a convergent wedge, the sliding surface has sufficient speed, and the lubricant has an appropriate viscosity, which will produce a hydrodynamic lubrication effect [32].
Figure 6 indicates the pressure contour on the upper surface of the seawater film of the computational fluid field, and obvious pressure peaks and bumps above pits are observed in Figure 6b. As the distribution circle radius increases, the linear velocity gradually increases and the hydrodynamic effect is obviously enhanced.
The bearing capacity can be obtained through the pressure distribution integration on the upper surface of the seawater film. As shown in Figure 7, the bearing capacity of hemispherical-pit surface is 3.5% higher than that of the smooth surface, indicating that the pits raise the bearing capacity and reduce the resistance through the hydrodynamic lubrication effect.

4.2. Analysis of the Friction Coefficient

Figure 8 shows the friction coefficient variation of different surface friction pairs with the test time at different speeds. The friction coefficient of the smooth surface first plunges or fluctuates (from 0.06 to 0.013–0.025) during the initial 300 to 500 s, then gradually increases to 0.02–0.04 in the following 5000 s, and finally stabilizes until the end of the test. During the running-in process, the friction coefficients at 1000, 1250, and 1500 r/min fall directly to a stable value in the initial 300 s, and the friction coefficient at 1750 r/min oscillates to a peak value of 0.14 in the initial 500 s. The friction coefficient of the hemispherical-pit surface plunges or fluctuates (from 0.05 to 0.02–0.035) during the initial 200 to 1000 s, then slightly decreases and is stable at 0.01–0.032. The running-in period at 1000, 1250, and 1500 r/min is 200 s, and that at 1750 r/min is extended to 1000 s, with a peak value of 0.18. A higher sliding speed makes the micro-asperities on the upper and bottom specimen surface collide more fiercely during the running-in process under the same normal load, which produces the outstandingly high friction coefficient. The hemispherical-pit surface exhibited a lower friction coefficient, but experienced a more drastic relative motion at high speed.
Next, we should calculate the average friction coefficient and standard error of different surface friction pairs at each speed. The curve relationship of the average friction coefficient with an error-bar with the speed is illustrated in Figure 9. As the rotation speed increases, the average friction coefficient of the smooth surface increases in a fluctuating manner, while that of the hemispherical-pit surface increases monotonically. According to the classic Stribeck curve (Figure 10), the smooth surface is in the transition state of mixed lubrication to hydrodynamic lubrication, while the hemispherical-pit surface is in the hydrodynamic lubrication state within the test speed range. This curve shape and development trend are consistent with those of the friction pairs—the upper specimen is made of 316L and the bottom specimen is made of CF/PEEK—under the same working conditions as those in [33], but the values decreased by 0.03–0.04 due to the specimen material interchange. The hemispherical-pit surface produces the hydrodynamic lubrication effect (as described in Section 4.1) which promotes the bearing capacity of the seawater film and increases the thickness of the seawater film, making both its average friction coefficient and standard error lower than that of the smooth surface. When the seawater film thickness exceeds the height of two surface roughness peeks, the full fluid lubrication is realized and the friction coefficient is decreased [32].

4.3. Analysis of the Specimen Contact Temperature

The specimen contact temperature variation of different surface friction pairs with the test time at different speeds is presented in Figure 11. The contact temperature of all of the bottom specimens was adjusted from room temperature to a stable value during the initial stage, and remained stable until the end of tests. The adjustment time and the stable value interval of the smooth surface were, respectively, 5000 s and 54–62 °C, and those of the hemispherical-pit surface were 3000 s and 44–58 °C. The frictional heating raises the specimen surface temperature, which corresponds to the rise in the initial stage of the temperature curve. The specimen will dissipate its heat in the form of thermal radiation when its temperature is higher than that of the surrounding seawater. As the temperature increases, the heat dissipation rate gradually accelerates. Therefore, the subsequent heating curve gradually slows down. When the frictional heat generation and thermal radiation reach equilibrium, the temperature curve enters a stable stage. Compared with Figure 8, the change trend of the specimen’s contact temperature curve is similar to that of the friction coefficient curve. When the friction coefficient curve presents a large oscillation during the initial 500–1000 s at 1750 r/min, the temperature curve corresponds with a large overshoot under the same stage and rotation speed. The friction heat is generated in the outermost layer of the surface, and gradually spreads inward and downward with the contact point as the center. The isothermal surface of each contact point at a certain depth inside the surface will converge into a common isothermal surface, and the temperature gradually decreases along the depth direction. Once the surface temperature comes up to a certain critical value, the lubrication film fails, causing adhesion and destruction, and the friction coefficient and the wear loss rise sharply [32]. That is, the maximum overshoot of the temperature curve and the corresponding oscillation peak of the friction coefficient curve appear.
Figure 12 shows the curve relationship between the average specimen contact temperature of different surface friction pairs and the speed. In the test time of 10,800 s, the higher the speed, the longer the sliding stroke of the friction pair, and the greater the friction heat and temperature rise. Therefore, the average specimen contact temperatures of these two surface friction pairs both rise with the growth of the rotation speed. The hydrodynamic lubrication effect increases the bearing capacity of the seawater film and keeps the friction interfaces from contacting directly with each other, making the average specimen contact temperature of the hemispherical-pit surface lower than that of the smooth surface.

4.4. Analysis of the Wear Rate

Wear rate is a key parameter to characterize wear characteristics, and the calculation formula in this study is as follows:
W = Δ m ρ p L ( m m 3 / M P a m )
where Δm is the specimen mass loss (the mass before the test minus the mass after the test), ρ is the specimen density, p is the normal pressure, and L is the total sliding distance. It is worth mentioning that the normal pressure is used in this formula to replace the normal load. The distribution of the pits on the hemispherical-pit surface means that its actual contact area is not equal to that of the smooth surface. Therefore, it is more accurate to use the volume worn under the unit pressure per unit length to characterize the wear rate.
The wear rate of the specimens with the smooth surface and hemispherical-pit surface at varying rotation speeds is illustrated in Figure 13. The wear rate of CF/PEEK is about 150 times that of 316L, because its hardness is low. The wear rate of the upper specimen at most rotation speeds is negative, and that of the bottom specimen is positive, indicating that the mass of the most upper specimen increased, and that of most bottom specimen decreased after the test. The abrasive wear cuts the surface material, causing the specimen’s mass to decrease. The adhesive wear migrates the surface material, causing the specimen’s mass to decrease when the material is sheared, and causing the specimen’s mass to increase when the surface is made up of adhered material. For the upper specimen CF/PEEK, the mass lost by the 316L surface roughness peak cutting is less than the mass gained through being adhered by the 316L oxide film, so the mass increased after the test. For the bottom specimen of 316L, due to its density being higher, the mass of the oxide film shed during the friction process is much more than the mass of the surface material adhered from CF/PEEK.
As the rotation speed climbs, the wear rate of the specimen has a trend to increase. The upper specimen wear rate and the bottom specimen wear rate were both positive, and greatly increased at 1750 r/min. This, in combination with Figure 8 and Figure 11, indicates that the friction coefficient and the friction heat increased sharply in the running-in period, leading to an excessively high local specimen temperature, which softened the surface material and made it easier to peel off. The hemispherical-pit surface shows a higher wear rate than the smooth surface for both CF/PEEK and 316L at 1750 r/min. This should be because the higher speed means that the turbulent flow in the pits is heavier, and the wear debris falling into the pits are rolled up and taken out of the pits again, resulting in a more serious three-body wear between the friction surfaces.
This wear rate is one order of magnitude lower than that of the friction pair in which the upper specimen is made of 316L and the bottom specimen is made of CF/PEEK under the same working conditions, based on the comparative analysis of the test results in [33]. This pin-on-disc friction is apt to migrate the surface material on the disc to the pin, which was concluded in the previous study [33,34]. The material 316L was used to make the bottom specimen in this test due to its higher hardness, and the surface material was not easy to plough-cut and fell off in the friction process. Compared with using CF/PEEK as the bottom specimen, the abrasive wear was reduced, and the anti-wear and drag-reduction effect were greatly improved.

4.5. Effect of Micro-Hemispherical Pit-Textured Surfaces on Friction and Wear Behaviors

Figure 14 and Figure 15 describe the wear surface morphology of the smooth-surface friction pair and the hemispherical-pit surface friction pair under the working condition of P = 300 N and n = 1500 r/min.
Compared with the original surface morphology in Figure 2, the surface of the upper specimen CF/PEEK becomes bright, the grooves become small, and the observable carbon fibers in the matrix become more numerous and long (Figure 14a,b and Figure 15a,b). There are slight circular scratches, obvious grooves along the sliding direction, and blue oxidation on the surface of the bottom specimen of 316L (Figure 14d,e and Figure 15d,e). This, in combination with the analysis in Figure 8 and Figure 11, indicates that the micro-asperities on the CF/PEEK and 316L surfaces contacted and embedded each other under a normal load. When the upper and bottom specimen slid relatively, the micro-asperities collided fiercely, which corresponds to the high friction coefficient and specimen contact temperature during the running-in period. Due to the hardness of CF/PEEK being lower than that of 316L, the micro-asperities on its surface were gradually ground flush by those on the 316L surface, then its surface material was preferred to be pushed, generated plastic flow, and ploughed out new grooves that changed the original machining tool marks. This microscopic cutting process is termed as a plowing effect. A blue color appeared in the grooves of the 316L in Figure 14e, indicating that chemical oxidation occurred during the friction process. The exfoliated CF/PEEK surface material and 316L oxide were caught between the friction surfaces, resulting in abrasive wear. Abrasive wear caused the matrix material of the upper specimen to wear, such that carbon fibers were exposed in larger sections, and caused the grooves on the bottom specimen surface to become wide and deep. When the surfaces of the friction pair slid relatively, the bonding node formed by the adhesion effect underwent shear fracture, and the CF/PEEK surface material and 316L oxide film were captured, filled and bonded by the grooves on the match surface, migrating from one surface to the other, which caused adhesive wear.
Figure 16 and Figure 17 show the EDS analysis of the wear surface of the hemispherical-pit surface friction pair under the working conditions of P = 300 N and n = 1500 r/min, which verify the occurrence of oxidative wear and adhesive wear. The elemental energy spectrum analysis of the upper specimen CF/PEEK in Figure 16a shows that the mass fraction of O, Mg and Fe increase to 37.6%, 18.41% and 16.69%, respectively. Its surface scanning analysis in Figure 16b shows that the highlighted areas of the elements O, Mg and Fe are basically the same. This indicates that, in the rubbing, the oxidation film which formed on the surface of the bottom specimen of 316L was worn off and bonded to the surface of the upper specimen of CF/PEEK. Combined with the surface scanning diagram of the elements Na and Cl in Figure 16b, it was concluded that the crystalline substance on the right of the SEM image is crystalline salt separated from the seawater. Adhesive wear causes the surface material to transfer bidirectionally. The elemental energy spectrum analysis of the bottom specimen of 316L in Figure 17a shows that the mass fraction of element C increased from less than 0.03% to 12.19%, which should originate from the carbon fiber in the upper specimen CF/PEEK. Element O, with a mass fraction of 30.65%, was observed on the 316L wear surface, of which the source corresponds to the oxide generated during rubbing. In Figure 17b, the SEM image clearly shows that there are a few granular sticking objects in the worn grooves, which, combined with the surface scanning diagram of the elements Na, Cl, O Mg and S are crystalline salt and oxides.
Comparing Figure 14 and Figure 15, it is indicated that the grooves on the hemispherical-pit surface are fewer, slenderer, and shallower than those on the smooth surface. The reason is that, on the one hand, the pit surface can produce the hydrodynamic effect under the conditions of seawater lubrication and rotating sliding to achieve fluid lubrication. On the other hand, the pit can store debris generated in rubbing and diminish abrasive wear. According to Figure 18 of the EDS analysis of the debris in the hemispherical pit on the 316L after the test, the wear debris mainly includes crystalline salt precipitated from the seawater (known from the elements Na and Cl) and 316L oxidation products (known from the elements O, Fe, Mg and Cr). It can be seen from Figure 18a that the debris generated in the friction process tends to deposit on the front edge of the pit (along the sliding direction of the upper specimen); that is, the front edge of the pit has a certain scraping effect on the upper specimen.

4.6. Effect of the Sliding Speed on the Friction and Wear Characteristics

Figure 19 and Figure 20 compare the SEM image and three-dimensional topography of the wear surface of the hemispherical-pit surface friction pair under the rotation speed of 1000 r/min and 1750 r/min (corresponding to the sliding speeds of 1.57 m/s and 2.75 m/s), exploring the effect of the sliding speed on the friction and wear characteristics.
It is generally known that the total friction coefficient μ in the case of boundary lubrication and mixed lubrication includes two parts: the fluid friction coefficient μL and the solid friction coefficient μS. As concluded from Figure 9 and Figure 10, the hemispherical-pit surface friction pair is in the hydrodynamic lubrication state in the rotation speed range from 1000 r/min to 1750 r/min. A continuous seawater lubricating film separates the two friction surfaces, and no solid friction coefficient μS is generated at this time. The total friction coefficient μ is only determined by the fluid friction coefficient μL, and its value is ηdv/dz, which is produced by the internal friction of the fluid.
The velocity gradient dv/dz is low at a low sliding speed of 1.57 m/s (n=1000 r/min); thus, the friction coefficient is low. The low sliding speed also brings a low specimen contact temperature, because the seawater can wash away the debris and cool down the friction surface in a timely manner. As illustrated in Figure 19a–c and Figure 20a,b, the grooves on the CF/PEEK and 316L wear surfaces are even, and are obviously generated during the running-in period; some original machining tool marks still can be seen on the 316L wear surface. Surface plastic deformation causes oxygen in the air to diffuse to the deformed layer. Oxygen first reaches saturation on the surface, and then successively diffuses to the interior of the surface layer, and the content of oxygen gradually decreases from the outside to the inside. At low speed friction, the oxidation degree of the 316L surface is not high, and the main components are oxygen iron solid solution and granular oxide FeO (Figure 19b) [32]. The oxide film adhering to the CF/PEEK surface generates cracks and falls off under cyclic contact stress (Figure 19a). The adhesive wear makes the wear rate of the specimens high.
As the sliding speed increases to 2.36 m/s (n = 1500 r/min), the velocity gradient increases and the friction coefficient increases. The increased speed lengthens the sliding stroke and raises the intensity of the relative movement between the friction surfaces, which increases the frictional heat generation and the contact temperature of the specimen. As illustrated in Figure 15 and Figure 18, with the increase of the temperature, the grooves on the CF/PEEK and 316L wear surfaces are even but not obvious, the plastic deformation and oxidation degree of the 316L surface are enhanced, and the oxide film is regenerated on the surface, the main component of which is lamellar oxide Fe2O3 (Figure 15f) [32]. At this stage, oxidation wear dominates, friction occurs between the oxidation films, and the wear rate decreases.
When the sliding speed rises to 2.75 m/s (n = 1750 r/min), the friction coefficient and the specimen contact temperature are further increased. As illustrated in Figure 19d–f and Figure 20c,d, the grooves on the CF/PEEK and 316L wear surfaces become shallow and uneven. A significant increase in friction heat greatly increases the oxidation speed and degree of the 316L surface, generates filamentous oxide Fe3O4, and also makes the CF/PEEK surface material easy to soften and peel off [32]. The friction changes from oxidation wear to adhesive wear. Due to the high surface temperature and the large plastic deformation of the contact peak point, the strength and area of the adhesive node increase, and the shear failure occurs in the deep layer, resulting in the dramatic increase in adhesion wear and wear rate. The friction surface temperature is high, the material migration is significant, and the grooves are filled by the wear debris through the daub effect, such that the roughness of the specimen’s wear surface decreases.

5. Conclusions

This paper used a combination of numerical simulation and experimental exploration to analyze the effect of hemispherical-pit textured surfaces and the sliding speed on the lubrication mechanism and friction and wear characteristics of the CF/PEEK and 316L stainless steel friction pair under seawater lubrication conditions. We concluded as follows:
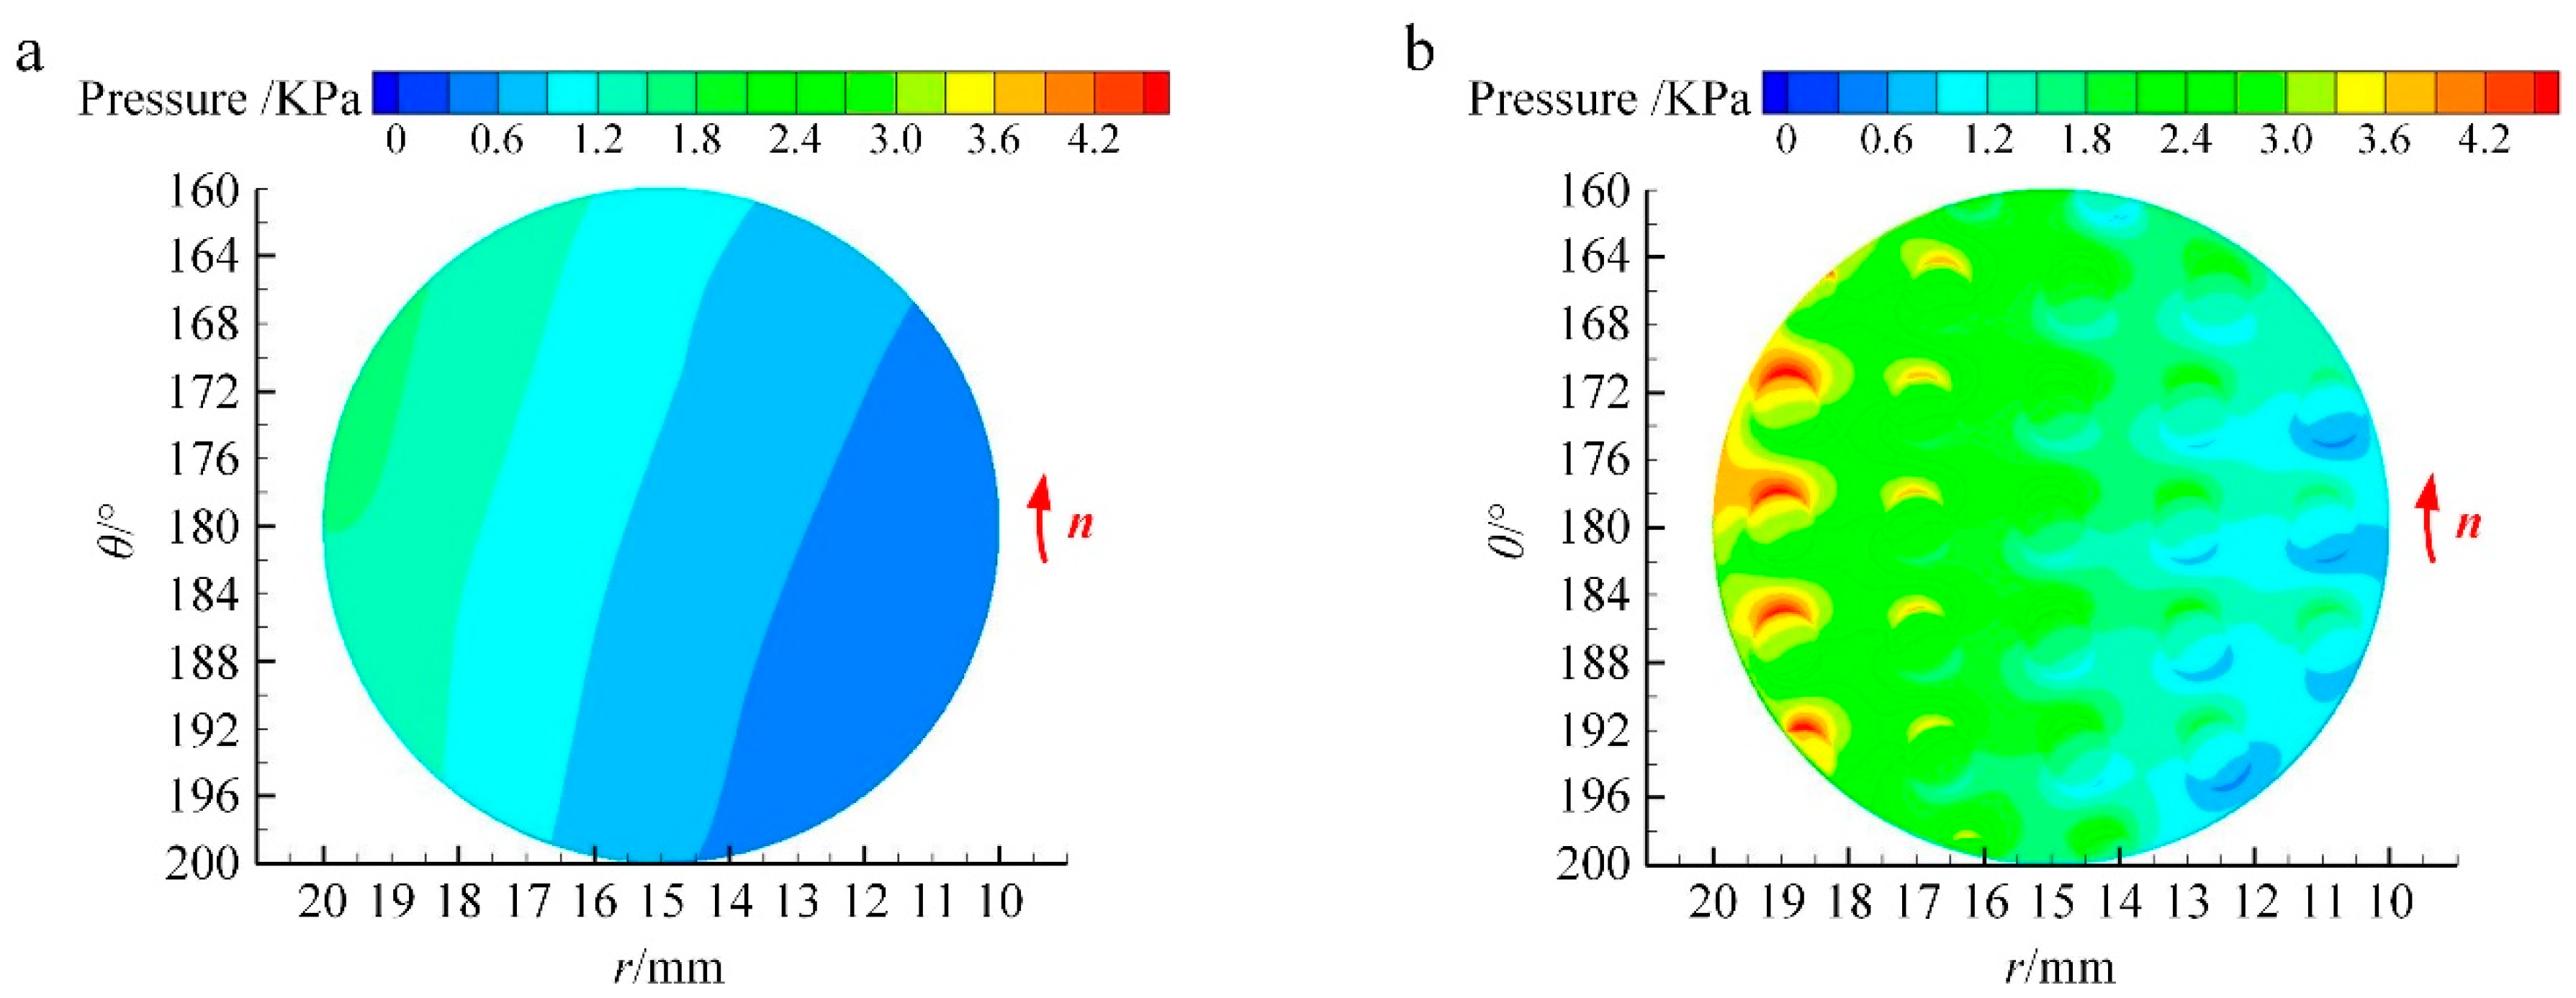
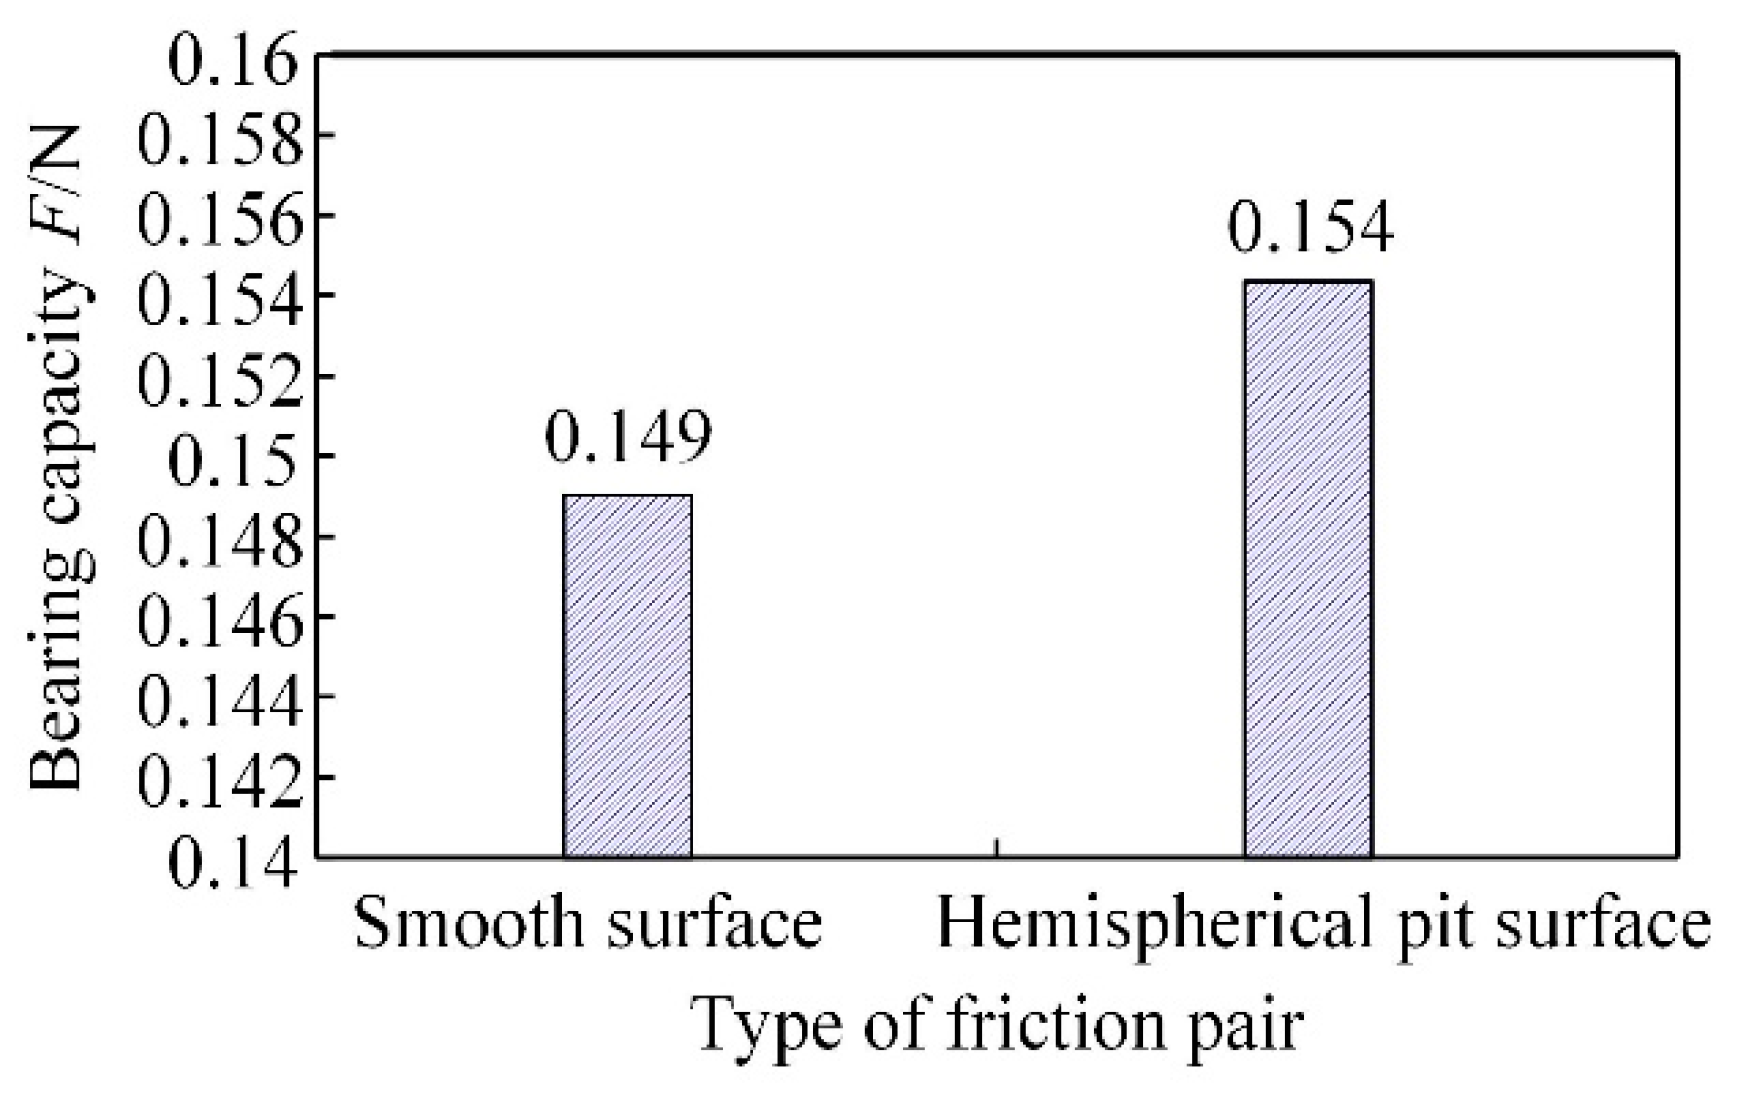
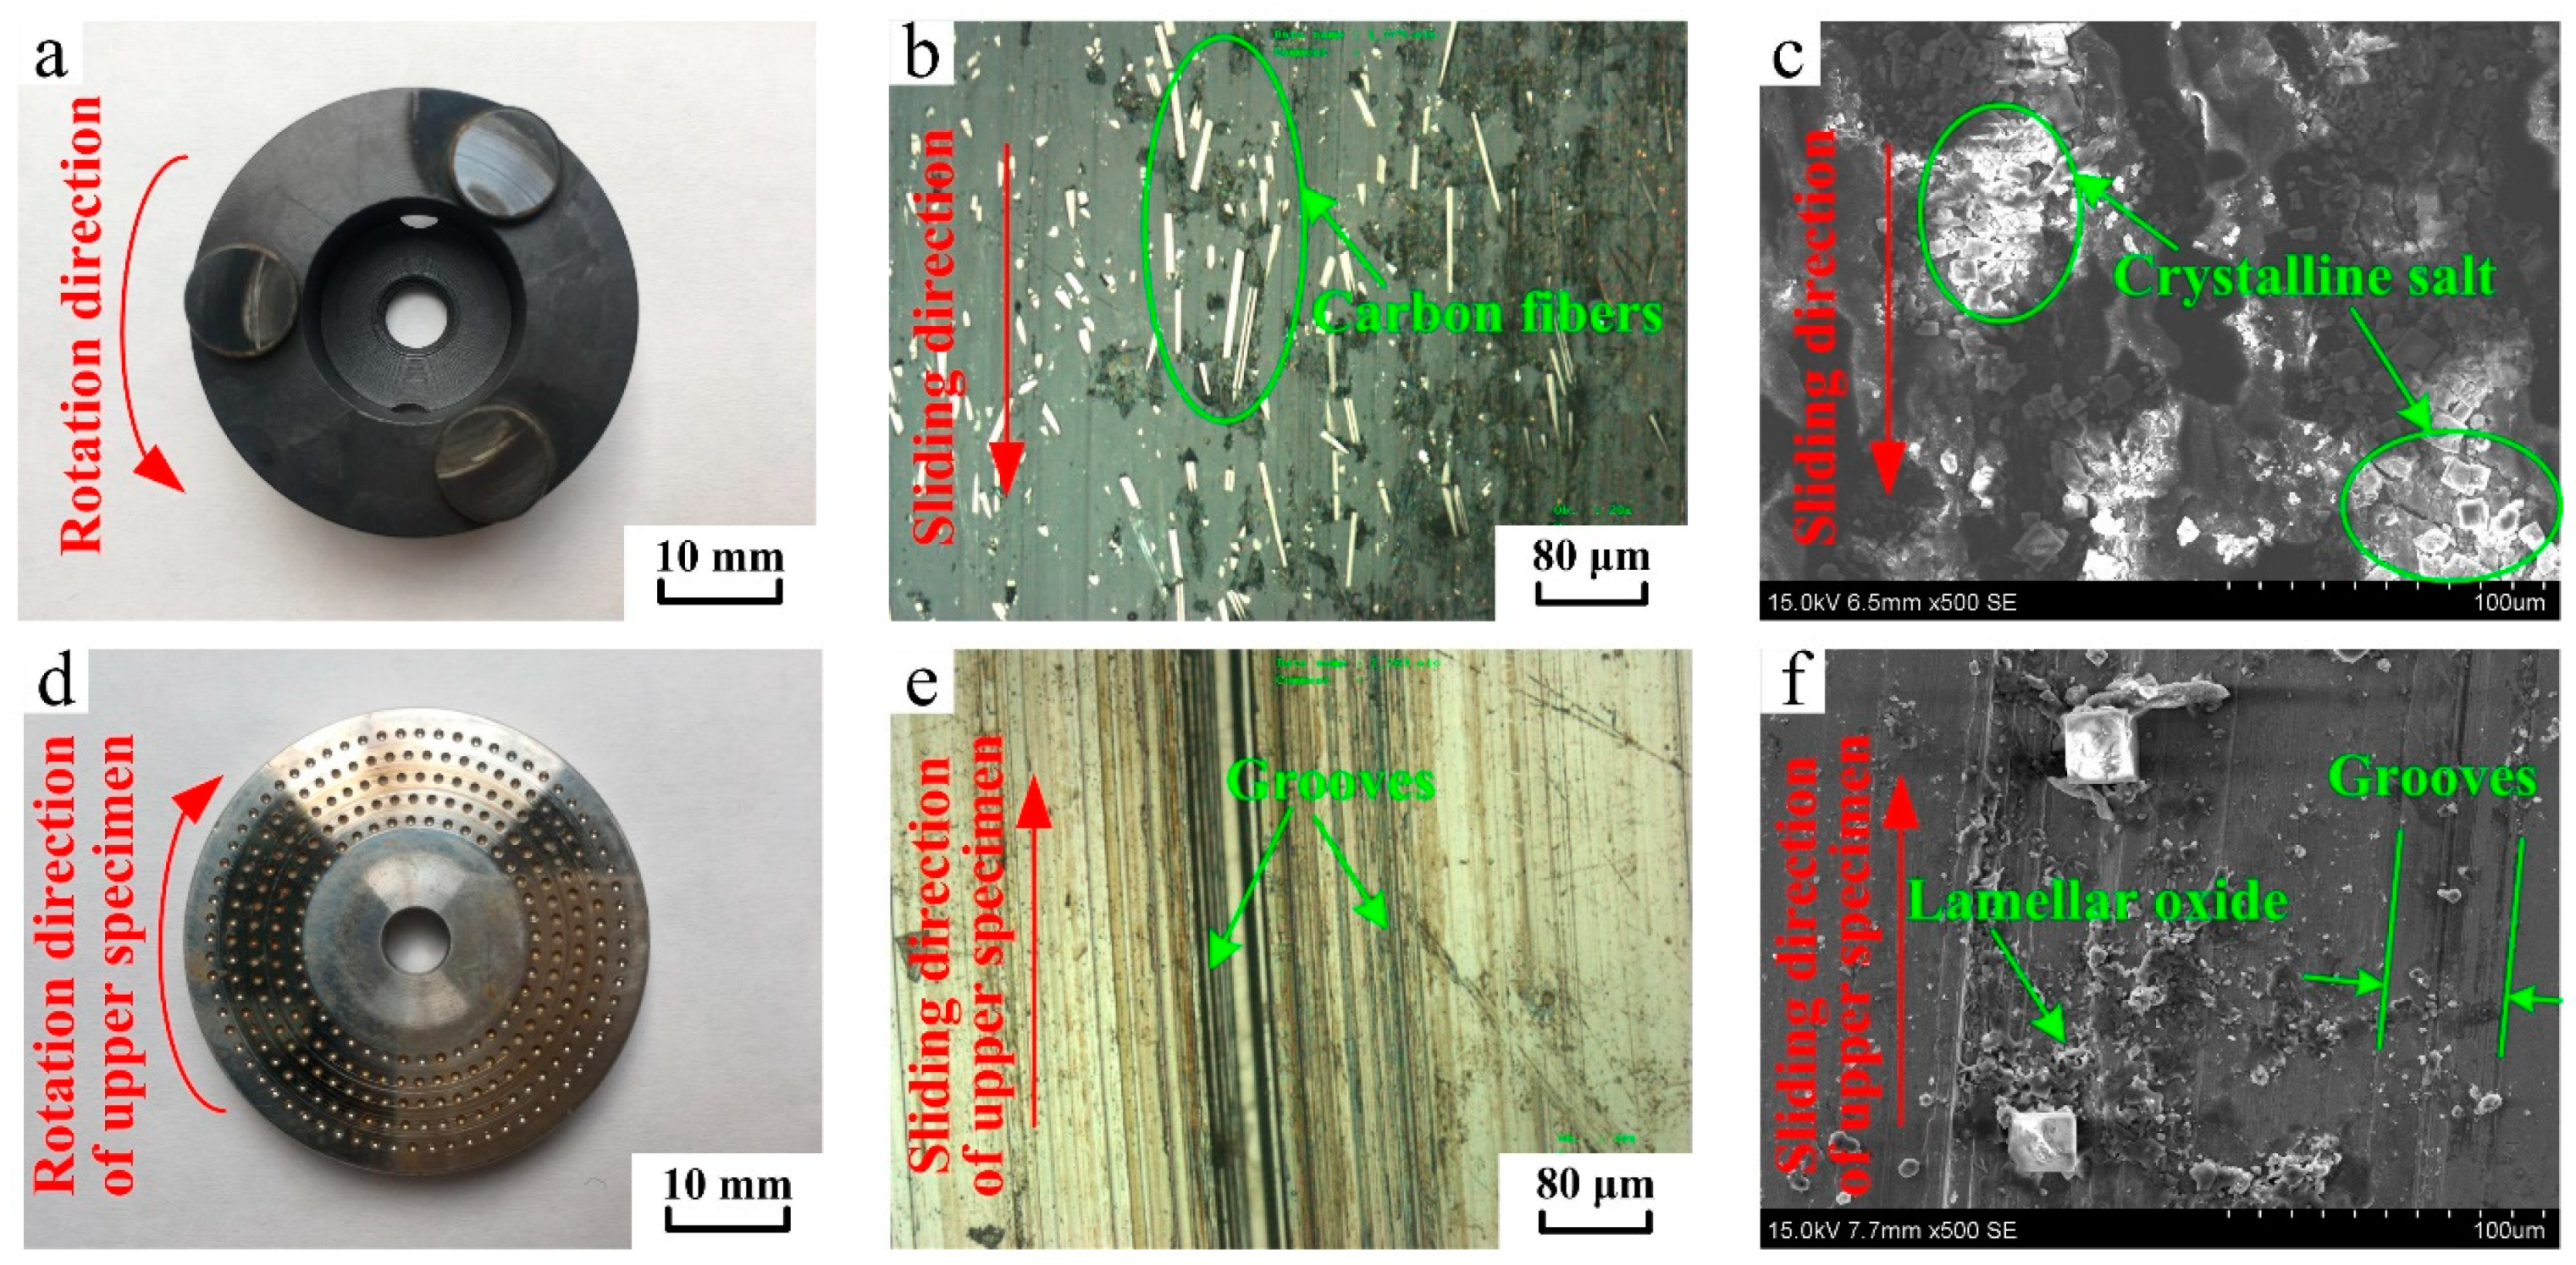
  • When the upper specimen rotates relative to the bottom specimen, seawater between the friction surfaces follows the movement, forms a vortex ring flow in the hemispherical pit of the bottom specimen, uses the convergent gap to generate a hydrodynamic effect, produces the bearing capacity, and realizes fluid lubrication. For the smooth-surface friction pair as the compared group, the sliding speed of the upper specimen is only transferred downwards layer by layer in the thickness direction of the seawater film, and no hydrodynamic effect is produced.
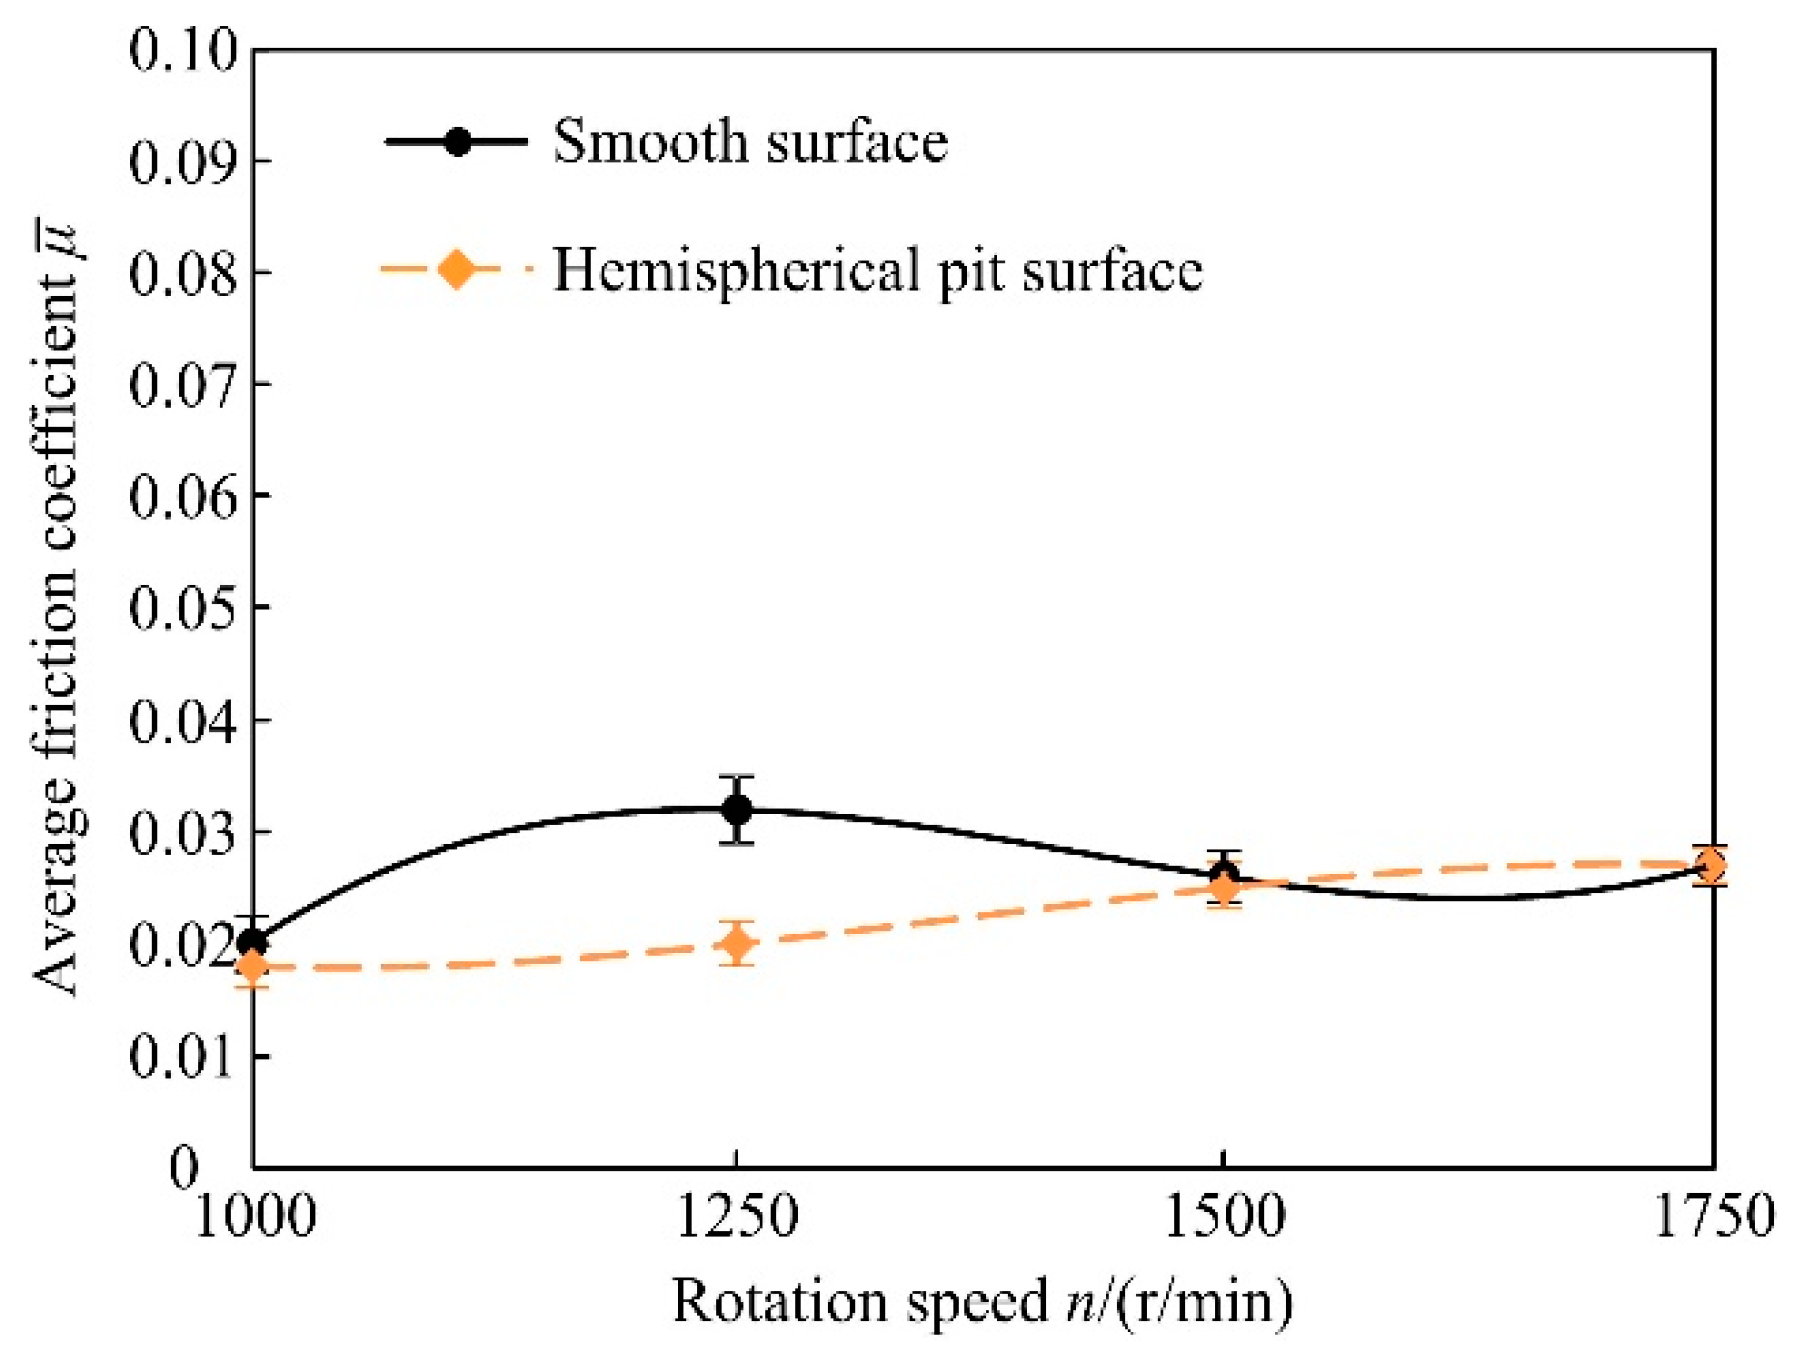
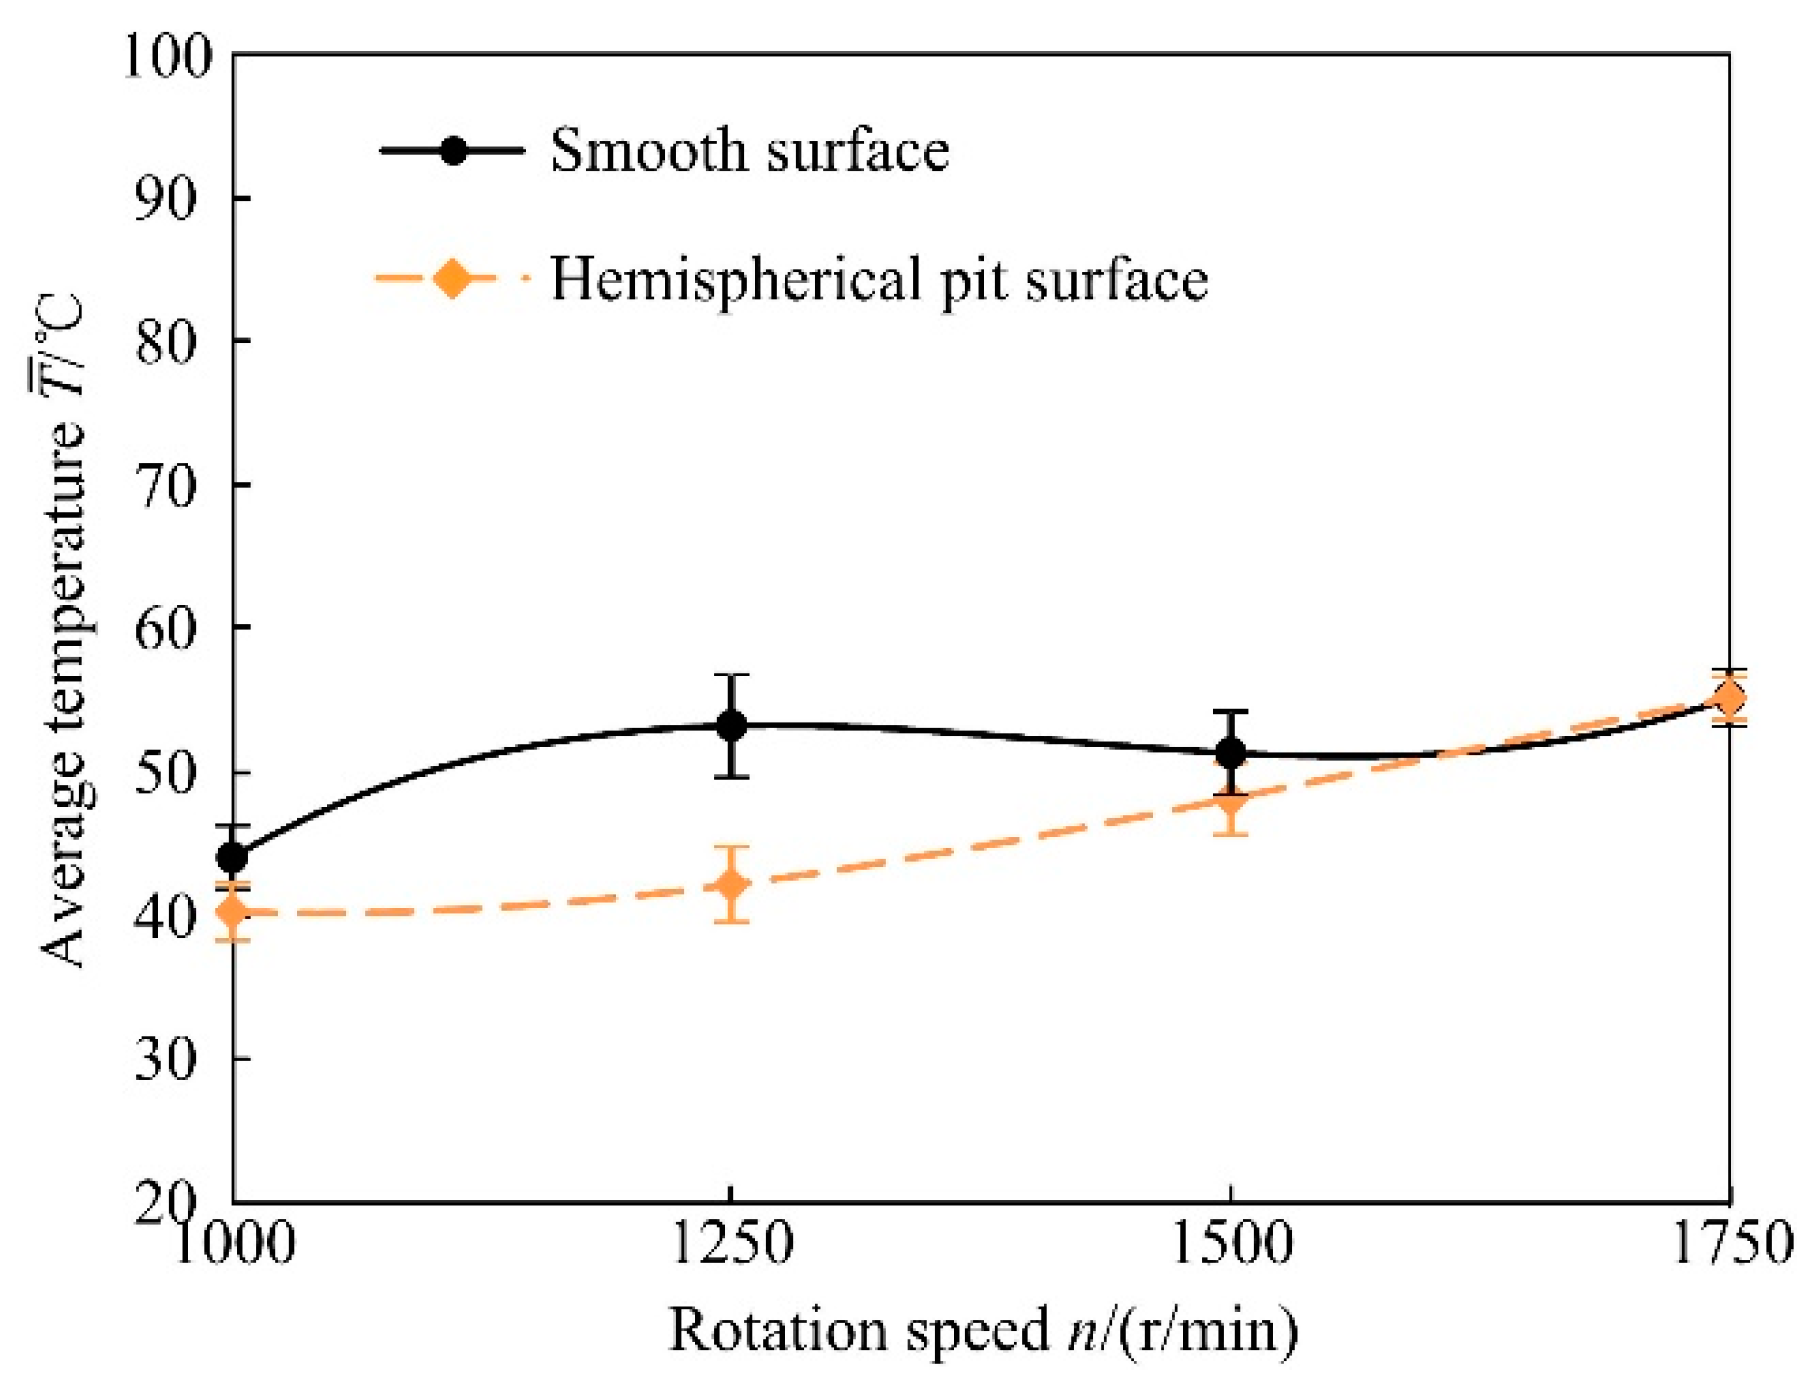
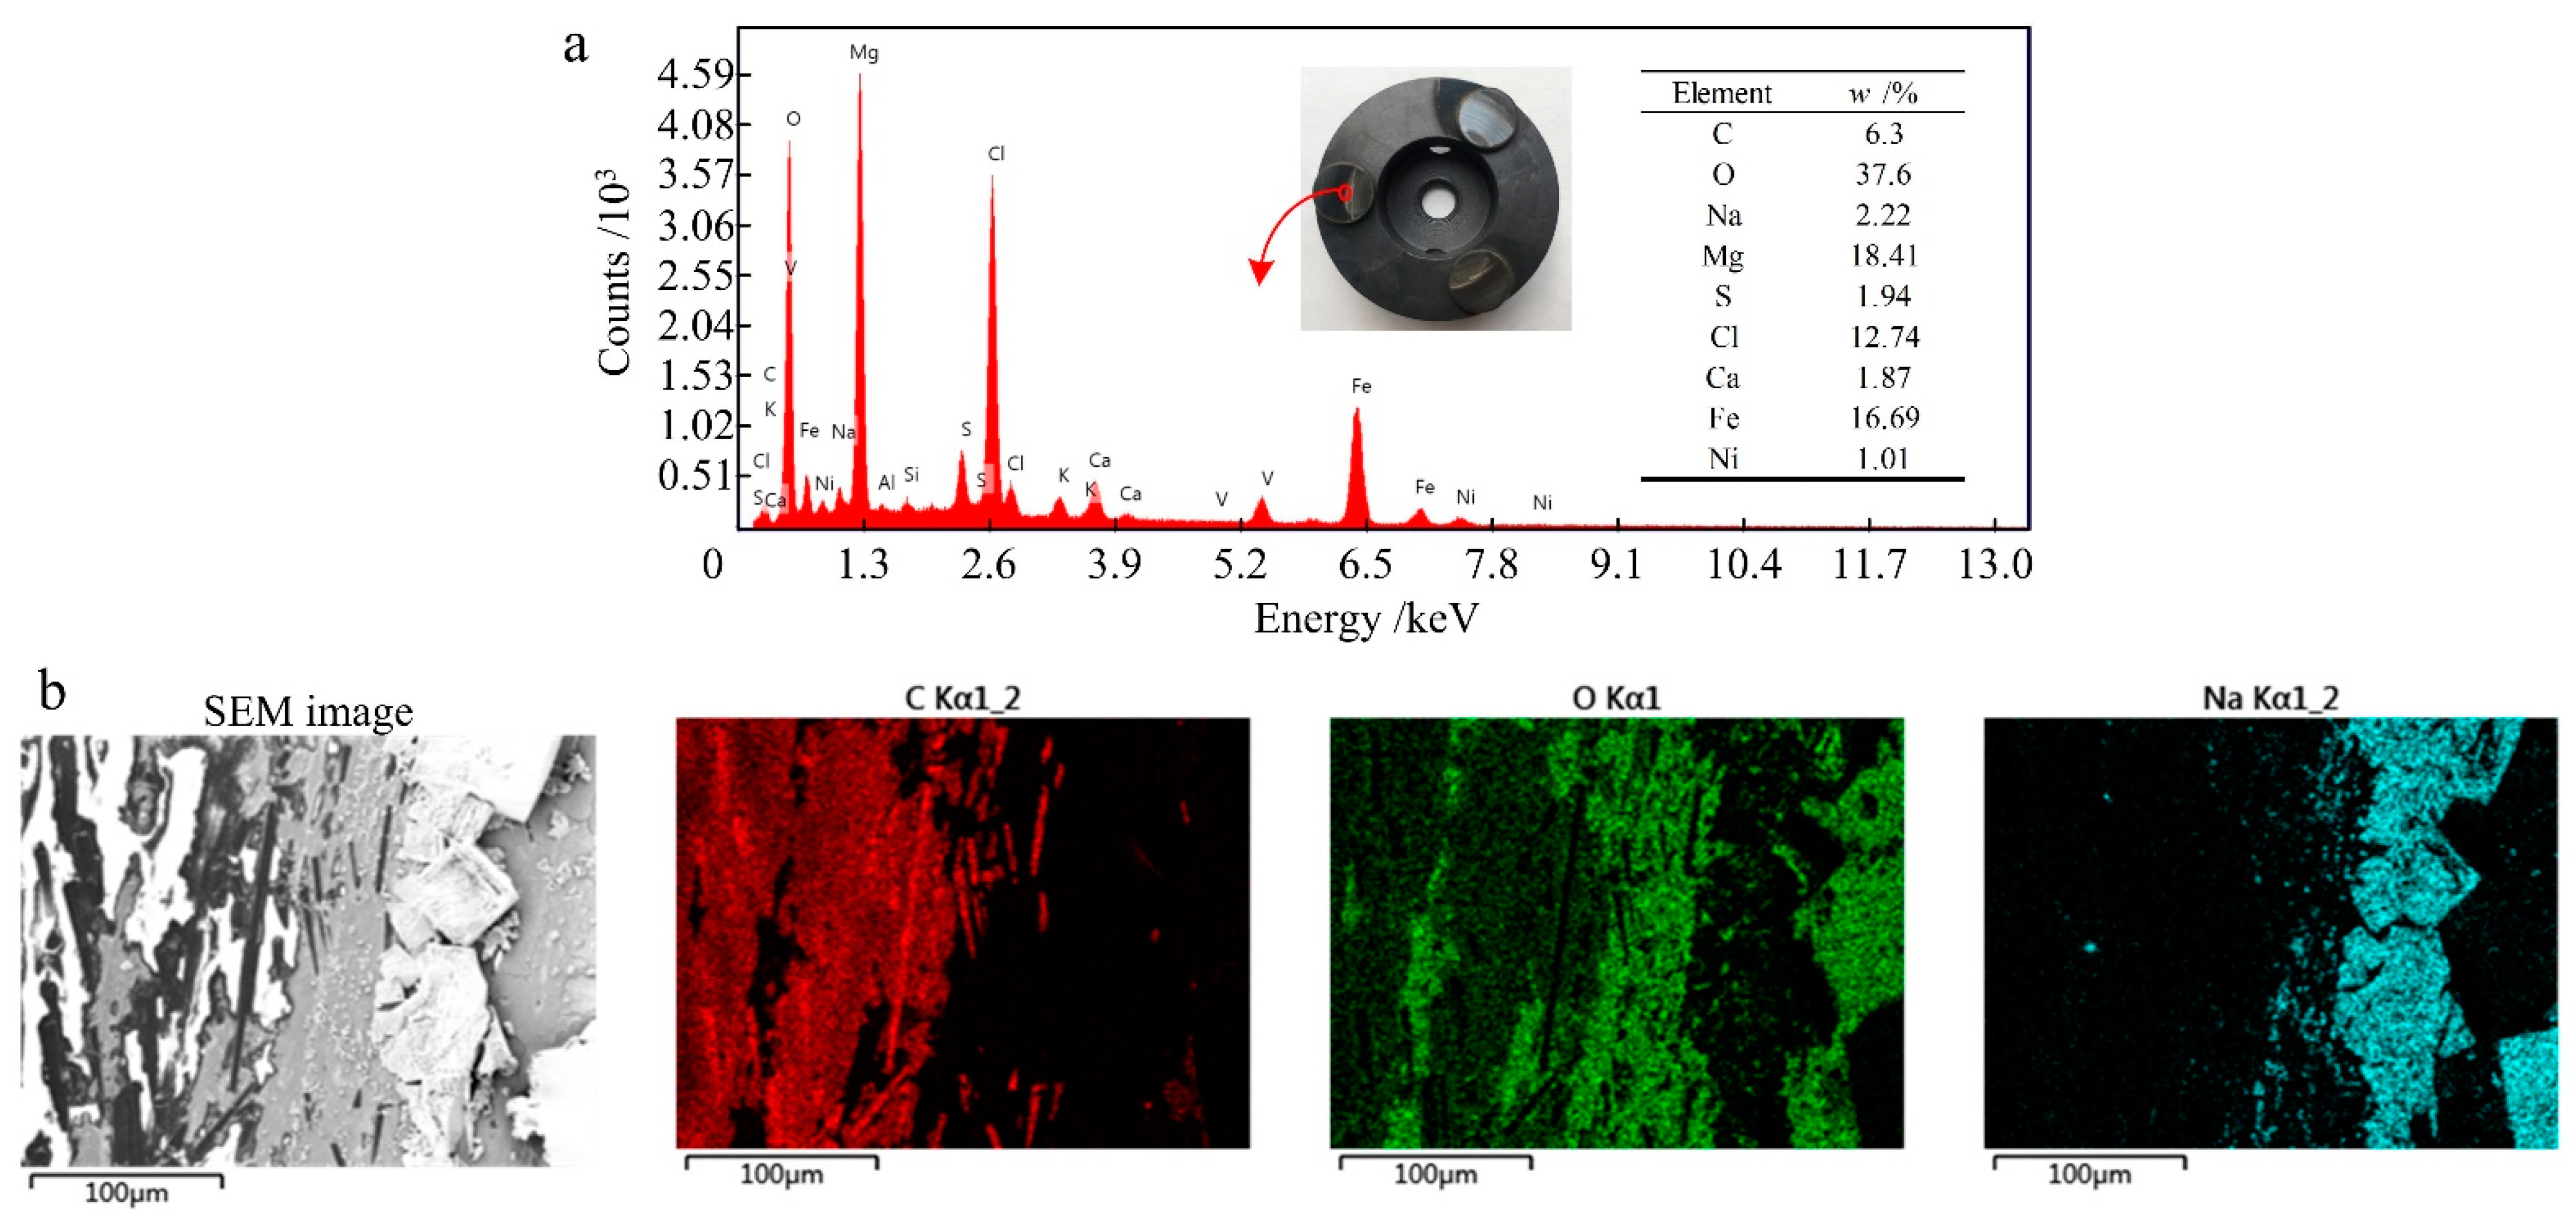
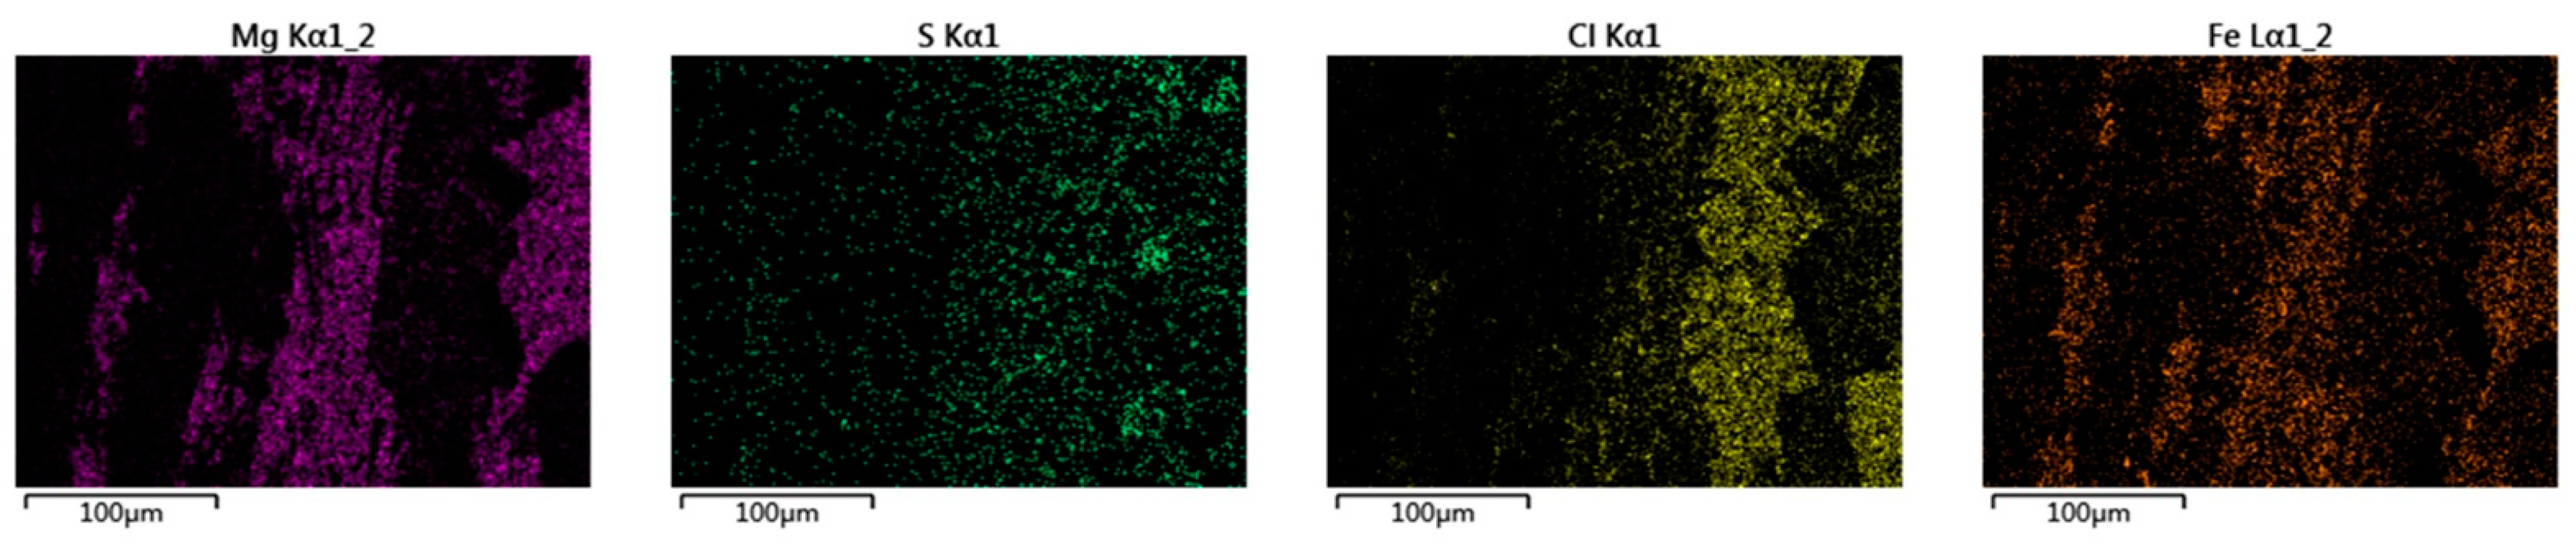
  • The hemispherical pits diminish the abrasive wear during the friction process by storing the wear debris, and the main wear forms of the hemispherical-pit surface friction pair are oxidative wear and adhesive wear. The friction coefficient of the hemispherical-pit surface friction pair is 0.018–0.027, and the specimen contact temperature is 40.2–55.1 °C. The effect of drag reduction and anti-wear is significantly improved compared with the smooth-surface friction pair under the same working conditions.
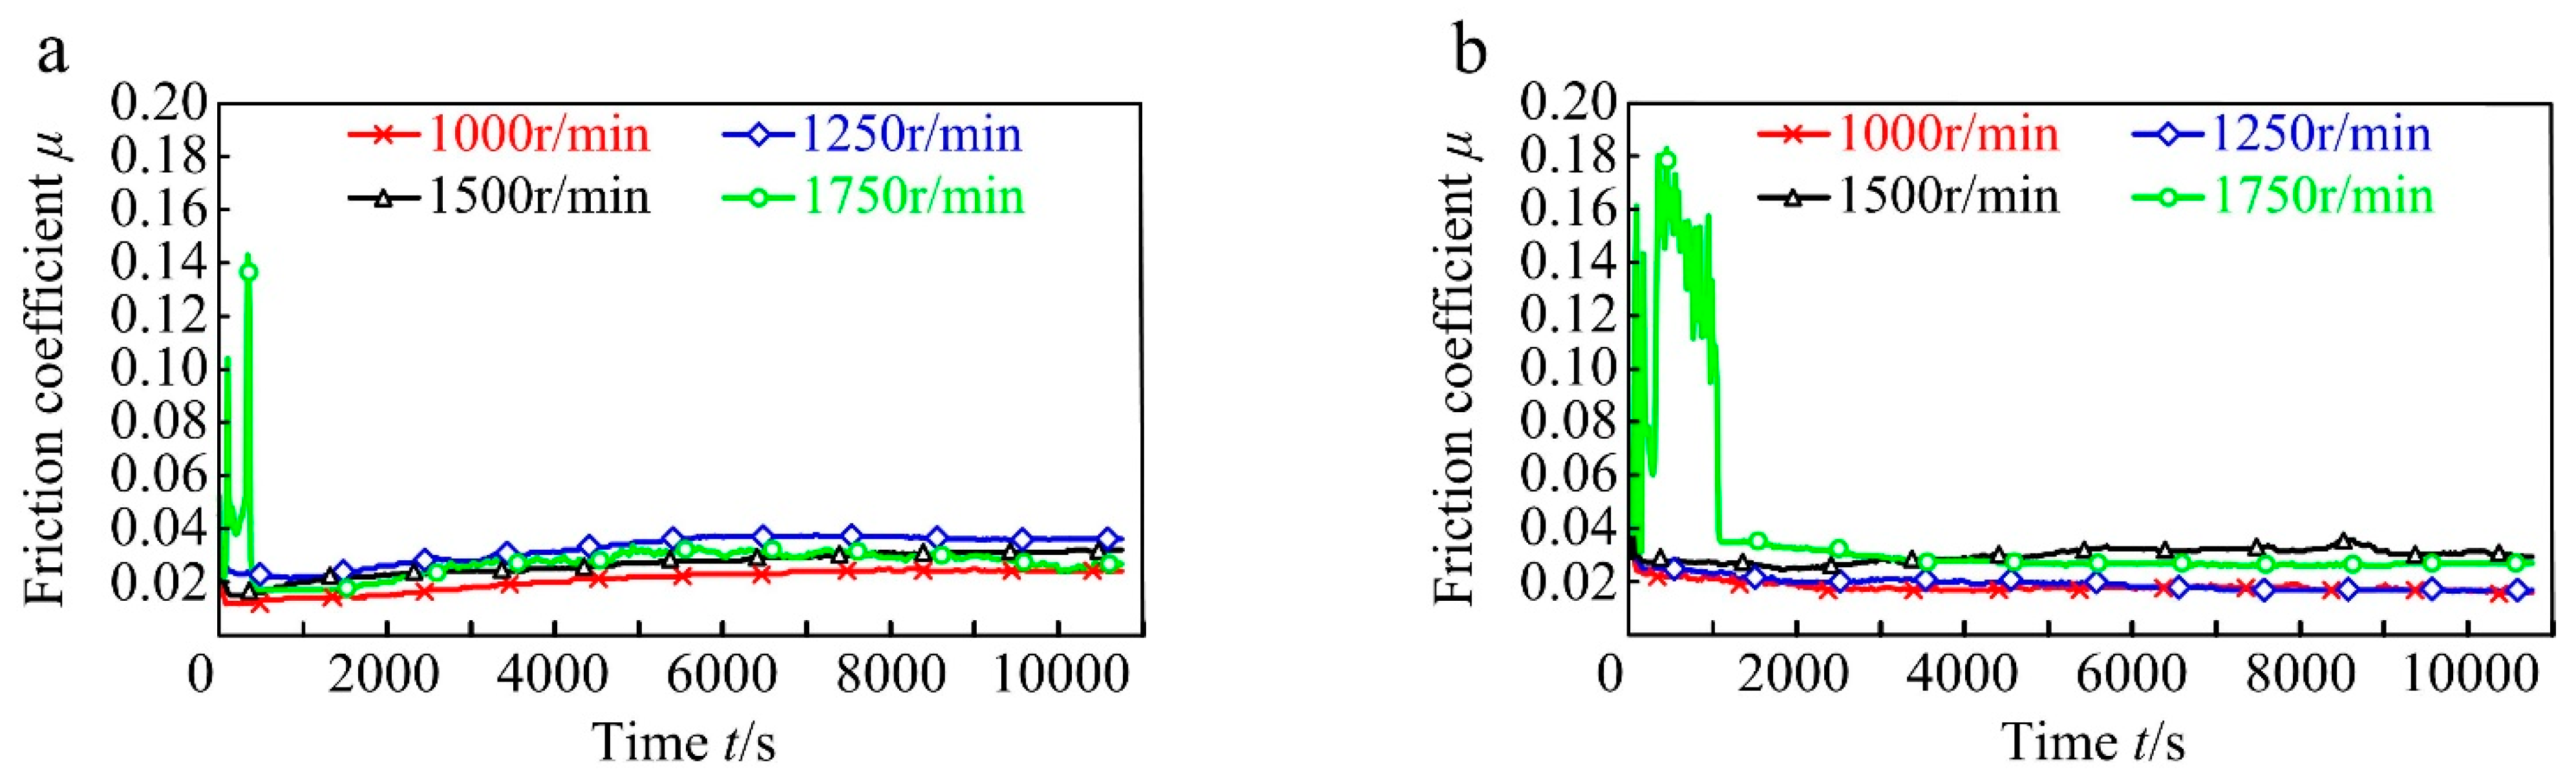
  • The hemispherical-pit surface friction pair is in the hydrodynamic lubrication state at rotation speeds ranging from 1000 r/min to 1750 r/min. The total friction coefficient is only determined by the fluid friction coefficient, which increases with the increase of the sliding velocity gradient. As the sliding speed increases, the specimen contact temperature climbs, and the oxidation reaction gradually becomes full. Oxidative wear and adhesive wear alternately play a dominant role in the friction, and the wear rate first decreases and then increases sharply.
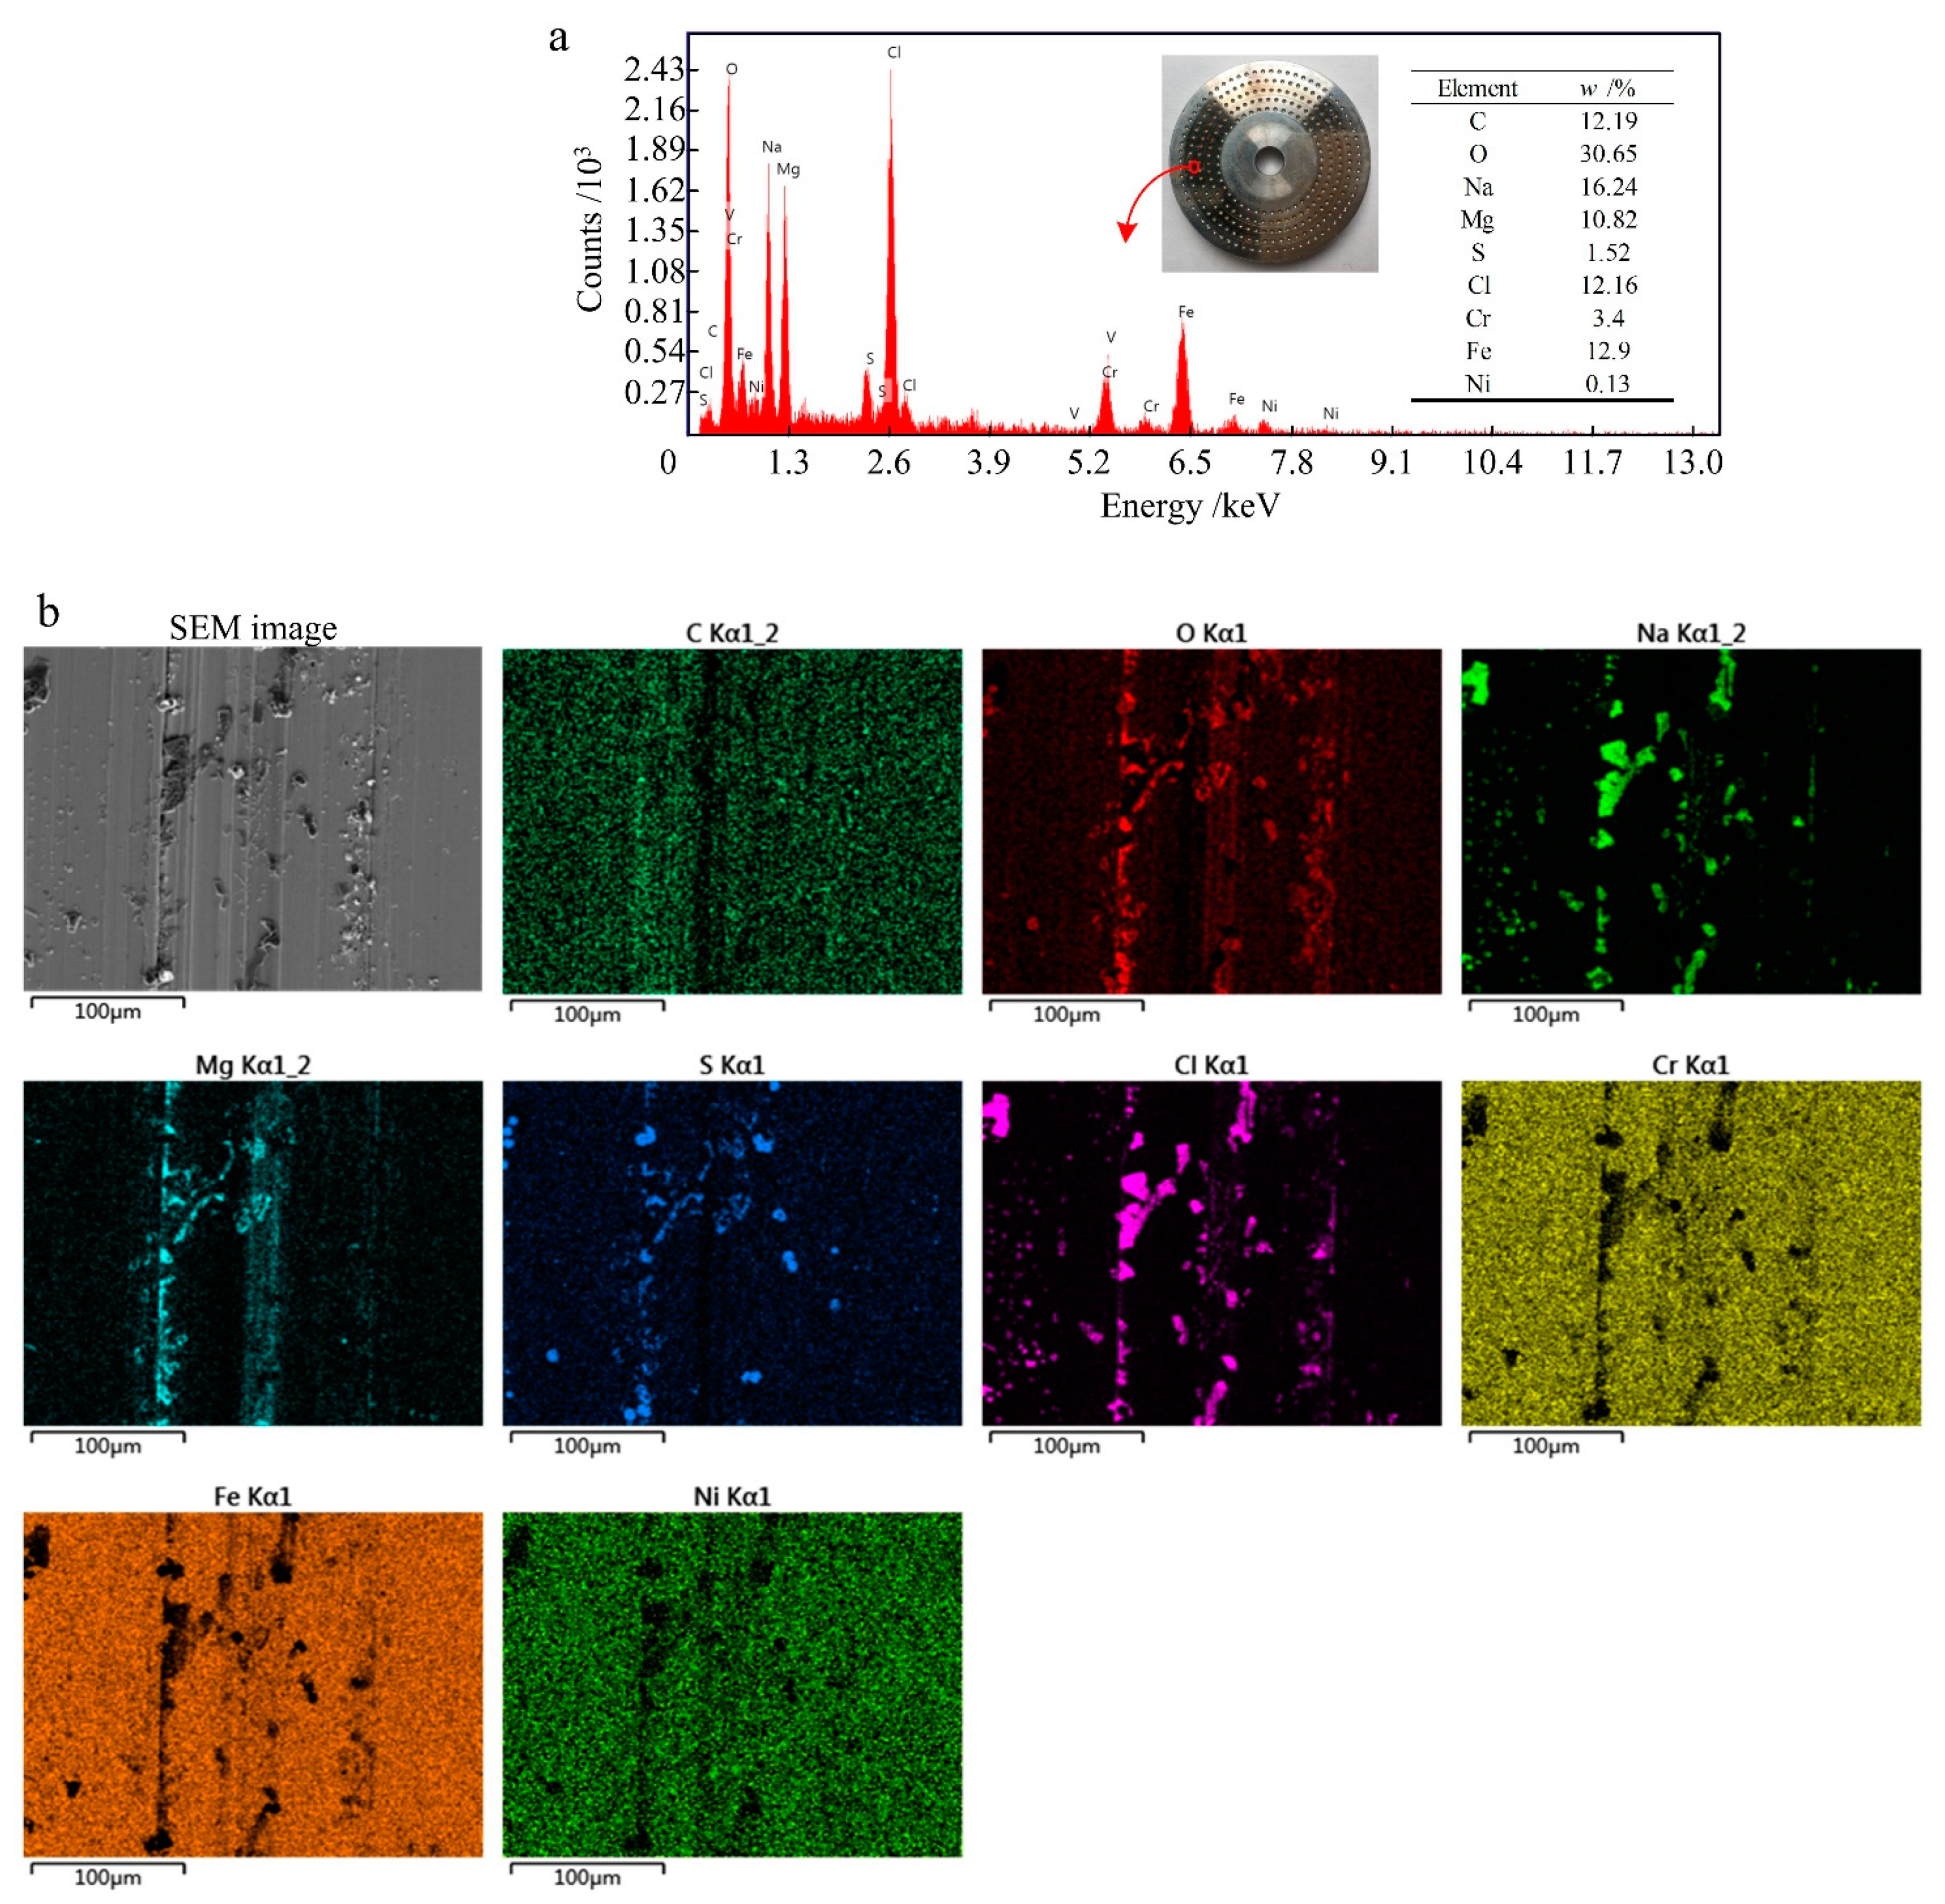
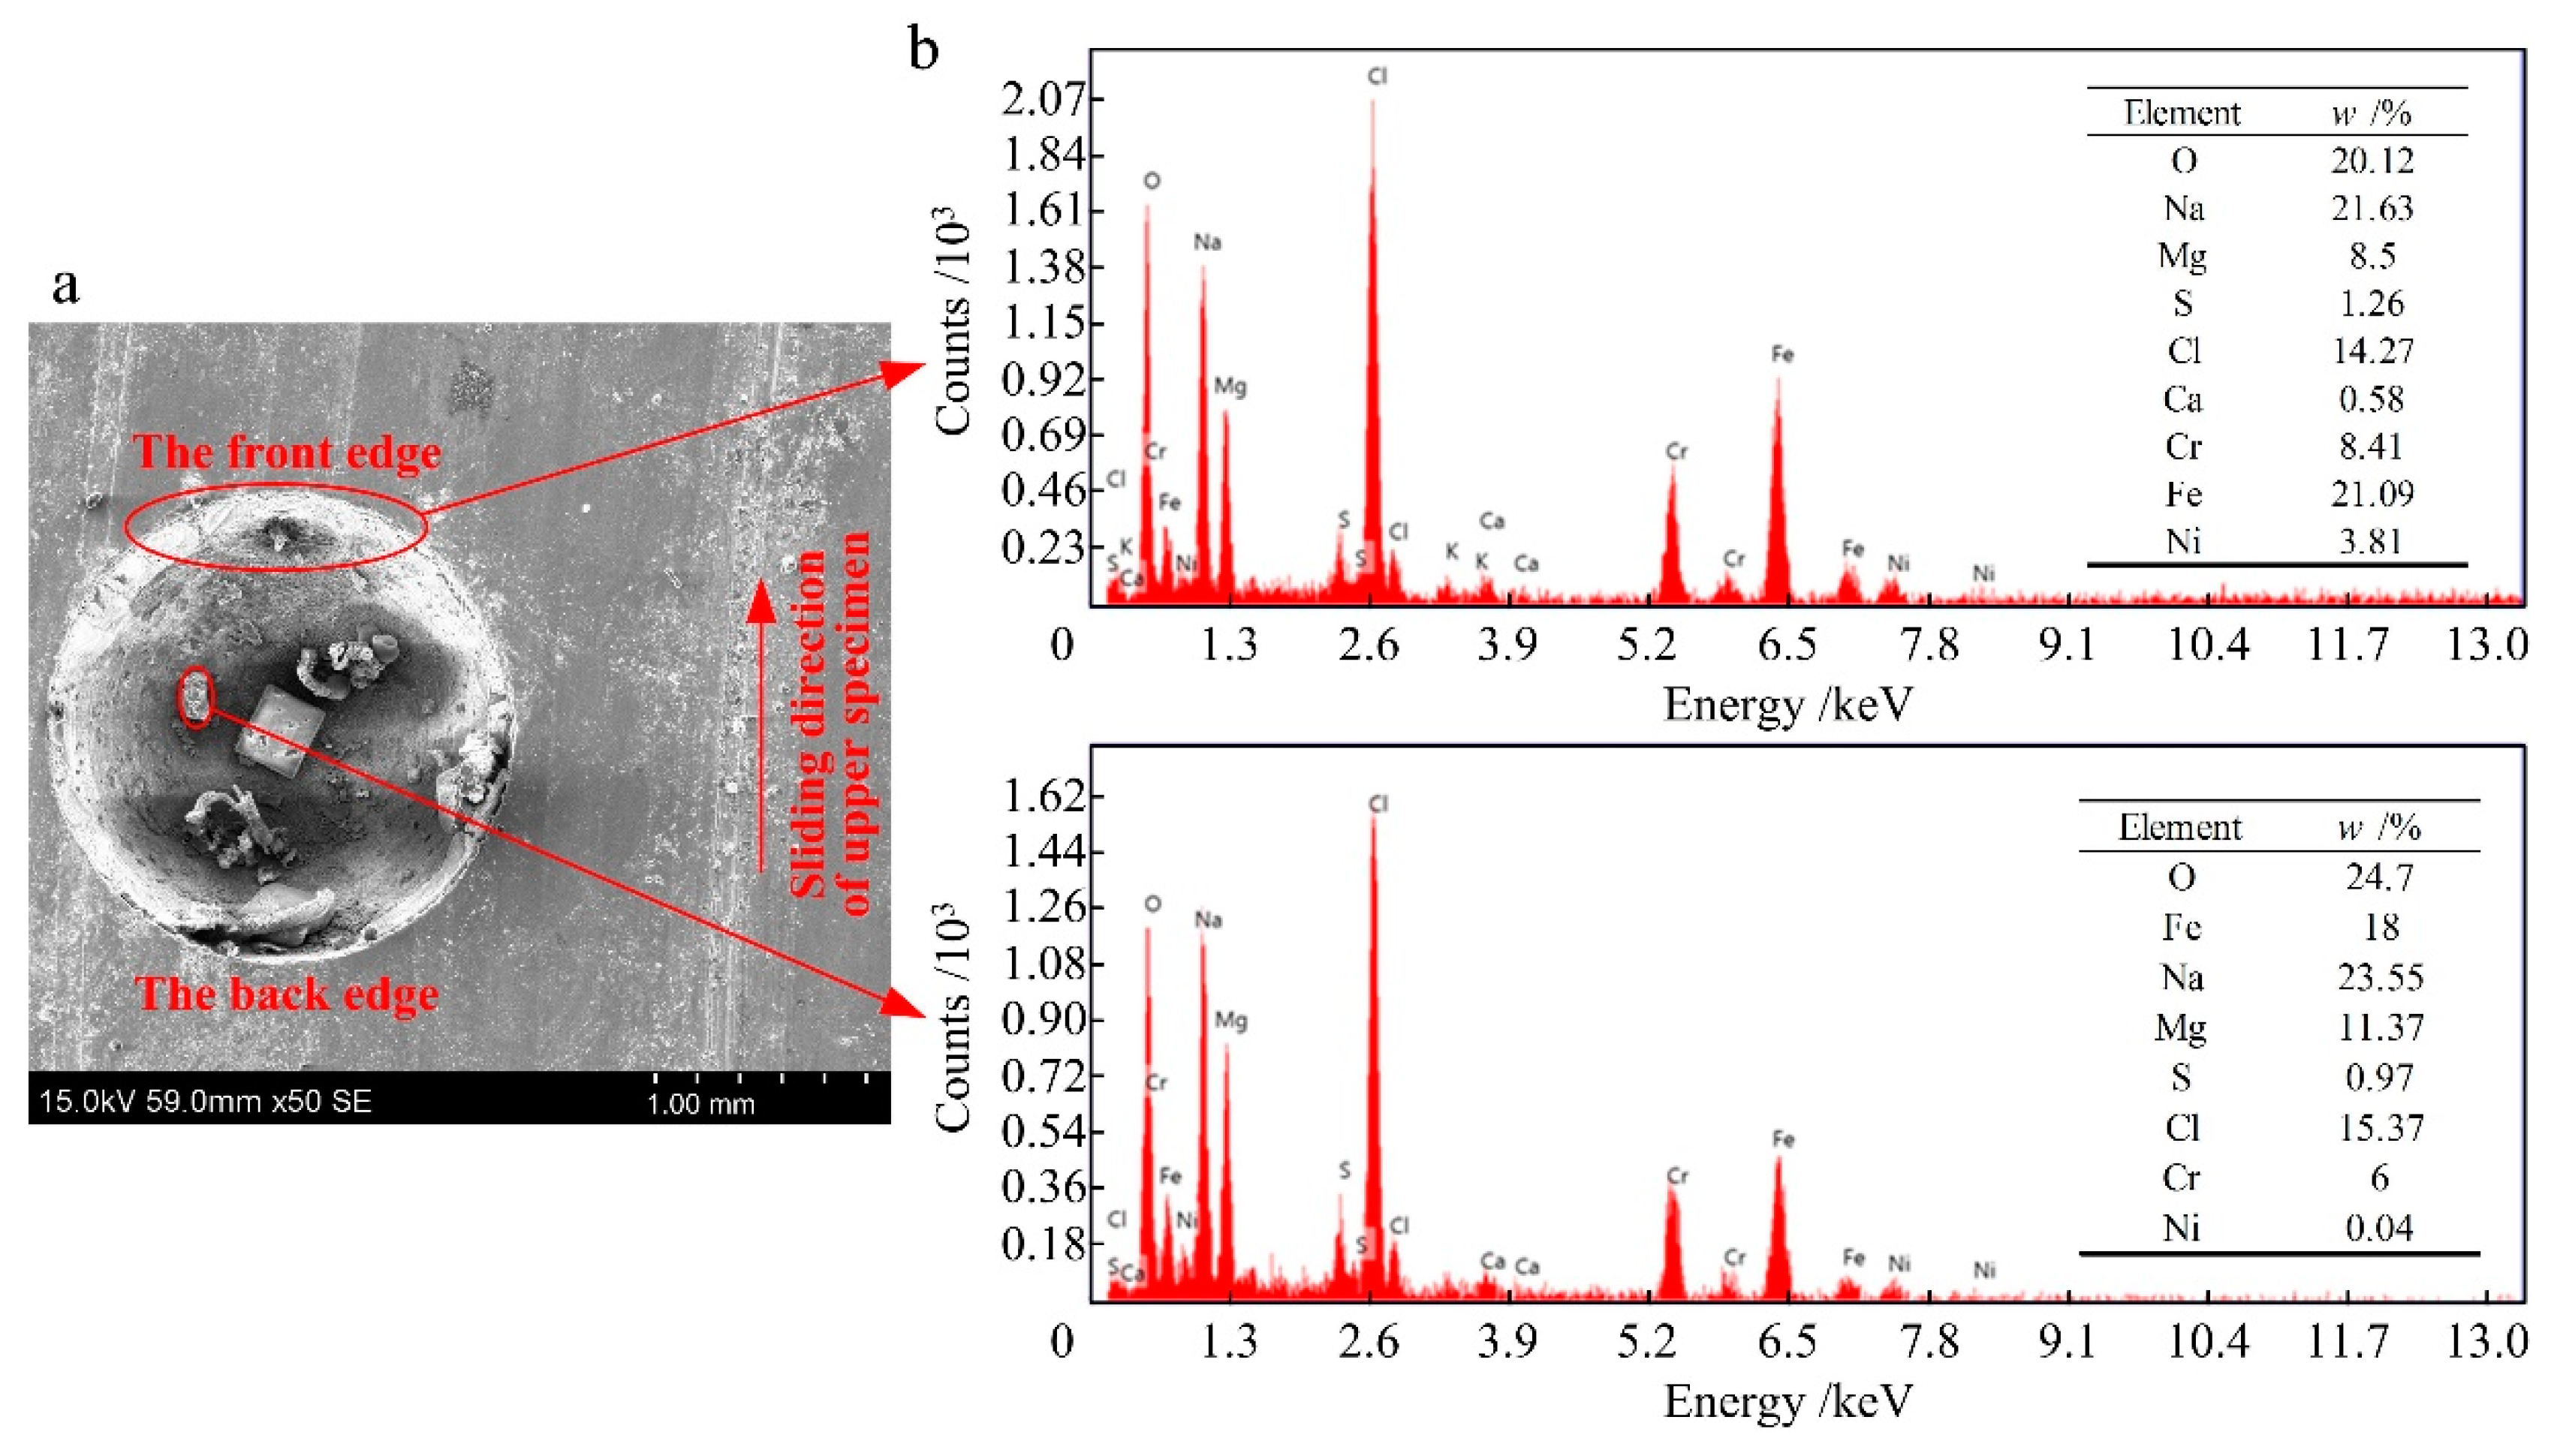
  • As the friction progresses and the temperature rises, the surface material of the upper specimen of CF/PEEK undergoes plastic deformation, falls off, and transfers to the surface of the bottom specimen of 316L stainless steel. The temperature rise also induces the oxidation of the 316L stainless steel surface, and a continuous transfer film and oxide film are gradually formed on the surface. The film avoids the direct contact of the friction surface and realizes the self-lubrication of the textured surfaces. Therefore, the friction coefficient of the upper CF/PEEK–bottom 316L friction pair is 41.9–54.5% lower than that of the upper 316L–bottom CF/PEEK friction pair.

Author Contributions

Conceptualization, Y.L. and D.G.; methodology, Y.L.; software, Z.Z. and J.G.; validation, Y.S. and Z.Z.; formal analysis, Y.L. and Z.Z.; investigation, Y.L. and J.G.; resources, Y.L.; data curation, J.G.; writing—original draft preparation, Y.L. and J.G.; writing—review and editing, D.G., Y.S., Z.Z. and J.Z.; supervision, J.Z.; project administration, D.G.; funding acquisition, Y.L. and D.G. All authors have read and agreed to the published version of the manuscript.

Funding

This research was supported by the National Natural Science Foundation of China, Grant No. 52005428, and was supported by the Natural Science Foundation of Hebei Province, Grant No. E2020203107 and Grant No. E2021203099.

Institutional Review Board Statement

Not applicable.

Informed Consent Statement

Not applicable.

Data Availability Statement

All data generated or analyzed during this study are included in this article.

Conflicts of Interest

The authors declare no conflict of interest.

References

  1. Sun, J.R.; Dai, Z.D. Bionics of non-smooth surface (I). Prog. Nat. Sci. 2008, 18, 241–246. [Google Scholar]
  2. Sun, J.R.; Dai, Z.D. Bionics of non-smooth surface (II). Prog. Nat. Sci. 2008, 18, 727–733. [Google Scholar]
  3. Andersson, P.; Koskinen, J.; Varjus, S.; Gerbig, Y.; Haefke, H.; Georgiou, S.; Zhmud, B.; Buss, W. Microlubrication effect by laser-textured steel surfaces. Wear 2007, 262, 369–379. [Google Scholar] [CrossRef]
  4. Costa, H.L.; Hutchings, I.M. Hydrodynamic lubrication of textured steel surfaces under reciprocating sliding conditions. Tribol. Int. 2007, 40, 1227–1238. [Google Scholar] [CrossRef]
  5. Tang, W.; Zhou, Y.K.; Zhu, H.; Yang, H.F. The effect of surface texturing on reducing the friction and wear of steel under lubricated sliding contact. Appl. Surf. Sci. 2013, 273, 199–204. [Google Scholar] [CrossRef]
  6. Gu, Y.Q.; Zhao, G.; Zheng, J.X.; Li, Z.Y.; Liu, W.B.; Muhammad, F.K. Experimental and numerical investigation on drag reduction of non-smooth bionic jet surface. Ocean Eng. 2014, 81, 50–57. [Google Scholar] [CrossRef]
  7. Uddin, M.S.; Liu, Y.W. Design and optimization of a new geometric texture shape for the enhancement of hydrodynamic lubrication performance of parallel slider surfaces. Biosurface Biotribol. 2016, 2, 59–69. [Google Scholar] [CrossRef] [Green Version]
  8. Gachot, C.; Rosenkranz, A.; Hsu, S.M.; Costa, H.L. A critical assessment of surface texturing for friction and wear improvement. Wear 2017, 372–373, 21–41. [Google Scholar] [CrossRef]
  9. Codrignani, A.; Frohnapfel, B.; Magagnato, F.; Schreiber, P.; Schneider, J.; Gumbsch, P. Numerical and experimental investigation of texture shape and position in the macroscopic contact. Tribol. Int. 2018, 122, 46–57. [Google Scholar] [CrossRef]
  10. Salama, M.E. The Effect of Microroughness on the Performance of Parallel Thrust Bearing; Institute of Mechanical Engineers: London, UK, 1952; pp. 149–158. [Google Scholar]
  11. Kramer, M.O. Boundary layer stabilization by distributed damping. J. Am. Soc. Nav. Eng. 1960, 74, 25–33. [Google Scholar]
  12. Hamilton, D.B.; Walowit, J.A.; Allen, C.M. A theory of lubrication by micro-irregularities. Fluids Eng. 1966, 88, 177–185. [Google Scholar]
  13. Anno, J.N.; Walowit, J.A.; Allen, C.M. Microasperity lubrication. Tribology 1968, 90, 351–355. [Google Scholar] [CrossRef]
  14. Anno, J.N.; Walowit, J.A.; Allen, C.M. Load support and leakage from microasperity-lubricated face seals. Tribology 1969, 91, 726–731. [Google Scholar] [CrossRef]
  15. Etsion, I.; Burstein, L. A model for mechanical seals with regular microsurface structure. Tribol. Trans. 1996, 39, 677–683. [Google Scholar] [CrossRef]
  16. Etsion, I.; Halperin, G.; Greenberg, Y. Increasing mechanical seal life with laser-textured seal faces. In Proceedings of the 15th Internationnal Conference, Maastricht, The Netherlands, 16–18 September 1997; pp. 3–11. [Google Scholar]
  17. Etsion, I.; Kligerman, Y.; Halperin, G. Analytical and experimental investigation of laser-textured mechanical seal faces. Tribol. Trans. 1999, 42, 511–516. [Google Scholar] [CrossRef]
  18. Etsion, I. Improving tribological performance of mechanical seals by laser surface texturing. In Proceedings of the 17th International Pump Users Symposium, Houston, TX, USA, 6–9 March 2000; pp. 17–22. [Google Scholar]
  19. Etsion, I. State of the art in laser surface texturing. J. Tribol. 2005, 127, 248–253. [Google Scholar] [CrossRef]
  20. Brizmer, V.; Kligerman, Y.; Etsion, I. A laser surface textured parallel thrust bearing. Tribol. Trans. 2003, 46, 397–403. [Google Scholar] [CrossRef]
  21. Etsion, I.; Sher, E. Improving fuel efficiency with laser surface textured piston rings. Tribol. Int. 2009, 42, 542–547. [Google Scholar] [CrossRef]
  22. Ren, L.Q.; Wang, Z.Z.; Han, Z.W. Experimental research on sliding wear of bionic nonsmoothed surface. Trans. Chin. Soc. Agric. Mach. 2003, 34, 86–92. [Google Scholar]
  23. Wakuda, M.; Yamauchi, Y.; Kanzaki, S.; Yasuda, Y. Effect of surface texturing on friction reduction between ceramic and steel materials under lubricated sliding contact. Wear 2003, 254, 356–363. [Google Scholar] [CrossRef]
  24. Yang, Z.J.; Han, Z.W.; Ren, L.Q. Friction and wear behavior of bionic non-smooth surfaces at high temperature. Tribology 2005, 25, 374–378. [Google Scholar]
  25. Wang, X.L.; Adachi, K.; Otsuka, K.; Kato, K. Optimization of the surface texture for silicon carbide sliding in water. Appl. Surf. Sci. 2006, 253, 1282–1286. [Google Scholar] [CrossRef]
  26. Chen, K.; Wang, Y.; Cao, K.Y.; Song, X.W. Analysis of aerodynamic drag reduction on automobile by using bionic non-smooth surface. China Mech. Eng. 2011, 23, 1001–1006. [Google Scholar]
  27. Wang, Z.Q.; Gao, D.R. Friction and wear properties of stainless steel sliding against polyetheretherketone and carbon-fiber-reinforced polyetheretherketone under natural seawater lubrication. Mater. Des. 2014, 53, 881–887. [Google Scholar] [CrossRef]
  28. Wu, S.F.; Gao, D.R.; Liang, Y.N.; Chen, B. Influence of non-smooth surface on tribological properties of glass fiber-epoxy resin composite sliding against stainless steel under natural seawater lubrication. Chin. J. Mech. Eng. 2015, 28, 1171–1176. [Google Scholar] [CrossRef]
  29. Yang, H.Y.; Zhou, H. Some key problems of the water hydraulics. Chin. J. Mech. Eng. 2002, 38, 96–100. [Google Scholar] [CrossRef]
  30. Lachner, H. Hydrostatic lagerungen in axialkolbenmachine. Hydraul. Pneum. 1974, 18, 605–611. [Google Scholar]
  31. General Administration of Quality Supervision, Inspection and Quarantine of the People’s Republic of China; Standardization Administration of the People’s Republic of China. GB 17378.4-2007. The Specifications for Marine Monitoring-Part 4: Seawater Analysis; Standards Press of China: Beijing, China, 2008.
  32. Wen, S.Z.; Huang, P.; Tian, Y.; Ma, L.R. Principles of Tribology; Tsinghua University Press: Beijing, China, 2018. [Google Scholar]
  33. Liang, Y.N.; Gao, D.R.; Zhao, J.H. Tribological properties of friction pair between 316L stainless steel and CF/PEEK with nonsmooth surface under seawater lubrication. Tribol. Trans. 2020, 63, 658–671. [Google Scholar] [CrossRef]
  34. Liang, Y.N.; Gao, D.R.; Chen, B.; Zhao, J.H. Friction and wear study on friction pairs with a biomimetic non-smooth surface of 316L relative to CF/PEEK under a seawater lubricated condition. Chin. J. Mech. Eng. 2019, 32, 66. [Google Scholar] [CrossRef] [Green Version]
Figure 1. Lubrication model of a friction pair with a hemispherical-pit surface.
Applsci 11 09915 g001
Figure 2. Configuration and original surface morphology of friction pairs: (a) bottom specimen, with a smooth surface; (b) bottom specimen, with a hemispherical-pit surface.
Applsci 11 09915 g002
Figure 3. Schematic of the MMD-5A friction and wear tester, and the installation of the specimens.
Applsci 11 09915 g003
Figure 4. Velocity vector of the circumferential profile at a d5 = 38 mm distribution circle: (a) smooth surface; (b) hemispherical-pit surface.
Applsci 11 09915 g004
Figure 5. Pressure contour of the circumferential profile of a d5 = 38 mm distribution circle and the pressure curve of the seawater film’s upper surface at the corresponding position: (a) smooth surface; (b) hemispherical-pit surface.
Applsci 11 09915 g005
Figure 6. Pressure contour of the seawater film upper surface of the computational fluid field: (a) smooth surface; (b) hemispherical-pit surface.
Applsci 11 09915 g006
Figure 7. Histogram of the bearing capacity for different types of friction pairs.
Applsci 11 09915 g007
Figure 8. Variation in the friction coefficient with the test time for different friction pairs: (a) smooth surface; (b) hemispherical-pit surface.
Applsci 11 09915 g008
Figure 9. Curve dependence of the average friction coefficient on the rotation speed for different friction pairs.
Applsci 11 09915 g009
Figure 10. Stribeck curve.
Applsci 11 09915 g010
Figure 11. Variation in the specimen contact temperature with the test time for different friction pairs: (a) smooth surface; (b) hemispherical-pit surface.
Applsci 11 09915 g011
Figure 12. Curve dependence of the average specimen contact temperature on the rotation speed for different friction pairs.
Applsci 11 09915 g012
Figure 13. Specimen wear rate for different friction pairs: (a) upper specimen CF/PEEK, and (b) bottom specimen 316L.
Applsci 11 09915 g013
Figure 14. Wear surface morphology of the smooth-surface friction pair (P = 300 N, n = 1500 r/min): (a) photograph of CF/PEEK, (b) LSCM image of CF/PEEK, (c) SEM image of CF/PEEK, (d) photograph of 316L, (e) LSCM image of 316L, and (f) SEM image of 316L.
Applsci 11 09915 g014
Figure 15. Wear surface morphology of the hemispherical-pit surface friction pair (P = 300 N, n = 1500 r/min): (a) photograph of CF/PEEK, (b) LSCM image of CF/PEEK, (c) SEM image of CF/PEEK, (d) photograph of 316L, (e) LSCM image of 316L, and (f) SEM image of 316L.
Applsci 11 09915 g015
Figure 16. EDS analysis of the wear surface of the CF/PEEK upper specimen (P = 300 N, n = 1500 r/min): (a) energy spectrum diagram; (b) surface scanning diagram.
Applsci 11 09915 g016aApplsci 11 09915 g016b
Figure 17. EDS analysis of the wear surface of the 316L bottom specimen (P = 300 N, n = 1500 r/min): (a) energy spectrum diagram; (b) surface scanning diagram.
Applsci 11 09915 g017
Figure 18. EDS analysis of the debris in a hemispherical pit on the 316L bottom specimen after wear (P = 300 N, n = 1500 r/min): (a) SEM image; (b) energy spectrum diagram.
Applsci 11 09915 g018
Figure 19. SEM of the wear surface of hemispherical-pit surface friction pair at different speeds (P = 300 N): (a) CF/PEEK surface, n = 1000 r/min; (b) 316L surface, n = 1000 r/min; (c) 316L pit, n = 1000 r/min; (d) CF/PEEK surface, n = 1750 r/min; (e) 316L surface, n = 1750 r/min; and (f) 316L pit, n = 1750 r/min.
Applsci 11 09915 g019
Figure 20. Three-dimensional topography of the wear surface of the hemispherical-pit surface friction pair at different speeds (P = 300 N): (a) CF/PEEK, n = 1000 r/min; (b) 316L, n = 1000 r/min; (c) CF/PEEK, n = 1750 r/min; (d) 316L, n = 1750 r/min.
Applsci 11 09915 g020
Table 1. Physical and mechanical properties of CF/PEEK.
PropertyStandardValue
Density
ρ/(g/cm3)
ISO 11831.4
Water absorption (25 °C, 24 h)
W/%
ISO 620.06
Rockwell hardness
HRR
ASTM D785107
Heat deflection temperature
HDT/°C
ASTM D648315
Thermal expansion coefficient
α/(10–5/°C)
ASTM D6961.5
Tensile strength (23 °C)
σb/MPa
ISO 527-2/1B/50220
Bending strength (23 °C)
σbb/MPa
ISO 178298
Compression strength (23 °C)
σbc/MPa
ASTM D695240
Table 2. Chemical constituents of 316L stainless steel.
ElementCSiMnSPCrNiMo
w/%≤0.03≤1.0≤2.0≤0.03≤0.04516.0–18.010.0–14.02.0–3.0
Table 3. Physical and mechanical properties of 316L stainless steel.
PropertyStandardValue
Density
ρ/(g/cm3)
GB/T 20878-20078.03
Elastic modulus
E/GPa
206
Brinell hardness
HB
230
Elongation
δ/%
30
Thermal conductivity
λ/(W/(m·k))
16.3
Thermal expansion coefficient
α/(10–6/°C)
16.0
Tensile strength
σb/MPa
620
Yield strength
σs/MPa
310
Table 4. Main chemical components of seawater.
ElementAverage Concentration
/(g/kg Seawater)
ElementAverage Concentration
/(g/kg Seawater)
Na10.77Cl19.354
K0.399S0.904
Ca0.412Br0.067
Mg1.29C0.0276
Sr0.0079F0.0013
Table 5. Working conditions and testing program.
Friction PairRotation Speed
n/(r/min)
Sliding Speed
v/(m/s)
Load
P/N
Time
t/s
Temperature
T/°C
1Bottom specimen with smooth surface
Bottom specimen with hemispherical-pit surface
10001.5730010,80022–26
(room)
212501.96
315002.36
417502.75
Publisher’s Note: MDPI stays neutral with regard to jurisdictional claims in published maps and institutional affiliations.

