1. Introduction
Even during the perilous era of COVID-19, the burden of cardiovascular disease in the modern world is quite severe. This occurs not only because CVD represents one of the single highest causes of mortality in high-income countries, but mostly because it is in the top five most common causes of mortality in low-income countries with a growing tendency in the years to come [
1]. Thus, “seeing” and understanding cardiac function is imperative, first to help us differentiate normal and healthy from abnormal and pathological, and second to guide the physicians towards an appropriate treatment for the patients that are being affected by cardiovascular disease.
Cardiac imaging consists of many different modalities that can reproduce a visual representation, meaning images and videos from which, after proper analysis, we can extract useful information concerning cardiac function. This general term of “cardiac function” describes a sequence of precisely timed electromechanical events such as chamber contraction, blood outflow, chamber expansion, blood inflow, valvular openings and closures. This sequence makes the heart work as a hydraulic pump that supplies oxygenated blood to the rest of the body.
2. Background
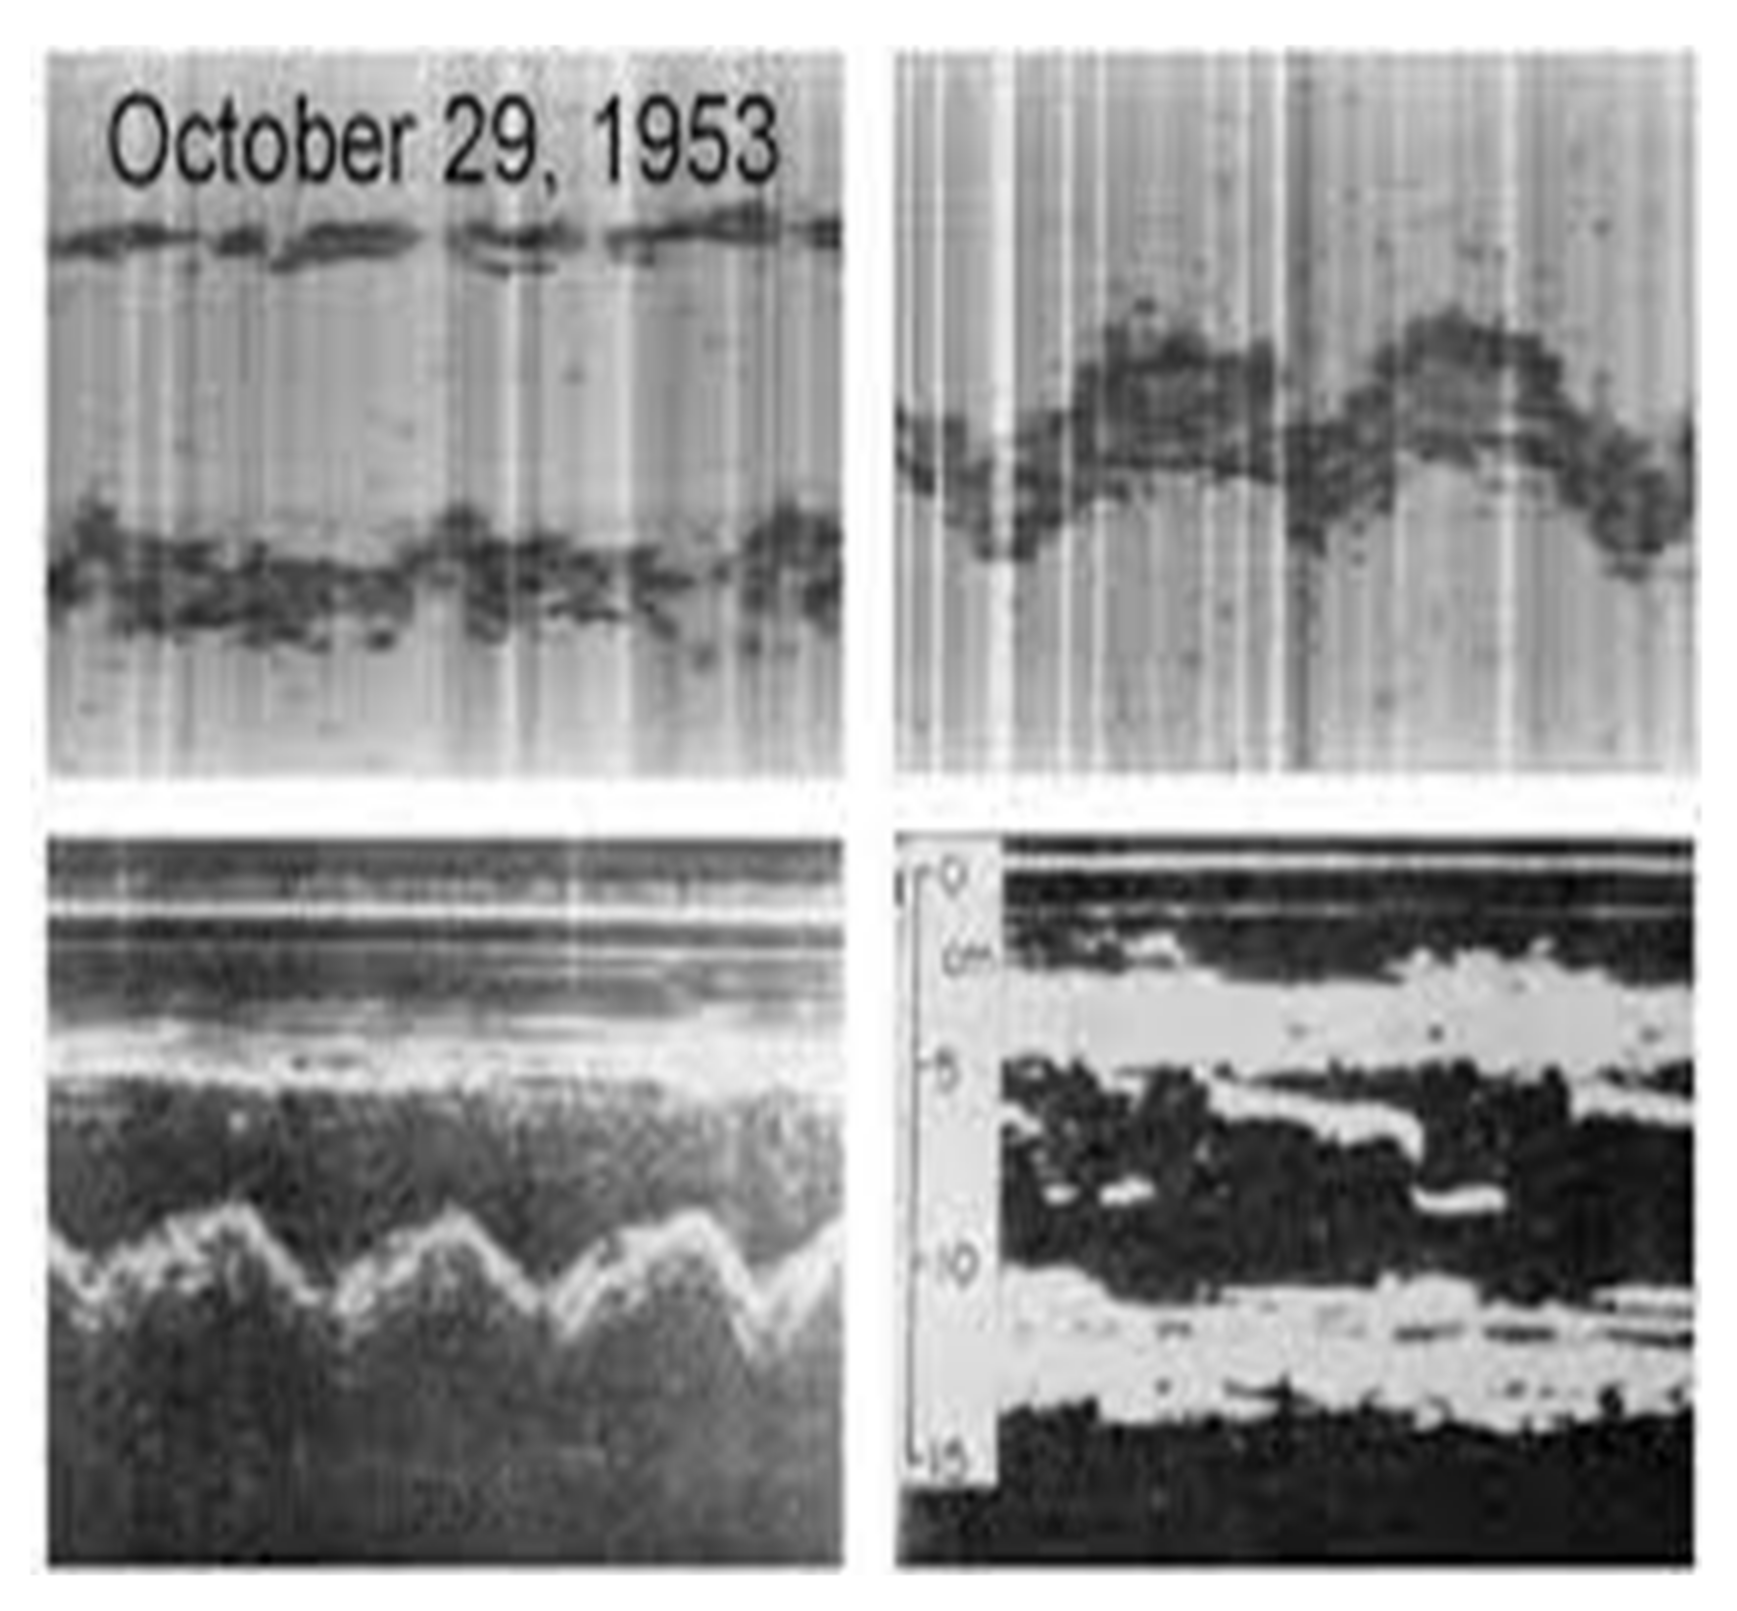
Undoubtedly the history of cardiac imaging is marked by the original description of the M-mode modality of echocardiography in 1953, by Prof. Inge Edler and his physicist friend Hellmuth Hertz (
Figure 1). In 1967, Sir Godfrey Hounsfield using X-ray technology presented the first CT scanner at EMI Central Research Laboratories. Five years later in March 1973, Paul C. Lauterbur proceeded in the publication of his theory explaining a mechanism to encode spatial information into an NMR signal with the use of magnetic field gradients, thus introducing magnetic resonance imaging. During the same period, Peter Mansfield further refined the techniques in MR signal analysis in the late 1970s and 1980s [
2,
3,
4].
In the last decades, there has been a technological revolution that has allowed us to non-invasively analyze cardiac function. The collaboration of clinical medicine and applied engineering has been quite fruitful in the second half of the 20th century and has produced many different modalities, such as cardiac echocardiography, magnetic resonance imaging (MRI), myocardial perfusion imaging via nuclear scintigraphy, and computed tomography (CT). With those tools, it is possible to visualize in remarkable detail the muscular tissue, the cardiac valves, the coronary arteries, and the heart vasculature. Cardiologists use them every day all around the world and as a result cardiac imaging has become indispensable to everyday clinical practice.
3. Echocardiography
The physics behind echocardiography is essentially based on the use of high-frequency sound waves, or ultrasounds, that are emitted by a piezoelectric crystal inside a transducer. Ultrasounds penetrate the soft tissues underneath and, in the case of echocardiography, throughout the heart chambers and the great thoracic vessels. Those sound waves interact through various mechanisms with the cardiac structures—reflection, refraction, scattering, attenuation, and absorption—and they return back to the transducer. After sophisticated analysis of the incoming sound waves, we can produce a real-time image of the heart anatomy at up to 100 frames per second with continuous chamber and blood movement visualization [
5].
3.1. Transthoracic Echocardiography (TTE)
The cardiac muscle appears as a variation of grey, blood and fluid appear as black (hypoechogenic), while reflective surfaces and calcified tissue appear as white (hyperechogenic). By positioning the transducer on the thorax, we can visualize the heart from multiple sites, making it possible to see in detail the anatomic parts of the heart and their movement throughout the cardiac cycle. Moreover, we can calculate the volumes of the atrium and ventricles during full systole and diastole (e.g., left ventricle ejection fraction), the thickness of the ventricular walls, the size of the aorta and other vessels, and monitor the opening and the closing of the four main cardiac valves (
Figure 2).
In addition, with the Doppler function, we can determine the direction of blood flow, towards or away from the transducer, the type of flow (laminar or turbulent), as well as the velocity of blood flow. Moreover, with appropriate mathematical equations such as the simplified Bernoulli equation, we can calculate pressure differences between the cardiac chambers [
5]. Finally, by adding the factor of stress, either by physical exertion or pharmacologically, while performing a stress echocardiography (SE) exam, we can expand our diagnostic field with many clinical implementations. This approach offers us additional information on cardiac function during stress conditions, such as evaluation of new wall motion abnormalities, myocardial viability, contractile reserve, valve motion deterioration, and significant pressure changes inside the cardiac cavities, which are connected to different cardiac diseases such as ischemic cardiomyopathy, rheumatic valve disease, pulmonary hypertension, etc.
3.2. Transesophageal Echocardiography (TEE)
By positioning the transducer on an endoscope that can be inserted into the esophagus and the stomach, we can perform transesophageal echocardiography (
Figure 3). With this variation, we can “see” the heart from the “back” with fewer obstacles and artifacts, and consequently we can achieve better visualization of the valves and the atrium chambers, the interatrial septum, and we can approach hidden anatomic sites like the left and right appendage, as well as the pulmonary veins [
5,
6]. We use these techniques primarily for the detection of interatrial defects like patent foramen ovale (PFO), atrial septal defects (ASD), to establish or not cases of infective endocarditis, to detect intracardiac thrombus, and to analyze the mechanism behind the malfunction of native or prosthetic cardiac valves. We also use TEE throughout cardiothoracic surgeries, such as coronary aorta bypass graft, prosthetic valve surgeries, as well as in cardiac transplantation surgeries. Last but not least, TEE has become indispensable as an echo-guidance technique during transcutaneous procedures such as transfemoral aortic valve implantation (TAVI), left atrial appendage occlusion (LAAO), and more recently during clipping procedures for mitral and tricuspid valve pathology.
3.3. Three-Dimensional Echocardiography (3DE)
Three-dimensional echocardiography (3DE) is a relatively new innovative technique, which has become an extremely valuable asset in cardiac imaging. The miniaturization of electronics and the advancement of in-element interconnection technology has resulted in the development of matrix array transducers, which allow the acquisition of large pyramidal data sets. After highly sophisticated signal analysis combined with increased computational processing power, we can produce realistic real-time three-dimensional representations of the heart structures with a high temporal and spatial resolution (
Figure 4 and
Figure 5). From these 3D models we can extract useful information concerning the volume quantification of cardiac chambers, realistic anatomical views of valves, as well as precise oversight of regurgitant lesions and shunts. Indeed, 3DE color Doppler imaging offers a new perspective in the evaluation of cardiac function. Last but not least, with the revolutionary advancement of percutaneous structural procedures such as transfemoral aortic valve replacement, clip therapy for mitral and tricuspid valve pathology, occlusion devices, etc., real-time 3DE echocardiography has become indispensable for the accurate guiding and monitoring of these procedures in the catheterization laboratory [
5,
6,
7].
3.4. Strain Imaging (STE)
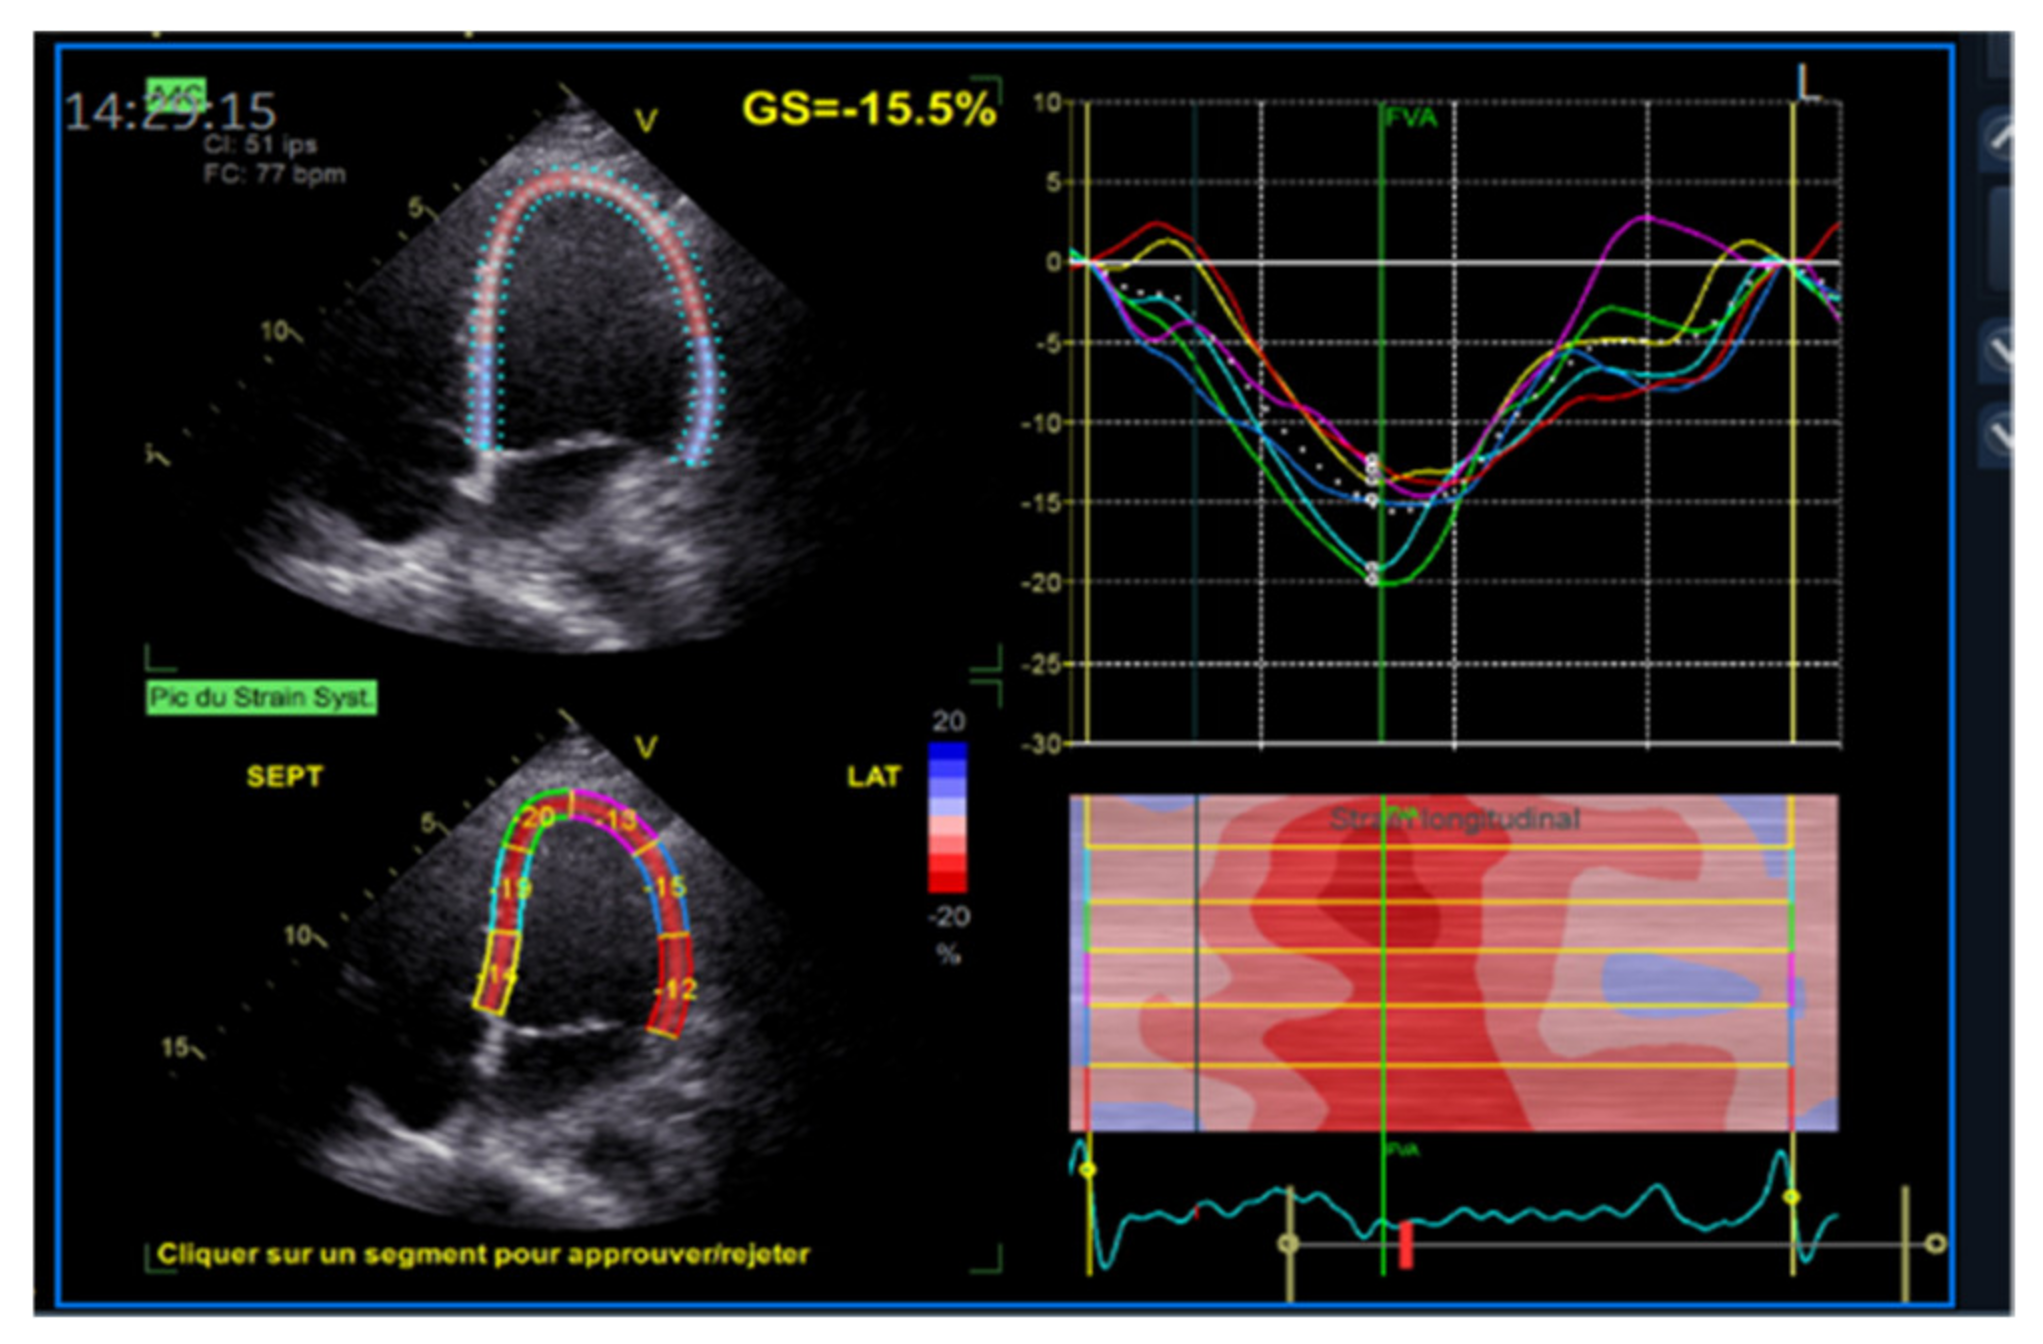
Further knowledge of cardiac function has been acquired using echocardiography strain imaging. Strain and strain rate, which is the first derivative of strain, reflect the deformation and the speed of deformation of myocardial tissue. With these two measures, it is possible to objectively quantify global and segmental myocardial function. The first modality was introduced as a post-processing feature of Doppler myocardial imaging (DMI), with velocity data converted to strain and strain rate curves and color-coded images. More recently we were able to track characteristic speckle patterns created by interference of ultrasound beams in the myocardium, which led to the newest and more reproducible method for strain measurement called speckle-tracking echocardiography. From the accumulative geometrical shift of the speckles, we can calculate the segmental and overall strain and strain rate (
Figure 6 and
Figure 7). The main advantage of this technique is that it is two-dimensional and angle-independent. When used for the study of the motion of the left ventricle (LV) mechanics, there have been described four principal types of strain or deformation: longitudinal, radial, circumferential, and circumferential–longitudinal shear occurring along with the long axis LV, which results in rotational deformation (twisting and torsion). By applying the same principles of two-dimensional STE, we can access the systolic and diastolic functions of the right ventricle, the left and right atrium [
8].
3.5. Myocardial Work (MW)
A new approach to cardiac mechanics and function that can overcome some of the limitations of the previously described techniques consists of a new imaging tool called myocardial work (MW). Non-invasive MW is calculated as the area of the pressure–strain loop, globally or for each LV segment [
9,
10,
11]. Computation of the pressure–strain loop areas requires measurement of LV longitudinal strain using speckle-tracking echocardiography (STE), measurement of brachial artery systolic pressure by the cuff method, and setting of valvular event times that give us segmental and global values of myocardial work (Global Work Index: GWI). Several additional indices of MW are also calculated, such as constructive work (GCW), which is the positive work performed by a segment during shortening in systole and reflects the work that contributes to pump blood out to the circulation. Wasted work (GWW) can be calculated as work produced by a wall segment during lengthening in systole and during shortening in isovolumic relaxation. WW represents energy not contributing to blood ejection in the circulation. There is a slight difference between men and women where GWI is higher in women, and it increases with age. Only 5% of work is usually wasted in normal hearts. In other words, myocardial work and its indices are a tool for cardiac function efficiency and provide insight into myocardial energetics. In modern practice, it provides added value in the assessment of various cardiomyopathies and has proven utility in the assessment of patients who are recipients of cardiac resynchronization therapy (CRT) [
12,
13,
14] (
Figure 8).
4. Cardiac Magnetic Resonance (CMR)
Cardiac magnetic resonance imaging (CMR) exploits the capacity of hydrogen protons that are abundant in the water and in the fat of biological tissues to absorb radiofrequency energy when placed in an external magnetic field. As a result, an evolving spin polarization can induce a signal in a radiofrequency coil, to be detected by antennas and after signal analysis to reconstruct high-resolution images. The most common CMR sequences are T1-weighted and T2-weighted scans in which we can measure very accurately left and right ventricular volumes, ventricular mass, atrial volumes, and vessel dimensions [
15].
4.1. T1-T2–LGE
One of the main advantages of CMR over other imaging techniques relies on myocardial tissue characterization. T1-weighted sequences are very useful to visualize cardiac anatomy in great detail and detect the presence of intra-myocardial fat. T1 mapping can also quantify myocardial fibrosis [
16]. For the detection of myocardial edema, the best modality is the use of T2-weighted imaging. Additionally, the use of contrast agents such as gadolinium can significantly increase the diagnostic capacities of CMR (
Figure 9 and
Figure 10). Late gadolinium enhancement (LGE) is a useful tool for the proper identification of infarcted myocardium. This technique is mainly used along with perfusion CMR to assess whether a wall region in question is ischemic or infarcted (scar) [
17,
18].
4.2. Cine Sequences
Further functional and structural information can be acquired thanks to the development of a magnetic resonance sequence called balanced steady-state free precession (bSSFP) cine imaging. They are usually retrospectively gated and have intrinsically high contrast. Images are typically planned sequentially to achieve the standard cardiac planes to access left and right ventricular size and function and can be played in video mode which allows evaluation of biventricular volume, mass, and EF with valvular motion [
16,
17,
18].
4.3. Myocardial Tagging
Another useful modality of CMR similar to strain imaging is called myocardial tagging, which uses a grid of saturated areas over a cine image slice, allowing visualization of grid deformation over time. Normal myocardium will show uniform grid deformation during the cardiac cycle. Myocardial tagging offers a reproducible method for evaluating regional cardiac function and timing in longitudinal, radial, and circumferential directions [
16,
19].
4.4. Phase-Contrast Imaging—4D Flow
Phase-contrast imaging uses bipolar gradients to encode velocity in a given direction and is used to assess valve diseases and quantify intracardiac communications or shunts. Conventional phase-contrast imaging can be extended by applying flow-sensitive gradients in three orthogonal planes within a 3D volume throughout the cardiac cycle. The use of time-resolved 3D PC MRI with three-directional flow velocity encoding, referred to as 4D flow MRI, allows for the comprehensive in vivo measurement of 3D blood flow dynamics in the heart and in the large vessels, with full volumetric coverage throughout the cardiac cycle. The resulting data (3D + time + 3 velocity directions) allow for the calculation of a multitude of derived fluid mechanics parameters, such as wall shear stress (WSS), kinetic energy, and pressure gradients [
20].
5. Computed Tomography (CT)
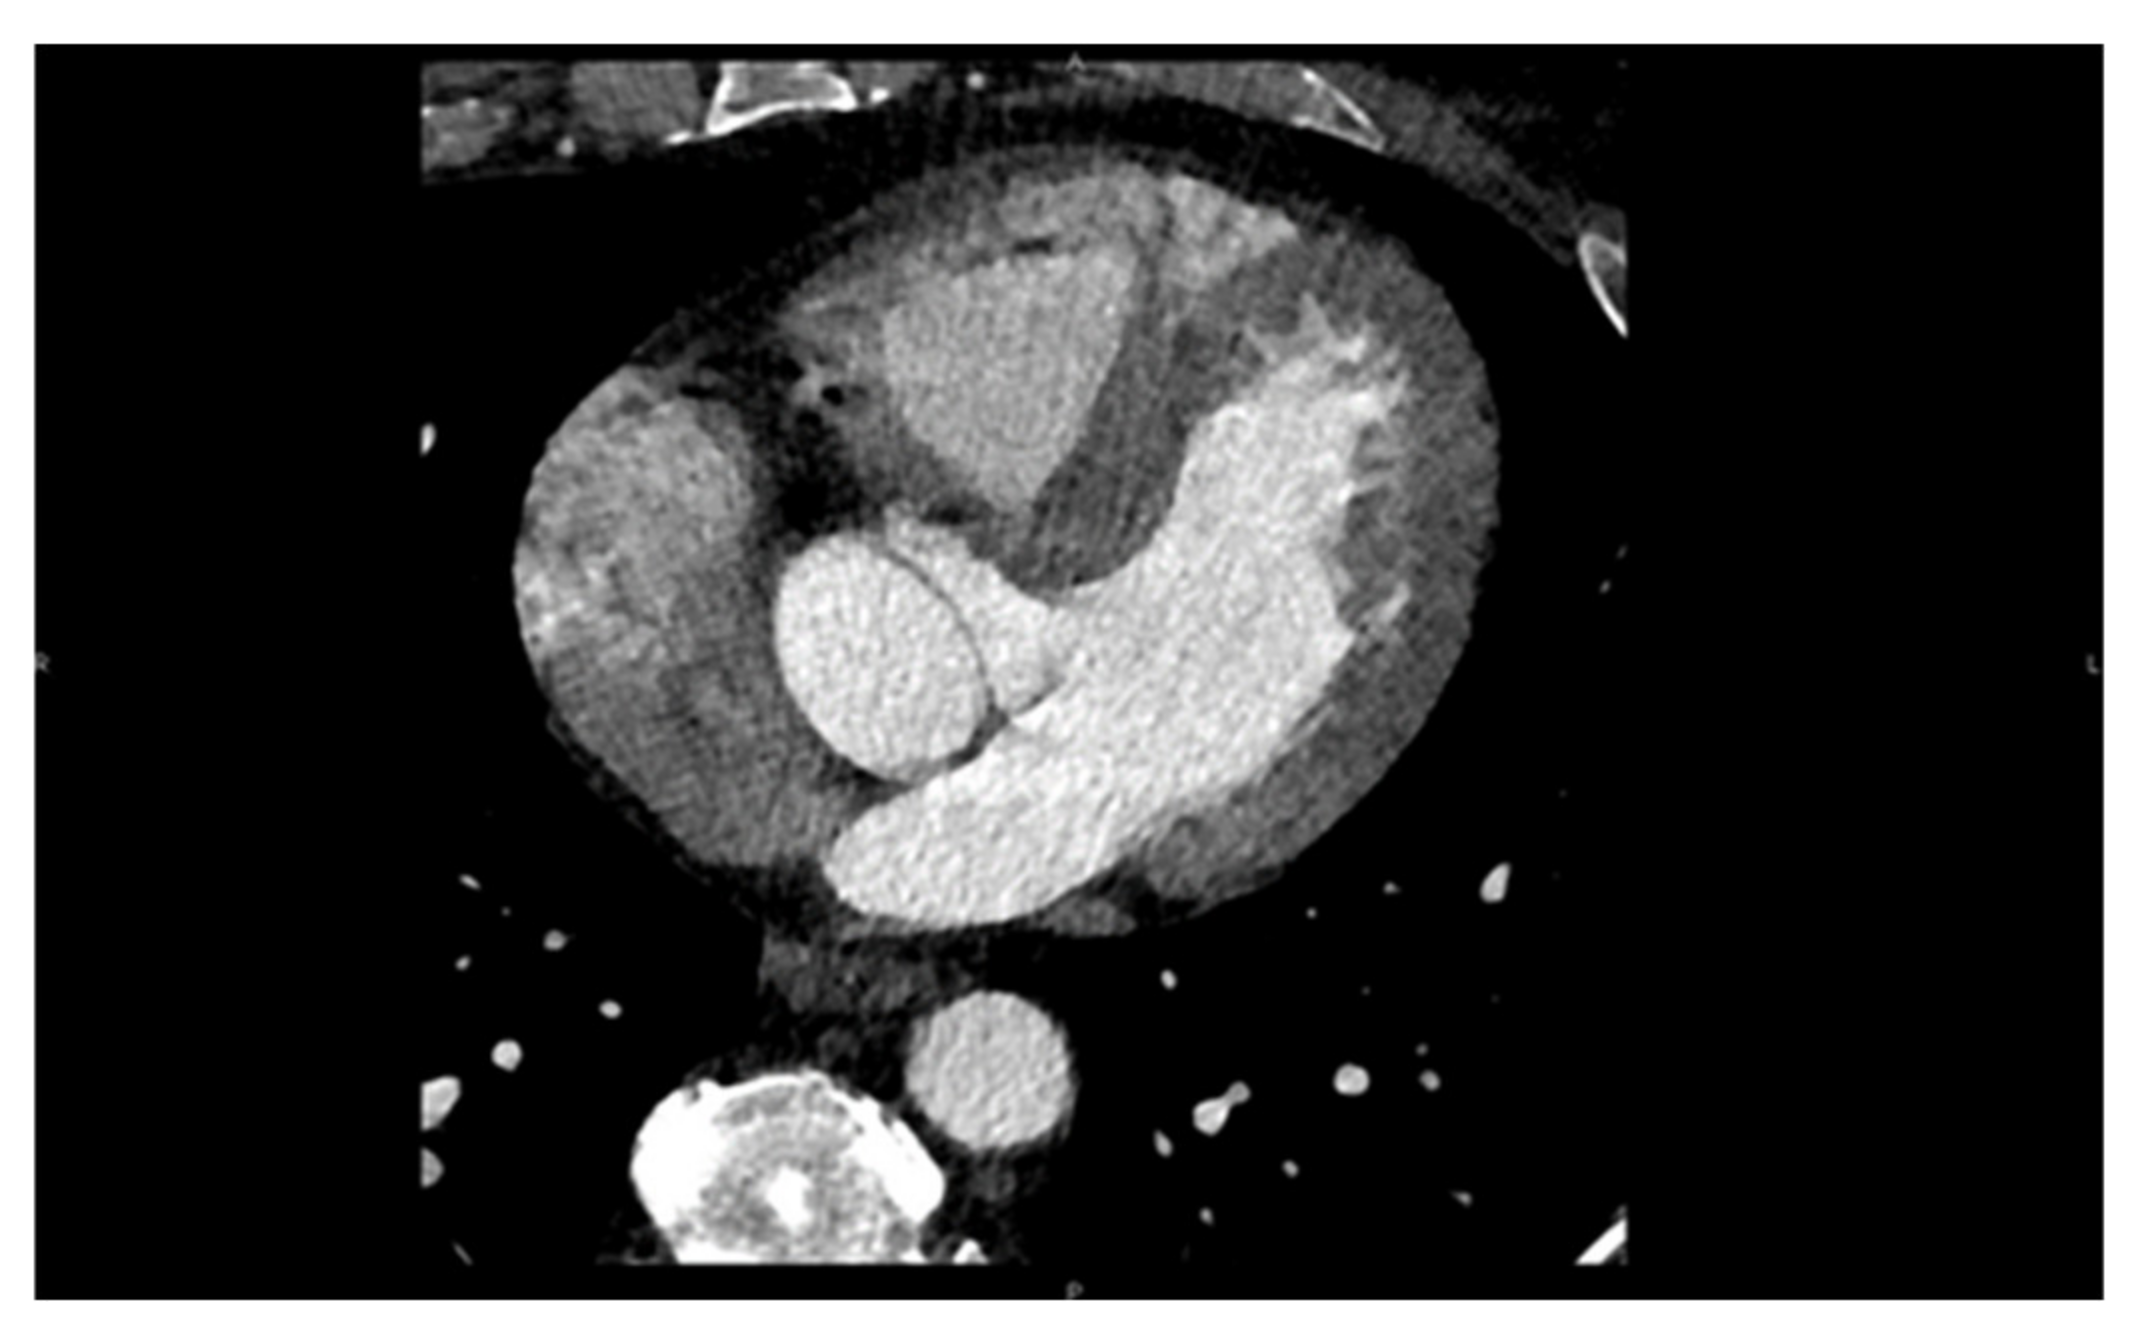
Cardiac computed tomography uses multiple X-ray beams emitted by a CT scanner rotating at very high speed and various angles in order to create cross-sectional images. The X-ray beams travel through the body, and they are collected by a detector array that can generate an image. Depending on the path of the beam through tissues of varying densities, a greyscale signal is created. Bone appears white (hyper-dense); the air is black (hypo-dense), blood and muscle are various shades of grey (
Figure 11). Contrast is often used in order to enhance differentiation between tissues [
21,
22]. Coronary angiography also makes use of X-rays in order to visualize the heart vasculature without the need for invasive coronary catheterization. Via software post-analysis we can produce a three-dimensional image of heart vessels and evaluate atherosclerotic and stenotic lesions (
Figure 12 and
Figure 13). With computed tomography we can also visualize the accumulated calcium that is concentrated in different cardiac structures, such as the mitral annulus and leaflets, aortic cusps, pericardium, and coronary arteries, and quantify it via Agaston units or calcium score. For example, in aortic stenosis with the use of established thresholds of calcium score, we can differentiate between severe forms of the disease in special cases and choose the appropriate treatment for them [
23,
24]. Additionally, we can calculate the coronary calcium score (CAC), which according to the latest US and European guidelines can be used as a risk modifier in atherosclerotic coronary artery disease with incremental value in primary prevention [
25,
26,
27].
CT-FFR
Coronary computed tomography fractional flow reserve (CT-FFR) has emerged as a game-changing technology. The CT-FFR technique uses CTA images and computational fluid dynamic (CFD) techniques to estimate virtual FFR values throughout the coronary tree. It offers insight into the hemodynamic consequence of a specific anatomic coronary lesion; consequently, this technique is poised to become a potential gatekeeper to the catheterization laboratory [
28].
6. Nuclear Imaging
6.1. SPECT
Myocardial perfusion imaging (SPECT) is a well-established method to evaluate cardiac function. More precisely it can access coronary artery function and can accurately differentiate regions of viable from ischemic, stunned, or scarred myocardium. It involves the injection of intravenous radioactive tracers that are trapped in the myocytes after crossing throughout the vasculature surrounding the myocardium. The commonly used isotopes for these studies are either Thallium-201 or Technetium-99m. These radioactive tracers emit radioactive energy that can be detected, absorbed, and converted into perfusion images of the human heart [
29,
30,
31].
6.2. PET
Positron Emission Tomography (PET) has multiple clinical and research applications in CV imaging. It offers accurate measurements of global and regional wall motion, giving insight to myocardial perfusion, and myocardial blood flow during rest and stress, all in one exam. Myocardial viability is routinely estimated by quantitative comparison of fluorodeoxyglucose (
18FDG) absorption between rest and stress. Myocardial blood flow and coronary flow reserve measurements are also included in the final clinical assessment due to the enhanced dynamic imaging capacities of the latest PET/CT scanners, which is considered the “gold” standard technique. Absolute flow measurements also allow evaluation of coronary microvascular dysfunction and provide additional prognostic and diagnostic information for coronary artery disease. Standard quantitative approaches to computing myocardial blood flow from kinetic PET data in an automated and rapid fashion have been developed for
15O-water,
13N-ammonia, and
82Rb radiotracers. Computerized analysis of perfusion in comparison to visual analysis reduces examination variability. PET quantification can also be enhanced by precise co-registration with CT angiography. In emerging clinical utilities, PET has demonstrated a prospective imaging method capable of identifying vulnerable atherosclerotic plaques by quantification of plaque uptake of
18FDG and
18F-sodium fluoride tracers, not only in large arteries such as the carotids and aorta, but also in smaller arteries such as the coronary and renal arteries [
32,
33,
34,
35,
36,
37].
7. Fusion Imaging
The evaluation of cardiac function in real-time with increased spatial resolution has become critically important during transcatheter interventions and is gaining ground day by day as a mainstay in cardiac care with regard to treatments for structural heart disease. These procedures, while minimally invasive for patients, often have added degrees of patient-related and procedure-related complexity. Fluoroscopy has long been the cornerstone of interventional procedures due to the excellent device visualization and due to the fact that it provides real-time feedback. On the contrary, fluoroscopy offers poor characterization of non-radiopaque structures and provides only 2-D projections of important 3-D cardiac anatomy, lacking essential spatial resolution. Fusion imaging combines data from different imaging modalities, fluoroscopy, computed tomography, and echocardiography, in order to produce a fused image, video, or live streaming (
Figure 14). With these methods, we have access to high-resolution detailed anatomic information from CT imaging combined with functional, real-time motion and flux information from echocardiography. The fusion of the pre-operative CT and the peri-procedural 4D-TEE provides us with an excellent visualization of both images in the same visual perspective on the echo screen in the catheterization laboratory [
38,
39,
40,
41,
42].
8. Multi-Modality Imaging (MMI)
Multi-modality imaging has emerged as a newly conceived concept and has been defined as the ”imaging of the heart, which is based around the patients, their disease pathology, utilizing diverse information from one or more imaging modalities which are performed separately or in combination and the goal is to offer the most clinically and cost-effective testing for the patient”. The different modalities provide a complementary understanding of physics, physiology, anatomy, and pathology [
43]. There is a summarized comparative view of the main strengths and limitations of each cardiac imaging method (
Table 1) [
44,
45].
9. Interventional Imaging Future Perspectives and Emerging Techniques
Even though cardiac imaging is considered non-invasive, it is crucial to mention that during interventional procedures such as coronary interventions, new imaging modalities such as intravascular ultrasound (IVUS) and optical computed tomography (OCT) are currently deployed both clinically and experimentally with an established recognition, as has been demonstrated in recent guidelines [
46]. Other techniques like optoacoustic (OA) imaging, also known as photoacoustic imaging (PAI), can outperform conventional imaging techniques in terms of temporal resolution, as shown in several research studies [
47,
48].
The field of cardiovascular imaging is about to be shifted by a huge wave of new methods concerning computational analysis of big data sets. Artificial intelligence (AI), machine learning (ML), deep learning (DL), and natural language processing (NLP) are forming a new paradigm for imaging analysis, with many emerging applications in almost every imaging technique. The development of AI applications with big imaging registries will likely facilitate and ameliorate the extraction of both functional and anatomical information and will offer more precise diagnostic tools in cardiovascular care [
49].
10. Conclusions
From the “simple” X-ray to the “sophisticated” multi-modality imaging, more than a century of medical and technological innovation has occurred concerning cardiovascular imaging and has given us a very thorough and deep understanding of cardiac physiology and pathology. Imaging techniques in cardiology are essential to clinical practice, research, and development, and every day are carrying on their shoulders a great part of the burden of cardiovascular disease.
Author Contributions
Conceptualization, V.P. and E.D.; Methodology, V.P. and E.D.; software, V.P.; Validation, V.P. and E.D.; formal analysis, V.P.; Investigation, V.P.; Resources, V.P.; data curation, V.P.; writing—original draft preparation, V.P.; writing—review and editing, V.P.; visualization, V.P.; supervision, E.D.; project administration, V.P.; funding acquisition, E.D. All authors have read and agreed to the published version of the manuscript.
Funding
This research received no external funding.
Institutional Review Board Statement
Not applicable.
Informed Consent Statement
Informed consent was obtained from all subjects involved in this study.
Data Availability Statement
Not applicable.
Conflicts of Interest
The authors declare no conflict of interest.
Abbreviations
| TOE | Transesophageal Echocardiography |
| TTE | Transthoracic Echocardiography |
| 2D | Two-Dimensional |
| 3D | Three-Dimensional |
| 4D | Four-Dimensional |
| CMR | Cardiac Magnetic Resonance |
| CVD | Cardiovascular Disease |
| CT | Computerized Tomography |
| SE | Stress Echocardiography |
| EF | Ejection Fraction |
| GWI | Global Work Index |
| GCW | Global Constructive Work |
| GWW | Global Wasted Work |
| GWE | Global Work Efficiency |
| SPECT | Single-Photon Emission Computed Tomography |
| PET | Positron Emission Tomography |
| CRT | Cardiac Resynchronization Therapy |
| STE | Speckle-Tracking Echocardiography |
| EACVI | European Association of Cardiovascular Imaging |
| ICM | Ischemic Cardiomyopathy |
| LV | Left Ventricular |
| M-mode | Motion-Mode Echocardiography |
| MI | Myocardial Infarction |
| MR | Mitral Regurgitation |
| MRI | Magnetic Resonance Imaging |
| RV | Right Ventricular |
| AI | Artificial Intelligence |
| ML | Machine Learning |
| DL | Deep Learning |
| NLP | Natural Language Processing |
References
- Cardiovascular Diseases. Available online: https://www.who.int/westernpacific/health-topics/cardiovascular-diseases (accessed on 21 April 2021).
- Singh, S.; Goyal, A. The Origin of Echocardiography: A Tribute to Inge Edler. Tex. Heart Inst. J. 2007, 34, 431–438. [Google Scholar] [PubMed]
- Thompson, G.R. Pioneers Of Medicine Without A Nobel Prize; World Scientific: Singapore, 2014. [Google Scholar]
- Wikipedia. History of Magnetic Resonance Imaging. Available online: https://en.wikipedia.org/w/index.php (accessed on 5 March 2021).
- Lancellotti, P.; Zamorano, J.L.; Habib, G.; Badano, L.P. The EACVI Textbook of Echocardiography; Oxford University Press: Oxford, UK, 2017. [Google Scholar]
- Annette Vegas (Auth.). Perioperative Two-Dimensional Transesophageal Echocardiography: A Practical Handbook; Springer International Publishing: Berlin/Heidelberg, Germany, 2018. [Google Scholar]
- Badano, L.P.; Lang, R.M.; Muraru, D. Textbook of Three-Dimensional Echocardiography; Springer International Publishing: Berlin/Heidelberg, Germany, 2019. [Google Scholar]
- Perk, G.; Tunick, P.A.; Kronzon, I. Non-Doppler Two-Dimensional Strain Imaging by Echocardiography—From Technical Considerations to Clinical Applications. J. Am. Soc. Echocardiogr. 2007, 20, 234–243. [Google Scholar] [CrossRef] [PubMed]
- Espen, B.; Skulstad, H.; Smiseth, O.A. Myocardial Work by Echocardiography: A Novel Method Ready for Clinical Testing. Eur. Heart J. Cardiovasc. Imaging 2019, 20, 18–20. [Google Scholar] [CrossRef]
- Owashi, K.P.; Hubert, A.; Galli, E.; Donal, E.; Hernández, A.I.; Le Rolle, V. Model-Based Estimation of Left Ventricular Pressure and Myocardial Work in Aortic Stenosis. PLoS ONE 2020, 15, e0229609. [Google Scholar] [CrossRef] [Green Version]
- Russell, K.; Eriksen, M.; Aaberge, L.; Wilhelmsen, N.; Skulstad, H.; Remme, E.W.; Haugaa, K.H.; Opdahl, A.; Fjeld, J.G.; Gjesdal, O.; et al. A novel clinical method for quantification of regional left venricular pressure-strain loop area: A non-invasive index of myocardial work. Eur. Heart J. 2012, 33, 724–733. [Google Scholar] [CrossRef] [PubMed] [Green Version]
- Russell, K.; Eriksen, M.; Aaberge, L.; Wilhelmsen, N.; Skulstad, H.; Gjesdal, O.; Edvardsen, T.; Smiseth, O.A. Assessment of wasted myocardial work: A novel method to quantify energy loss due to uncoordinated left ventricular contractions. Am. J. Physiol. Heart Circ. Physiol. 2013, 305, H996–H1003. [Google Scholar] [CrossRef]
- Galli, E.; Leclercq, C.; Hubert, A.; Bernard, A.; Smiseth, O.A.; Mabo, P.; Samset, E.; Hernandez, A.; Donal, E. Role of myocardial constructive work in the identification of responders to CRT. Eur. Heart J. Cardiovasc. Imaging 2018, 19, 1010–1018. [Google Scholar] [CrossRef]
- Hubert, A.; Le Rolle, V.; Leclercq, C.; Galli, E.; Samset, E.; Casset, C.; Mabo, P.; Hernandez, A.; Donal, E. Estimation of Myocardial Work from Pressure–Strain Loops Analysis: An Experimental Evaluation. Eur. Heart J. -Cardiovasc. Imaging 2018, 19, 1372–1379. [Google Scholar] [CrossRef]
- Rinck, P.A. Magnetic Resonance in Medicine: A Critical Introduction, Update January 2019; The Primer of the European Magnetic Resonance Forum EMRF, 12th ed.; Books on Demand: Norderstedt, Germany, 2018; ISBN 9783746095189. Available online: https://magnetic-resonance.org/print-version.html#offprint (accessed on 21 April 2021).
- Haaf, P.; Garg, P.; Messroghli, D.R.; Broadbent, D.A.; Greenwood, J.P.; Plein, S. Cardiac T1 Mapping and Extracellular Volume (ECV) in Clinical Practice: A Comprehensive Review. J. Cardiovasc. Magn. Reson. 2016, 18, 89. [Google Scholar] [CrossRef] [Green Version]
- Nacif, M.S.; Zavodni, A.; Kawel, N.; Choi, E.Y.; Lima, J.A.; Bluemke, D.A. Cardiac Magnetic Resonance Imaging and Its Electrocardiographs (ECG): Tips and Tricks. Int. J. Cardiovasc. Imaging 2012, 28, 1465–1475. [Google Scholar] [CrossRef]
- Doltra, A.; Hoyem Amundsen, B.; Gebker, R.; Fleck, E.; Kelle, S. Emerging Concepts for Myocardial Late Gadolinium Enhancement MRI. Curr. Cardiol. Rev. 2013, 9, 185–190. [Google Scholar] [CrossRef] [Green Version]
- Dyverfeldt, P.; Bissell, M.; Barker, A.J.; Bolger, A.F.; Carlhäll, C.J.; Ebbers, T.; Francios, C.J.; Frydrychowicz, A.; Geiger, J.; Giese, D.; et al. 4D Flow Cardiovascular Magnetic Resonance Consensus Statement. J. Cardiovasc. Magn. Reson. 2015, 17, 72. [Google Scholar] [CrossRef] [PubMed] [Green Version]
- Cueff, C.; Serfaty, J.M.; Cimadevilla, C.; Laissy, J.P.; Himbert, D.; Tubach, F.; Duval, X.; Iung, B.; Enriquez-Sarano, M.; Vahanian, A.; et al. Measurement of aortic valve calcification using multislice computed tomography: Correlation with haemodynamic severity of aortic stenosis and clinical implication for patients with low ejection fraction. Heart 2011, 97, 721726. [Google Scholar] [CrossRef]
- Clavel, M.A.; Messika-Zeitoun, D.; Pibarot, P.; Aggarwal, S.R.; Malouf, J.; Araoz, P.A.; Michelena, H.I.; Cueff, C.; Larose, E.; Capoulade, R.; et al. The complex nature of discordant severe calcified aortic valve disease grading: New insights from combined Doppler echocardiographic and computed tomographic study. J. Am. Coll. Cardiol. 2013, 62, 23292338. [Google Scholar] [CrossRef] [PubMed] [Green Version]
- Clavel, M.A.; Pibarot, P.; Messika-Zeitoun, D.; Capoulade, R.; Malouf, J.; Aggarval, S.; Araoz, P.A.; Michelena, H.I.; Cueff, C.; Larose, E.; et al. Impact of aortic valve calcification, as measured by MDCT, on survival in patients with aortic stenosis: Results of an international registry study. J. Am. Coll. Cardiol. 2014, 64, 12021213. [Google Scholar] [CrossRef] [PubMed] [Green Version]
- Pawade, T.; Clavel, M.A.; Tribouilloy, C.; Dreyfus, J.; Mathieu, T.; Tastet, L.; Renard, C.; Gun, M.; Jenkins, W.S.A.; Macron, L.; et al. Computed tomography aortic valve calcium scoring in patients with aortic stenosis. Circ. Cardiovasc. Imaging 2018, 11, e007146. [Google Scholar] [CrossRef] [Green Version]
- Grundy, S.M.; Stone, N.J.; Bailey, A.L.; Beam, C.; Birtcher, K.K.; Blumenthal, R.S.; Braun, L.T.; De Ferranti, S.; Faiella-Tommasino, J.; Forman, D.E.; et al. 2018 AHA/ACC/AACVPR/AAPA/ABC/ACOM/ADA/AGS/APhA/ASPC/NLA/PCNA guideline on the management of blood cholesterol: A report of the American College of Cardiology/American Heart Association Task Force on Clinical Practice Guidelines. J. Am. Coll. Cardiol. 2019, 73, 3168–3209. [Google Scholar] [CrossRef] [PubMed]
- Arnett, D.K.; Blumenthal, R.S.; Albert, M.A.; Buroker, A.B.; Goldberger, Z.D.; Hahn, E.J.; Himmelfarb, C.D.; Khera, A.; Lloyd-Jones, D.; McEvoy, J.W.; et al. 2019 ACC/AHA guideline on the primary prevention of cardiovascular disease: A Report of the American College of Cardiology/American Heart Association Task Force on Clinical Practice Guidelines. J. Am. Coll. Cardiol. 2019, 74, 1376–1414. [Google Scholar] [CrossRef]
- Orringer, C.E.; Blaha, M.J.; Blankstein, R.; Budoff, M.J.; Goldberg, R.B.; Gill, E.A.; Maki, K.C.; Mehta, L.; Jacobson, T.A. The National Lipid Association scientific statement on coronary artery calcium scoring to guide preventive strategies for ASCVD risk reduction. J. Clin. Lipidol. 2021, 15, 33–60. [Google Scholar] [CrossRef]
- Mach, F.; Baigent, C.; Catapano, A.L.; Koskinas, K.C.; Casula, M.; Badimon, L.; Chapman, M.J.; De Backer, G.G.; Delgado, V.; Ference, B.A.; et al. 2019 ESC/EAS Guidelines for the management of dyslipidaemias: Lipid modification to reduce cardiovascular risk. Eur. Heart J. 2020, 41, 111–188. [Google Scholar] [CrossRef]
- Mathew, R.C.; Gottbrecht, M.; Salerno, M. CT-FFR to Guide Coronary Angiography and Intervention. Int. Cardiol. Clin. 2018, 7, 345–354. [Google Scholar] [CrossRef]
- Dilsizian, V.; Rocco, T.P.; Freedman, N.M.; Leon, M.B.; Bonow, R.O. Enhanced detection of ischemic but viable myocardium by the reinjection of thallium after stress-redistribution imaging. N. Engl. J. Med. 1990, 323, 141–146. [Google Scholar] [CrossRef] [PubMed]
- Roelants, V.A.; Vanoverschelde, J.L.; Vander, B.T.; Melin, J.A. Reverse redistribution on exercise-redistribution (201)Tl SPECT in chronic ischemic dysfunction: Predictive of functional outcome after revascularization? J. Nucl. Med. 2002, 43, 621–627. [Google Scholar] [PubMed]
- Senior, R.; Kaul, S.; Raval, U.; Lahiri, A. Impact of revascularization and myocardial viability determined by nitrate-enhanced Tc-99m sestamibi and Tl-201 imaging on mortality and functional outcome in ischemic cardiomyopathy. J. Nucl. Cardiol. 2002, 9, 454–462. [Google Scholar] [CrossRef]
- Slomka, P.; Berman, D.S.; Alexanderson, E.; Germano, G. The role of PET quantification in cardiovascular imaging. Clin. Transl. Imaging 2014, 2, 343–358. [Google Scholar] [CrossRef]
- Dilsizian, V.; Bacharach, S.L.; Beanlands, R.S.; Bergmann, S.R.; Delbeke, D.; Dorbala, S.; Gropler, R.J.; Knuuti, J.; Schelbert, H.R.; Travin, M.I.; et al. ASNC imaging guidelines/SNMMI procedure standard for positron emission tomography (PET) nuclear cardiology procedures. J. Nucl. Cardiol. 2016, 23, 1187–1226. [Google Scholar] [CrossRef] [Green Version]
- Murthy, V.L.; Bateman, T.M.; Beanlands, R.S.; Berman, D.S.; Borges-Neto, S.; Chareonthaitawee, P.; Cerqueira, M.D.; DeKemp, R.A.; DePuey, E.G.; Dilsizian, V.; et al. Clinical quantification of myocardial blood flow using PET: Joint position paper of the SNMMI cardiovascular council and the ASNC. J. Nucl. Cardiol. 2018, 25, 269–297. [Google Scholar] [CrossRef] [Green Version]
- Neglia, D.; Michelassi, C.; Trivieri, M.G.; Sambuceti, G.; Giorgetti, A.; Pratali, L.; Gallopin, M.; Salvadori, P.; Sorace, O.; Carpeggiani, C.; et al. Prognostic role of myocardial blood flow impairment in idiopathic left ventricular dysfunction. Circulation 2002, 105, 186–193. [Google Scholar] [CrossRef] [Green Version]
- Ghosh, N.; Rimoldi, O.E.; Beanlands, R.S.; Camici, P.G. Assessment of myocardial ischaemia and viability: Role of positron emission tomography. Eur. Heart J. 2010, 31, 2984–2995. [Google Scholar] [CrossRef]
- Anagnostopoulos, C.; Georgakopoulos, A.; Pianou, N.; Nekolla, S.G. Assessment of myocardial perfusion and viability by positron emission tomography. Int. J. Cardiol. 2013, 167, 1737–1749. [Google Scholar] [CrossRef]
- Almeida, A.G.; Carpenter, J.P.; Cameli, M.; Donal, E.; Dweck, M.R.; Flachskampf, F.A.; Maceira, A.M.; Muraru, D.; Neglia, D.; Pasquet, A.; et al. Multimodality imaging of myocardial viability: An expert consensus document from the European Association of Cardiovascular Imaging (EACVI). Eur. Heart J. Cardiovasc. Imaging 2021, 22, e97–e125. [Google Scholar] [CrossRef] [PubMed]
- Faletra, F.F.; Pozzoli, A.; Agricola, E.; Guidotti, A.; Biasco, L.; Leo, L.A.; Taramasso, M.; Pasotti, E.; Kuwata, S.; Moccetti, M.; et al. Echocardiographic-fluoroscopic fusion imaging for transcatheter mitral valve repair guidance. Eur. Heart J. Cardiovasc. Imaging 2018, 19, 715–726. [Google Scholar] [CrossRef] [PubMed]
- Altiok, E.; Becker, M.; Hamada, S.; Reith, S.; Marx, N.; Hoffmann, R. Real-time 3D TEE allows optimized guidance of percutaneous edge-to-edge repair of mitral valve. JACC Cardiovasc. Imaging 2010, 3, 1196–1198. [Google Scholar] [CrossRef] [PubMed] [Green Version]
- Biner, S.; Perk, G.; Kar, S.; Rafique, A.M.; Slater, J.; Shiota, T.; Hussaini, A.; Chou, S.; Kronzon, I.; Siegel, R.J.; et al. Utility of combined two-dimensional and three-dimensional transesophageal imaging for catheterbased mitral valve clip repair of mitral regurgitation. J. Am. Soc. Echocardiogr. 2011, 24, 611. [Google Scholar] [CrossRef]
- Faletra, F.F.; Pedrazzini, G.; Pasotti, E.; Muzzarelli, S.; Dequarti, M.C.; Murzilli, R.; Schlossbauer, S.A.; Slater, I.P.; Moccetti, T. 3D TEE during catheter-based interventions. JACC Cardiovasc. Imaging 2014, 7, 292–308. [Google Scholar] [CrossRef] [Green Version]
- Fox, K.; Achenbach, S.; Bax, J.; Cosyns, B.; Delgado, V.; Dweck, M.R.; Edvardsen, T.; Flachskampf, F.; Habib, G.; Lancellotti, P.; et al. Multimodality Imaging in Cardiology: A Statement on Behalf of the Task Force on Multimodality Imaging of the European Association of Cardiovascular Imaging. Eur. Heart J. 2019, 40, 553–558. [Google Scholar] [CrossRef] [Green Version]
- Lancellotti, P.; Nkomo, V.T.; Badano, L.P.; Bergler-Klein, J.; Bogaert, J.; Davin, L.; Cosyns, B.; Coucke, P.; Dulgheru, R.; Edvardsen, T.; et al. Expert consensus for multi-modality imaging evaluation of cardiovascular complications of radiotherapy in adults: A report from the European Association of Cardiovascular Imaging and the American Society of Echocardiography. Eur. Heart J. Cardiovasc. Imaging 2013, 14, 721–740. [Google Scholar] [CrossRef]
- Habib, G.; Bucciarelli-Ducci, C.; Caforio, A.L.P.; Cardim, N.; Charron, P.; Cosyns, B.; Dehaene, A.; Derumeaux, G.; Donal, E.; Dweck, M.R.; et al. Multimodality imaging in restrictive cardiomyopathies: An EACVI expert consensus document in collaboration with the “Working Group on myocardial and pericardial diseases” of the European Society of Cardiology. Eur. Heart J. Cardiovasc. Imaging 2017, 18, 1090–1121. [Google Scholar] [CrossRef] [Green Version]
- Neumann, F.J.; Sousa-Uva, M.; Ahlsson, A.; Alfonso, F.; Banning, A.P.; Benedetto, U.; Byrne, R.A.; Collet, J.P.; Falk, V.; Head, S.J.; et al. ESC/EACTS guidelines on myocardial revascularization. Eur. Heart J. 2019, 40, 87–165. [Google Scholar] [CrossRef]
- Lin, H.A.; Déan-Ben, X.L.; Ivankovic, I.; Kimm, M.A.; Kosanke, K.; Haas, H.; Meier, R.; Lohöfer, F.; Wildgruber, M.; Razansky, D. Characterization of Cardiac Dynamics in an Acute Myocardial Infarction Model by Four-Dimensional Optoacoustic and Magnetic Resonance Imaging. Theranostics 2017, 718, 4470–4479. [Google Scholar] [CrossRef]
- Vo-Dinh, T. Biomedical Photonics Handbook; CRC Press: Boca Raton, FL, USA, 2003. [Google Scholar]
- Xu, B.; Kocyigit, D.; Grimm, R.; Griffin, B.P.; Cheng, F. Applications of artificial intelligence in multimodality cardiovascular imaging: A state-of-the-art review. Prog. Cardiovasc. Dis. 2020, 63, 367–376. [Google Scholar] [CrossRef] [PubMed]
Figure 1.
The first recorded ultrasound images of echocardiography from 29 October 1953 projecting in m-mode the walls of the left ventricle and the mitral valve.
Figure 1.
The first recorded ultrasound images of echocardiography from 29 October 1953 projecting in m-mode the walls of the left ventricle and the mitral valve.
Figure 2.
2D Transthoracic apical view of the left ventricle simultaneously (Tri-plan) from 3 different angles (4CH, 2CH, 3CH view).
Figure 2.
2D Transthoracic apical view of the left ventricle simultaneously (Tri-plan) from 3 different angles (4CH, 2CH, 3CH view).
Figure 3.
Transesophageal view long axis of the mitral valve and short axis of the aortic valve.
Figure 3.
Transesophageal view long axis of the mitral valve and short axis of the aortic valve.
Figure 4.
Three-dimensional image of the mitral valve (Surgeon’s view).
Figure 4.
Three-dimensional image of the mitral valve (Surgeon’s view).
Figure 5.
Three-dimensional image of the mitral valve along with color Doppler to visualize mitral regurgitation flow.
Figure 5.
Three-dimensional image of the mitral valve along with color Doppler to visualize mitral regurgitation flow.
Figure 6.
Longitudinal strain measurement in apical 4CH view.
Figure 6.
Longitudinal strain measurement in apical 4CH view.
Figure 7.
Strain curves from apical 4CH, 3CH, 2CH to calculate global longitudinal strain (GLS).
Figure 7.
Strain curves from apical 4CH, 3CH, 2CH to calculate global longitudinal strain (GLS).
Figure 8.
Myocardial work calculation: GWI = 1356 mmHg%, GCW = 1716 mmHg%, GWW = 74 mmHg%, Global work efficiency (GWE) = 95%.
Figure 8.
Myocardial work calculation: GWI = 1356 mmHg%, GCW = 1716 mmHg%, GWW = 74 mmHg%, Global work efficiency (GWE) = 95%.
Figure 9.
CMR image 4CH view of the heart.
Figure 9.
CMR image 4CH view of the heart.
Figure 10.
CMR image 2CH view.
Figure 10.
CMR image 2CH view.
Figure 11.
Computed tomography (CT) image of the left and right ventricle, left atrium, and ascending aorta.
Figure 11.
Computed tomography (CT) image of the left and right ventricle, left atrium, and ascending aorta.
Figure 12.
Computed tomography: 3-D reconstruction of the left atrium along with the four pulmonary veins.
Figure 12.
Computed tomography: 3-D reconstruction of the left atrium along with the four pulmonary veins.
Figure 13.
Computed tomography: 3-D reconstruction of the ascending aorta along with the three coronary arteries: left anterior descending (LAD), left marginal branch (LMB).
Figure 13.
Computed tomography: 3-D reconstruction of the ascending aorta along with the three coronary arteries: left anterior descending (LAD), left marginal branch (LMB).
Figure 14.
CT Fusion image the display of co-aligned 4D TEE ultrasound and CT data.
Figure 14.
CT Fusion image the display of co-aligned 4D TEE ultrasound and CT data.
Table 1.
Strength sand limitations of different cardiac imaging techniques.
Table 1.
Strength sand limitations of different cardiac imaging techniques.
| Imaging Technique | Spatial Resolution | Temporal Resolution | Functional Information | Tissue Analysis | Biological Cost | Feasibility |
|---|
| Echo | ++ | ++++ | +++ | + | - | ++++ |
| CMR | ++++ | ++ | +++ | ++++ | - | + |
| CT | +++ | + | + | ++ | ++ | ++ |
| SPECT | + | + | ++ | - | ++ | +++ |
| Publisher’s Note: MDPI stays neutral with regard to jurisdictional claims in published maps and institutional affiliations. |
© 2021 by the authors. Licensee MDPI, Basel, Switzerland. This article is an open access article distributed under the terms and conditions of the Creative Commons Attribution (CC BY) license (https://creativecommons.org/licenses/by/4.0/).


