Featured Application
Ultrasound Blood-Flow Monitor.
Abstract
This work proposes a proof-of-concept ultrasound blood-flow-monitoring circuit system using a single-element transducer. The circuit system consists of a single-element ultrasonic transducer, an analog interface circuit, and a field-programmable gate array (FPGA). Since the system uses a single-element transducer, an ultrasound image cannot be reconstructed unless scanning with mechanical movement is used. An ultrasound blood-flow monitor basically needs to acquire a Doppler sample volume by positioning a range gate at a vessel region on a scanline. Most recent single-transducer-based ultrasound pulsed-wave Doppler devices rely on a manual adjustment of the range gate to acquire Doppler sample volumes. However, the manual adjustment of the range gate depends on the user’s experience, and it can be time consuming if a transducer is not properly positioned. Thus, automatic range-gate-positioning is more desirable for image-free pulsed-wave Doppler devices. This work proposes a circuit system which includes a new automatic range-gate-positioning scheme. It blindly tracks the position of a blood vessel on a scanline by using the accumulation of Doppler amplitude deviations and a hysteresis slicing function. The proposed range-gate-positioning scheme has been implemented in an FPGA for real-time operation and is based on addition-only computations, except for filter parts to reduce the complexity of computation in the hardware. The proposed blood-flow-monitoring circuit system has been implemented with discrete commercial chips for proof-of-concept purposes. It uses a center frequency of 2 MHz and a system-clock frequency of 20 MHz. The FPGA only utilizes 5.6% of slice look-up-tables (LUTs) for implementation of the range-gate-positioning scheme. For measurements, the circuit system was utilized to interrogate a customized flow phantom model, which included two vessel-mimicking channels. The circuit system successfully acquired Doppler sample volumes by positioning a range gate on a fluid channel. In addition, the estimated Doppler shift frequency shows a good agreement with the theoretical value.
1. Introduction
Spectral-Doppler-based ultrasound medical devices have the potential to be used for pre-screening various vascular diseases such as diabetes, vascular stenosis, arterial stiffness, and so on. There are various study results showing the pre-diagnosis of vascular diseases by monitoring hemodynamics via ultrasound [1,2,3,4,5,6,7,8]. These diagnosis modalities have a common feature, that is, a spectrogram or a wavelet transform spectrum is utilized to assess hemodynamics status, which can reflect structural and functional changes in a vessel. A spectral Doppler mode, one of the essential imaging modes of commercial medical ultrasound imaging devices, provides a real-time spectrogram of blood flow, so various studies on the pre-diagnosis of vascular diseases can be done by using a commercial imaging device.
Even though a multi-channel ultrasound system can provide various clinical results, it usually requires considerable hardware overhead in terms of hardware size, power consumption, cost, and so on [9,10,11,12]. Most of the aforementioned overhead stems from implementation of the multi-channel probe, along with front-end circuitry, beamforming, and back-end signal processing. However, in the case of portable or wearable ultrasound blood-flow monitors for early diagnosis, a hardware-efficient system implementation to intensively support a spectral Doppler mode is required.
There are several approaches to implementing an ultrasound blood-flow monitor by using a single transducer [13,14,15,16]. A single-transducer-based ultrasound blood-flow monitor basically needs only single-channel interface circuitry and a digital signal processor with fewer computation requirements. Accordingly, the system can be compact, and its complexity can be remarkably decreased compared to a multi-channel system.
One of primary issues of single-transducer-based ultrasound blood-flow monitoring is positioning of a range gate on a scanline to acquire sample volumes from the vessel region without an ultrasound image. The work of [13] developed a continuous-wave Doppler scheme. This means the echo signal does not include depth information. In principle, a continuous-wave Doppler cannot distinguish the focal position of an echo signal, so it has a potential limitation if a spectral analysis from a specific vessel position is necessary. The work of [14] is based on pulsed-wave Doppler scheme. It allocates a range-gate position by manually adjusting an RC delay. However, an RC delay is vulnerable to voltage and temperature variations of the system. The work of [15] adopts a pulsed-wave Doppler to acquire Doppler signals from the carotid artery. It manually adjusts the location of the range gate on a scanline. Even though the work of [15] suggests a possible method to automatically adjust the range-gate position by monitoring pulsatile indices from pre-partitioned sparse regions, the amount of computation and the resources required can be burdensome for a general portable device.
The work of [16] tracks the position of the artery wall to evaluate the pulse wave velocity. Automatic vessel-wall identification has been accomplished by using an amplitude (A)-mode signal analysis; that is, a vessel wall is detected by recognizing two consecutive echo signals with distinctive amplitude which satisfy a pre-determined time-difference range. The wall-detection algorithm of [16] is relatively simple and efficient to be implemented. However, the wall-detection algorithm of [16] uses the hypothesis that the ultrasound device is applied to interrogate specific arteries, such as the carotid or femoral artery, because a specific echo pattern should be guaranteed. Thus, the wall-detection algorithm of [16] has potential limitations when it is applied for general vessels. In addition, the work of [16] requires a relatively higher center frequency of ultrasound to avoid aliasing of echo signals in the time domain. Correspondingly, the center frequency along with the system-clock frequency of the hardware should be increased. In addition, the power consumption of the hardware can be increased as well.
In this paper, we propose an ultrasound blood-flow-monitoring circuit system using a single-element transducer, as shown in Figure 1. The circuit system consists of a single-element ultrasonic transducer, an analog interface circuit, and a FPGA. The analog interface circuit performs analog signal conditioning, such as generating a bipolar high-voltage pulse and filtering for the amplified echo signal. The proposed circuit system includes a new automatic range-gate-positioning scheme which can blindly track the position of an arbitrary vessel on a scanline without additional manual adjustment of the range-gate position. The proposed range-gate-positioning scheme is implemented in FPGA for real-time acquisition of Doppler sample volumes. Since the proposed range-gate-positioning scheme uses Doppler-amplitude deviations and does not depend on specific A-mode patterns, an arbitrary vessel on a scanline can be tracked. In addition, the required carrier frequency of the ultrasound can be lowered, because vessel detection can be accomplished even though an aliasing of the echo signal in the time domain occurs. The feature of a relatively lower carrier frequency can potentially result in efficient hardware design in terms of power and complexity. The proposed circuit system has been implemented with discrete commercial chips including FPGA. The implemented circuit system can achieve a real-time acquisition of Doppler sample volumes from a consistently positioned range gate, and the acquired sample volume can be utilized to reconstruct a spectrum.
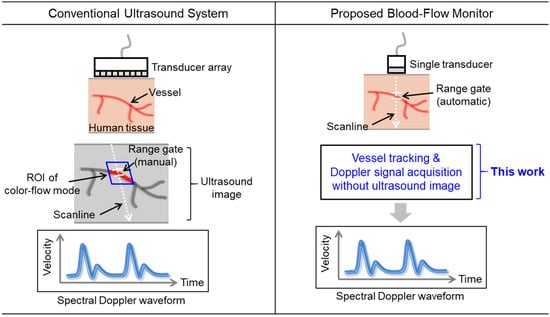
Figure 1.
Features of this work compared to conventional medical ultrasound system; ROI: region of interest.
2. Materials and Methods
2.1. Overall Structure of Image-Free Ultrasound Blood-Flow-Monitoring Circuit System
The overall structure of the image-free ultrasound blood-flow-monitoring circuit system is illustrated in Figure 2. The structure of the circuit system consists of a single-element transducer, analog interface circuits, and an FPGA. The utilized ultrasound transducer has a center frequency of 2 MHz. Analog interface circuits consist of a high-voltage transmitter (TX) pulser, a transmit/receive (T/R) switch, and analog front-end (AFE) circuit including a pre-amplifier, an anti-aliasing filter, and an analog-to-digital converter (ADC). These analog circuits are implemented with discrete commercial chips. After analog signal conditioning, the output code of the ADC is delivered into the FPGA for digital signal processing. The FPGA performs a real-time tracking of the vessel position along a single scanline. When a range gate is positioned on a tracked vessel region, Doppler sample volumes are sorted out among A-mode echo signals. The sorted Doppler sample volumes are utilized to reconstruct either a spectrum or a spectrogram to illustrate the blood-flow status.
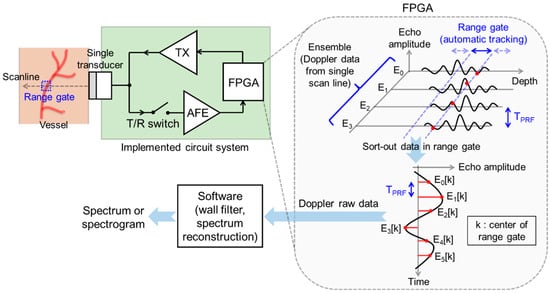
Figure 2.
Proposed image-free ultrasound blood-flow-monitoring circuit system; TX: transmitter; AFE: analog front-end; FPGA: field-programmable gate array; RF: radio frequency.
2.2. Analog Interface Circuit
A detailed circuit diagram of the analog interface is shown in Figure 3. The analog interface is basically comprised of a TX and receiver (RX) part. In the RX part, a T/R switch protects low-voltage amplifier circuits, and analog signal conditioning, including amplification and filtering, is performed by a pre-amplifier and an ADC driver. The cascaded amplifiers have the characteristics of a band-pass amplifier with an order of 4, and the overall voltage gain of the RX part is 40 dB.
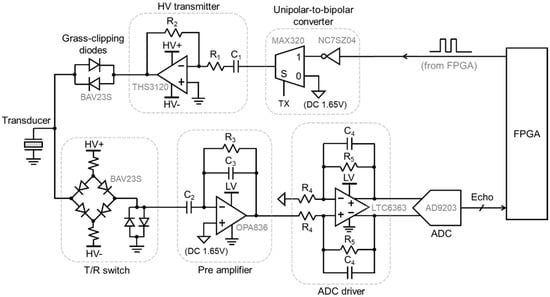
Figure 3.
Circuit diagram of analog interface; HV: high voltage; T/R: transmit/receive; DC: direct current; ADC: analog-to-digital converter.
In the TX part of Figure 3, a bipolar pulsing scheme is adopted. Compared with a conventional unipolar high-voltage TX pulser, a bipolar pulser theoretically has a better energy efficiency for the same peak-to-peak voltage swing [17,18]. In addition, most previous high-voltage bipolar pulsers are based on a switching topology and need several input-control signals, along with multiple power supplies for level-shifting operation [19,20,21,22]. For simple control of the TX pulser, we propose a single-ended-amplifier-based topology as shown in Figure 3. A low-voltage bipolar pulse signal is amplified with a differentiator circuit, which is denoted as an HV transmitter in Figure 3. The low-voltage bipolar pulse signal can be generated with a bipolar analog multiplexer by using a unipolar digital logic signal, which is fed from the FPGA. The output of the HV transmitter is delivered into the transducer via a grass-clipping diode. This grass-clipping diode passes a high-voltage signal during the TX phase and makes the transducer node float during the RX phase [19,20,21,22].
A timing diagram of the TX part is shown in Figure 4. The upper two signals of TX and Unipolar pulse are fed from the FPGA. The triggering pulse TX encloses the signal Unipolar pulse and is fed into a selection signal of the analog multiplexer (MAX320, Maxim Integrated Inc., San Jose, CA, USA), as shown in Figure 3. The default output of the analog multiplexer is DC voltage of 1.65 V. When the triggering signal TX is enabled, the inverted Unipolar pulse is delivered into the output of the analog multiplexer. As mentioned before, the output of the multiplexer is amplified by the HV transmitter (THS3120, Texas Instruments Inc., Dallas, TX, USA), as shown in Figure 3. Accordingly, the HV transmitter has a common voltage of zero and generates amplified alternating signals. The peak-to-peak value of the HV transmitter output is determined by the output voltage range of the operational amplifier (op amp).
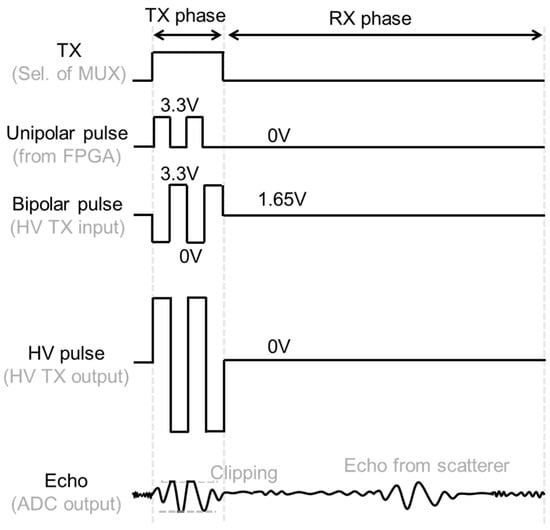
Figure 4.
Timing diagram of high-voltage TX pulser; TX: transmitter, RX: receiver, MUX: multiplexer, HV: high voltage, ADC: analog-to-digital converter.
2.3. Automatic Range-Gate-Tracking Scheme in FPGA
In the spectral Doppler mode of ultrasound, multiple ensemble signals from a single scanline are repetitively acquired to extract sample volumes from a range gate [23]. As mentioned before, this work uses a single-element transducer, so it acquires multiple ensemble signals from a single scanline to support a spectral Doppler mode. To automatically allocate a range gate on a scanline, we utilize the difference between adjacent ensemble signals to detect Doppler amplitude deviation, as illustrated in Figure 5. As is well known, ensemble signals from stationary tissue have almost the same phase and amplitude, because the same acoustic scattering of ultrasound is repeated. On the other hand, echo signals of ensembles have different phases along with amplitudes if echo occurs from moving particles or fluidic parts. Hence, the absolute difference between adjacent ensembles can result in Doppler amplitude deviation. In the conceptual illustration of Figure 5, the Doppler amplitude deviation results in relatively large amplitudes compared to other echo signal parts. Since we need to specify the estimated vessel position, we can use a slicing operation to indicate the position of the vessel. This slicing operation can be performed with a digital comparator circuit.
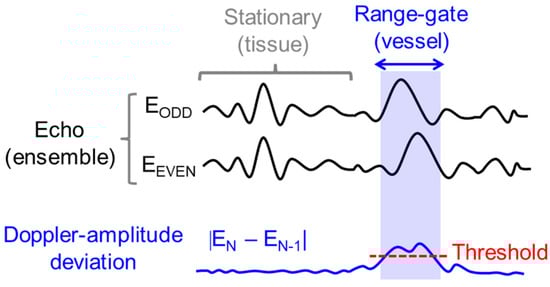
Figure 5.
Concept of tracking a vessel region on a scanline.
The concept of tracking the position of a blood vessel, shown in Figure 5, utilizes Doppler amplitude deviation. However, the amount of Doppler amplitude deviation can be too small to apply the slicing operation, since the strength of scattering from the fluidic part is relatively small compared to the strength of scattering due to the acoustic impedance difference. Therefore, we need to amplify the Doppler amplitude deviation, which corresponds to the absolute value of difference between two adjacent ensemble echo signals.
This work utilizes an accumulation operation to enlarge the Doppler amplitude deviation of adjacent ensemble signals. Then, the enlarged Doppler amplitude deviation can make the slicing operation robust and consistent. Figure 6 illustrates a timing diagram of the automatic range-gate-positioning scheme based on the aforementioned accumulation of Doppler amplitude deviations. When a transducer is properly positioned on an arbitrary surface, the circuit system is triggered to track a vessel position on a scanline by using external switch toggling. Then, the circuit system starts to accumulate the absolute difference of adjacent ensembles, as shown in Figure 6. Through the successive accumulation operation, the Doppler amplitude deviation is amplified. Of course, the uncorrelated noise superimposed in the ensemble is also accumulated. This results in the elevation of the baseline of the accumulated ensemble difference, as shown in Figure 6. Since the variance of uncorrelated noise of ensembles is hard pre-estimate, the final elevated noise floor needs to be removed properly for a robust slicing operation. We apply a band-pass filter (BPF) to remove the noise floor (i.e., DC component) of the accumulated ensemble difference. The output of the band-pass filter is delivered to a hysteresis comparator to enable the range-gate indication signal Range gate, as shown in Figure 6. By using the enabled Range gate signal, we can acquire a focal-point value, denoted as k in Figure 6. This focal-point value corresponds to an estimated position of a vessel on a scanline and is used to sort out the Doppler sample volumes.
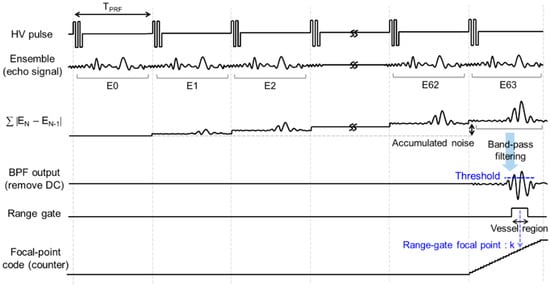
Figure 6.
Timing diagram of automatic range-gate-positioning scheme; HV: high voltage; PRF: pulse repetition frequency; BPF: band-pass filter, DC: direct current.
The proposed automatic range-gate-positioning scheme is implemented in the FPGA using the block diagram shown in Figure 7. It consists of BPFs, a de-multiplexer, first-in first-out (FIFO) memories, adders, and a hysteresis comparator. The output of the ADC is applied into BPF1, as shown in Figure 7. The filter BPF1 has the topology of a 4th-order Butterworth filter, and its pass-band ranges from 1 MHz to 3 MHz. Its main role is to suppress out-of-band noise of the ADC output.
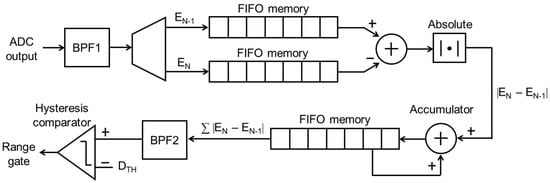
Figure 7.
Block diagram of range-gate-positioning scheme in FPGA; ADC: analog-to-digital converter; BPF: band-pass filter; FIFO: first-in first-out.
The output of BPF1 is selectively fed into one of the FIFO memories in a ping-pong fashion. To compute the absolute difference between two single-port FIFO memories, an adder and an absolute-value operator follow. This computation can result in the Doppler amplitude deviation between adjacent ensemble signals. The amplification of Doppler amplitude deviation is executed with a dual-port FIFO memory and an accumulator. After a pre-determined number of accumulation operations, the dual-port FIFO memory delivers its code into the filter BPF2. As shown in Figure 6, the baseline of accumulated code also increases due to the accumulation of uncorrelated noise. The filter BPF2 removes the DC component, and the alternating signal component among the filter output provides the information to estimate a focal-point number for the vessel region.
Since the filter BPF2 removes the DC component, the alternating signal of the filter output has a zero-crossing feature. Therefore, we need to generate a short-period one-pulse signal (i.e., Range gate in Figure 7) at a time duration where an alternating-signal packet with sufficient amplitude occurs. To generate a properly toggled Range gate signal, we adopt a hysteresis operation on a digital comparator. A timing diagram and conceptual operation of the hysteresis comparator are shown in Figure 8. When an alternating-signal packet with sufficient amplitude occurs at the output of BPF2, it is detected by a slicing operation with a hyper-parameter threshold value DTH. That is, when the output of BPF2 surpasses the threshold value, the signal Range gate is enabled. We need to maintain the high value of the signal Range gate during the duration of the alternating-signal packet. Therefore, we utilize a reference counter to check whether the alternating signal diminishes or not. The reference counter starts counting up while the output of BPF2 is smaller than the threshold value. In addition, the up-counter is changed to a reset state whenever the output of BPF2 is higher than the threshold value. As shown in Figure 8, if the code of the reference counter reaches the pre-determined reference code, then the signal Range gate is set to a state of logic low. Through this comparison and counting operations, the equivalent hysteresis operation can be performed.
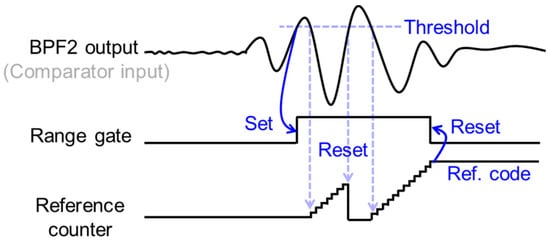
Figure 8.
Hysteresis operation of comparator to generate the Range gate signal.
2.4. Stabilization of Range-Gate Position and Doppler Raw Data Acquisition
In practical measurement conditions, it can be necessary to re-adjust the position of the range gate due to an inadequate position of the transducer or movement of patient. In addition, multiple blood vessels may exist on a single scanline, which may result in multiple Range gate pulses. The proposed circuit system includes an algorithm, shown in Figure 9, to handle the abovementioned cases.
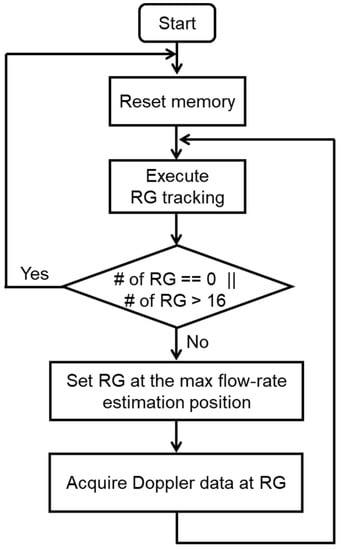
Figure 9.
Flow chart of algorithm for stabilization of range-gate position; RG: range gate.
The overall procedure to stabilize the position of the range gate is as follows. When the circuit system is enabled, memories in FPGA are initialized. Then, the range-gate tracking using an accumulation of Doppler amplitude deviations is performed, and a pulse of Range gate can be generated. If the number of Range gate pulses is 0, it means that there are no blood vessels on a scanline. If the number of Range gate pulses is more than 16, it means that the transducer is not consistently positioned. Therefore, in the flowchart shown in Figure 9, the stage of checking the number of Range gate pulses corresponds to the step of checking whether a transducer is stably positioned.
In software, a clutter filtering and a spectrum reconstruction are performed with the acquired Doppler raw data. This work does not utilize a typical coherent demodulation to minimally utilize the hardware resources of the FPGA. An echo due to scattering in fluid can be interpreted using the time-shift model of [24]. Then, a Doppler frequency of scatterer in fluid can be estimated with the Doppler raw data without using demodulation. Since the proposed system does not utilize coherent demodulation, the absolute value of the Doppler frequency, that is, the absolute velocity of fluid, can be estimated with a reconstructed spectrogram or spectrum. Thus, if a quantitative evaluation of blood flow is necessary, the system can be applied to blood vessels that can be modeled as low-resistance flow, that is, blood vessels in which the direction of blood flow is rarely reversed.
In practical measurement conditions, multiple blood vessels may be captured on a scanline, which can generate multiple Range gate pulses. In this case, the system needs to find a representative range-gate position. The system monitors the accumulated ensemble difference, and tracks its peak value. The peak value of the accumulated ensemble difference corresponds to the depth where the fluid velocity is the maximum. We have performed a numerical simulation by considering a single moving scatterer crossing a beam. In the simulation result shown in Figure 10, there is a monotonic increasing tendency between fluid velocity and the peak value of the accumulated ensemble difference. Thus, the system can locate a representative range-gate position on a vessel whose velocity is the maximum by monitoring the accumulated Doppler amplitude deviations.
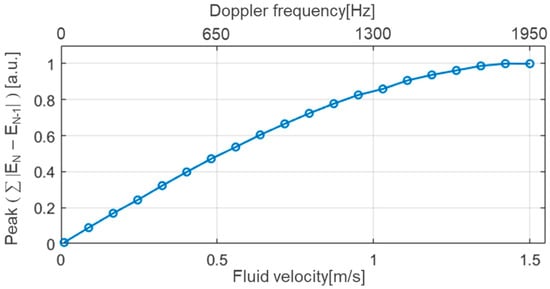
Figure 10.
Numerical simulation result of peak value of accumulated ensemble difference with respect to fluid velocity under the following conditions: PRF of 4 kHz, carrier frequency of 2 MHz, and a Doppler angle of 60°.
2.5. Behavioral Simulation Using Field II Program
To validate the proposed range-gate-positioning scheme, we acquired RF data from a Womersley model emulating a femoral artery using the Field II program [25]. This simulation was performed with the following conditions: a center frequency of 2 MHz, a pulse repetition frequency of 5 kHz, and 5000 ensembles.
Figure 11a shows an M-mode image which was reconstructed by accumulating the ensembles on the time axis. The M-mode image was obtained through an envelope detection and a log compression. In the M-mode image, it can be qualitatively observed that the diameter of the artery expands during systole and the diameter of the artery decreases during diastole. The line plots overlaid on the M-mode image represent a range-gate position with respect to time. In the Field II program, the range-gate position for the spectrogram is arbitrarily set to the center position of the scanline. The proposed range-gate-positioning scheme of this work updates range-gate positions every 256 pulse-repetition periods by using the algorithm shown in Figure 9. Then, RF data for the corresponding range gate is sorted and the Doppler sample volume is acquired. Figure 11b shows the acquired Doppler sample volumes for both cases: the proposed scheme and the Field II program. It can be observed that the tendency of both waveforms is almost identical.
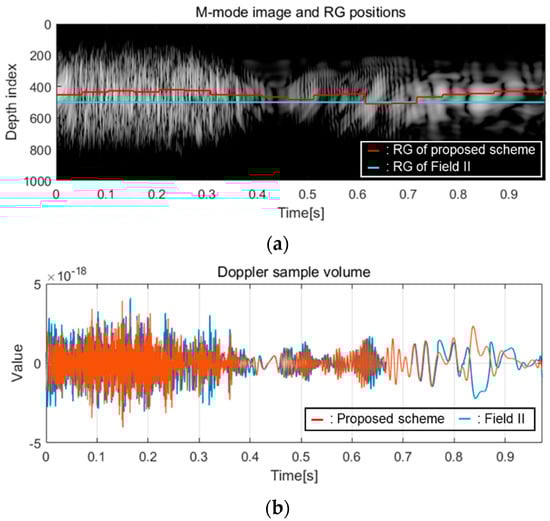
Figure 11.
Behavioral simulation results of (a) M-mode image along with RG positions and (b) Doppler sample volumes; RG: range gate.
Figure 12a shows the reconstructed spectrogram using the default code of the Field II program. Figure 12b presents the spectrogram, which was reconstructed using the Doppler sample volume obtained with the proposed scheme. The dynamic range of the spectrograms is set to 30 dB. Both spectrograms illustrate Doppler frequency changes due to systolic and diastolic cycles. In addition, the spectrogram with the proposed scheme shows a good agreement with that of the Field II program. Accordingly, considering the reconstructed spectrogram and the tracked range-gate positions, it can be confirmed that the functionality of the proposed system is validated.
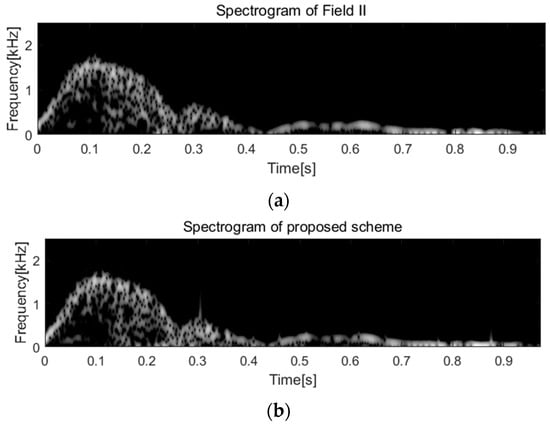
Figure 12.
Behavioral simulation results of spectrograms from (a) Field II program and (b) proposed scheme.
3. Results and Discussion
3.1. Implementation Results
The implemented blood-flow-monitoring circuit system is presented in Figure 13. It consists of a single-element transducer (P703-SU, Hagisonic, Daejeon, South Korea), a fully custom-designed printed circuit board (PCB) for the analog interface circuit, an FPGA (Spartan-6 LX45, Xilinx Inc., San Jose, CA, USA), and a bridge board for test purposes. The center frequency of the utilized transducer is 2 MHz. A system clock with a frequency of 20 MHz is utilized in the FPGA and ADC. The analog interface circuit consumes 196 mW for supply voltages of ±10V and ±3.3V.
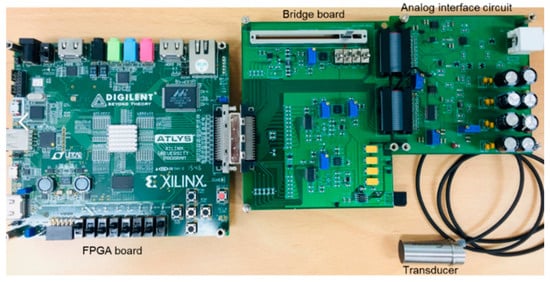
Figure 13.
Implemented image-free ultrasound blood-flow-monitoring circuit system.
To maintain a relatively uniform beam width along the scanline, an unfocused-type transducer is adopted in this work. Considering the physical parameters of the transducer, such as the center frequency of 2 MHz and the diameter of 0.5 inch, the length of the near field of the transducer is estimated to be around 9.4 cm [26]. The beam width of the unfocused transducer within the near field is approximately equal to the diameter of the transducer [26]. In this work, the target maximum scanning depth is set to 5 cm, and the range of time-gain compensation (TGC) is found to be 10 dB by considering an attenuation coefficient of 0.5 dB/MHz/cm in human tissue. Since the TGC range is relatively small, the performance of the system is not significantly affected even if a fixed voltage-gain value is applied for the analog front-end circuit.
The proposed automatic range-gate tracking scheme is implemented in the FPGA for real-time operation. A logic synthesis along with place and route (PnR) is performed with the ISE program (Xilinx Inc., San Jose, CA, USA). The device utilization summary after PnR is presented in Table 1. The utilization rate of slice look-up-tables (LUTs) is 5.6%. This metric is one of the measures used to represent the efficiency of hardware utilization in the FPGA. This work shows a relatively low value of slice LUTs. This implies that the proposed scheme can be compactly implemented in FPGA. The PnR result is presented in Figure 14, which illustrates the occupancy of hardware resources in the FPGA.

Table 1.
Summary of device utilization in FPGA.
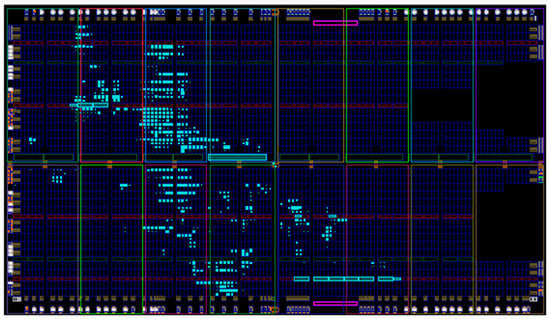
Figure 14.
Place and route (PnR) result in FPGA.
3.2. Measurements and Discussion
We have performed measurements of the analog waveforms with the implemented circuit system, which are shown in Figure 13. The measured bipolar HV pulse is shown in Figure 15a. It has a number of cycles of 4, and the peak-to-peak amplitude is 18.8 V due to voltage drop in the grass-clipping diode. A number of periods of HV pulse can be programmed by adjusting a unipolar pulse signal from the FPGA. In addition, an arbitrary waveform of either unipolar or bipolar pulse can be generated by adjusting the signals of TX and Unipolar pulse of Figure 4. During the RX phase, an ultrasonic echo signal is acquired. The measured waveforms shown in Figure 15b illustrate a repetitive HV pulse and the echo signal, which is amplified and filtered. To verify the performance of analog-signal conditioning, such as amplification and filtering, we have acquired a typical A-mode echo signal from a commercial phantom model (Model 040GSE, CIRS Inc., Norfolk, VA, USA). The passband of the RX part of the analog interface circuit ranges between 1 MHz and 3 MHz, and the overall voltage gain in the RX part is 40 dB. As shown in Figure 15b, the time interval between each of the ultrasonic echo signals is uniform, and the amplitude of each echo signal is sufficiently large.
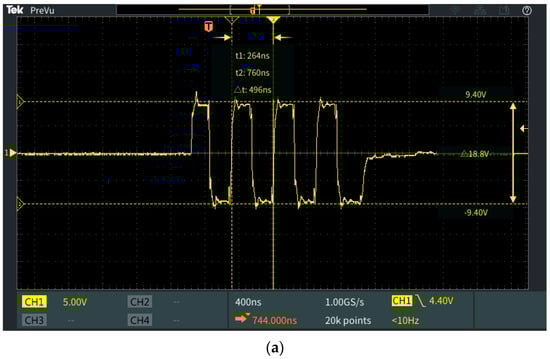
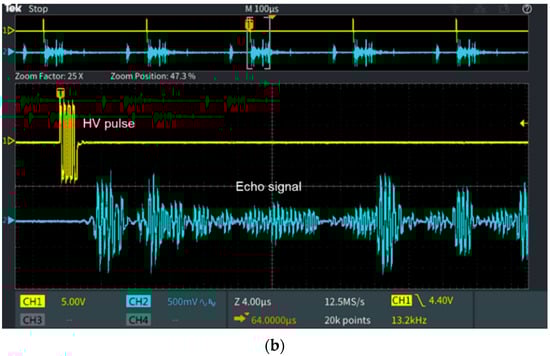
Figure 15.
Measurement analog waveforms of (a) high-voltage pulser output and (b) echo signal from commercial phantom model.
To demonstrate the performance of the implemented circuit system, this work implemented a flow phantom model, as shown in Figure 16. The flow phantom consists of a tissue-mimicking part, vessel-mimicking channels, a water pump, and a water reservoir. The tissue-mimicking part, which was made of gelatin, includes two vessel-mimicking channels. To verify that the proposed automatic range-gate-positioning scheme tracks the focal depth of the flowing fluid, one of the vessel-mimicking channels was connected to an external tube, and the other channel was filled with only water. The fluidic channels in the phantom are wall-less type, which is in direct contact with fluid. In the process of phantom implementation with gelatin, a rod was used to make a space for the wall-less channel. To prevent leakage at the edge of the channel, the wall-less channel was connected with a C-flex tube through a reticulated form and tube connectors. In addition, to acquire a Doppler signal with sufficient amplitude, a solute of NaCl was dissolved in water. The solute acts as scatterers in this measurement; that is, when the concentration of NaCl is high enough, ion clusters are created, and the effective cluster size also increases. [27,28]. We adjusted the NaCl concentration heuristically to acquire sufficient amplitude of flow signals.
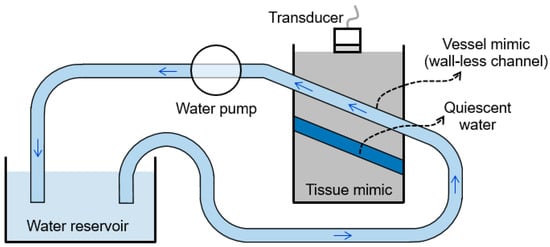
Figure 16.
Flow phantom model.
Figure 17 illustrates the measured digital waveforms from the flow phantom model. During every RX phase, an echo signal (i.e., an ensemble signal) is acquired and filtered in the digital domain, as shown in Figure 7. Two consecutive ensemble signals, which correspond to a BPF output, are presented in Figure 17a,b. These two ensembles look almost the same. A relatively strong scattering occurs at shallow depth, and the following two echo packets with relatively large amplitude correspond to vessel-mimicking channels. In the implementation of the automatic range-gate-positioning scheme in the FPGA, the number of accumulation of adjacent ensemble differences is set to 256. The resultant waveform, the accumulation of adjacent ensemble differences, is shown in Figure 17c. The Doppler amplitude deviation is sufficiently amplified in the channel region where a fluid flows. The measured noise floor of the accumulated waveform is around 82 least-significant bits (LSBs). Therefore, the root-mean-square (RMS) value of noise for one ensemble is estimated to be around 5.3 LSBs.
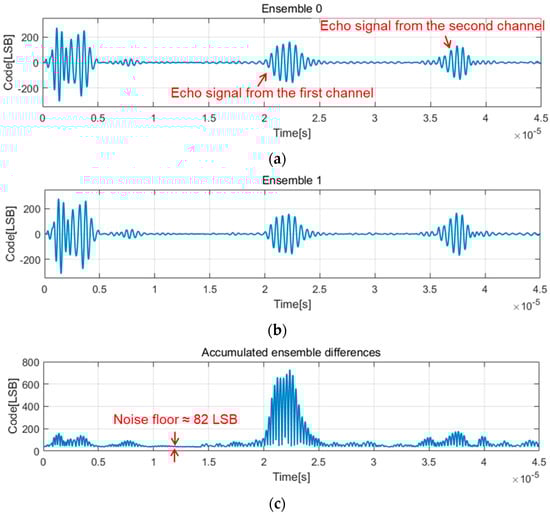
Figure 17.
Measured digital waveforms using flow phantom model: (a) ensemble signal with index 0, (b) ensemble signal with index 1, and (c) accumulated ensemble differences, ∑ |EN—EN−1|.
As mentioned before, the waveform of accumulated ensemble differences is fed into a BPF. The output waveform of the BPF output is illustrated in Figure 18a. As shown in Figure 18a, the DC component along with low-frequency components are sufficiently removed. By applying the BPF output into a hysteresis comparator, as shown in Figure 8, the signal Range gate is generated, as shown in Figure 18b. The middle focal-depth value, which corresponds to the middle time point of high duration of the Range gate signal, is utilized to sort out Doppler sample volumes.
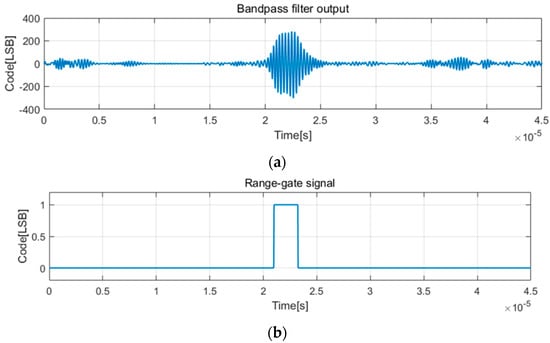
Figure 18.
Measured (a) band-pass filter output for accumulated ensemble differences, and (b) Range-gate signal from the flow phantom model.
Figure 19a illustrates the measured Doppler sample volumes. This waveform was acquired by resampling ensembles at the focal-depth value, which corresponds to the middle time point of high duration of the Range gate signal. A spectrum of Doppler sample is shown in Figure 19b. The spectrum has a peak power at a frequency of 82.4 Hz, and most of the signal powers are concentrated in the vicinity of 82.4 Hz. Considering relevant parameters, such as the fluid velocity of 6 cm/s, center frequency of 2 MHz, angle of 60°, and speed of sound of 1540 m/s, the expected Doppler shift frequency is 79 Hz. Thus, the measured peak-power frequency shows a good agreement with the theoretical Doppler shift frequency.
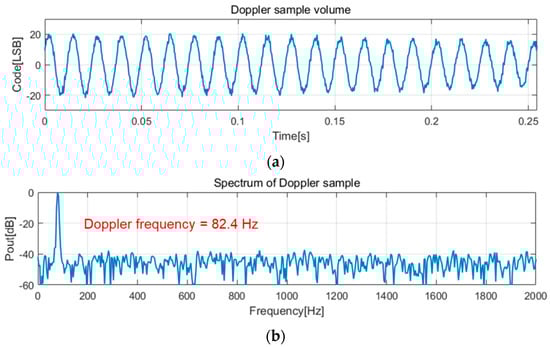
Figure 19.
Measured (a) Doppler sample volume and (b) spectrum from the flow phantom model.
To evaluate the performance of the proposed circuit system, this work established an experimental environment that can arbitrarily control a fluid velocity. Figure 20a shows the measured arbitrary supply voltage waveform applied to the water pump. This signal was generated using an arbitrary waveform generator (AFG31102, Tektronix, Beaverton, OR, USA) and was supplied to the water pump through an analog buffer implemented with discrete commercial chips. The water pump regulates the fluid flow rate depending on the magnitude of the supply voltage. Figure 20b shows the Doppler data obtained with the range gate allocated by the automatic range-gate-positioning scheme. The oscillation components in the measured waveform are consistently observed, and this reflects that the position of the range gate is maintained stably. Figure 20c illustrates the recovered spectrogram. The dominant velocity profile of the spectrogram in Figure 20c shows good agreement with the profile of the supply-voltage waveform of the water pump.
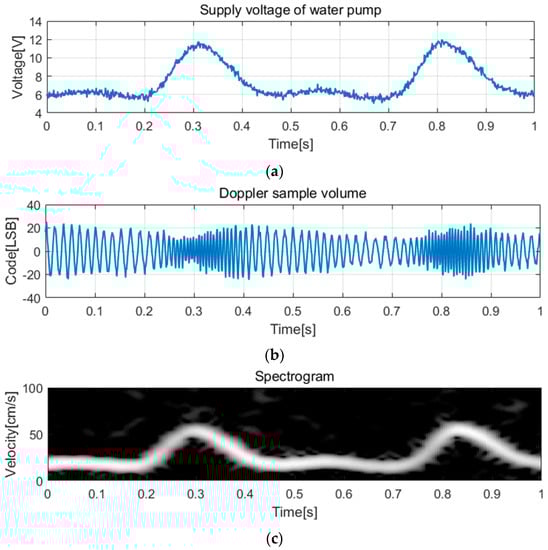
Figure 20.
(a) Measured supply voltage of water pump to arbitrarily adjust the fluid velocity, (b) acquired Doppler sample volume, and (c) reconstructed spectrogram.
A comparison of automatic vessel detection methods is presented in Table 2. There are several relevant works [16,29,30], including single-element-based systems and array-based systems. In addition, the image-based algorithm shown in Table 2 can be applied to single-scanline data by elaborating its primary concept. The previous works of [16,29,30] are based on recognition of specific patterns in either A-mode or B-mode. Therefore, those works are dedicated to tracking specific target vessels. On the other hand, the proposed system has a concept of monitoring Doppler amplitude deviation. Thus, it can detect a low-resistance arbitrary vessel. In addition, since the proposed system can detect a vessel regardless of the time-domain echo aliasing, the center frequency can be lowered by considering the hardware implementation.
Table 2.
Comparison of automatic vessel detection methods.
The utilized center frequency of 2 MHz corresponds to an almost-lowest boundary of the feasible center frequency in the Doppler mode of ultrasound devices. The reason why the center frequency of this work is set to 2 MHz is to illustrate that the system can blindly find a fluidic channel even under unfavorable conditions. It is worth mentioning that the center frequency of this circuit system is not limited to 2 MHz. As a proof of concept, we have utilized a relatively low frequency value. In addition, the center frequency can be increased depending on the specific target vessels, and it will require various studies to determine the optimum center frequency depending on the application.
The proposed system needs a manual adjustment of the view angle. As a future work of this proof-of-concept system, hemodynamic indices such as a resistivity index and a pulsatility index are to be extracted with reconstructed spectrogram in in vivo tests. Since hemodynamic indices are based on a ratio of velocity terms, they are less sensitive to view angles [31]. Thus, we are planning evaluations on whether to extract consistent hemodynamic indices for various view angles.
4. Conclusions
This paper presents a blood-flow-monitoring circuit system based on a single-element transducer. The blood-flow-monitoring circuit system consists of a transducer, an analog interface circuit, and an FPGA. To acquire Doppler sample volumes without reconstruction of ultrasound images, this work proposes an automatic range-gate-positioning scheme which can blindly track the focal-depth value by using an accumulation of difference values of adjacent ensembles and a hysteresis-slicing function. The automatic range-gate-positioning scheme, along with the hysteresis slicing function, has been implemented in the FPGA. Most of other single-element-based pulsed-wave Doppler devices adopt a manual adjustment of the range gate [13,14,15]. In addition, a recent work which includes a vessel-wall-detection algorithm presents an automatic tracking of the vessel wall [16]. However, it relies on a specific A-mode echo pattern, and correspondingly, it essentially needs to use a relatively higher center frequency. On the other hand, the proposed automatic range-gate-positioning scheme does not rely on a specific A-mode echo pattern, and it utilizes the Doppler amplitude deviation to find the vessel region. Thus, the proposed scheme can reduce the center frequency of the ultrasound, and correspondingly, it can reduce the overall operating frequency of the system. In addition, the proposed scheme can be implemented in FPGA with fewer resources since it uses addition-only computation (except filter parts). The FPGA utilizes 5.6% of slice look-up-tables (LUTs) for implementation of the range-gate-positioning scheme. This implies that the proposed scheme can be compactly implemented in the FPGA. In measurements, the circuit system was utilized to interrogate the customized flow phantom model, which includes two vessel-mimicking channels. The circuit system successfully acquired Doppler sample volumes by positioning a range gate at a fluid channel. In addition, the estimated Doppler shift frequency shows a good agreement with the theoretical value.
Author Contributions
Conceptualization, H.-T.P. and J.-Y.U.; methodology, H.-T.P.; investigation, H.-T.P.; validation, H.-T.P. and J.-Y.U.; writing—original draft preparation, H.-T.P. and J.-Y.U.; project administration, J.-Y.U.; funding acquisition, J.-Y.U. All authors have read and agreed to the published version of the manuscript.
Funding
This work was supported by the Basic Science Research Program through the National Research Foundation (NRF) of Korea funded by the Ministry of Education under Grant 2019R1I1A3A01060591.
Institutional Review Board Statement
Not applicable.
Informed Consent Statement
Not applicable.
Data Availability Statement
The data presented in this study are included within the article.
Acknowledgments
Electronic Design Automation (EDA) tools were supported by the Integrated Circuit Design Education Center (IDEC), South Korea.
Conflicts of Interest
The authors declare no conflict of interest.
References
- Agnew, C.E.; McCann, A.J.; Lockhart, C.J.; Hamilton, P.K.; McVeigh, G.E.; McGivern, R.C. Comparison of rootMUSIC and discrete wavelet transform analysis of Doppler ultrasound blood flow waveforms to detect microvascular abnormalities in Type I diabetes. IEEE Trans. Biomed. Eng. 2011, 58, 861–874. [Google Scholar] [CrossRef] [PubMed]
- Jiao, Y.; Zhang, D.; Xu, Y.; Chen, Y.; Wu, Z.; Cui, Y. H-scan subtraction Doppler imaging: A novel ultrasound small blood vessel flow characterization with scattering and reflection identification. Appl. Sci. 2020, 10, 7604. [Google Scholar] [CrossRef]
- Osmanski, B.F.; Bercoff, J.; Montaldo, G.; Loupas, T.; Fink, M.; Tanter, M. Cancellation of Doppler intrinsic spectral broadening using ultrafast Doppler imaging. IEEE Trans. Ultrason. Ferroelect. Freq. Control 2014, 61, 1396–1408. [Google Scholar] [CrossRef]
- Jannewein, L.; Theissen, S.; Pfeifenberger, H.R.; Zander, N.; Fischer, K.; Eichbaum, C.; Louwen, F. Differences in biometric fetal weight estimation accuracy and Doppler examination results in uncomplicated term singleton pregnancies between vertex and breech presentation. J. Clin. Med. 2021, 10, 3252. [Google Scholar] [CrossRef] [PubMed]
- Ovali, G.Y.; Ersoy, B.; Urk, O.T.V.; Ozkol, M.; Ozhan, B.; Baser, E.; Pabuscu, P. Doppler ultrasonography imaging of hemodynamic alteration of retrobulbar circulation in type 1 diabetic children and adolescents without retinopathy. Diabetes Res. Clin. Pract. 2008, 79, 243–248. [Google Scholar] [CrossRef]
- Michelson, G.; Harazny, J.; Schmieder, R.E.; Berendes, R.; Fiermann, T.; Wärntges, S. Fourier analysis of the envelope of the ophthalmic artery blood flow velocity: Age-and blood pressure related impact. Hypertension 2007, 50, 964–969. [Google Scholar] [CrossRef]
- David, J.Y.; Jones, S.A.; Giddens, D.P. Modern spectral analysis techniques for blood flow velocity and spectral measurements with pulsed Doppler ultrasound. IEEE Trans. Biomed. Eng. 1991, 38, 589–596. [Google Scholar] [CrossRef]
- Staub, D.; Meyehans, A.; Bundi, B.; Schmid, H.P.; Frauchiger, B. Prediction of cardiovascular morbidity and mortality: Comparison of the internal carotid artery resistive index with the common carotid artery intima-media thickness. Stroke 2006, 37, 800–805. [Google Scholar] [CrossRef]
- Um, J.-Y.; Kim, Y.-J.; Cho, S.-E.; Chae, M.-K.; Song, J.; Kim, B.; Lee, S.; Bang, J.; Kim, Y.; Cho, K.; et al. An analog-digital-hybrid RX beamformer chip with non-uniform sampling for ultrasound imaging with 2D CMUT array. IEEE Trans. Biomed. Circuits Syst. 2015, 9, 138–151. [Google Scholar] [CrossRef]
- Kim, G.-D.; Yoon, C.; Kye, S.-B.; Lee, Y.; Kang, J.; Yoo, Y.; Song, T.-K. A single FPGA-based portable ultrasound imaging system for point-of-care applications. IEEE Trans. Ultrason. Ferroelectr. Freq. Control 2012, 59, 1386–1394. [Google Scholar]
- Lee, H.; Sohn, H.-Y.; Yoon, C.; Yoo, Y.; Song, T.-K. Software-based hand-held ultrasound color Doppler imaging system. In Proceedings of the IEEE International Ultrasonics Symposium, Rome, Italy, 20–23 September 2009; pp. 1844–1847. [Google Scholar]
- Hu, C.-H.; Zou, Q.; Shung, K.K. Design and implementation of high frequency ultrasound pulsed-wave Doppler using FPGA. IEEE Trans. Ultrason. Ferroelect. Freq. Control 2008, 55, 2109–2111. [Google Scholar]
- Jana, B.; Biswas, B.; Nath, P.K.; Saha, G.; Banerjee, S. Smartphone based point-of-care system using continuous wave portable Doppler. IEEE Trans. Instrum. Meas. 2020, 69, 8352–8361. [Google Scholar] [CrossRef]
- Huang, C.-C.; Lee, P.-Y.; Chen, P.-Y.; Liu, T.-Y. Design and implementation of a smartphone-based portable ultrasound pulsed-wave Doppler device for blood flow measurement. IEEE Trans. Ultrason. Ferroelect. Freq. Control 2012, 59, 182–188. [Google Scholar] [CrossRef] [PubMed]
- Song, I.; Yoon, J.; Kang, J.; Kim, M.; Jang, W.S.; Shin, N.-Y.; Yoo, Y. Design and implementation of a new wireless carotid neckband Doppler system with wearable ultrasound sensors: Preliminary results. Appl. Sci. 2019, 9, 2202. [Google Scholar] [CrossRef]
- Sahani, A.K.; Shah, M.I.; Radhakrishnan, R.; Joseph, J.; Sivaprakasam, M. An imageless ultrasound device to measure local and regional arterial stiffness. IEEE Trans. Biomed. Circuits Syst. 2016, 10, 200–208. [Google Scholar] [CrossRef]
- Tan, M.; Kang, E.; An, J.-S.; Chang, Z.-Y.; Vince, P.; Matéo, T.; Sénégond, N.; Pertijs, M.A.P. A 64-channel transmit beamformer with ±30-V bipolar high-voltage pulsers for catheter-based ultrasound probes. IEEE J. Solid State Circuits 2020, 55, 1796–1806. [Google Scholar] [CrossRef]
- Qiu, W.; Yu, Y.; Tsang, F.K.; Sun, L. A multifunctional, reconfigurable pulse generator for high-frequency ultrasound imaging. IEEE Trans. Ultrason. Ferroelect. Freq. Control 2012, 59, 1558–1567. [Google Scholar]
- Xu, X.; Sun, L.; Cannata, J.M.; Yen, J.T.; Shung, K.K. High frequency ultrasound Doppler system for biomedical applications with a 30-MHz linear array. Ultrasound Med. Biol. 2008, 34, 638–646. [Google Scholar] [CrossRef] [PubMed][Green Version]
- Xu, X.; Yen, J.T.; Shung, K.K. A low-cost bipolar pulse generator for high-frequency ultrasound application. IEEE Trans. Ultrason. Ferroelectr. Freq. Control 2007, 54, 443–447. [Google Scholar] [CrossRef] [PubMed]
- Ultra Compact Octal 3L/Quad 5L Pulser with T/R Switches and Beamforming Capability, Maxim Integrated; MSDS No. MAX14813 Data Sheet; San Jose, CA, USA. November 2019. Available online: http://maximintegrated.com (accessed on 1 September 2021).
- 8-Channel, Low Jitter Ultrasound Transmit Beamformer with Programmable Duty-Cycle and High Resolution; MSDS No. LM96570 Data Sheet; Texas Instruments: Dallas, TX, USA, 2013; Available online: http://ti.com (accessed on 1 September 2021).
- Shung, K.K. Diagnostic Ultrasound: Imaging and Blood Flow Measurements, 1st ed.; CRC Press: New York, NY, USA, 2006; pp. 113–115. [Google Scholar]
- Jensen, J.A. Acoustical Imaging, 1st ed.; Springer: Boston, MA, USA, 1996; pp. 377–384. [Google Scholar]
- Field II Simulation Program. PW Example. Available online: https://field-ii.dk (accessed on 1 September 2021).
- Feneck, R.; Kneeshaw, J.; Ranucci, M. Core Topics in Transesophageal Echocardiography, 1st ed.; Cambridge University Press: Cambridge, UK, 2010; pp. 13–33. [Google Scholar]
- Pater, L.A.; Kindt, J.T. Simulations of NaCl aggregation from solution: Solvent determines topography of free energy landscape. J. Comput. Chem. 2019, 40, 135–147. [Google Scholar]
- Pal, B.; Kundu, S. Anomalous ultrasonic attenuation in aqueous NaCl solutions. Univers. J. Chem. 2013, 1, 96–101. [Google Scholar] [CrossRef]
- Matera, R.; Ricci, S. Automatic measurement of the carotid blood flow for wearable sensors: A pilot study. Sensors 2021, 21, 5877. [Google Scholar] [CrossRef] [PubMed]
- Park, J.; Zhou, S.K.; Simopoulos, C.; Comaniciu, D. AutoGate: Fast and Automatic Doppler Gate Localization in B-Mode Echocardiogram. Medical Image Computing and Computer-Assisted Intervention—Lecture Note in Computer Science; Springer: Berlin, Germany, 2008; pp. 230–237. [Google Scholar] [CrossRef]
- Evans, D.H.; McDicken, W.N. Doppler Ultrasound, Physics, Instrumentation and Signal Processing, 2nd ed.; Wiley Press: New York, NY, USA, 2000; pp. 200–222. [Google Scholar]


Publisher’s Note: MDPI stays neutral with regard to jurisdictional claims in published maps and institutional affiliations. |
© 2021 by the authors. Licensee MDPI, Basel, Switzerland. This article is an open access article distributed under the terms and conditions of the Creative Commons Attribution (CC BY) license (https://creativecommons.org/licenses/by/4.0/).