Article

Zero-Emission of Palm Oil Mill Effluent Final Discharge Promoted Bacterial Biodiversity Rebound in the Receiving Water System

by
Noor Shaidatul Lyana Mohamad-Zainal
1,
Norhayati Ramli
1,2,*,
Nurhasliza Zolkefli
1,
Nur Azyani Jamari
1,
Nurul Asyifah Mustapha
3,
Mohd Ali Hassan
1,4 and
Toshinari Maeda
3
1
Department of Bioprocess Technology, Faculty of Biotechnology and Biomolecular Sciences, Universiti Putra Malaysia, Seri Kembangan 43400, Selangor, Malaysia
2
Laboratory of Biopolymer and Derivatives, Institute of Tropical Forestry and Forest Products (INTROP), Universiti Putra Malaysia, Seri Kembangan 43400, Selangor, Malaysia
3
Department of Biological Functions Engineering, Graduate School of Life Science and Systems Engineering, Kyushu Institute of Technology, 2-4 Hibikino, Wakamatsu-ku, Fukuoka 808-0196, Japan
4
Processing and Product Development Laboratory, Institute of Plantation Studies, Universiti Putra Malaysia, Seri Kembangan 43400, Selangor, Malaysia
*
Author to whom correspondence should be addressed.
Appl. Sci. 2021, 11(22), 10814; https://doi.org/10.3390/app112210814
Submission received: 26 September 2021 / Revised: 27 October 2021 / Accepted: 28 October 2021 / Published: 16 November 2021

Abstract

:
Zero-emission technology for palm oil mill effluent (POME) has led to a breakthrough in the palm oil industry in relation to the goal of sustainable development. However, there are limited resources on how this technology has affected the bacterial community in the receiving river that has previously been polluted with POME final discharge. Thus, the current study assessed the recoverability of the unexplored bacterial community in the receiving water of a constructed river water system post-zero emission of POME final discharge. An artificial river water system was constructed in this study, where the viability status and the composition of the bacterial community were assessed for 15 days using a flow cytometry-based assay and high-throughput sequencing by Illumina MiSeq, respectively. The zero-emission of POME final discharge reduced not only the physicochemical properties and nutrient contents of the receiving water, but also the bacterial cells’ viability from 40.3% to 24.5% and shifted the high nucleic acid (HNA) to low nucleic acid (LNA) content (38.7% to 34.5%). The proposed POME bacterial indicators, Alcaligenaceae and Chromatiaceae were not detectable in the rainwater (control) but were detected in the artificial river water system after the introduction of POME final discharge at the compositions of 1.0–1.3% and 2.2–5.1%, respectively. The implementation of a zero-emission system decreased the composition of Chromatiaceae from 2.2% on day 8 until it was undetectable on day 15, while Alcaligenaceae was continuously reduced from 1.2% to 0.9% within that similar time frame. As indicated by principal coordinate (PCO) analysis, the reductions in biological oxygen demand (BOD5) would further diminish the compositions of these bioindicators. The zero-emission of POME final discharge has demonstrated its efficacy, not only in reducing the polluting properties, but also in the bacterial biodiversity rebound in the affected water system.

1. Introduction

Malaysia is moving forward with a sustainable palm oil industry by practically converting wastes generated from the production of palm oil into valuable products or even utilizing them for operations in the palm oil mills. The wastes produced by the palm oil industry starting from the harvesting stage to the extraction process of palm oil including the biomass such as palm kernel shells, mesocarp fibers and empty fruit bunches, as well as the liquid waste known as palm oil mill effluent (POME) have caused environmental casualties [1]. Since POME is the most abundant waste produced from the production of palm oil, it has gained serious attention from researchers and industries who wish to resolve the pollution issues caused by its discharge. The zero-emission system of POME is defined as an integrated system with no net waste discharge into the environment from the mill and a system that can implement the sustainable and integrated palm oil biorefinery concept [2]. This is a continuous effort that aims to treat the incoming effluents by completely utilizing the waste into something useful [3], such as for the production of biogas and biofertilizer [4] and as recycled water for the processing of palm oil [5]. With the aim to fulfil this goal, the researchers in [3,4] proposed a flow diagram of the treatment process of zero-emission of POME where all of the wastes, including solids, liquids, and gases were recycled for the mill’s operation (Figure 1). This system leads to a more sustainable and environmentally friendly production of palm oil [6] while reducing the cost for waste treatment and the operation of the mill [7]. In addition, the more stringent environmental regulations have become the driving force for palm oil mills to intensely improve their waste management system to achieve better sustainability in palm oil production and in the hope of reducing health issues to humans and the environment [8].
The application of the zero-emission system has a positive impact on a receiving waterway that has been previously exposed to the pollution. The reduced intake of polluting properties, such as biological oxygen demand (BOD), chemical oxygen demand (COD), total suspended solid (TSS), and nutrient content positively affects the aquatic ecosystem [9]. Microorganisms are among the living organisms in the receiving waterway that are affected due to the introduction of wastewater [10]. A previous study reported on the reduction in the fecal coliform following the implementation of zero-emission of municipal wastewater [11]. The success of the zero-emission system can also be seen in the aquaculture industry where the composition of bacterial predators such as Bdellovibrio and like organisms (BALOs) decreased and thus the balanced functional and structural microbial community in the receiving seawater was re-instated [12]. The positive impacts of zero-emission implementations in numerous industries have been so insightful that it is worth exploring the possibility of also restoring the original conditions of the receiving water polluted by POME final discharge through the application of a similar system.
Proven as the unique bacteria within the shifted community due to POME introduction which were carried over from the POME final discharge, Alcaligenaceae and Chromatiaceae were proposed as the pollution bioindicators in the receiving river [13]. The reliability of these bioindicators was then proven when they were detected in different POME final discharges from different palm oil mills despite the use of a non-identical layout of POME biotreatment processes [14]. The detection of these bacteria in only the POME polluted rivers but not in others [15] added more credibility to the claim that Alcaligenaceae and Chromatiaceae are the POME pollution bioindicators. Given the uniqueness of these bioindicators, they could also be used to indicate the success of the zero-emission of POME final discharge in the receiving river.
Nowadays, the palm oil industry is no less important than other industries due to the increasing demand for palm oil supplies throughout the year. Despite the growing implementation of zero-emission in other industries, to the best of our knowledge, there has not been any study conducted on the effect of the implementation of the zero-emission system on the bacterial community in the POME final discharge-receiving water so far. Therefore, this study was conducted to assess the shift in the bacterial community in an artificial river water system before and after the implementation of zero-emission of POME final discharge. The bacterial community in the receiving river carried over by this effluent, represented by Chromatiaceae and Alcaligenaceae, was hypothesized to rebound following the implementation of zero-emission of POME final discharge, restoring the original ecosystem in the river water. To test this hypothesis, an artificial river water system was constructed to mimic the usual practice of discharging POME final discharge, which later was followed by the implementation of a zero-emission system. To assess the bacterial community composition, 16S rRNA sequencing on Illumina MiSeq platform was utilized, which then was correlated statistically with the physicochemical properties and nutrient analyses. The functional status of the bacterial cells was analyzed using flow cytometry.

2. Materials and Methods

2.1. Sampling Sites and Sample Collection

POME final discharge was collected from a palm oil mill in Negeri Sembilan, Malaysia and transported in 25 L clean plastic containers to Universiti Putra Malaysia (UPM) which took almost 2 h. It was processed as soon as it reached the laboratory (within 30 min upon arrival). Meanwhile, the harvested rainwater used in the artificial river water system was taken from the Biorefinery Complex, UPM.

2.2. Construction of the Artificial River Water System

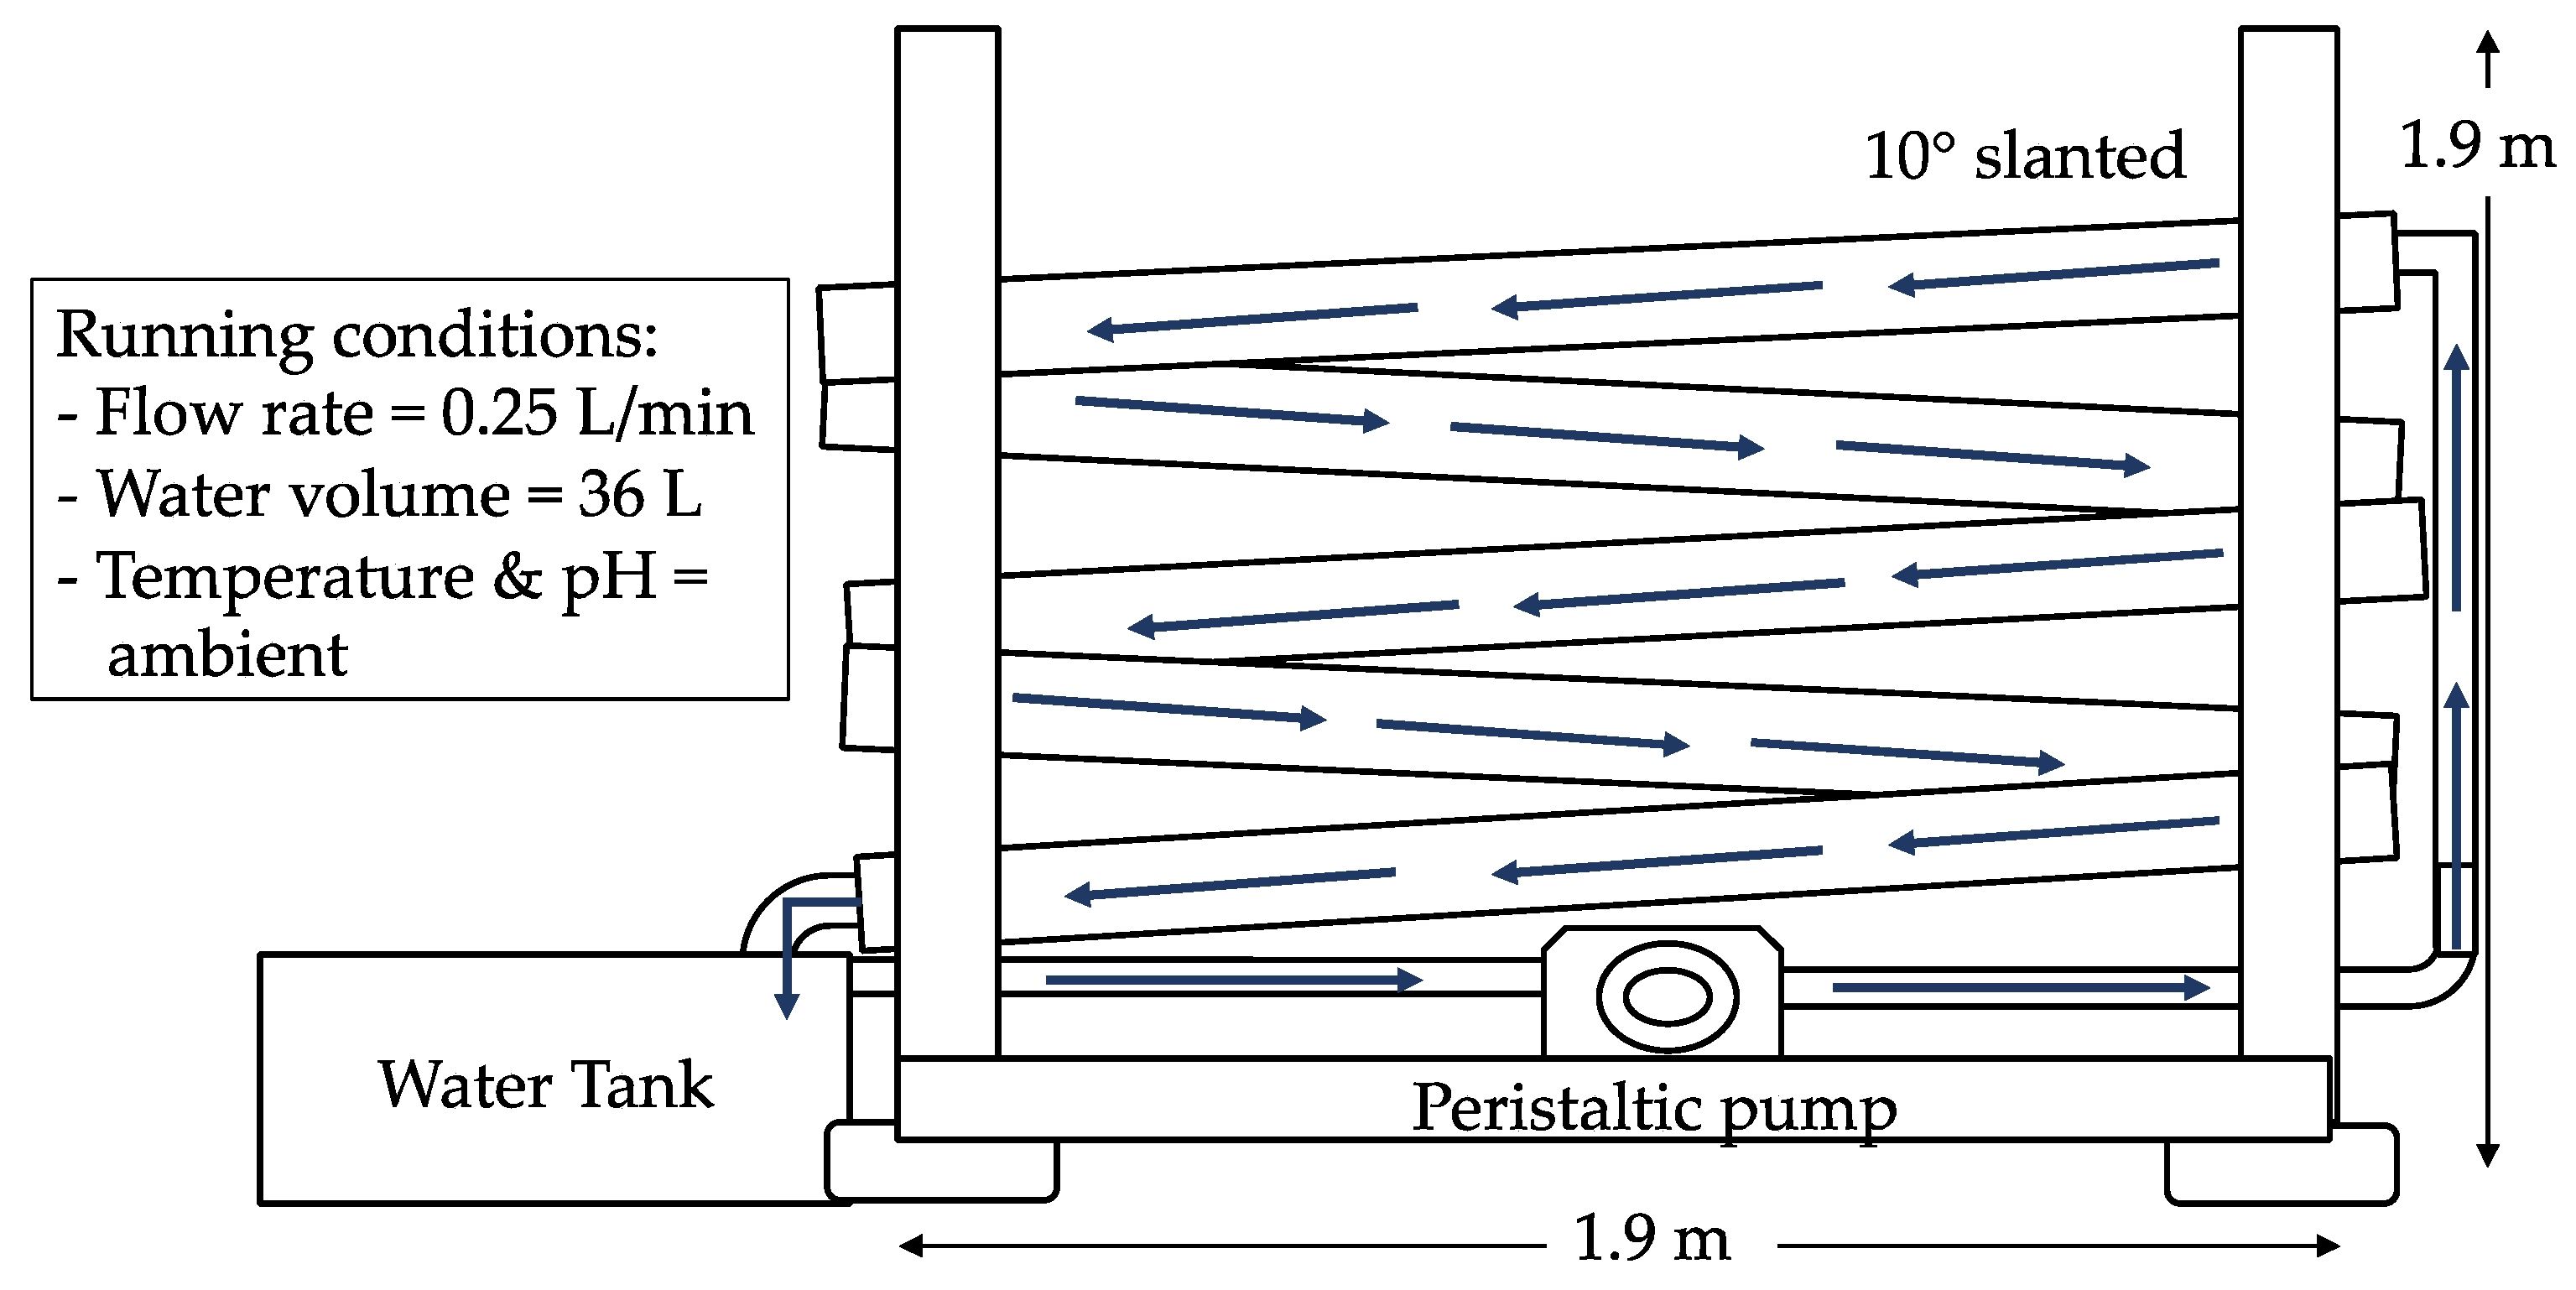
The artificial river water system was constructed as shown in Figure 2 (modified from Boeije et al. [16], Hodoki [17]) with the aim to mimic a POME final discharge-receiving river, followed with the implementation of zero-emission of the POME final discharge. The artificial river water system was built at 1.9 m in height and width, and consisted of a cascade of five circular-shaped gutters with an approximate 10° slant to ensure that the fed water flowed properly through the system. The temperature and pH were kept ambient. In the water tank, 36 L of water was filled in with a constant running flow rate at 0.25 L/min (modified from Boeije et al. [16]). The system was first fed with rainwater which acted as the clean water source and later POME final discharge was introduced to simulate the flowing in of the POME final discharge into the river water. The sampling of water from the artificial river water system was performed every day for 15 days. Rainwater was used to represent clean water since it does not contain any pollutants. The characteristics of the rainwater such as the temperature, pH, BOD5, chemical oxygen demand (COD), and TSS content are similar to the clean river water [18].

2.3. Water Feeding Exercise

The artificial river water system was first supplied with rainwater as a control on day 1 to mimic the clean river. Then, 6 L of POME final discharge was fed daily from day 2 to day 7 to mimic the effect of introducing the POME final discharge into the river. Following that, the feeding of POME final discharge was stopped from day 8 to day 15 to mimic the implementation of the zero-emission concept. Instead, 6 L of rainwater was resupplied daily into the system from day 10 to day 15. Concurrently, 6 L of water from the tank (mixture of rainwater and POME final discharge) was collected daily for the analyses. The changes in the physicochemical properties, nutrient contents, and bacterial community dynamics focusing on bacterial cell functionality and composition were analyzed every day throughout the 15-day cycle. The system was run thrice to ensure a better accuracy for the results obtained.

2.4. Physicochemical Analyses

Upon daily sampling, changes in temperature and pH were measured in situ using a portable meter (Eutech Expert pH, Thermo Scientific™, Uppsala, Sweden). BOD5 concentration was determined according to the Standard Method APHA 5210-B [19], while the COD concentration was measured using the reactor digestion method following the HACH Method 8000. TSS content was measured gravimetrically by drying the filtered glass fiber filter at 105 °C overnight. After weighing for TSS reading, the same glass fiber filter was further burnt in the furnace at 550 °C for the measurement of VSS content. The reading was recorded as residue after the ignition. All measurements were taken at least three times and the average data were calculated.

2.5. Nucleic Acid Double Staining Assay Based on Flow Cytometry

The changes in the functional status of the bacteria including the viability and the nucleic acid contents of the bacterial cells were assessed using a flow cytometry-based assay [20]. The samples were filtered using a 35 µm cell strainer to avoid clogging in the flow cytometer before undergoing heat-killing treatment for 45 min at 90 °C [21]. Propidium iodide and thiazole orange (BD™ Cell Viability Kit, Franklin Lake, NJ, USA) were used as the fluorescent probes in order to differentiate between compromised (dead) and viable bacterial cells, respectively. The analyses were completed using a BD Accuri C6 cytometer (Becton Dickinson UK Ltd., Oxford, UK) and CFlow Plus software was used to visualize the plots and for the gating process. Thiazole orange and propidium iodide were collected at FL1 and FL3 channels, respectively, with 20,000 bacterial cells counted [22] to differentiate between viable and dead cells. For the determination of high nucleic acid (HNA) and low nucleic acid (LNA) in the contents of bacterial cells, a graph of FL1 against side scatter (SSC) was plotted after excluding the dead population and noise.

2.6. Nutrient Analyses

Throughout the 15-day cycle of running the artificial river water system, the compositions of potassium (K), nitrate (NO3), ammonia nitrogen (NH3-N), and ammonia (NH3) were determined daily. Prior to all analyses, water samples were filtered through 0.45 µm of a filter membrane (cellulose nitrate membrane filters, 47 mm, Whatman) to remove debris or other vegetative matters. The detection of potassium in the water sample was conducted using Inductively Coupled Plasma-Mass Spectroscopy (ICP-MS) (Perkin Elmer, ELAN® 9000, Waltham, MA, USA) based on [19]). Meanwhile, nitrate analysis was conducted according to the cadmium reduction method where cadmium was used to detect the presence of nitrate in the water sample [19], which was performed using the HACH Method 8039 [23]. On the other hand, the determination of ammonia and ammonia nitrogen contents was performed according to the preliminary distillation step and the titrimetric method, respectively [19], which were both conducted following the HACH Method 8083 by using the Nessler Method [24]. All analyses were performed three times to obtain a better accuracy of the results.

2.7. DNA Extraction

Sterivex™ filter units were used to extract DNA from 2 L water samples. The quality and quantity of DNA were visualized using 1% agarose gel electrophoresis and a NanoDrop™ 2000/2000c Spectrophotometer (Thermo Fisher Scientific, Waltham, MA, USA), respectively.

2.8. High Throughput 16S rRNA Sequencing

The V4-V5 region of the 16S rRNA gene was used as a target of PCR amplification for the 16S rRNA sequencing on the Illumina MiSeq platform. The forward and reverse primers used were 341F (5′-CCTACGGGNGGCWGCAG-3′) and 785R (5′- GACTACHVGGGTATCTAATCC-3′) [25], respectively. The KAPA HiFi HotStart ReadyMix (Kapa Biosystems, Wilmington, MA, USA) was used for the amplification of 25 cycles along with the addition of 5 ng of a microbial DNA template and the forward and reverse primer. The 16S rRNA gene was amplified and the library was prepared according to the 16S rRNA amplicon sequencing library preparation for the Illumina MiSeq method [26]. All amplicons were pooled together and were attached with a unique barcode sequence (Nextera XT Index kit, San Diego, CA, USA) to differentiate each of them. Next, the AMPure XP beads (Indianapolis, IN, USA) were used to purify them and they were normalized to ensure that an equal library was presented in the pooled amplicons. Prior to MiSeq sequencing, the pooled amplicons were denatured with sodium hydroxide, diluted with a hybridization buffer, and denatured by heat. A 30% spike-in of PhiX (San Diego, CA, USA) was used as an internal control for the sequencing. A 600-cycle V3 MiSeq reagent cartridge (Illumina, San Diego, CA, USA) was used to load the pooled amplicons and the sequencing was performed at 301, 8, 8, and 301 cycles for forward, index 1, index 2, and reverse reads, respectively. The raw sequence data were deposited into the National Center for Biotechnology Information (NCBI) short reads archive database under the accession number SRR13364297.

2.9. High-Throughput Data Processing and Analysis of Bacterial Community Composition

High-throughput data were processed according to Mustapha et al. [26]. To generate high-quality reads, the demultiplexed raw paired-end reads sequencing data were processed using the LotuS pipeline (reads with an average sequence quality of >27, a sequence length of >170 bp, no uncertain bases, and a homopolymer run of less than 8 bp) [27]. At a cut-off of 97% identification, UPARSE was used to chimera-check and cluster the reads into operational taxonomic units (OTUs) [28]. The alpha-diversity indices were calculated using Quantitative Insights into Microbial Ecology (QIIME) v1.9.0 [29], and the microbial communities were further categorized and taxonomically assigned using Greengenes database v13.8 using Ribosomal Database Project with an 80% confidence threshold [30]. The Shannon-Wiener (H’) and Evenness (E’) indices were calculated using the rarefied OTU tables as the basis [29]. Both alpha diversity indices were calculated using Paleontological Statistics (PAST) software version 2.17c [31].

2.10. Statistical Analysis

All data were analyzed using PAleontological STatistics (PAST) software version 2.17c [32] and were individually tested for normality using the Shapiro–Wilk and Anderson–Darling tests. Both null hypotheses of normality were rejected if p ≤ 0.05. The relationship between bacterial taxa (family), BOD5, nutrient content, and flow cytometry was graphically illustrated using a principal coordinate (PCO) analysis.

3. Results and Discussion

3.1. Improvement in the Functional Status of Bacterial Cells due to Environmental Factors in the Zero-Emission System of POME Final Discharge

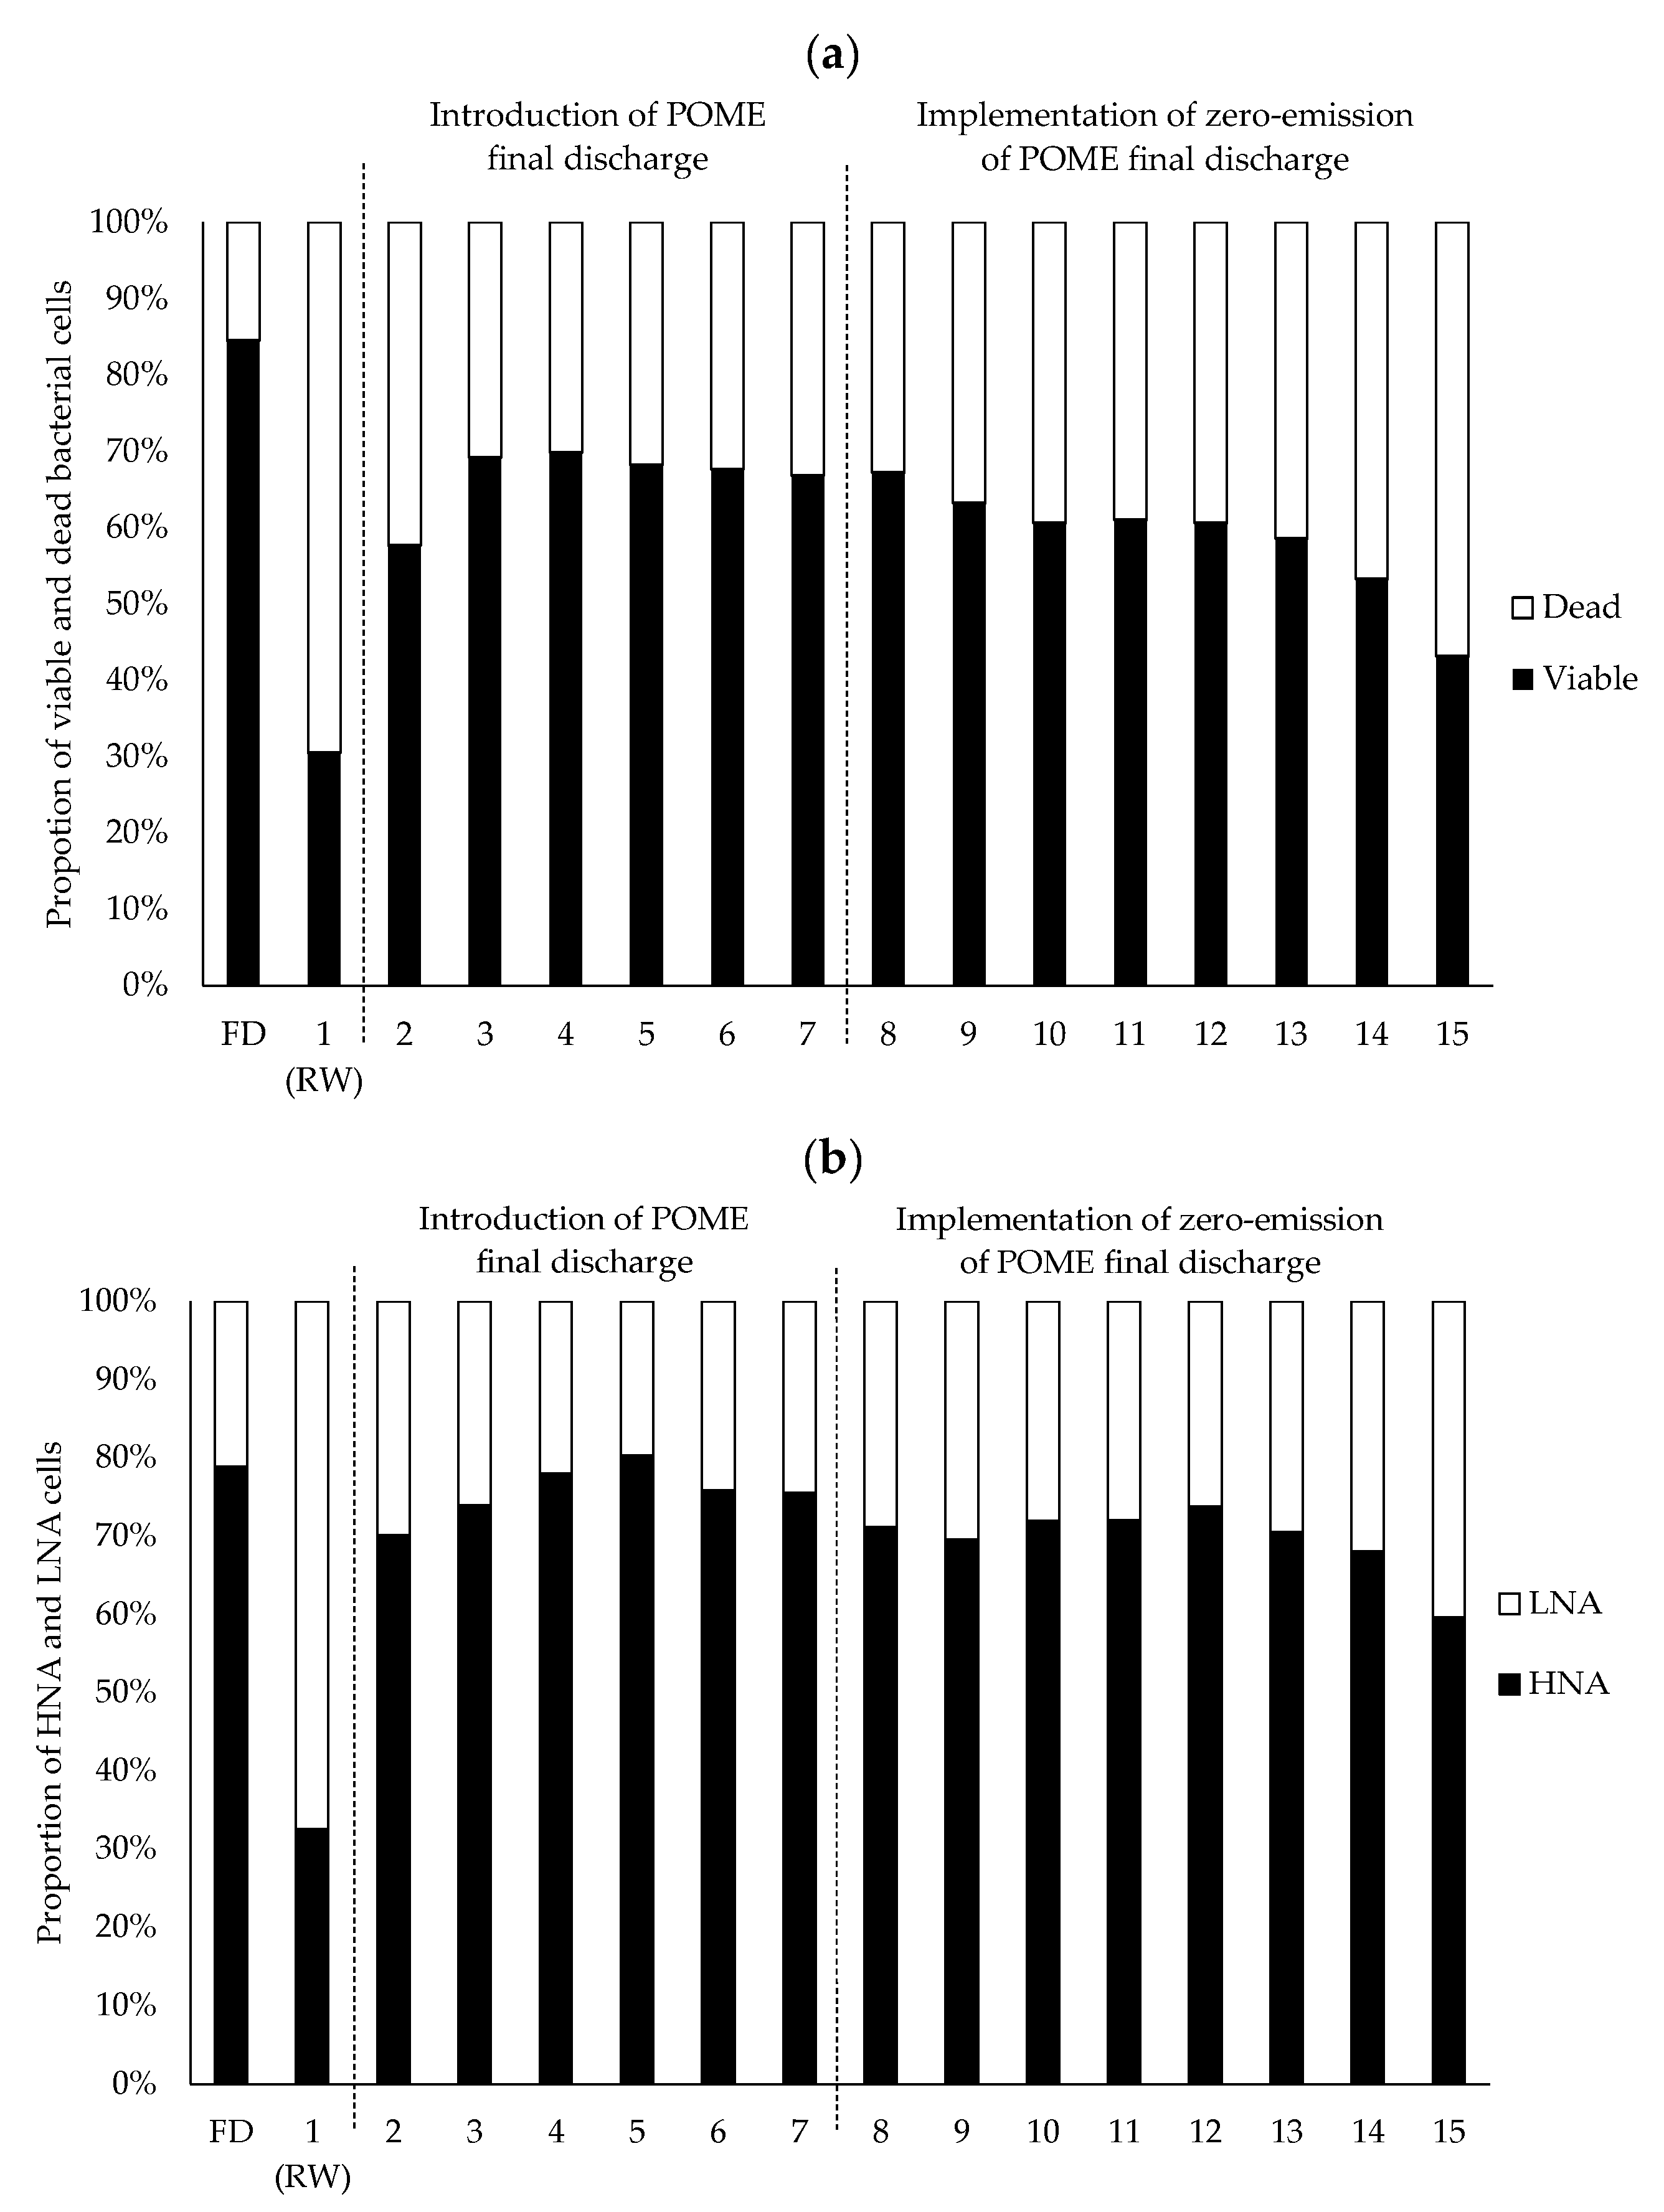
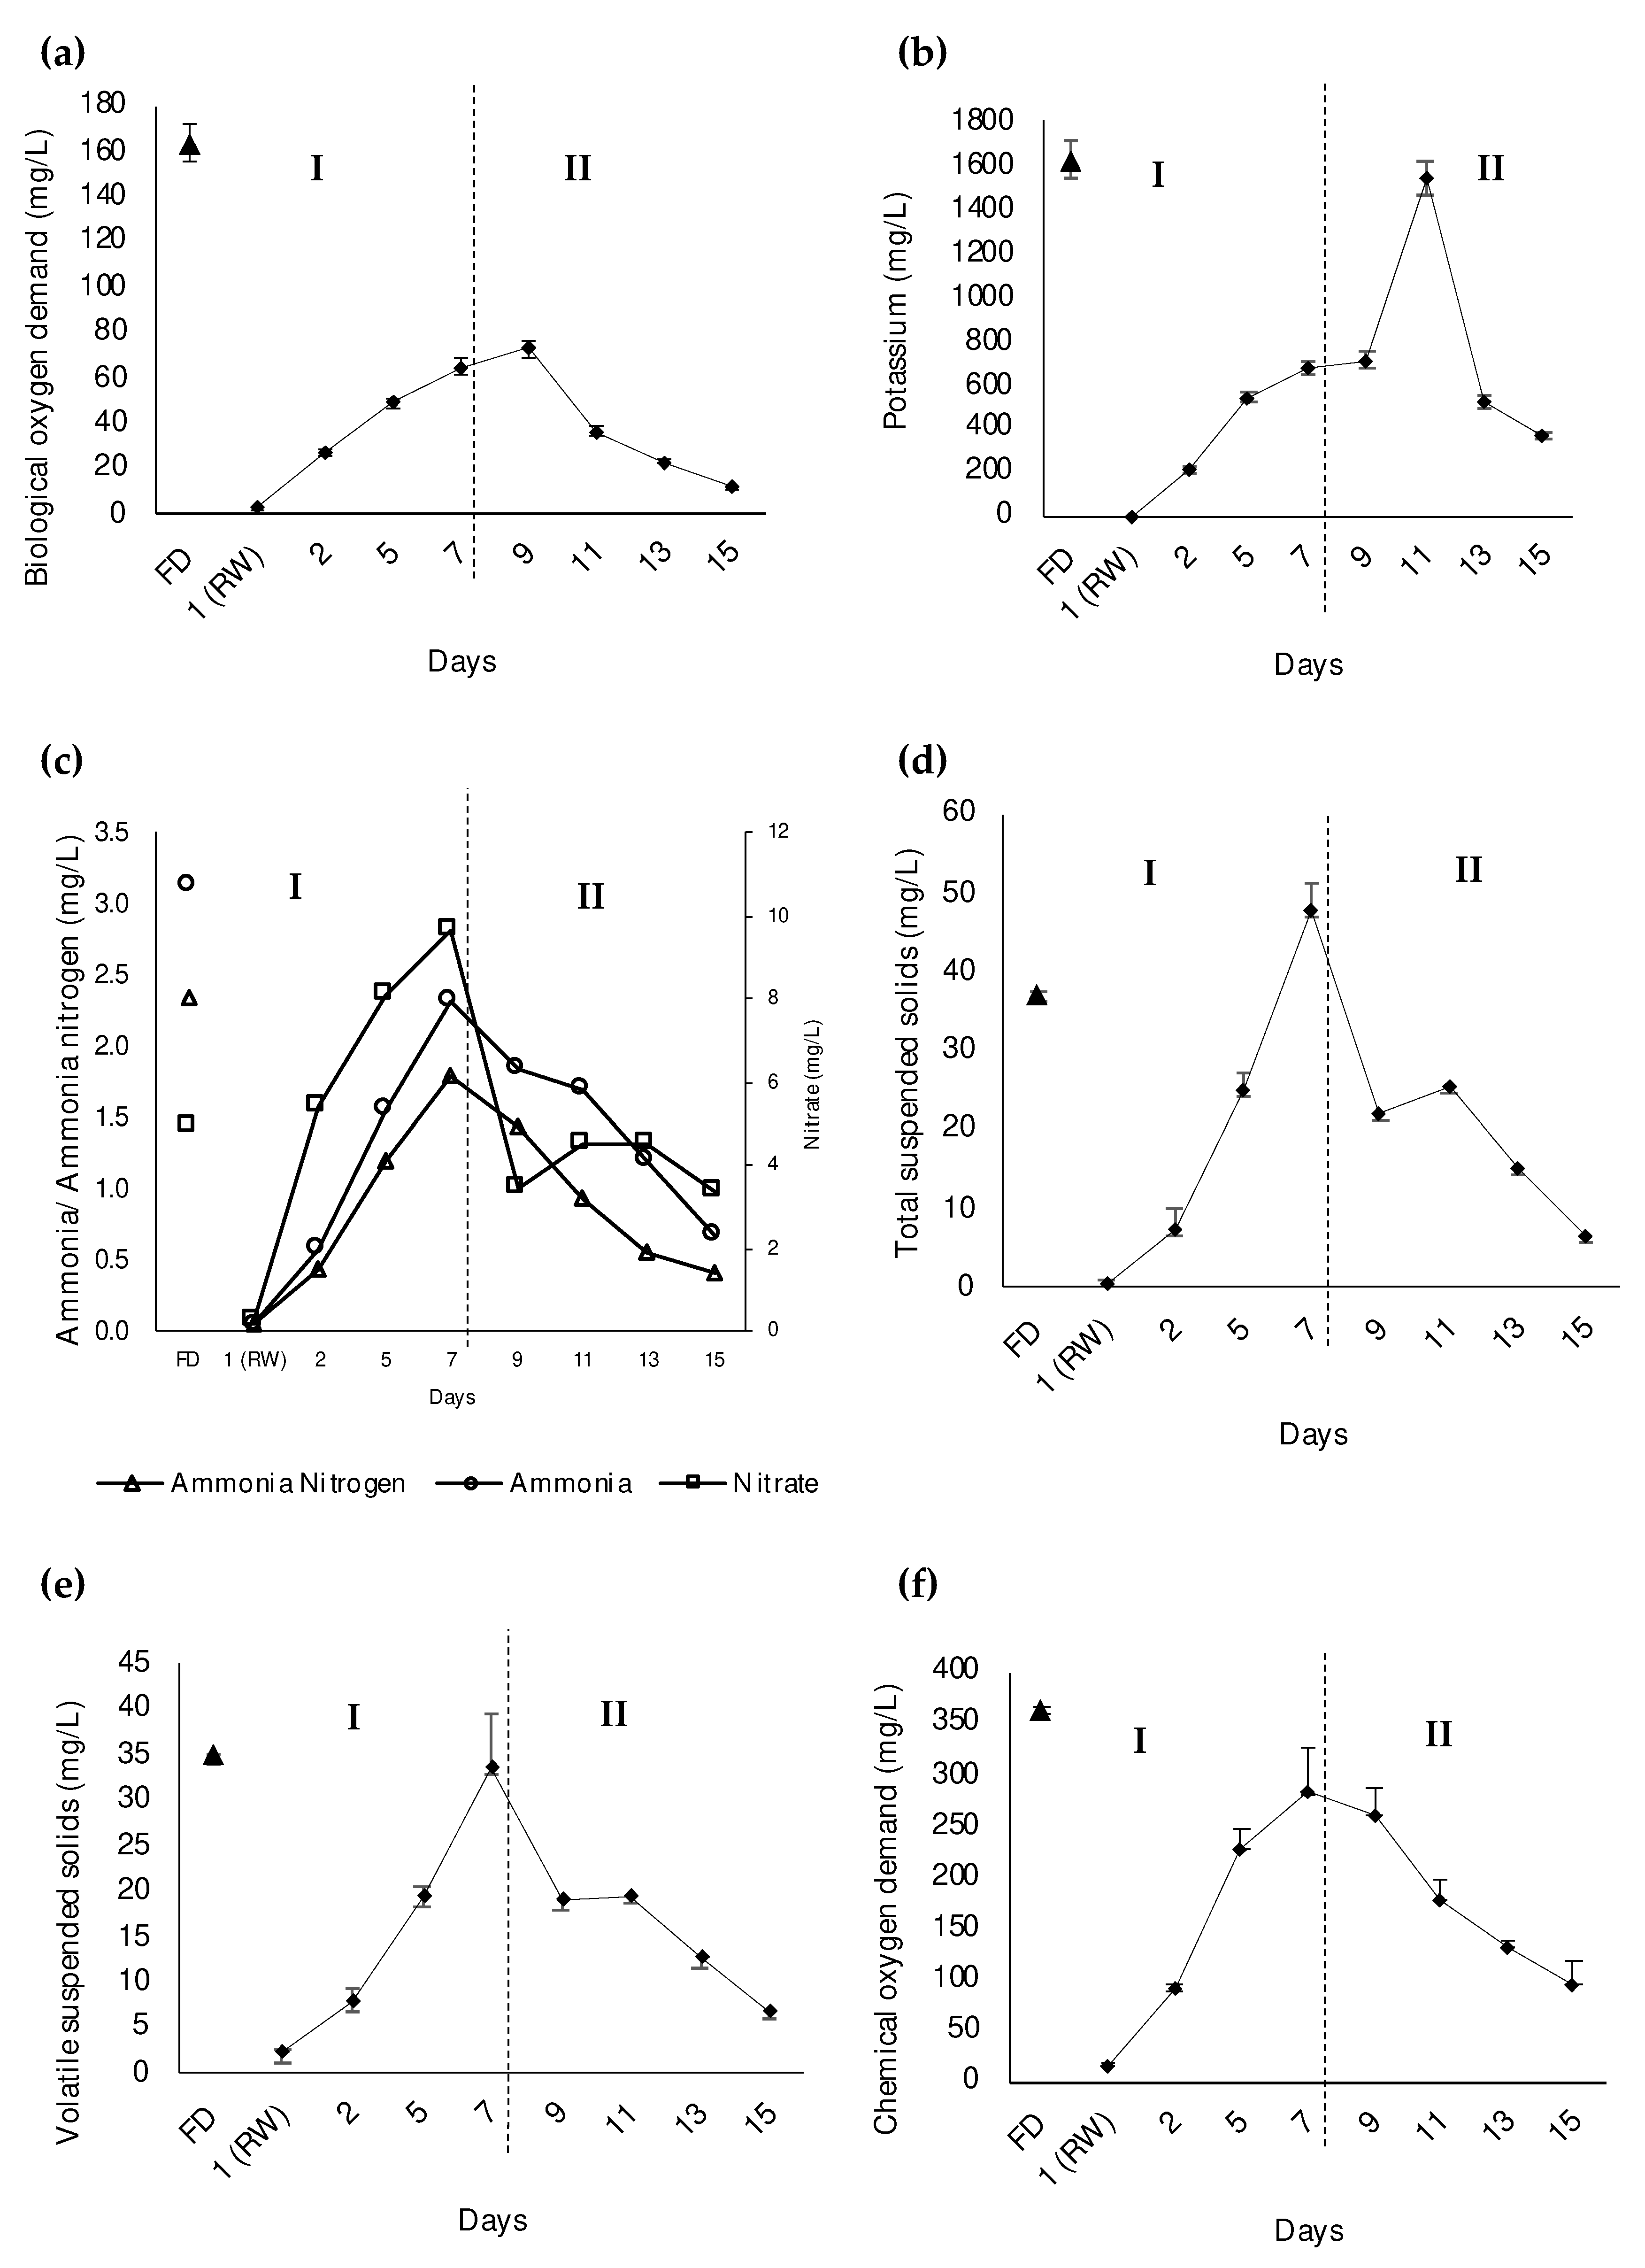
The functionality of the bacterial cells was differentiated into the proportion of viable and dead cells as visualized in Figure 3a. After excluding the dead proportion, the viable proportion of bacterial cells was further differentiated into their nucleic acid contents which were the HNA (active) and LNA (dormant) cells (Figure 3b). The rainwater sample, which was introduced on day 1, showed a high proportion of dead bacterial cells with around 70%. The proportion of LNA cells in the rainwater sample was also higher (70%) than that in the POME final discharge (20%). The result is reflected in the BOD5 reading where rainwater had a low BOD5 concentration which was 2.7 ± 0.9 mg/L (Figure 4a) proving that there was less of the bacterial community present in the rainwater. This was due to the limited nutrient content in the rainwater contributing to the low proportion of viable bacterial cells, and hence the proportion of HNA cells, which corresponds with the study by Hu et al. [33]. In this study, the initial nutrient contents, including potassium (Figure 4b), ammonium nitrogen, ammonia, and nitrate (Figure 4c), were reported at a very low concentrations in the rainwater.
On the other hand, POME final discharge had the highest proportion of viable bacterial cells (85%) and HNA cells (70%) (Figure 3). This was expected since the BOD5 recorded for POME final discharge was at 163.45 ± 6.94 mg/L (Figure 4a), which may have been due to the carried over nutrient content that originated from the palm oil fruit [34] and the abundance of bacteria that actively work to biodegrade the contaminants in the POME final discharge [21]. From Figure 4b,c, it is obvious that the nutrient contents of POME final discharge were extremely high compared to the rainwater.
Following the introduction of POME final discharge into the system on day 2, the proportion of viable bacterial cells increased to 60%, which was almost two times that of the initial proportion of the viable bacterial cells in the rainwater. This proportion was further increased as a result of the introduction of POME final discharge into the system until day 4, but it showed quite a steady trend from day 5 to day 7. The existing bacterial loads in the POME final discharge were introduced into the system which contributed to the increase in the viable bacterial cells in the receiving water. The introduction of the POME final discharge into the artificial river water system on day 2 also caused the proportion of HNA cells in the receiving water to increase to 42.7% (Figure 3b). According to Lebaron et al. [35], the original content of LNA cells in the rainwater may have been shifted to HNA cells as a result of the nutrients fed from the effluent, which allowed the bacterial population to actively grow and reproduce in the system.
This condition is supported by the increasing trend of the physicochemical properties as the POME final discharge was being introduced into the system from day 2 to day 7. The condition is reflected in the TSS and VSS content which slowly increased until it reached 47.9 ± 1.9 mg/L (Figure 4d) and 33.64 ± 1.42 mg/L (Figure 4e) on day 7, respectively. Since the POME final discharge contains nutrients (Figure 4b,c), it contributes to the growth of the bacterial community that are carried together in the suspended solids [36]. Similarly, the COD and BOD5 concentrations rapidly increased to 90.0 ± 5.0 mg/L (Figure 4f) and 27.2 ± 11.1 mg/L (Figure 4a) on day 2, respectively, and continued to progressively increase until day 7. These results prove that the introduction of POME final discharge into the clean water caused water pollution, and increased the proportion of viable bacteria and hence the HNA proportion of bacterial cells.
Nonetheless, the proportions of the viable bacterial cells and HNA were reduced once the zero-emission of POME final discharge was introduced from day 8 to day 15. This condition was expected since the increase in the proportion of viable cells was mostly contributed to by the addition of POME final discharge into the system. Hence, after POME final discharge stopped being added into the system, the proportions of viable bacterial cells and HNA cells decreased as the system progressed until day 15. A decreasing trend in the physicochemical properties could be observed once the zero-emission system of POME final discharge was implemented. These results correlate well with the reduction in the nutrient contents present in the system following the implementation of zero-emission of POME final discharge (Figure 4b,c). The TSS and VSS concentrations also gradually decreased until they reached 6.75 ± 3.04 mg/L (Figure 4d) and 6.92 ± 1.4 mg/L (Figure 4e), respectively, on day 15. A similar finding was previously reported where the TSS and VSS concentrations in the municipal effluent were able to be reduced following the implementation of a zero-emission system [11]. Similarly, the COD (Figure 4f) and BOD5 (Figure 4a) concentrations were gradually reduced following the implementation of zero-emission of POME final discharge from day 8 to day 15. The previous study had reported that the COD concentration of the polluted river decreased once the dyeing wastewater was no longer released into the river [37]. The river that was previously contaminated by urban pollutants also showed a positive reduction in the BOD5 concentration after its reclamation process [38].
This primary result shows an interesting outcome where the bacterial cell’s viability and the HNA proportion in the artificial river water system shifted following the implementation of zero-emission of POME final discharge, as reflected also in the physicochemical and nutrient content analyses. Therefore, this condition suggests that the bacterial community in the receiving water system had greatly recovered following the implementation of zero-emission of POME final discharge.

3.2. Effect of Zero-Emission of POME Final Discharge on the Composition of the Bacterial Community in the Receiving Water System

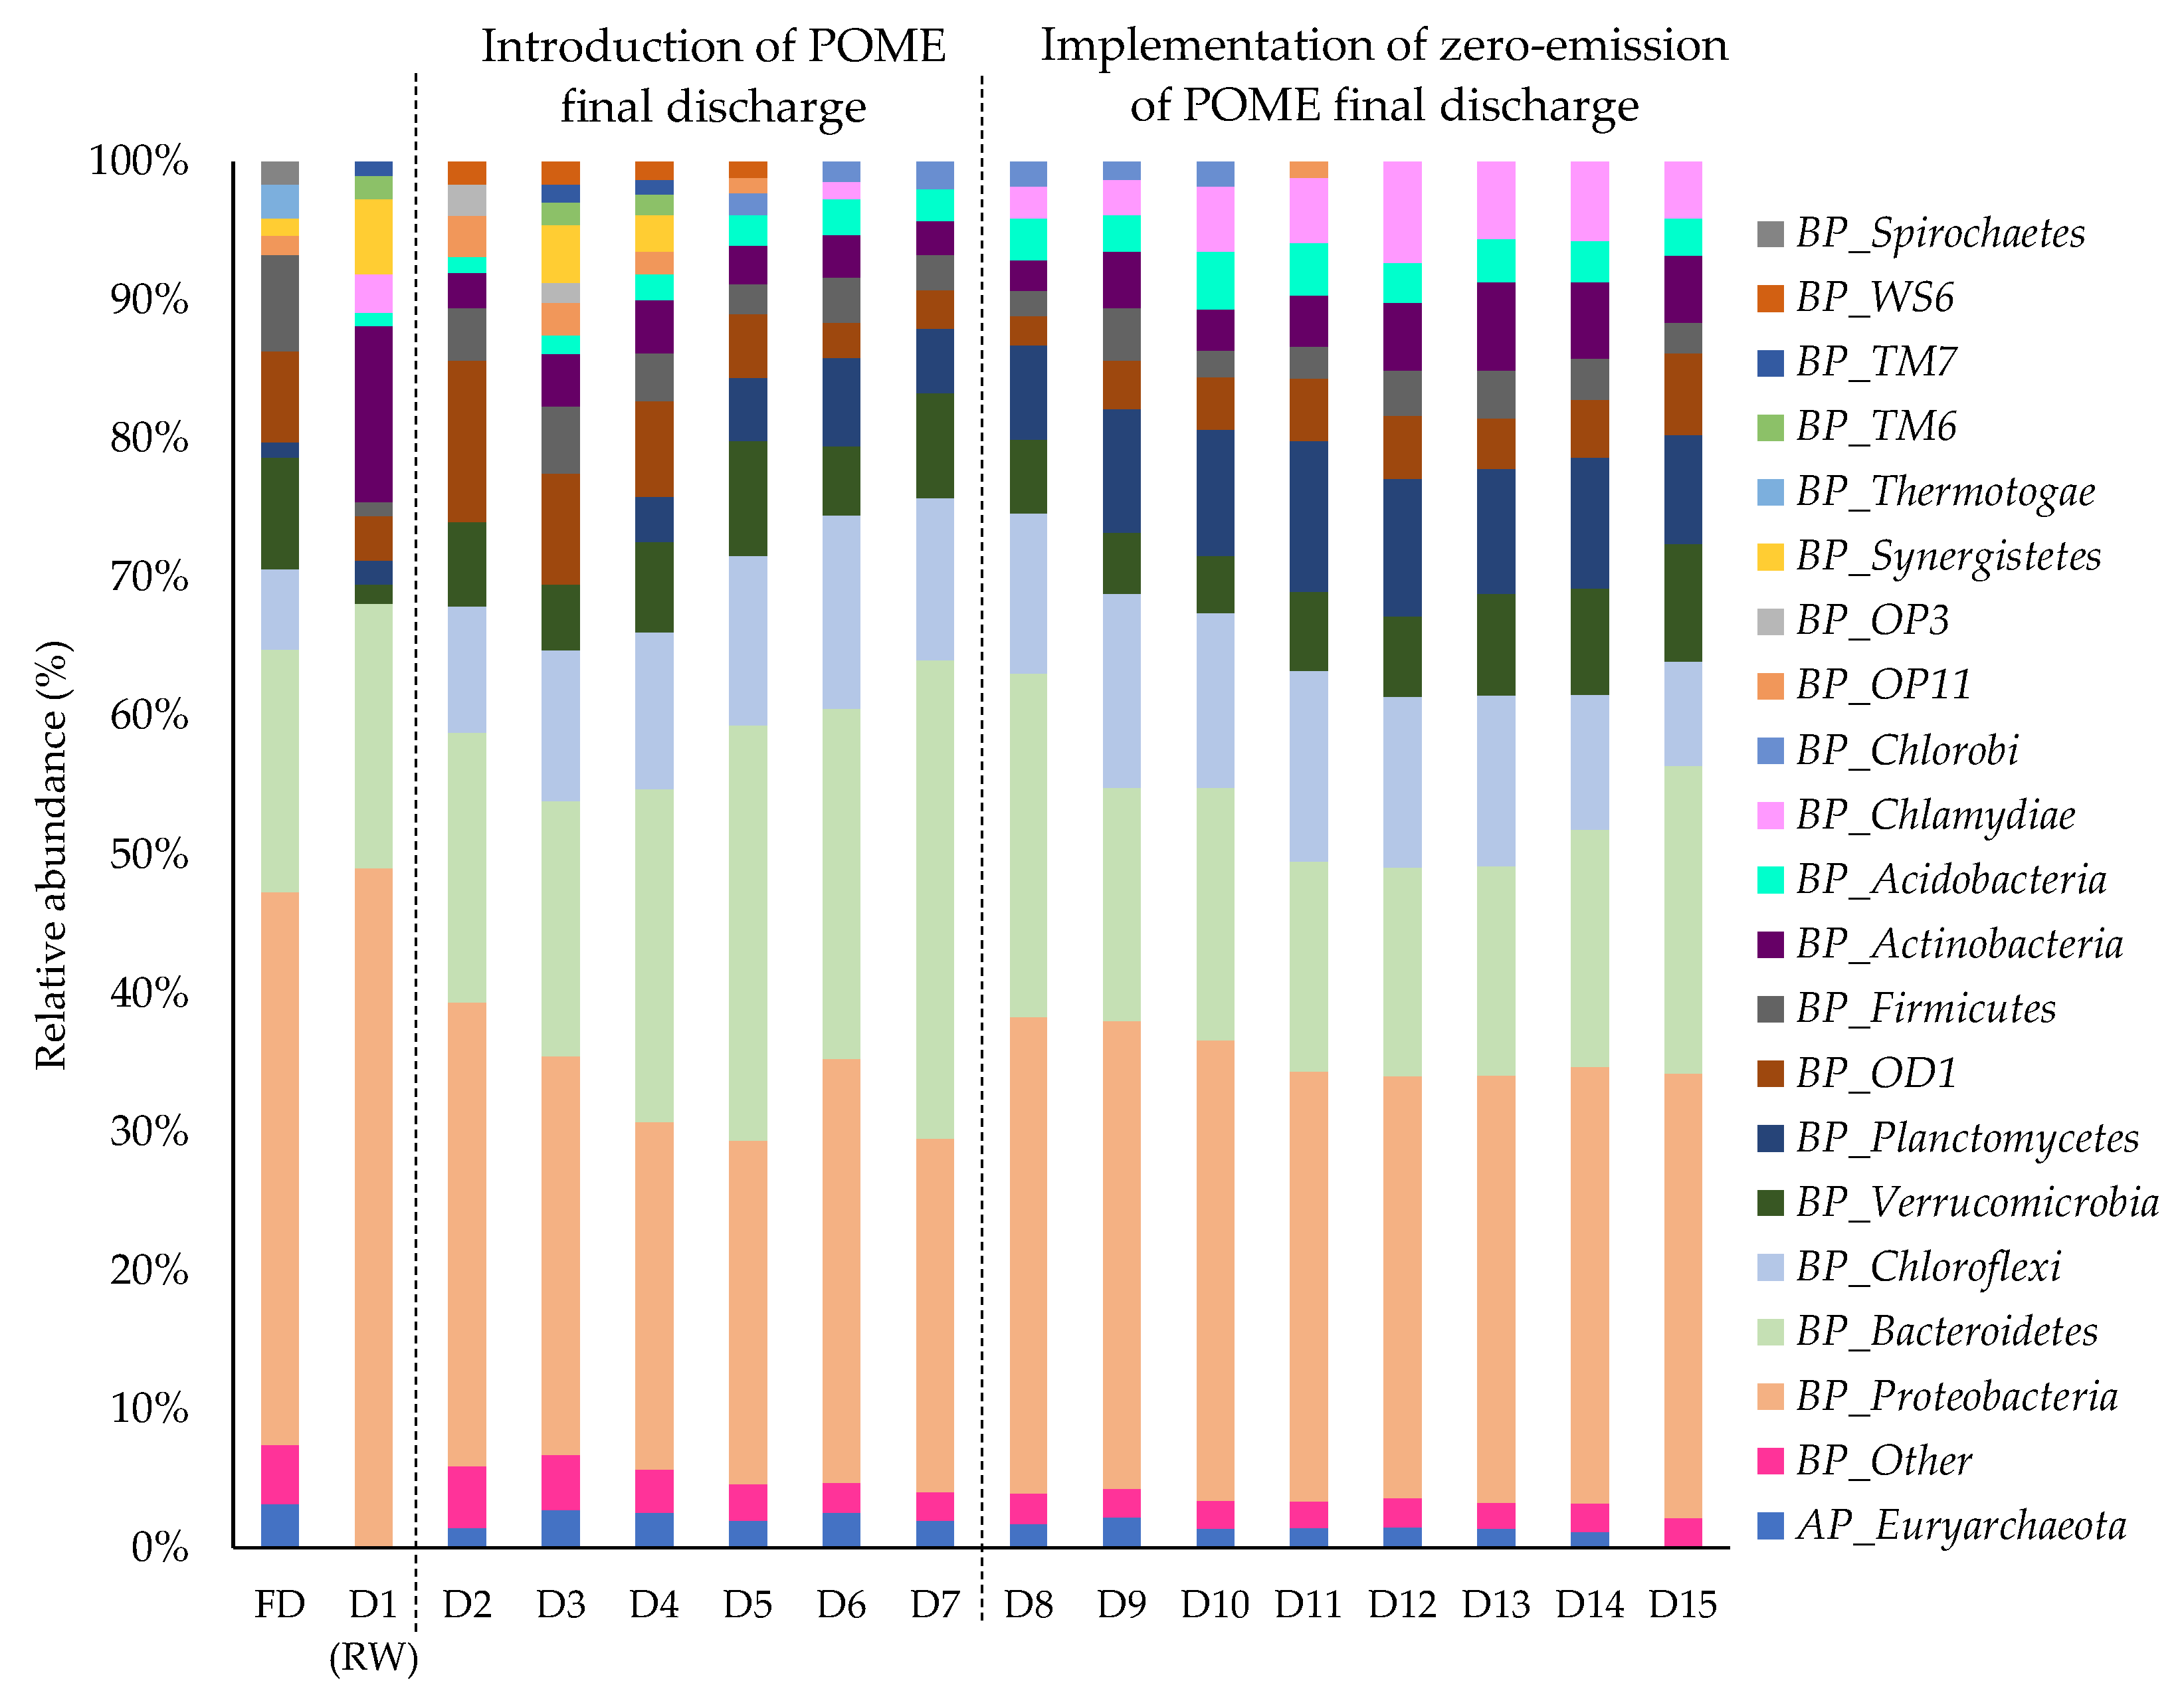
The changes in the taxonomic composition at the phylum level before and after the implementation of zero-emission of POME final discharge are summarized in Figure 5, after the relative abundances at below 1% were cut off. The rainwater and POME final discharge were dominated by Proteobacteria phylum with compositions of 52.5% and 35.8%, respectively, followed with Bacteroidetes with a respective composition of 20.4% in the rainwater and 15.8% in the POME final discharge. Proteobacteria are commonly known to have the ability to survive in a wide range of environmental conditions, either in a clean [39] or disturbed environment in the presence of pollutants [40]. In a previous study, Proteobacteria were found to be dominant in the rainwater despite different sampling times [41]. The predominance of Proteobacteria in the rainwater was also recorded despite the low availability of nutrients and the shift in temperature [42]. Bacteroidetes were also reported to be among the dominant phylum in the rainwater [43] which were able to survive with high and low nutrient contents [44]. Likewise, Proteobacteria were also recorded as the dominant bacterial community found in the POME final discharge [45]. The composition of Bacteroidetes was also noticeable in the POME final discharge as reported in the previous studies [46].
It was noted that the compositions of Proteobacteria and Bacteroidetes in the samples did not change much before and after the implementation of zero-emission of POME final discharge. Even so, the implementation of zero-emission of POME final discharge could restore the original community found in the clean water. This is based on the observation of Actinobacteria that were detected in the rainwater (13.6%) but not in the POME final discharge, but their composition was slightly higher once the rainwater was re-introduced into the system from day 10 onwards. Actinobacteria are some of the most abundant phyla that are usually affiliated with freshwater [47] and able to flourish in various freshwater habitats, including the rainwater [48]. They are known to play a key role in nutrient and energy cyclings as they contribute to glucose assimilation and heterotrophic nitrification in aquatic habitats [49] and are able to survive in environments with low levels of organic carbon [48].
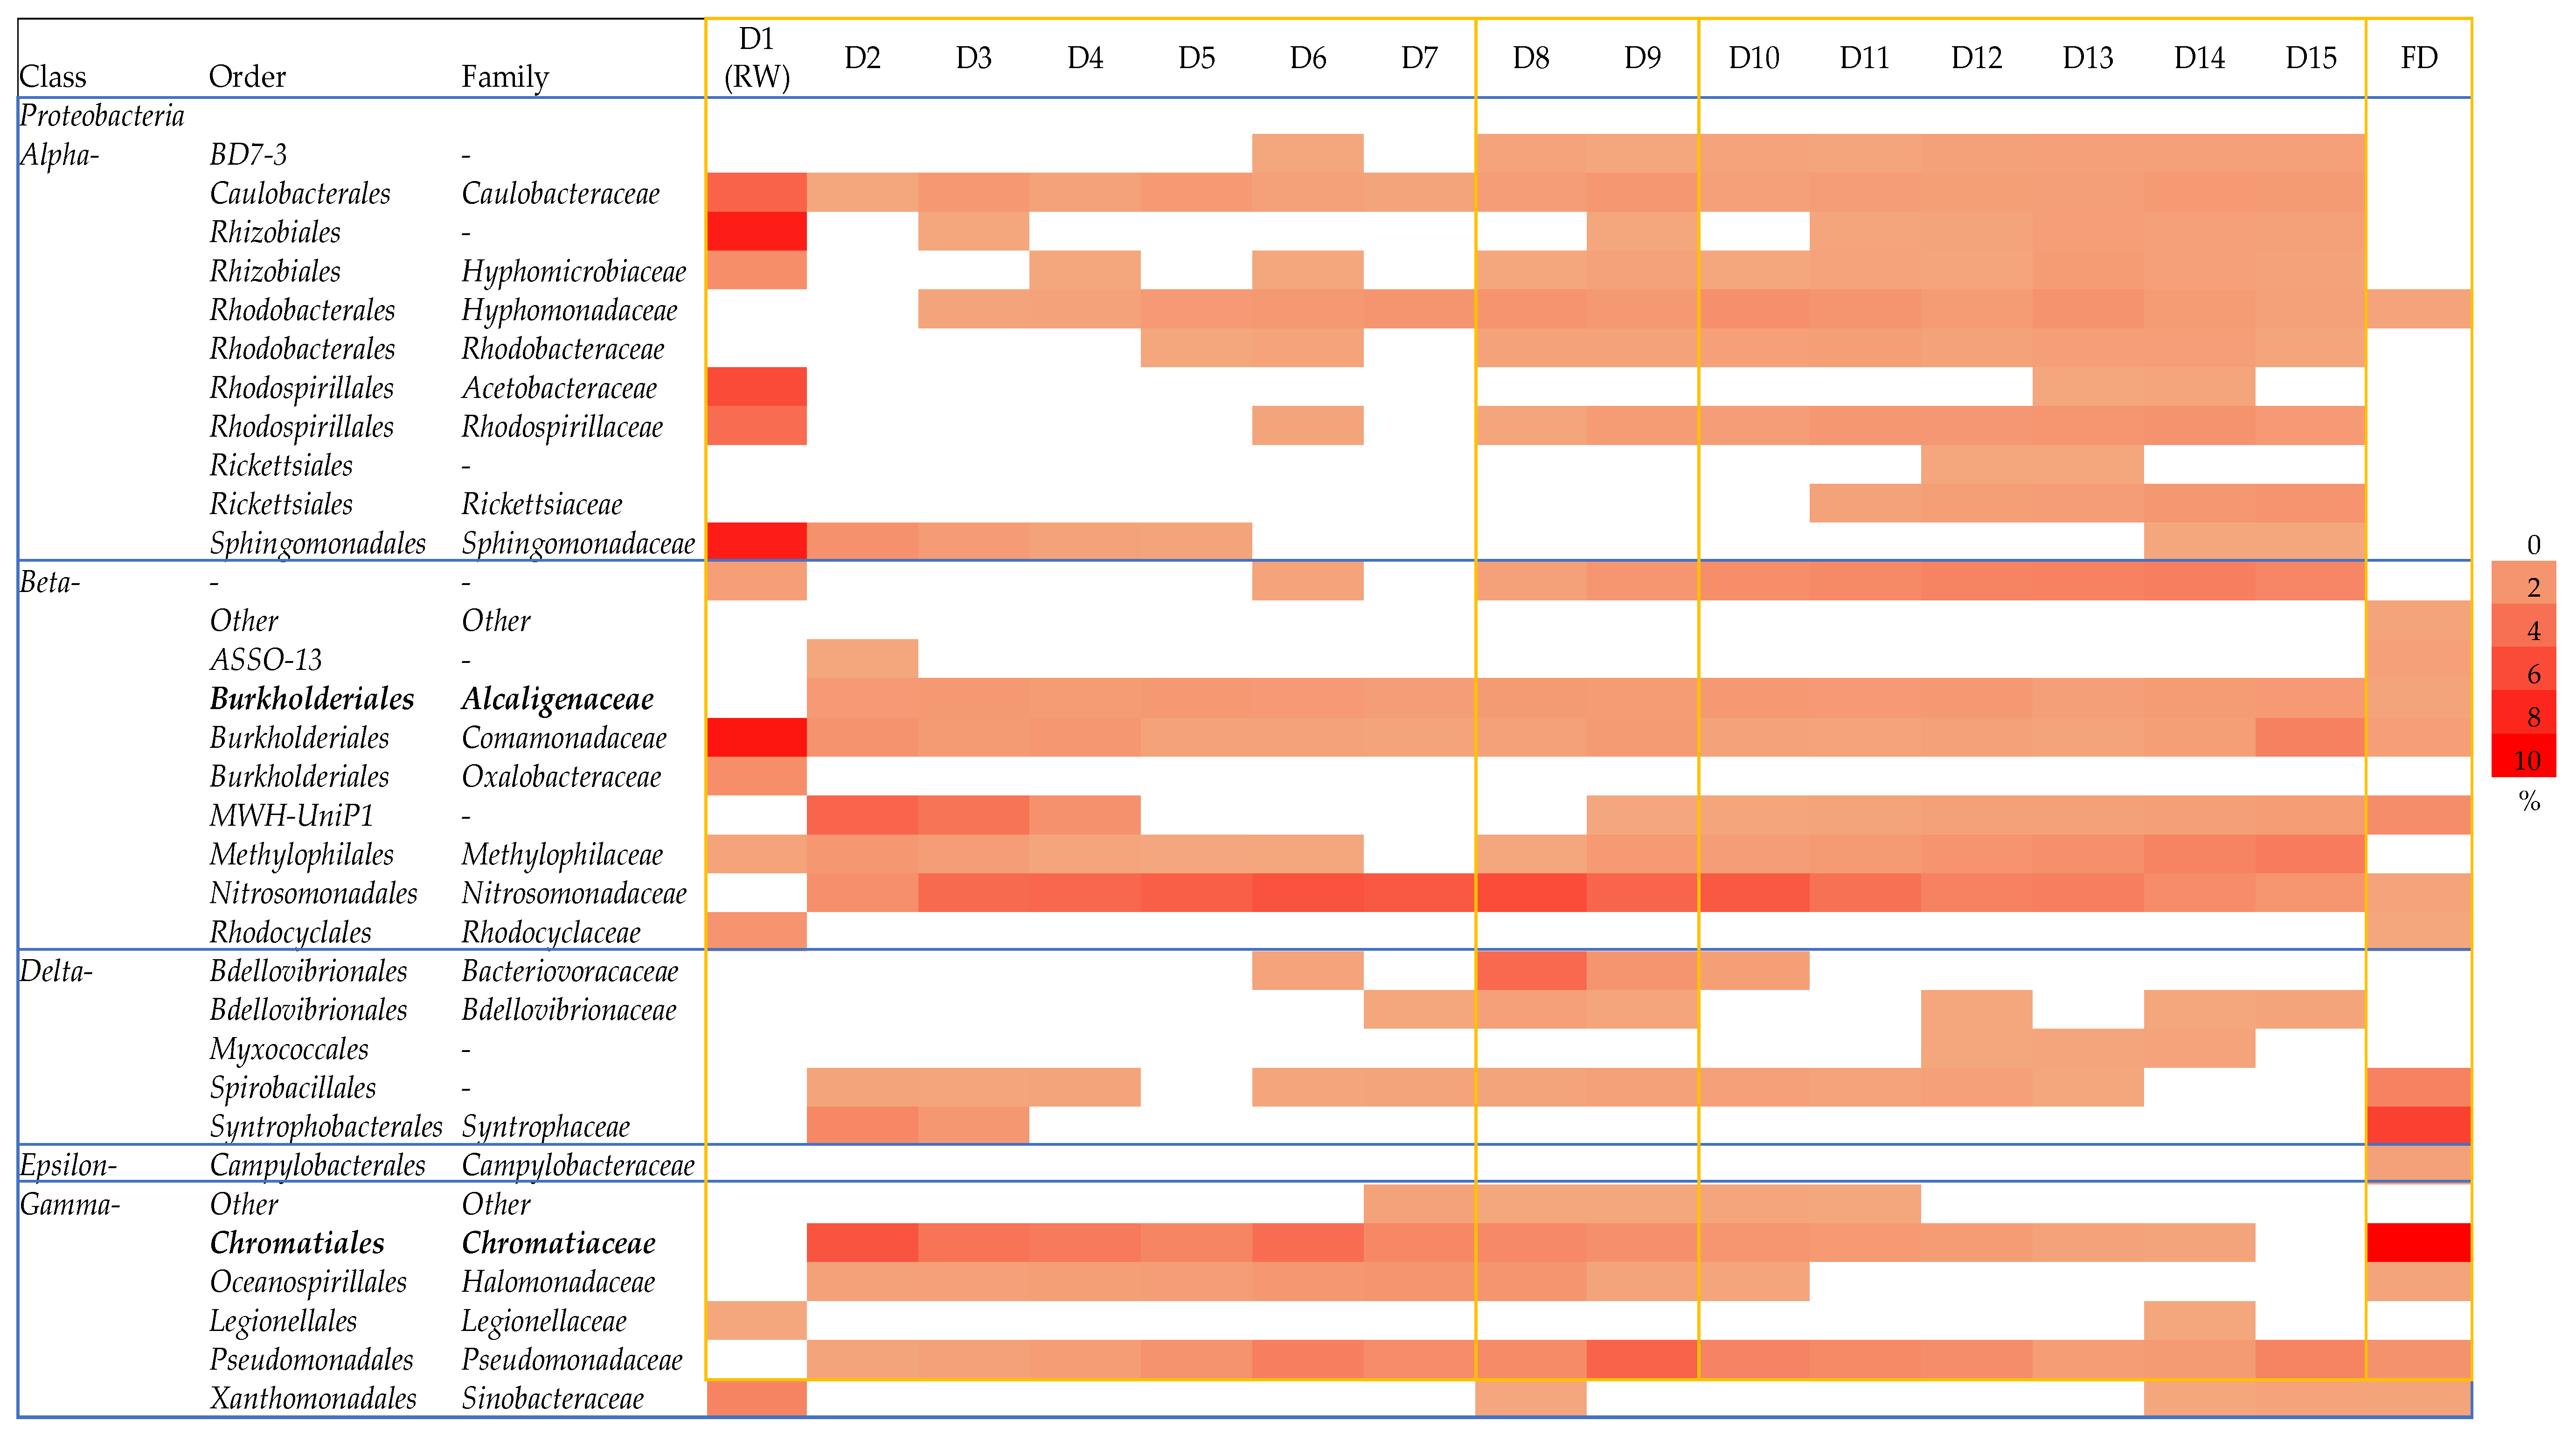
Since it was previously reported that the POME bacterial indicators, Alcaligenaceae and Chromatiaceae, from the Proteobacteria phylum originated from POME final discharge [13] and were not detected elsewhere including the clean river and other non-POME polluted rivers [15], both of them were used as representative bacteria to further analyze the implementation effect of the zero-emission system towards the composition of the bacterial community. A heatmap was constructed to further assess the shift in the bacterial community at the order and family levels within the Proteobacteria phylum before and after the implementation of zero-emission of POME final discharge, after cutting-off its relative abundance at ≤5% (Figure 6). In the rainwater sample, the most detected bacterial communities were dominated by the Alpha-proteobacteria, including Caulobacteraceae (4.3%), Hyphomicrobiaceae (1.9%), Rhodospirillaceae (3.8%), Acetobacteraceae (5.6%), and Sphingomonadaceae (8.1%), as well as the Comamonadaceae (8.5%) from the Beta-proteobacteria class. Except for Comamonadaceae, these bacteria were also found to be unique in the rainwater and were not detected in the POME final discharge. The Alpha-proteobacteria are normally found in the rainwater due to their ability to utilize recalcitrant organic compounds such as humic substances and to form segregation with each other [50]. Meanwhile, Beta-proteobacteria have the ability to withstand low nutrient content in the rainwater [51]. On the other hand, bacterial communities in POME final discharge were mostly from the Beta-, Delta- and Gamma-proteobacteria classes, which are dominated by the MWH-UniP1 (1.9%), Syntrophaceae (6.1%) and Chromatiaceae (9.6%) families, respectively.
Observations from the first part of the system where the POME final discharge was introduced from day 2 to day 7 show that the unique bacterial community found in the rainwater was compromised. For instance, Legionellaceae (0.5%) that were originally detected in the rainwater were not detected once the POME final discharge was introduced into the system. Legionellaceae were reportedly found in the rainwater reservoir [52] due to their capability to thrive in poor-environment habitats and their inability to survive in a complex nutrient-rich environment [53]. Legionellaceae were able to thrive in drinking water systems by forming biofilm and parasitizing other bacteria with this ability [54]. Despite the fact that Legionellaceae has the potential to cause pneumococcal disease in humans, the composition of Legionellaceae was not identified after the groundwater treatment for drinking purposes due to their inability to tolerate the changes in their surroundings [55].
Other than that, it was suggested that the Hyphomonadaceae (0.7%), Alcaligenaceae (0.7%), MWH-UniP1 (1.9%), Nitrosomonadaceae (0.7%), Spirobacillales (2.6%), Chromatiaceae (9.6%), Halomonadaceae (0.7%) and Pseudomonadaceae (1.7%) families were introduced into the system due to the addition of POME final discharge into the receiving water since they were not detected in the rainwater sample. The compositions of Spirobacillales and Halomonadaceae were reduced after the implementation of zero-emission of POME final discharge, and they were not detected after day 14 and day 11 onwards, respectively. Spirobacillales were found to be associated with the degradation of complex organic matters [56], while Halomonadaceae were mainly correlated with the biodegradation of nitrate content in wastewater, and they were found to be among the dominant bacterial family in wastewater contaminated with high nitrate content [57]. This result suggests that the reduction in the complex organic matter and nitrates (Figure 4c) in the receiving water following the implementation of zero-emission of POME final discharge reduced the compositions of some of the bacterial communities in the sample. Hence, it is clear thus far that the implementation of zero-emission of POME final discharge could reduce the carried over bacterial population introduced by this effluent in the receiving water.
It is worth discussing the presence of both bacterial indicators, Chromatiaceae and Alcaligenaceae, in the receiving water but not in the rainwater, where they were suggested to be carried over from the POME final discharge into the artificial river water system. The composition of the Chromatiaceae in the system introduced with POME final discharge increased starting from day 2 (2.2%) to day 7 (5.1%), then reduced after the implementation of zero-emission of POME final discharge on day 8 (2.2%) and became undetectable on day 15. This can be explained by the association of Chromatiaceae composition with the degradation of dissolved organic carbon (DOC) present in the POME [58]. On the other hand, the composition of Alcaligenaceae showed a small reduction from 1.2% on day 8 to 0.9% on day 15. Alcaligenaceae are known as the phenolic and aromatic compounds degraders [59]. Their growth was enhanced after the addition of POME final discharge [15] containing phenolic compounds from the palm oil fruit processing [60]. However, their presence was still detectable in the system at a low composition even after the implementation of zero-emission of POME final discharge, perhaps due to the remaining phenolic and aromatic compounds in the sample. The phenolic content could not be easily removed from the system since phenol also exists in the natural environment due to the presence of natural organic matter even in small amounts [61]. Hence, the phenolic and aromatic compounds may require a longer time to be removed entirely from the contaminated water [62].
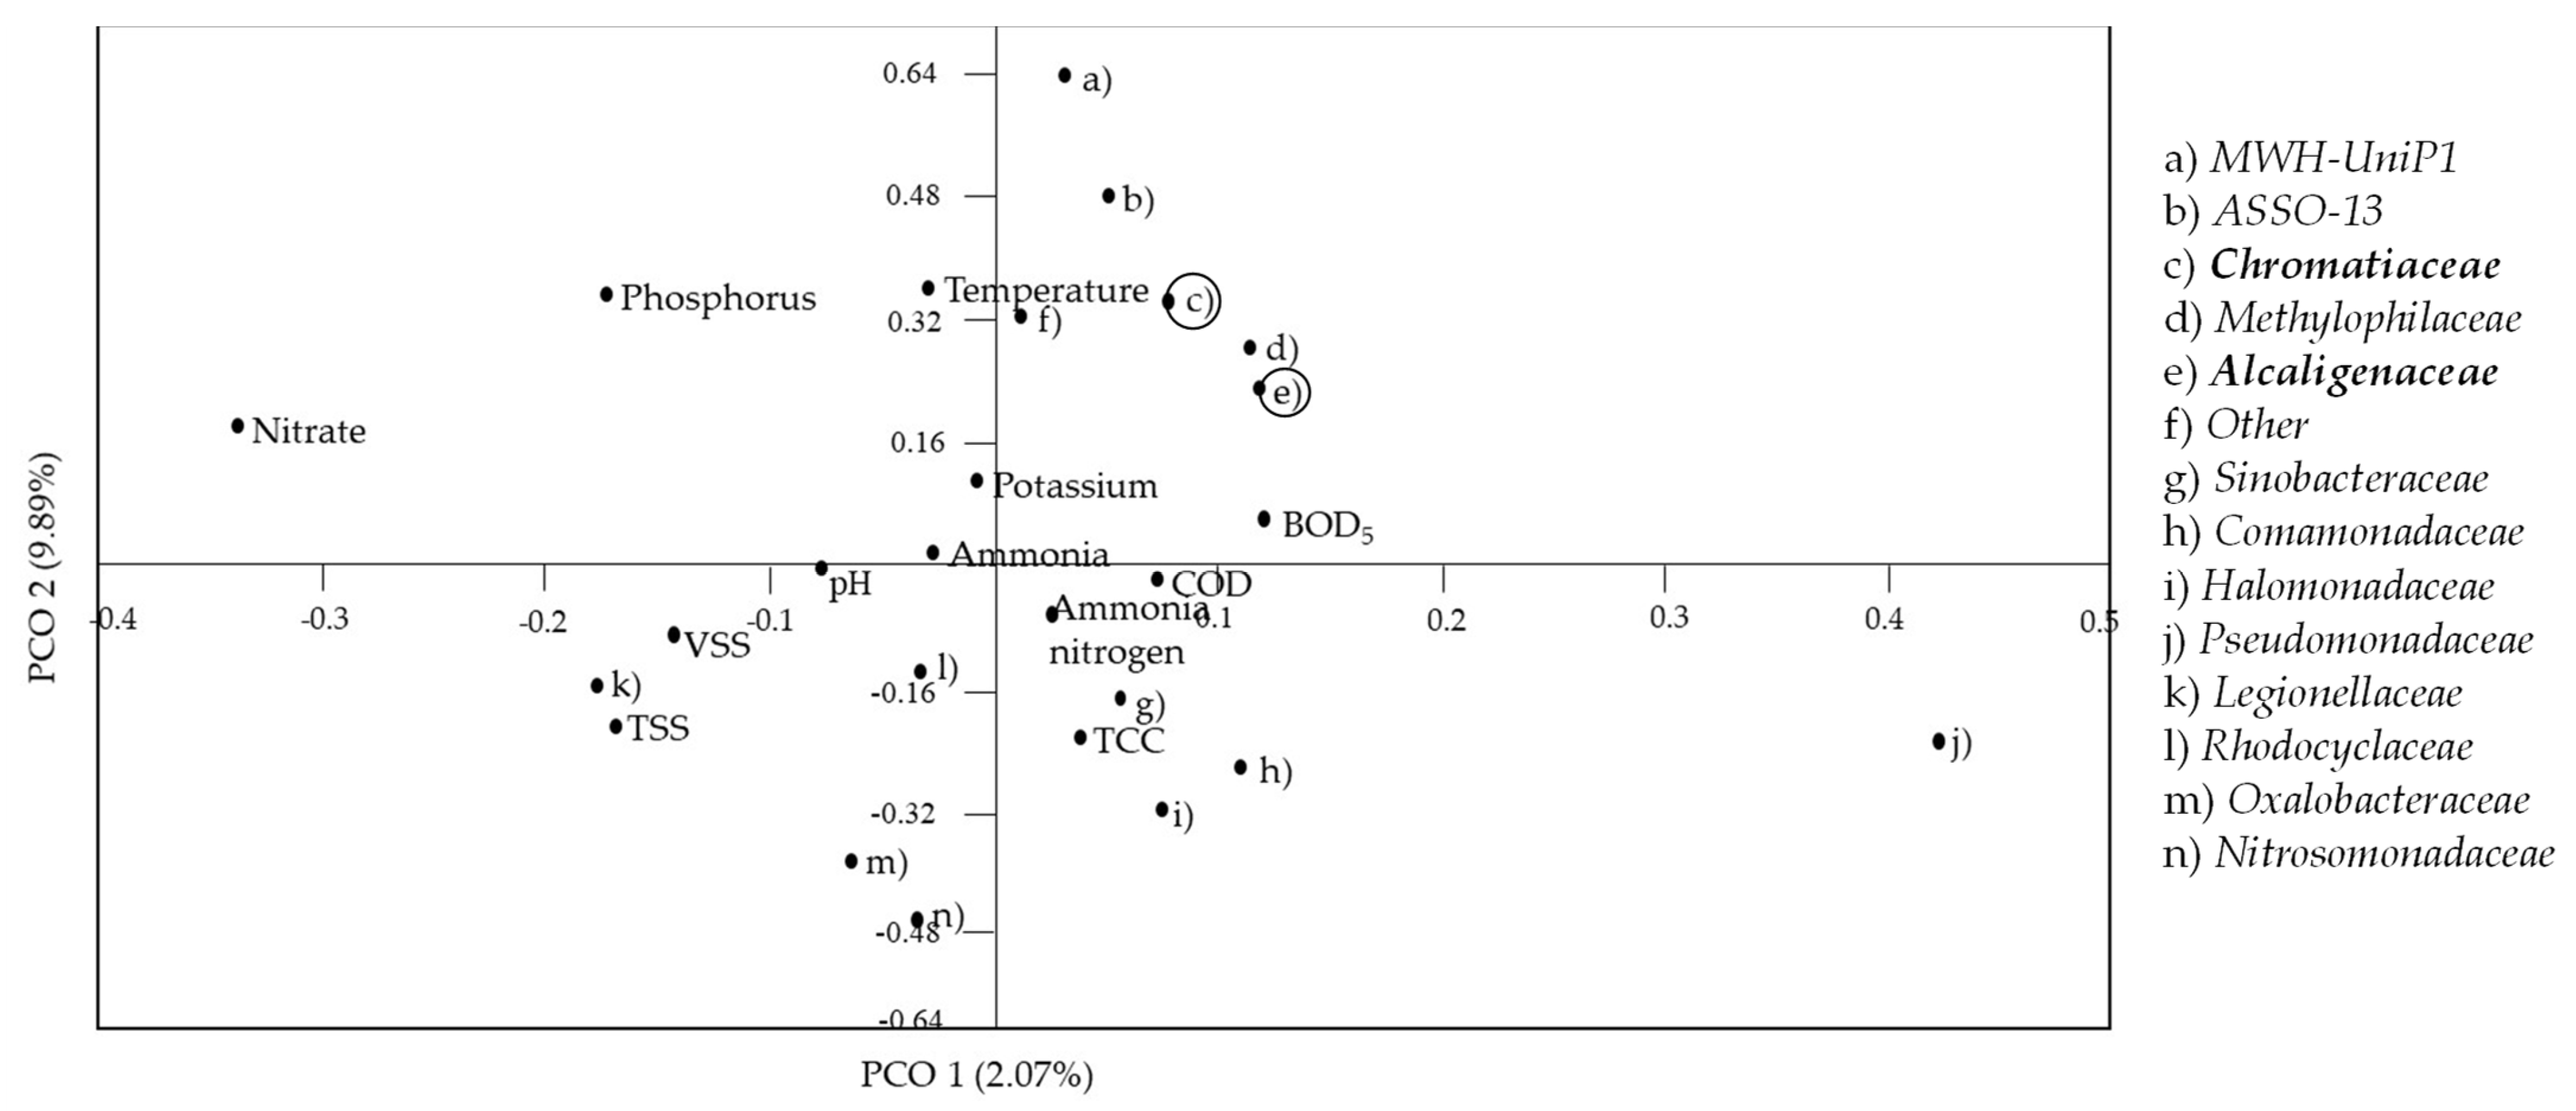
PCO analysis was then performed to correlate the Beta- and Gamma-proteobacteria to represent the Alcaligenaceae and Chromatiaceae, respectively, with the physicochemical properties, total cell concentration (TCC), and nutrient contents in the POME final discharge (Figure 7). Both Chromatiaceae and Alcaligenaceae showed no correlation with any of the nutrients present in the constructed artificial river water system. Price et al. [63] in their study on a river contaminated with wastewater from a treatment plant stated that nutrients such as ammonia, nitrate and phosphorus are less likely to be the main factors affecting the changes in the composition of the bacterial community. Interestingly, Chromatiaceae and Alcaligenaceae were shown to be positively correlated with the BOD5. Therefore, as the concentration of BOD5 reduced, the presence of both bacterial indicators could also be reduced. Hence, it is hypothesized that a prolonged implementation of zero-emission of POME final discharge could further reduce the BOD5 concentration along with the composition of Chromatiaceae and Alcaligenaceae until they became completely undetectable.

4. Conclusions

This study has revealed insights into the implementation effect of zero-emission of POME final discharge in relation to the changes in physicochemical properties and nutrients, as well as the shift in the recovery of the bacterial cell’s viability and composition in the receiving water bodies. With the positive correlation between BOD5 and some of the bacterial community, including the POME bacterial indicators, Alcaligenaceae and Chromatiaceae, it is suggested that the carried over bacteria from POME final discharge are likely to be recovered if the implementation of zero-emission system is prolonged until the BOD5 of river water reached clean status (1–3 mg/L) based on the classification by the National Water Quality Standards (NWQS). Even though it would be best to recreate the scenario at the potential palm oil mills for a better overview on how this technology would affect the bacterial community in the receiving water bodies, these current results provide interesting findings on the efficiency of the zero-emission technology in relation to the health of the ecosystem and the sustainability of the palm oil industry.

Author Contributions

Conceptualization, N.R.; methodology, N.S.L.M.-Z. and N.R.; software, N.A.M.; validation, N.S.L.M.-Z., N.Z. and N.R.; formal analysis, N.S.L.M.-Z., N.A.J. and N.Z.; investigation, N.S.L.M.-Z., N.A.J. and N.Z.; resources, N.S.L.M.-Z.; data curation, N.S.L.M.-Z.; writing—original draft preparation, N.S.L.M.-Z.; writing—review and editing, N.R., N.Z., N.A.M., M.A.H. and T.M.; visualization, N.S.L.M.-Z.; supervision, N.R., M.A.H. and T.M.; project administration, N.R.; funding acquisition, N.R. and M.A.H. All authors have read and agreed to the published version of the manuscript.

Funding

This research was funded by the Putra Grant (GP-IPS/2017/9534600), provided by Universiti Putra Malaysia (UPM). The authors also would like to thank The Society for Biotechnology, Japan for awarding a research grant (DaSilva Award 2020) to the corresponding author, Ramli. N. (Trust Account: 6380047-14201).

Acknowledgments

The authors gratefully acknowledge the financial assistance granted by the Graduate Research Fellowship (GRF), Universiti Putra Malaysia to the first author, Noor Shaidatul Lyana Mohamad-Zainal.

Conflicts of Interest

The authors declare no conflict of interest.

References

  1. Umana, U.S.; Ebong, M.S.; Godwin, E.O. Biomass production from oil palm and its value chain. J. Hum. Earth Future 2020, 1, 30–38. [Google Scholar]
  2. Ibrahim, I.; Hassan, M.A.; Abd-Aziz, S.; Shirai, Y.; Andou, Y.; Othman, M.R.; Mohd Ali, A.A.; Zakaria, M.R. Reduction of residual pollutants from biologically treated palm oil mill effluent final discharge by steam activated bioadsorbent from oil palm biomass. J. Clean. Prod. 2017, 141, 122–127. [Google Scholar] [CrossRef]
  3. Tabassum, S.; Zhang, Y.; Zhang, Z. An integrated method for palm oil mill effluent (POME) treatment for achieving zero liquid discharge—A pilot study. J. Clean. Prod. 2015, 95, 148–155. [Google Scholar] [CrossRef]
  4. Loh, S.K.; Lai, M.E.; Ngatiman, M.; Lim, W.S.; Choo, Y.M.; Zhang, Z.; Salimon, J. Zero discharge treatment technology of palm oil mill effluent. J. Oil Palm Res. 2013, 25, 273–281. [Google Scholar]
  5. Othman, M.R.; Hassan, M.A.; Shirai, Y.; Baharuddin, A.S.; Ali, A.A.M.; Idris, J. Treatment of effluents from palm oil mill process to achieve river water quality for reuse as recycled water in a zero-emission system. J. Clean. Prod. 2017, 67, 58–61. [Google Scholar] [CrossRef]
  6. Lam, M.K.; Lee, K.T. Renewable and sustainable bioenergies production from palm oil mill effluent (POME): Win–win strategies toward better environmental protection. Biotechnol. Adv. 2011, 29, 124–141. [Google Scholar] [CrossRef]
  7. Salihu, A.; Alam, M.Z. Palm oil mill effluent: A waste or a raw material? J. Appl. Sci. Res. 2012, 8, 466–473. [Google Scholar]
  8. Liew, W.L.; Kassim, M.A.; Muda, K.; Loh, S.K.; Affam, A.C. Conventional methods and emerging wastewater polishing technologies for palm oil mill effluent treatment: A review. J. Environ. Manag. 2015, 149, 222–235. [Google Scholar] [CrossRef] [Green Version]
  9. Tong, T.; Elimelech, M. The global rise of zero liquid discharge for wastewater management: Drivers, Technologies, and Future directions. Environ. Sci. Technol. 2016, 50, 6846–6855. [Google Scholar] [CrossRef]
  10. Wassen, M.J.; Barendregt, A.; Palczynski, A.; de Smidt, J.T.; de Mars, H. Hydro-ecological analysis of the Biebrza mire (Poland). Wetl. Ecol. Manag. 1992, 2, 119–134. [Google Scholar] [CrossRef]
  11. Quagraine, E.K.; Duncan, B.; Chi, M.; Lothian, A. 2 decades constructed wetland experience in treating municipal effluent for power plant cooling at the Shand Power Station, SaskPower Part III: Annual treatment performance on PO43- -P, TP, volatile and total suspended solids, inorganic constituents, and bacteria. J. Water Sustain. 2017, 7, 113. [Google Scholar] [CrossRef]
  12. Kandel, P.P.; Pasternak, Z.; Van Rijn, J.; Nahum, O.; Jurkevitch, E. Abundance, diversity and seasonal dynamics of predatory bacteria in aquaculture zero discharge systems. FEMS Microbiol. Ecol. 2014, 89, 149–161. [Google Scholar] [CrossRef] [PubMed] [Green Version]
  13. Sharuddin, S.S.; Ramli, N.; Hassan, M.A.; Mustapha, N.A.; Amran, A.; Mohd-Nor, D.; Sakai, K.; Tashiro, Y.; Shirai, Y.; Maeda, T. Bacterial community shift revealed Chromatiaceae and Alcaligenaceae as potential bioindicators in the receiving river due to palm oil mill effluent final discharge. Ecol. Indic. 2017, 82, 526–529. [Google Scholar] [CrossRef]
  14. Mohd-Nor, D.; Ramli, N.; Sharuddin, S.S.; Hassan, M.A.; Mustapha, N.A.; Amran, A.; Sakai, K.; Shirai, Y.; Maeda, T. Alcaligenaceae and Chromatiaceae as reliable bioindicators present in palm oil mill effluent final discharge treated by different biotreatment processes. Ecol. Indic. 2018, 95, 468–473. [Google Scholar] [CrossRef]
  15. Zolkefli, N.; Ramli, N.; Mohamad-Zainal, N.S.L.; Mustapha, N.A.; Yusoff, M.Z.M.; Hassan, M.A.; Maeda, T. Alcaligenaceae and Chromatiaceae as pollution bacterial bioindicators in palm oil mill effluent (POME) final discharge polluted rivers. Ecol. Indic. 2020, 111, 106048. [Google Scholar] [CrossRef]
  16. Boeije, G.M.; Schowanek, D.R.; Vanrolleghem, P.A. Incorporation of biofilm activity in river biodegradation modeling: A case study for linear alkylbenzene sulphonate (LAS). Water Res. 2000, 34, 1479–1486. [Google Scholar] [CrossRef]
  17. Hodoki, Y. Direct and indirect effects of solar ultraviolet radiation on attached bacteria and algae in lotic systems. Hydrobiologia 2005, 549, 259–266. [Google Scholar] [CrossRef]
  18. Amneera, W.A.; Najib, N.W.A.Z.; Mohd Yusof, S.R.; Ragunathan, S. Water quality index of Perlis River, Malaysia. Int. J. Civ. Environ. 2013, 13, 1–6. [Google Scholar]
  19. American Public Health Association. APHA: Standard Methods Examination of Water Wastewater, 21st ed.; American Public Health Association: Washington, DC, USA, 2005. [Google Scholar]
  20. Barbesti, S.; Citterio, S.; Labra, M.; Baroni, M.D.; Neri, M.G.; Sgorbati, S. Two and three-color fluorescence flow cytometric analysis of immunoidentified viable bacteria. Cytometry 2000, 40, 214–218. [Google Scholar] [CrossRef]
  21. Sharuddin, S.S.; Ramli, N.; Mohd-Nor, D.; Hassan, M.A.; Maeda, T.; Shirai, Y.; Sakai, K.; Tashiro, Y. Shift of low to high nucleic acid bacteria as a potential bioindicator for the screening of anthropogenic effects in a receiving river due to palm oil mill effluent final discharge. Ecol. Indic. 2018, 85, 79–84. [Google Scholar] [CrossRef]
  22. Foladori, P.; Laura, B.; Gianni, A.; Giuliano, Z. Effects of sonication on bacteria viability in wastewater treatment plants evaluated by flow cytometry-Fecal indicators, wastewater and activated sludge. Water Res. 2007, 41, 235–243. [Google Scholar] [CrossRef] [PubMed]
  23. Fang, C.; Ding, S.; Gai, S.; Xiao, R.; Wu, Y.; Geng, B.; Chu, W. Effect of oxoanions on oxidant decay, bromate and brominated disinfection by-product formation during chlorination in the presence of copper corrosion products. Water Res. 2019, 166, 115087. [Google Scholar] [CrossRef]
  24. Zainal, S.F.F.S.; Aziz, H.A. Potential of tin (IV) chloride for treatment in Alor Pongsu as stabilized landfill leachate. AIP Conf. Proc. 2017, 1892, 040003. [Google Scholar] [CrossRef]
  25. Klindworth, A.; Pruesse, E.; Schweer, T.; Peplies, J.; Quast, C.; Horn, M.; Glöckner, F.O. Evaluation of general 16S ribosomal RNA gene PCR primers for classical and next-generation sequencing-based diversity studies. Nucleic Acids Res. 2013, 41, e1. [Google Scholar] [CrossRef] [PubMed]
  26. Mustapha, N.A.; Hu, A.; Yu, C.P.; Sharuddin, S.S.; Ramli, N.; Shirai, Y.; Maeda, T. Seeking key microorganisms for enhancing methane production in anaerobic digestion of waste sewage sludge. Appl. Microbiol. Biotechnol. 2018, 102, 5323–5334. [Google Scholar] [CrossRef]
  27. Hildebrand, F.; Tadeo, R.; Voigt, A.Y.; Bork, P.; Raes, J. LotuS: An efficient and user-friendly OTU processing pipeline. Microbiome 2014, 2, 30. [Google Scholar] [CrossRef] [Green Version]
  28. Edgar, R.C. UPARSE: Highly accurate OTU sequences from microbial amplicon reads. Nat. Methods 2013, 10, 996–998. [Google Scholar] [CrossRef]
  29. Caporaso, J.G.; Kuczynski, J.; Stombaugh, J.; Bittinger, K.; Bushman, F.D.; Costello, E.K.; Fierer, N.; Pẽa, A.G.; Goodrich, J.K.; Gordon, J.I.; et al. QIIME allows analysis of high-throughput community sequencing data. Nat. Methods 2010, 7, 335. [Google Scholar] [CrossRef] [PubMed] [Green Version]
  30. DeSantis, T.Z.; Hugenholtz, P.; Larsen, N.; Rojas, M.; Brodie, E.L.; Keller, K.; Huber, T.; Dalevi, D.; Hu, P.; Andersen, G.L. Greengenes, a chimera-checked 16S rRNA gene database and workbench compatible with ARB. Appl. Environ. Microbiol. 2006, 72, 5069–5072. [Google Scholar] [CrossRef] [Green Version]
  31. Hammer, Ø.; Harper, D.A.T.; Ryan, P.D. Past: Paleontological statistics software package for education and data analysis. Palaeontol. Electron. 2001, 4, 9. [Google Scholar]
  32. Gower, J.C. Some distance properties of latent root and vector methods used in multivariate analysis. Biometrika 1996, 53, 325–338. [Google Scholar] [CrossRef]
  33. Hu, W.; Murata, K.; Toyonaga, S.; Zhang, D. Bacterial abundance and viability in rainwater associated with cyclones, stationary fronts and typhoons in southwestern Japan. Atmos. Environ. 2017, 167, 104–115. [Google Scholar] [CrossRef]
  34. Tamaki, V.; Mercier, H. Effects of different ammoniacal nitrogen sources on N-metabolism of the atmospheric bromeliad Tillandsia pohliana Mez. Rev. Bras. De Bot. 2016, 24, 407–413. [Google Scholar] [CrossRef] [Green Version]
  35. Lebaron, P.; Servais, P.; Agogué, H.; Courties, C.; Joux, F. Does the high nucleic acid content of individual bacterial cells allow us to discriminate between active cells and inactive cells in aquatic systems? Appl. Environ. Microbiol. 2001, 67, 1775–1782. [Google Scholar] [CrossRef] [Green Version]
  36. Liu, G.; Bakker, G.L.; Li, S.; Vreeburg, J.H.G.; Verberk, J.Q.J.C.; Medema, G.J.; Liu, W.T.; Van Dijk, J.C. Pyrosequencing reveals bacterial communities in unchlorinated drinking water distribution system: An integral study of bulk water, suspended solids, loose deposits, and pipe wall biofilm. Environ. Sci. Technol. 2014, 48, 5467–5476. [Google Scholar] [CrossRef] [PubMed]
  37. Yao, J.; Wen, D.; Shen, J.; and Wang, J. Zero discharge process for dyeing wastewater treatment. J. Water Process. Eng. 2016, 11, 98–103. [Google Scholar] [CrossRef]
  38. Das, S. Cleaning of the Ganga. J. Geol. Soc. India 2011, 78, 124–130. [Google Scholar] [CrossRef]
  39. Chidamba, L.; Korsten, L. Pyrosequencing analysis of roof-harvested rainwater and river water used for domestic purposes in Luthengele village in the Eastern Cape Province of South Africa. Environ. Monit. Assess. 2015, 187, 1–17. [Google Scholar] [CrossRef] [Green Version]
  40. Salam, M.; Varma, A. Bacterial community structure in soils contaminated with electronic waste pollutants from Delhi NCR, India. Electron. J. Biotechnol. 2019, 41, 72–80. [Google Scholar] [CrossRef]
  41. Cho, B.C.; Jang, G.I. Active and diverse rainwater bacteria collected at an inland site in spring and summer 2011. Atmos. Environ. 2014, 94, 409–416. [Google Scholar] [CrossRef]
  42. Psenner, R.; Alfreider, A.; Schwarz, A. Aquatic microbial ecology: Water desert, microcosm, ecosystem. What’s next? Int. Rev. Hydrobiol. 2008, 93, 606–623. [Google Scholar] [CrossRef]
  43. Hu, W.; Niu, H.; Murata, K.; Wu, Z.; Hu, M.; Kojima, T.; Zhang, D. Bacteria in atmospheric waters: Detection, characteristics and implications. Atmos. Environ. 2018, 179, 201–221. [Google Scholar] [CrossRef]
  44. Hiraoka, S.; Miyahara, M.; Fujii, K.; Machiyama, A.; Iwasaki, W. Seasonal analysis of microbial communities in precipitation in the greater Tokyo area, Japan. Front. Microbiol. 2017, 8, 1506. [Google Scholar] [CrossRef] [PubMed] [Green Version]
  45. Abu Bakar, S.N.H.; Abu Hasan, H.; Mohammad, A.W.; Abdullah, S.R.S.; Ngteni, R.; Yusof, K.M.M. Performance of a laboratory-scale moving bed biofilm reactor (MBBR) and its microbial diversity in palm oil mill effluent (POME) treatment. Process. Saf. Environ. Prot. 2020, 142, 325–335. [Google Scholar] [CrossRef]
  46. Mohd Udaiyappan, A.F.; Hasan, H.A.; Takriff, M.S.; Abdullah, S.R.S.; Maeda, T.; Mustapha, N.A.; Mohd Yasin, N.; Nazashida Mohd Hakimi, N.I. Microalgae-bacteria interaction in palm oil mill effluent treatment. J. Water Process. Eng. 2020, 35, 101203. [Google Scholar] [CrossRef]
  47. Šimek, K.; Horňák, K.; Jezbera, J.; Mašín, M.; Nedoma, J.; Gasol, J.M.; Schauer, M. Influence of top-down and bottom-up manipulations on the R-BT065 subcluster of β-proteobacteria, an abundant group in bacterioplankton of a freshwater reservoir. Appl. Environ. Microbiol. 2005, 71, 2381–2390. [Google Scholar] [CrossRef] [PubMed] [Green Version]
  48. Lemke, M.J.; Lienau, E.K.; Rothe, J.; Pagioro, T.A.; Rosenfeld, J.; Desalle, R. Description of freshwater bacterial assemblages from the upper Paraná river floodpulse system, Brazil. Microb. Ecol. 2009, 57, 94–103. [Google Scholar] [CrossRef]
  49. Elifantz, H.; Malmstrom, R.R.; Cottrell, M.T.; Kirchman, D.L. Assimilation of polysaccharides and glucose by major bacterial groups in the Delaware Estuary. Appl. Environ. Microbiol. 2005, 71, 7799–7805. [Google Scholar] [CrossRef] [Green Version]
  50. Newton, R.J.; Jones, S.E.; Eiler, A.; McMahon, K.D.; Bertilsson, S. A Guide to the natural history of freshwater lake bacteria. Microbiol. Mol. Biol. Res. 2011, 75, 14–49. [Google Scholar] [CrossRef] [Green Version]
  51. Amato, P.; Joly, M.; Besaury, L.; Oudart, A.; Taib, N.; Moné, A.I.; Deguillaume, L.; Delort, A.M.; Debroas, D. Active microorganisms thrive among extremely diverse communities in cloud water. PLoS ONE 2017, 12, e0182869. [Google Scholar] [CrossRef] [Green Version]
  52. Potočnjak, M.; Široka, M.; Rebić, D.; Gobin, I. The survival of Legionella in rainwater. Int. J. Sanit. Eng. Res. 2012, 6, 31–36. [Google Scholar]
  53. Caicedo, C.; Rosenwinkel, K.H.; Exner, M.; Verstraete, W.; Suchenwirth, R.; Hartemann, P.; Nogueira, R. Legionella occurrence in municipal and industrial wastewater treatment plants and risks of reclaimed wastewater reuse. Water Res. 2019, 149, 21–34. [Google Scholar] [CrossRef]
  54. Steinert, M.; Hentschel, U.; Hacker, J. Legionella pneumophila: An aquatic microbe goes astray. FEMS Microbiol. Rev. 2002, 26, 149–162. [Google Scholar] [CrossRef] [PubMed]
  55. Karwautz, C.; Lueders, T. Impact of hydraulic well restoration on native bacterial communities in drinking water wells. Microbes Environ. 2014, 29, 363–369. [Google Scholar] [CrossRef] [Green Version]
  56. Webster, T.M.; Fierer, N. Microbial dynamics of biosand filters and contributions of the microbial food web to effective treatment of wastewater-impacted water sources. Appl. Environ. Microbiol. 2019, 85, e01142-19. [Google Scholar] [CrossRef] [PubMed] [Green Version]
  57. Liao, R.; Shen, K.; Li, A.M.; Shi, P.; Li, Y.; Shi, Q.; Wang, Z. High-nitrate wastewater treatment in an expanded granular sludge bed reactor and microbial diversity using 454 pyrosequencing analysis. Bioresour. Technol. 2013, 134, 190–197. [Google Scholar] [CrossRef]
  58. Ahmad, M.N.; Ali, S.R.A.; Hassan, M.A. Microbial succession in co-composting of chipped-ground oil palm frond and palm oil mill effluent. J. Oil Palm Res. 2016, 28, 191–197. [Google Scholar] [CrossRef] [Green Version]
  59. Felföldi, T.; Székely, A.J.; Gorál, R.; Barkács, K.; Scheirich, G.; András, J.; Rácz, A.; Márialigeti, K. Polyphasic bacterial community analysis of an aerobic activated sludge removing phenols and thiocyanate from coke plant effluent. Bioresour. Technol. 2010, 101, 3406–3414. [Google Scholar] [CrossRef]
  60. Tsouko, E.; Alexandri, M.; Fernandes, K.V.; Freire, D.M.G.; Mallouchos, A.; Koutinas, A.A. Extraction of phenolic compounds from palm oil processing residues and their application as antioxidants. Food Technol. Biotechnol. 2019, 57, 29. [Google Scholar] [CrossRef] [PubMed] [Green Version]
  61. Anku, W.W.; Mamo, M.A.; Govender, P.P. Phenolic Compounds in Water: Sources, Reactivity, Toxicity and Treatment Methods; InTech Open: London, UK, 2017; pp. 419–443. [Google Scholar] [CrossRef] [Green Version]
  62. Benner, R.; Kaiser, K. Biological and photochemical transformations of amino acids and lignin phenols in riverine dissolved organic matter. Biogeochemistry 2011, 102, 209–222. [Google Scholar] [CrossRef]
  63. Price, J.R.; Ledford, S.H.; Ryan, M.O.; Toran, L.; Sales, C.M. Wastewater treatment plant effluent introduces recoverable shifts in microbial community composition in receiving streams. Sci. Total. Environ. 2018, 613–614, 1104–1116. [Google Scholar] [CrossRef] [PubMed]
Figure 1. Flow diagram of the zero-emission system for palm oil mill effluent (POME) treatment [3,4].
Applsci 11 10814 g001
Figure 2. Schematic diagram of the built artificial river water system.
Applsci 11 10814 g002
Figure 3. Shifts in the contents of (a) viable and dead and (b) high nucleic acid, HNA, and low nucleic acid, LNA in the bacterial cells calculated to a scale of 100 in the water samples collected daily from the constructed artificial river water system. Days 2–7: introduction of POME final discharge; days 8–15: implementation of zero-emission of POME final discharge. Notes: FD-POME final discharge; RW-Rainwater; 1–15-River water system running days.
Applsci 11 10814 g003
Figure 4. The daily measured (a) biological oxygen demand (BOD5), (b) potassium content, (c) ammonia nitrogen, ammonia, and nitrate contents, (d) total suspended solids (TSS), (e) volatile suspended solids (VSS), (f) chemical oxygen demand (COD) of water samples in the constructed artificial river water system during the introduction of POME final discharge (I) and after the implementation of zero-emission of POME final discharge (II) from day 1 to day 15. Notes: The error bars represent the standard error of triplicate experiment; FD: POME final discharge, RW: Rainwater.
Applsci 11 10814 g004
Figure 5. Relative abundance of the bacterial phyla before and after the implementation of zero-emission of POME final discharge. Rainwater was first introduced as a control on day 1, followed with the addition of POME final discharge from day 2 to day 7. The addition of POME final discharge was stopped and the rainwater was reintroduced into the system from day 8 to day 15 to mimic the zero-emission concept. Notes: AP-archaeal phylum; BP-bacterial phylum; FD-final discharge; RW-rainwater.
Applsci 11 10814 g005
Figure 6. Heatmap of the relative abundance of bacterial orders and families within the Proteobacteria phylum at the relative abundance cut-off of 0.5%. Rainwater was first introduced as a control on day 1, followed by the addition of POME final discharge from day 2 until day 7. The addition of POME final discharge was stopped and the rainwater was reintroduced into the system from day 8 until day 15 to mimic the zero-emission concept. Notes: FD—final discharge; RW—rainwater; D—day.
Applsci 11 10814 g006
Figure 7. Principal coordinate (PCO) analysis to show the correlation between Beta- and Gamma-proteobacteria, physicochemical properties, nutrient contents, and total cell concentration (TCC) of bacteria throughout the 15 days of running the artificial river water system.
Applsci 11 10814 g007
Publisher’s Note: MDPI stays neutral with regard to jurisdictional claims in published maps and institutional affiliations.