Article

Iterative Methods for the Biomechanical Evaluation of Corneal Response. A Case Study in the Measurement Phase

1
Doctorate Program in Industrial Technologies, International School of Doctorate, Technical University of Cartagena, 30202 Cartagena, Spain
2
Group of Optics and Visual Perception, Department of Optics, Pharmacology and Anatomy, University of Alicante, 03690 Alicante, Spain
3
ICA, Université de Toulouse, UPS, INSA, ISAE-SUPAERO, MINES-ALBI, CNRS, 3 rue Caroline Aigle, 31400 Toulouse, France
4
Department of Research and Development, VISSUM, 03016 Alicante, Spain
5
Division of Ophthalmology, Department of Pathology and Surgery, Faculty of Medicine, Miguel Hernández University, 03202 Alicante, Spain
6
Department of Structures, Construction and Graphical Expression, Technical University of Cartagena, 30202 Cartagena, Spain
*
Author to whom correspondence should be addressed.
Appl. Sci. 2021, 11(22), 10819; https://doi.org/10.3390/app112210819
Submission received: 30 September 2021 / Revised: 31 October 2021 / Accepted: 5 November 2021 / Published: 16 November 2021
(This article belongs to the Special Issue New Trends in Design Engineering)

Abstract

:
The number of corneal surgeries steadily grew in recent years and boosted the development of corneal biomechanical models. These models can contribute to simulating surgery by reducing associated risks and the need for secondary interventions due to ectasias or other problems related to correcting other diseases. Biomechanical models are based on the geometry obtained with corneal topography, which is affected by intraocular pressure and material properties. Knowledge of stress distribution in the measurement phase is a key factor for improving the accuracy of in silico mechanical models. In this work, the results obtained by two different methods: prestress method and displacements method were compared to evaluate the stress and strain distribution in a general geometric model based on the Navarro eye geometry and two real corneal geometries. The results show that both methods are equivalent for the achievement of the stress distribution in the measurement phase. Stress distribution over the corneal geometry in the measurement phase is a key factor for accurate biomechanical simulations, and these simulations could help to develop patient-specific models and reduce the number of secondary interventions in clinical practice.

1. Introduction

In recent years, several efforts were made to study new mechanical models to analyze biological soft tissues [1]. These materials display nonlinear behavior, where the mechanical response depends on time and the previous load state. The diversity of biological soft tissues and the complexity of their structure, made up of several layers and material properties, make mechanical model development difficult.
The need for in silico mechanical models for simulating surgical procedures boosted the development of biological mechanical properties and the study of multiple biological materials, such as muscles [2,3,4,5], tendons [6], brain [7,8], skin [9,10], arteries and veins [11,12,13], and eye tissues [14,15]. In all cases, material properties are obtained from adjusting experimental data, where time dependence is evaluated by tests run at different strain rates [16].
Of all human tissues, the cornea is the only avascular tissue, and several investigations were carried out due to the number of clinical applications that include refractive surgery corrections, intracorneal rings, evaluation of keratoconus progression analyses, and cross-linking treatment optimization [17]. The in vivo corneal biomechanics study is currently based on biomechanical parameters evaluated from the results of noncontact tonometers [18].
The human cornea protects the eye from external agents, and it is a unique tissue due to its transparency and strength properties. The cornea has an aspherical shape and is usually represented by means of a biconical surface [19]. It is composed of several layers, where the stroma is the main structural layer with near 90% of total thickness [20]. The stroma is based on 200–400 lamellar layers with collagen fibers embedded in an extracellular matrix, these fibers run parallel in each lamella, but at different angles between them.
Lamellar thickness varies across corneal thickness. Lamellae are twice as thick in the posterior zone compared to anterior ones [21], and shear stiffness is in 3-fold greater in the anterior zone due to the percentage of interweaving among lamellae.
Both orientation and distribution were quantified by X-ray techniques [22]. According to the obtained results, collagen fibers are distributed mainly in the nasal-temporal and superior-inferior directions in the central cornea area and circumferentially in the limbus [23]. Daxer, A. and Fratzl, P. [24] estimated that two thirds of fibrils lie in the sectors contained at ±45° around the horizontal and vertical meridians. This distribution can be observed in the central 7 mm zone. According to secondary harmonic generation images, a clear 3D arrangement distribution appears and allows analyzing the mechanical influence of collagen fibers with thickness [25].
Collagen net damage causes loss of stiffness and a change in corneal curvature, which results in the corneal bulging and its local thinning, whose origin is natural or physical. This disease is known as keratoconus. Recent studies [26] established that the deterioration of the transversal bonds between fibers could be the reason for this weakening due to loss of fiber orientation in lamellae. When the origin is due to corrective vision surgery, it is called postsurgical ectasia, and, despite advances, the incidence of the unpredictability of surgical outcomes remains close to 2.8% [27].
The improvement of the surgery success percentage is associated with the development of patient-specific models, for which considerable efforts were made [28]. The development of patient-specific models starts with the topographic corneal measurement and mechanical modelling improvement [21], which strongly depends on the employed material model and materials’ properties.
The material properties of the cornea can be evaluated by mechanical tests [17]. Although the material shows a viscous component, the elastic component dominates total behavior, and the material is usually modeled as an anisotropic hyperelastic material [21], with a behavior explained by a volumetric and an isochoric component. Corneal tissue is especially deformable, and tissue can be treated as quasi-incompressible material due to its high-water content [29].
Mechanical behavior depends on geometry, intraocular pressure (IOP), and materials’ properties, and the mutual influence of these parameters makes their estimation difficult. Geometry is also affected by the stress state distribution in the measurement phase [15]. Our research team developed specific patient geometric models that allow characterizing the geometric imbalances derived from the distribution of tensions characterizing corneal morphology during the progression of the disease [30,31,32,33]. However, the calculation of stress distribution in the measurement phase is a key factor for improving the accuracy of mechanical corneal models.
The stress distribution in the measurement phase can be calculated following an iterative process based on the prestress level established with a modified updated Lagrangian formulation [34]. The calculated stress distribution in the measurement phase is in equilibrium with the intraocular pressure, and the maximum displacement obtained, when both are applied over the cornea model, is lower than a tolerance previously defined. The free stress configuration can be obtained by an inverse method if only the stress distribution in the measurement phase is considered.
The stress distribution can also be calculated using a simplified displacement method, like that described by Pandolfi, A. and Holzapfel, G.A. [35]. In this method, stress free geometry is assumed, and the geometry obtained when IOP is applied is compared with the corneal topography. If the observed differences are smaller than a previously defined tolerance, the proposed geometry is accepted as the free stress geometry, otherwise a new free stress configuration is proposed based on the correction of the previous one. The stress distribution in the measurement phase is obtained with the proposed free stress geometry and the application of the measured IOP.
Therefore, knowledge of the stress distribution in the measurement phase must be correctly evaluated to better assess the stress distribution over the cornea because the development of accurate patient mechanical models can contribute to improving the accuracy of the corneal refractive surgery procedures. In the current study, a comparison of the results obtained by the two main methods presented for the preliminary stress calculation was made on a theoretical geometry and on two real corneal geometries with different degrees of disease severity.

2. Materials and Methods

The material model, procedures and main hypothesis carried out for the mechanical analysis of the cornea are presented in the points that follow.

2.1. Material Definition

In short-term deformation cycles, material can be treated as an anisotropic hyperelastic model with no viscous loss. The characterization of reversible materials in an isothermal process, with no energy dissipation, is evaluated according to the continuum mechanics with a strain density function.
Considering a Cartesian system represented by an orthonormal basis, the position of a material point in the initial and deformed configuration can be denoted respectively by the vectors X and x . The material deformation gradient is expressed with the two points tensor F = x X where the determinant of this tensor, expressed as J = d e t ( F ) , considers the volumetric changes of the initial volume. For incompressible materials, J = 1 .
The deformation gradient can be expressed as F = J 1 3   F ¯ , where   J 1 3 represent the volumetric deformation and F ¯ the deviatoric deformation. The Right Cauchy Green deformation tensor C = F T F can be expressed by the tensorial product of the transpose of F , denoted as F T , and F and the modified Right Cauchy Green tensor can be expressed as C ¯ = F ¯ T F ¯ considering the deviatoric deformation tensor and its transpose.
Strain energy density was divided into a volumetric, depending on the Jacobian determinant J and isochoric component according to Lanchares, E. et al. [34], as can be observed in Equation (1).
The isochoric component was divided into an isotropic and anisotropic component. The isotropic component depends on the modified Right Cauchy Green tensor C ¯ , that considers randomly distributed fibers and the extracellular matrix. The anisotropic term, considers the structural tensors   M = m 0 m 0     N = n 0 n 0 taking into account the fibers’ preferential orientation, defined by the vectors m 0 and   n 0 , in accordance with the results observed in the X-ray techniques [24]. According to these results, Nasal-Temporal and Superior inferior directions were considered as preferential orientations. This work did not include density variation across the thickness.
ψ = ψ volumetric ( J ) +   ψ ¯ Isochoric ( C ¯ ,   M ,   N )
Equation (1) can be evaluated in terms of invariants as seen in Equation (2)
  ψ = ψ volumetric   ( J   ) +   ψ ¯ Isochoric ( I ¯ 1 , I ¯ 2 , I ¯ 4 , I ¯ 5 , I ¯ 6 , I ¯ 7 , I ¯ 8 , I ¯ 9 )
Considering the definition of the trace of the modified Right Cauchy–Green deformation tensor t r   ( C ¯ ) , the invariants can be expressed according to the expressions contained in Equations (3) and (4).
I ¯ 1 = t r   ( C ¯ )
I ¯ 2 = ( 1 2 ) [ ( t r   ( C ¯ ) ) 2 t r ( C ¯ 2 ) ]
The pseudo-invariants, associated with fibers’ families, can be expressed in terms of initial orientations and the modified Cauchy–Green deformation tensor according to the expressions contained in Equations (5)–(10)
I ¯ 4 = m 0 C ¯ m 0
I ¯ 5 = m 0 C ¯ 2   m 0
I ¯ 6 = n 0 C ¯ n 0
I ¯ 7 = n 0 C ¯ 2 n 0
I ¯ 8 = m 0 C ¯ n 0
I ¯ 9 = ( m 0 n 0 ) 2
I ¯ 4 and I ¯ 6 represent the squared stretch of fibers. I ¯ 5 and I ¯ 7 are associated with transversal behavior. I ¯ 8 considers the interaction between two fibers’ families. I ¯ 9 is a constant that depends on the material’s configuration.
The volumetric component was evaluated according to Equation (11) where the compressibility factor d was calculated considering a Bulk factor K = 5.5 MPa and taken into account that d = 2 k as was considered in previous work [36]:
ψ volumetric   = 1 d ( J 1 ) 2
The isochoric isotropic component was modeled with a 2-parametric Mooney–Rivlin, as seen in Equation (12), where a 1 and a 2 are the experimentally obtained materials.
ψ ¯ isotropic = a 1 ( I ¯ 1 3 ) + a 2 ( I ¯ 2 3 )
This work did not bear in mind the interaction between fiber families, and the same shear modulus was contemplated in the direction of the fiber families and orthogonal to this direction. According to this hypothesis [1], the influence of pseudo-invariants I ¯ 5 , I ¯ 7 and I ¯ 8 was not considered. I ¯ 9 was constant during material deformation but was not included in the material deformation description. The isochoric anisotropic component was considered by the Holzapfel model [37], in which only pseudo invariants I ¯ 4 and I ¯ 6 were taken into account according to Equation (13).
ψ ¯ anisotropic = k 1 2 k 2 ( exp [ k 2 ( I ¯ 4 1 ) 2 ] 1 ) + k 1 2 k 2 ( exp [ k 2 ( I ¯ 6 1 ) 2 ] 1 )
In this equation, constants k 1 and k 2 are related to fiber behavior. The former considers stiffness at low extension, whereas the latter shows the influence at high strain levels.
According to the hypothesis, and considering the Clausius–Planck inequality, the second Piola–Kirchhoff tensor can be derived according to Equation (14).
S = J p C 1 + 2 [ ( ψ ¯ δ I ¯ 1 + I ¯ 1 ψ ¯ δ I ¯ 2 ) 1 ψ ¯ δ I ¯ 2 C ¯ + I ¯ 4 ψ ¯ δ I ¯ 4 m 0 m 0 + I ¯ 6 ψ ¯ δ I ¯ 6 n 0 n 0 1 3   ( ψ ¯ δ I ¯ 1 I ¯ 1 + 2 ψ ¯ δ I ¯ 2 I ¯ 2 + ψ ¯ δ I ¯ 4 I ¯ 4 + ψ ¯ δ I ¯ 6 I ¯ 6 ) C ¯ 1 ]
From the second Piola–Kirchhoff tensor, the Cauchy Stress Tensor was evaluated by considering the following relation between the tensor components:
σ = J 1 FSF T
That applied to Equation (14) can be expressed as the following equation:
σ   =   p 1 + 2 J [ ( ψ ¯ δ I ¯ 1 + I ¯ 1 ψ ¯ δ I ¯ 2 ) b ¯ ψ ¯ δ I ¯ 2 b ¯ 2 + I ¯ 4 ψ ¯ δ I ¯ 4 m m +   I ¯ 6 ψ ¯ δ I ¯ 6 n n 1 3   ( ψ ¯ δ I ¯ 1 I ¯ 1 + 2 ψ ¯ δ I ¯ 2 I ¯ 2 +   ψ ¯ δ I ¯ 4 I ¯ 4 +   ψ ¯ δ I ¯ 6 I ¯ 6 ) 1 ]
In these equations, p is the hydrostatic pressure, 1 is the identity tensor, b ¯ is the modified Left Cauchy strain tensor defined as b ¯ = F ¯ F ¯ T and m and n are the fibers’ orientation vectors in the deformed state.
Collagen fibers distribution was considered by the variation in the k 1 parameter. In this paper, corneal surface was divided into octants, and concentric zones with diameters from 0 to 10 mm in steps of 2 mm were considered. Furthermore, a transition zone between 10 and 11 mm was modeled until the limbus zone considered from 11 mm to the external diameter. Fibers were oriented in the vertical and horizontal directions with the exception of the limbus, where fibers were oriented circumferentially. The materials’ properties are found in Table 1 where the parameters are obtained from the values obtained by [21,36]. The value of k 1 is varied depending on the zone to consider the fiber density variation [21]. The variation of k 1 is based on the work of Daxer, A. & Fratzl, P [24]. In their work, 66% of fibers are concentrated in horizontal and vertical octants, whereas 34% is concentrated in the oblique octants. The fiber’s variation was considered taking into account a reduced value of k 1 in the central oblique zones. A transition zone was considered between zone with minimum and maximum values of k 1 .

2.2. Finite Element Model Definition

Three finite element models were developed based on the Navarro’s theoretical model (N) and two real patient-specific corneal geometries that were measured by a Sirius tomographer (CSO, Ferrara, Italy). The first was a healthy cornea (G0), whereas the second one was affected by keratoconus in an incipient phase (G1) according to the Amsler–Krumeich criteria [32] (provided from Vissum Hospital, Miguel Hernandez University and Keratoconus IBERIA database, Alicante, Spain). This study was approved by the research ethics committee of the Technical University of Cartagena (CEI21_001).
The corneal model was extended to the limbus zone, where it was attached to sclera tissue. An almost 40° cut angle was used according to the average measured values [38]. To implement the finite element model, the ANSYS software (Swanson Analysis System Inc., Canonsburg, PA, USA) was applied by considering the 3D elements of type SOLID 186 with four elements for thickness [21]. The mixed u-P formulation and reduced integration were considered for solving purposes.
Figure 1 shows the different defined material zones. Light blue depicts the superior-inferior, nasal-temporal, and central zones. Red denotes the limbus zone and purple the zones in diagonal octants with low fibers’ density, where a reduction in the stiffness parameter of fibers was considered according to previous works [24]. Blue zones denote the transition zones between zones with maximum and minimum fibers concentration.
Due to the high fibers’ density in the limbus zone, where a high stiffness is reached, the displacements were constrained on the exterior face, where the cornea was joined to sclera tissue. This hypothesis avoids the rotation of the limbus zone and was applied in previous works [29].
Intraocular pressure was applied as a pressure load in the cornea’s posterior zone, but the aqueous humor influence was not considered. For Navarro’s geometry, an IOP of 15 mm Hg (1998.4 Pa) was applied, whereas a respective IOP of 18 mm Hg (2399.8 Pa) and 16 mm Hg (2133.2 Pa) was used for the G0 and G1 geometries according to the measured IOP for each patient.

2.3. Calculation of the Stress Distribution in the Measurement Phase

The steps of these iterative processes are summarized below:

2.3.1. Displacement Method

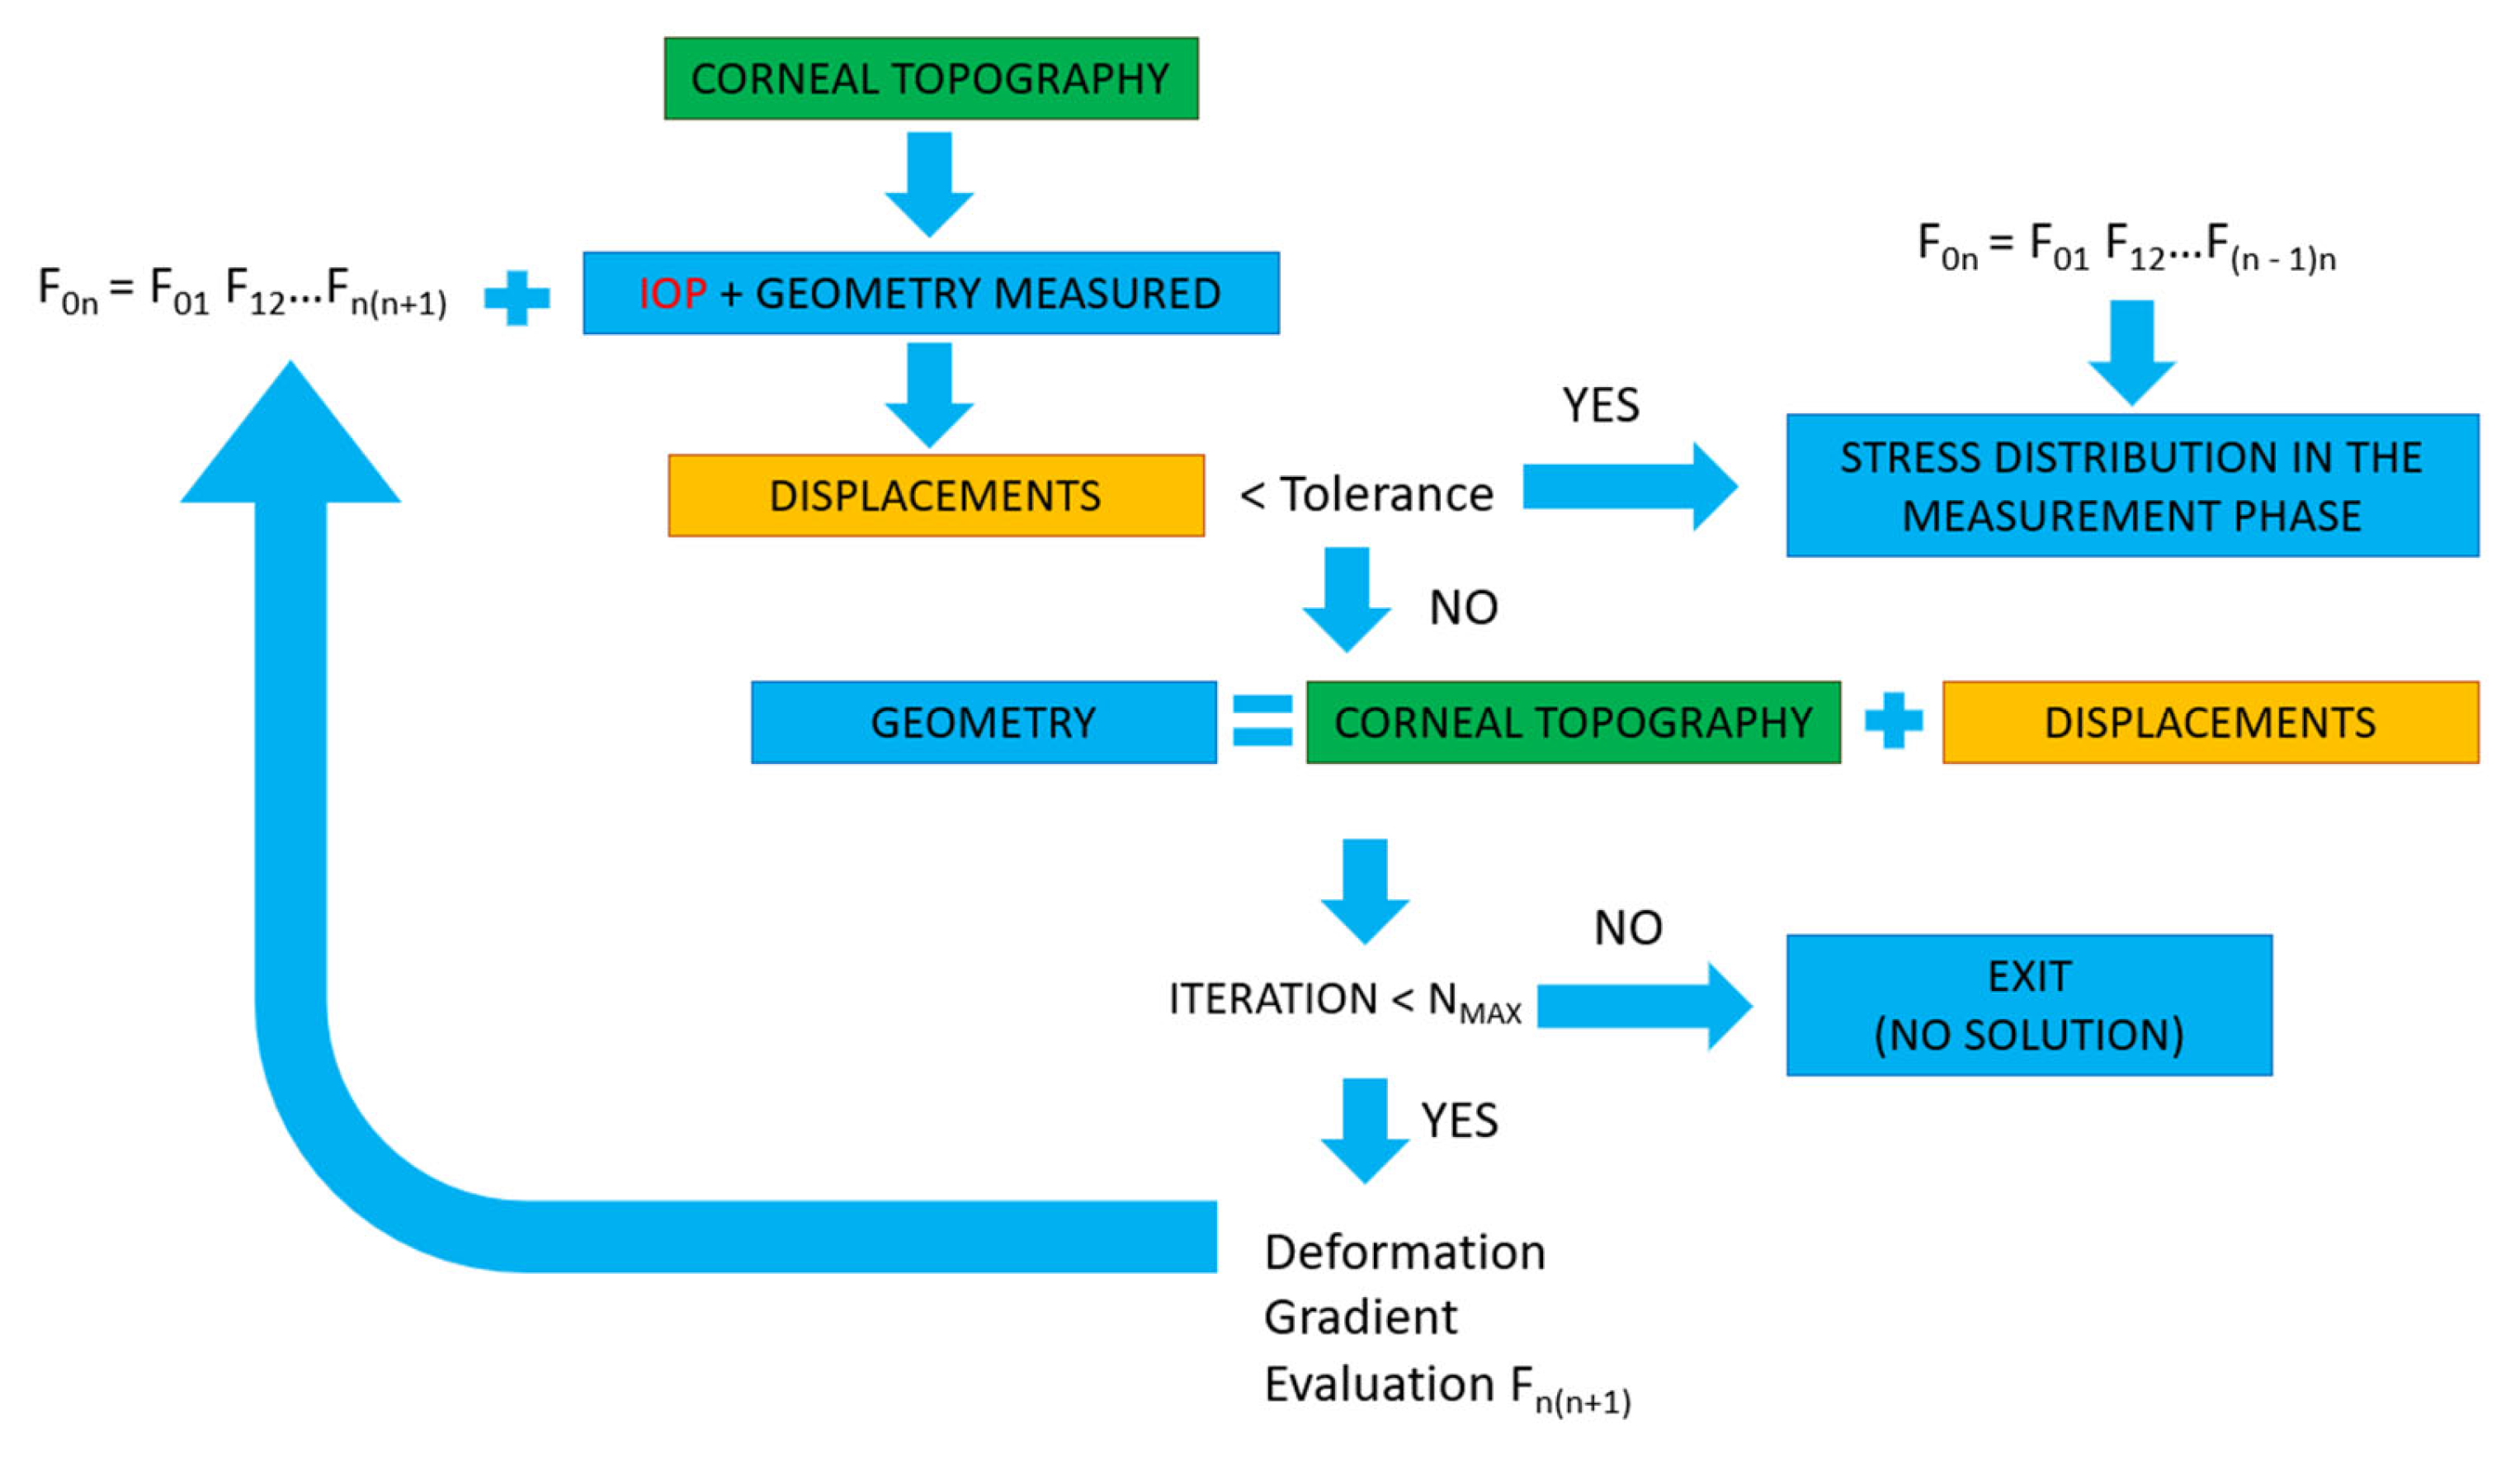
This method was performed in an iterative process implemented in Python 3.8 (Python Software Foundation). Ansys files (Swanson Analysis System Inc., Canonsburg, PA, USA) were read and updated following the iteration method found in Figure 2. The initial node coordinates were based on the geometrical values obtained with the topographer. From this geometry, the iterative process was based on the estimation of a free-stress geometry, which was submitted to IOP. The deformed geometry obtained is compared with the corneal topography and if the maximum difference between points is lower than a previously defined tolerance, the proposed geometry is considered the free stress geometry; elsewhere, the iterative process continued until the tolerance criteria was fulfilled or a maximum number of iterations was reached (Figure 2). The geometrical comparison considered the maximum distance between equivalent nodes placed in the intersections between sectors and circumferential divisions in the anterior and posterior corneal faces.
The displacement methods allowed the stress-free geometry, stresses, and strains to be computed.

2.3.2. Prestress Method

This method was performed in an iterative process implemented in Python 3.8 (Python Software Foundation). Ansys files (Swanson Analysis System Inc., Canonsburg, PA, USA) were read and updated following the iteration method shown in Figure 3. The objective of this method is to calculate a stress distribution in the cornea that equilibrates the applied IOP. From the model based on the geometry obtained with the topographer, IOP was applied, and the deformation gradient of the previous case was applied up to the displacement level was lower than a previously established tolerance. If the displacement level evaluation was higher than tolerance, the process continued until the tolerance criteria was fulfilled or a maximum number of iterations was reached (Figure 3).
The prestress method allows the stress distribution in the measurement phase to be computed. However, the stress-free geometry is not directly obtained as in the displacement method. To obtain the free stress geometry, a direct inverse calculation can be applied to the finite element model based on the corneal topography by considering only the stress distribution in the measurement phase without IOP.

3. Results and Discussion

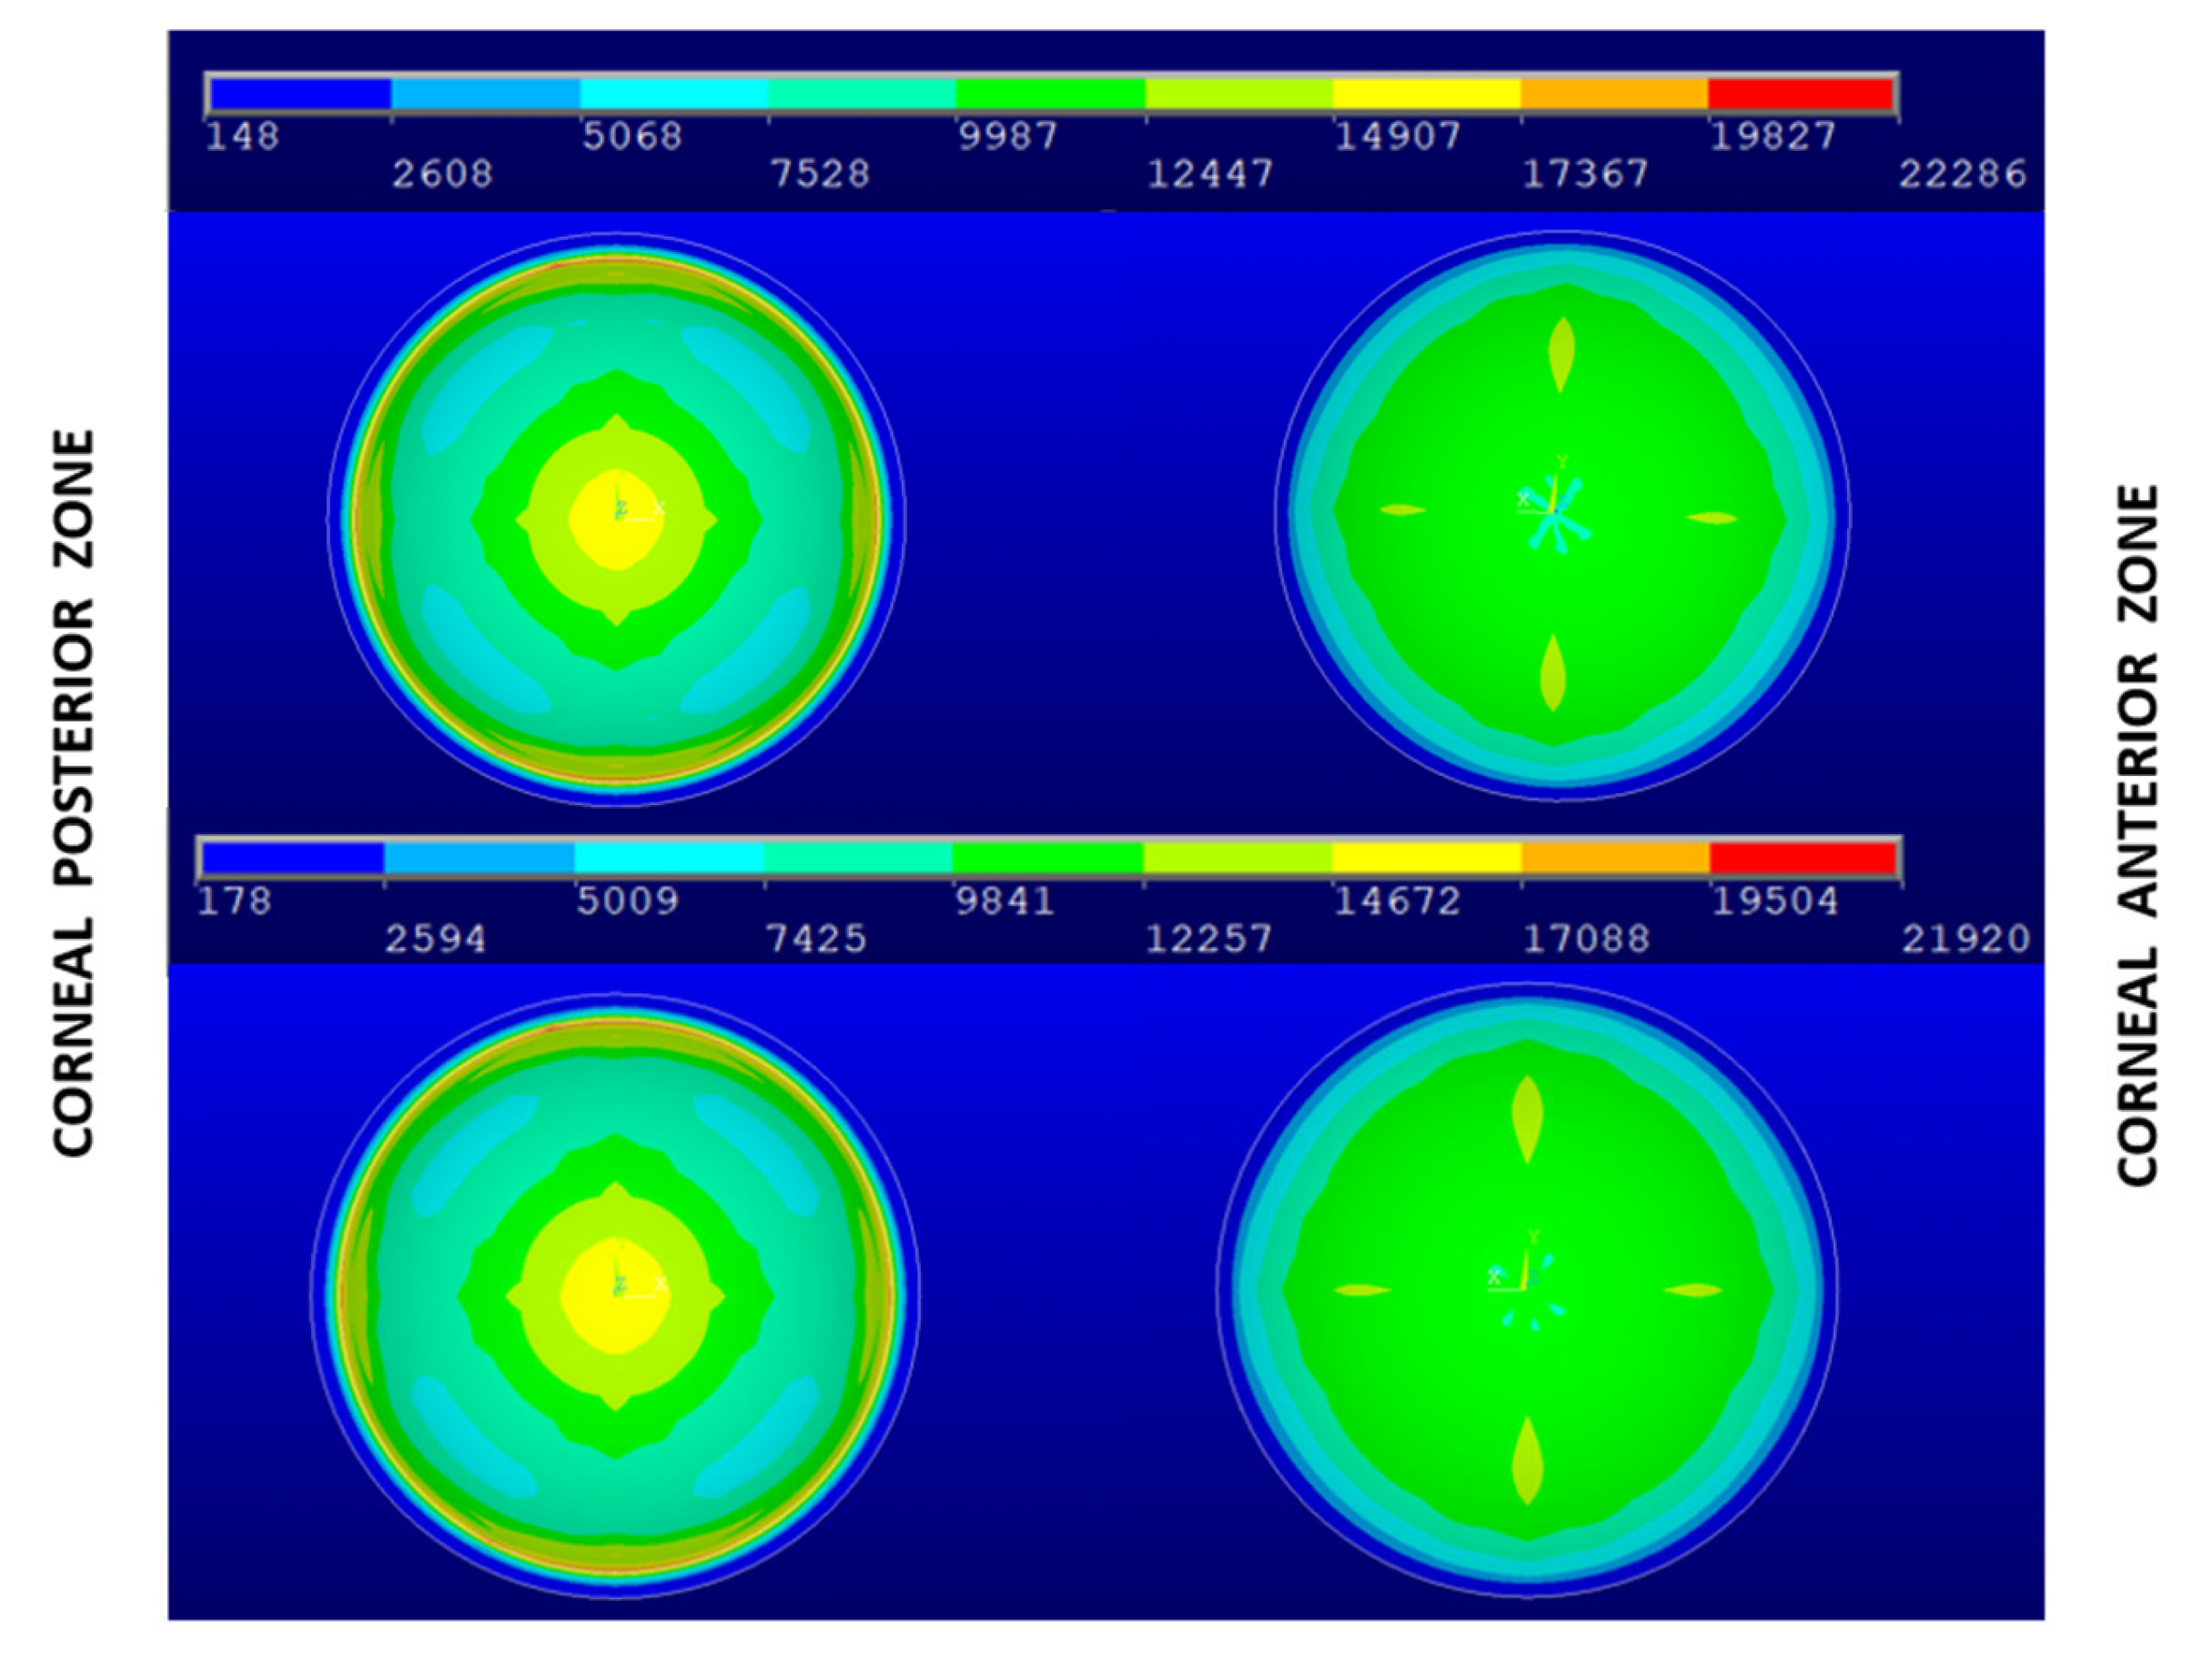
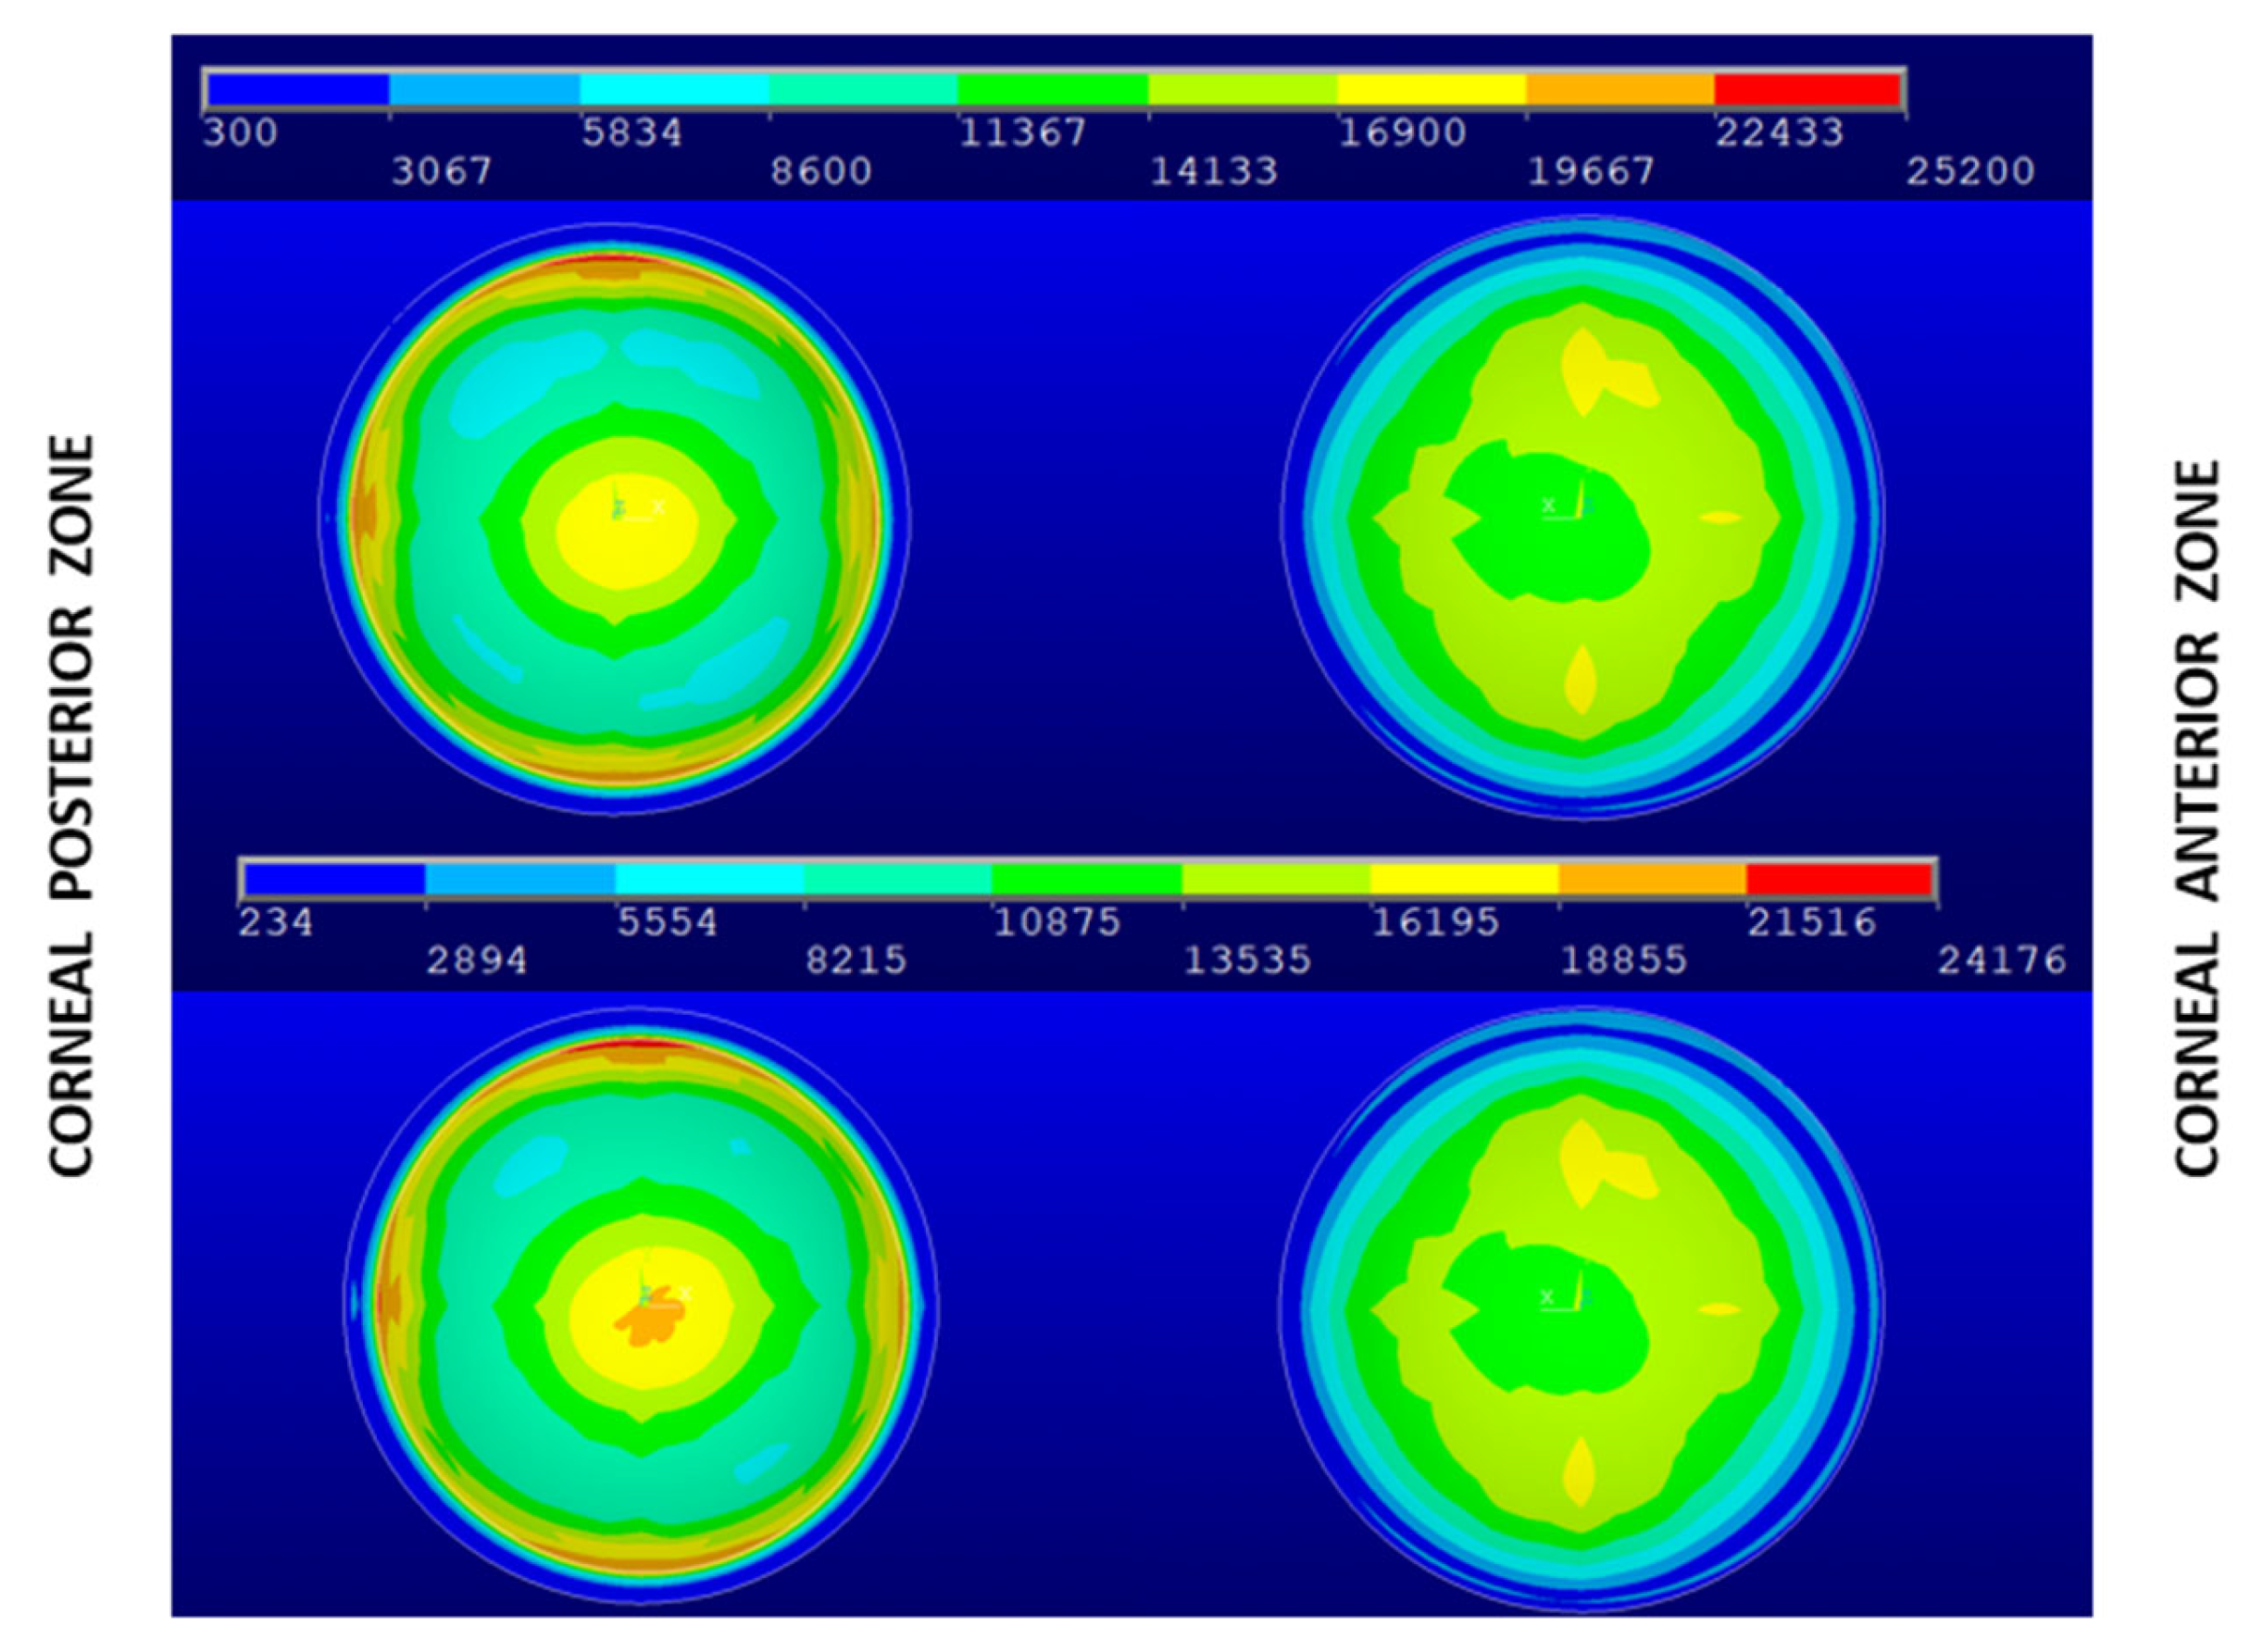
The stress distributions in the measurement phase with the displacement and prestress method are observed in Figure 4, Figure 5 and Figure 6 for the three analyzed corneas. In all the studied cases, the stress distribution and maximum values obtained were similar with the two implemented methods. Differences between corneal models, Navarro, G0 and G1, are due to the geometrical and thickness variation and the level of intraocular pressure considered (15 mmHg for Navarro model, 18 mmHg for G0 model, and 16 mm Hg for G1). The theoretical model showed a symmetric distribution that could be evaluated in a quarter finite element model however in patient-specific models’ thickness and geometry are not symmetric and the whole model must be taken into account.
For the Navarro theoretical model, maximum values are obtained in the posterior limbus zone where displacements are constrained, and fibers are oriented circumferentially (Figure 4). In this zone, as was observed with X-ray scattering [21] high fibers’ density was located. Excluding the limbus zone, the stress distribution in the posterior zone showed a concentric distribution with a stress increment in the center. These results are coherent with the results of other works [21] and could explain the different lamellae’s dimensions in the corneal thickness where lamellae are twice as thick in the posterior zone compared to anterior one. In the anterior zone, the results were more homogeneous with lighter stress steps due to the definition of sectors. The obtained von Mises stress level is lower than in the posterior zone and this factor could explain the difference in lamellae thickness, which was thicker in the posterior zone [21].
The values obtained and spatial distribution are similar to those obtained by Pandolfi A. and Holzapfel, G.A. [35]. However, these authors only use theoretical geometries, whereas in the current research real patient-specific geometries were used besides a theoretical geometry.
For patient-specific models (Figure 5 and Figure 6), the stress distribution obtained with the implemented biomechanical models was coherent with the fibers’ orientation and density observed by X-ray scattering [22]. An increase was noted for the fibers oriented in the superior-inferior and nasal-temporal directions in the central zone, which continued in a central zone of approximately 7 mm in diameter [24]. These results are consistent with those obtained on the theoretical geometric model by other authors [28,29,34], however, our models, in addition to the theoretical model, are applied on real cases of healthy and sick patients (G0 and G1, respectively).
The X-ray images confirmed an increment in fiber density in the internal zone of the limbus, which coincided with the zone where the von Mises stress level rose. The maximum values were obtained in the limbus zone for G0 configuration, but these values were affected by the intraocular pressure (IOP) considered in the study and the constraints imposed in these zones when displacements were constrained. These restrictions are common for this type of study [28,29,34].
An average maximum value was obtained in the central zone for the three analyzed geometries, as shown in Table 2. These values are affected by the IOP in the measurement phase (patient-specific). By means of a linear interpolation and by taking a reference intraocular pressure of 15 mmHg, the maximum values of the von Mises stress distribution in the measurement phase were obtained.
As can be observed in Table 2, when the same IOP was considered, the maximum von Mises stress level rose with keratoconus evolution, and both values had higher values than those obtained with Navarro eye’s geometry. These results are alienated by those presented by other authors [13,28,29], however, to our knowledge, this is the first study that compare at the same time the methods of displacements and prestress on real geometric models of patients, analyzing the influence of the stress field of both methods on healthy patients and in an early stage of the disease.
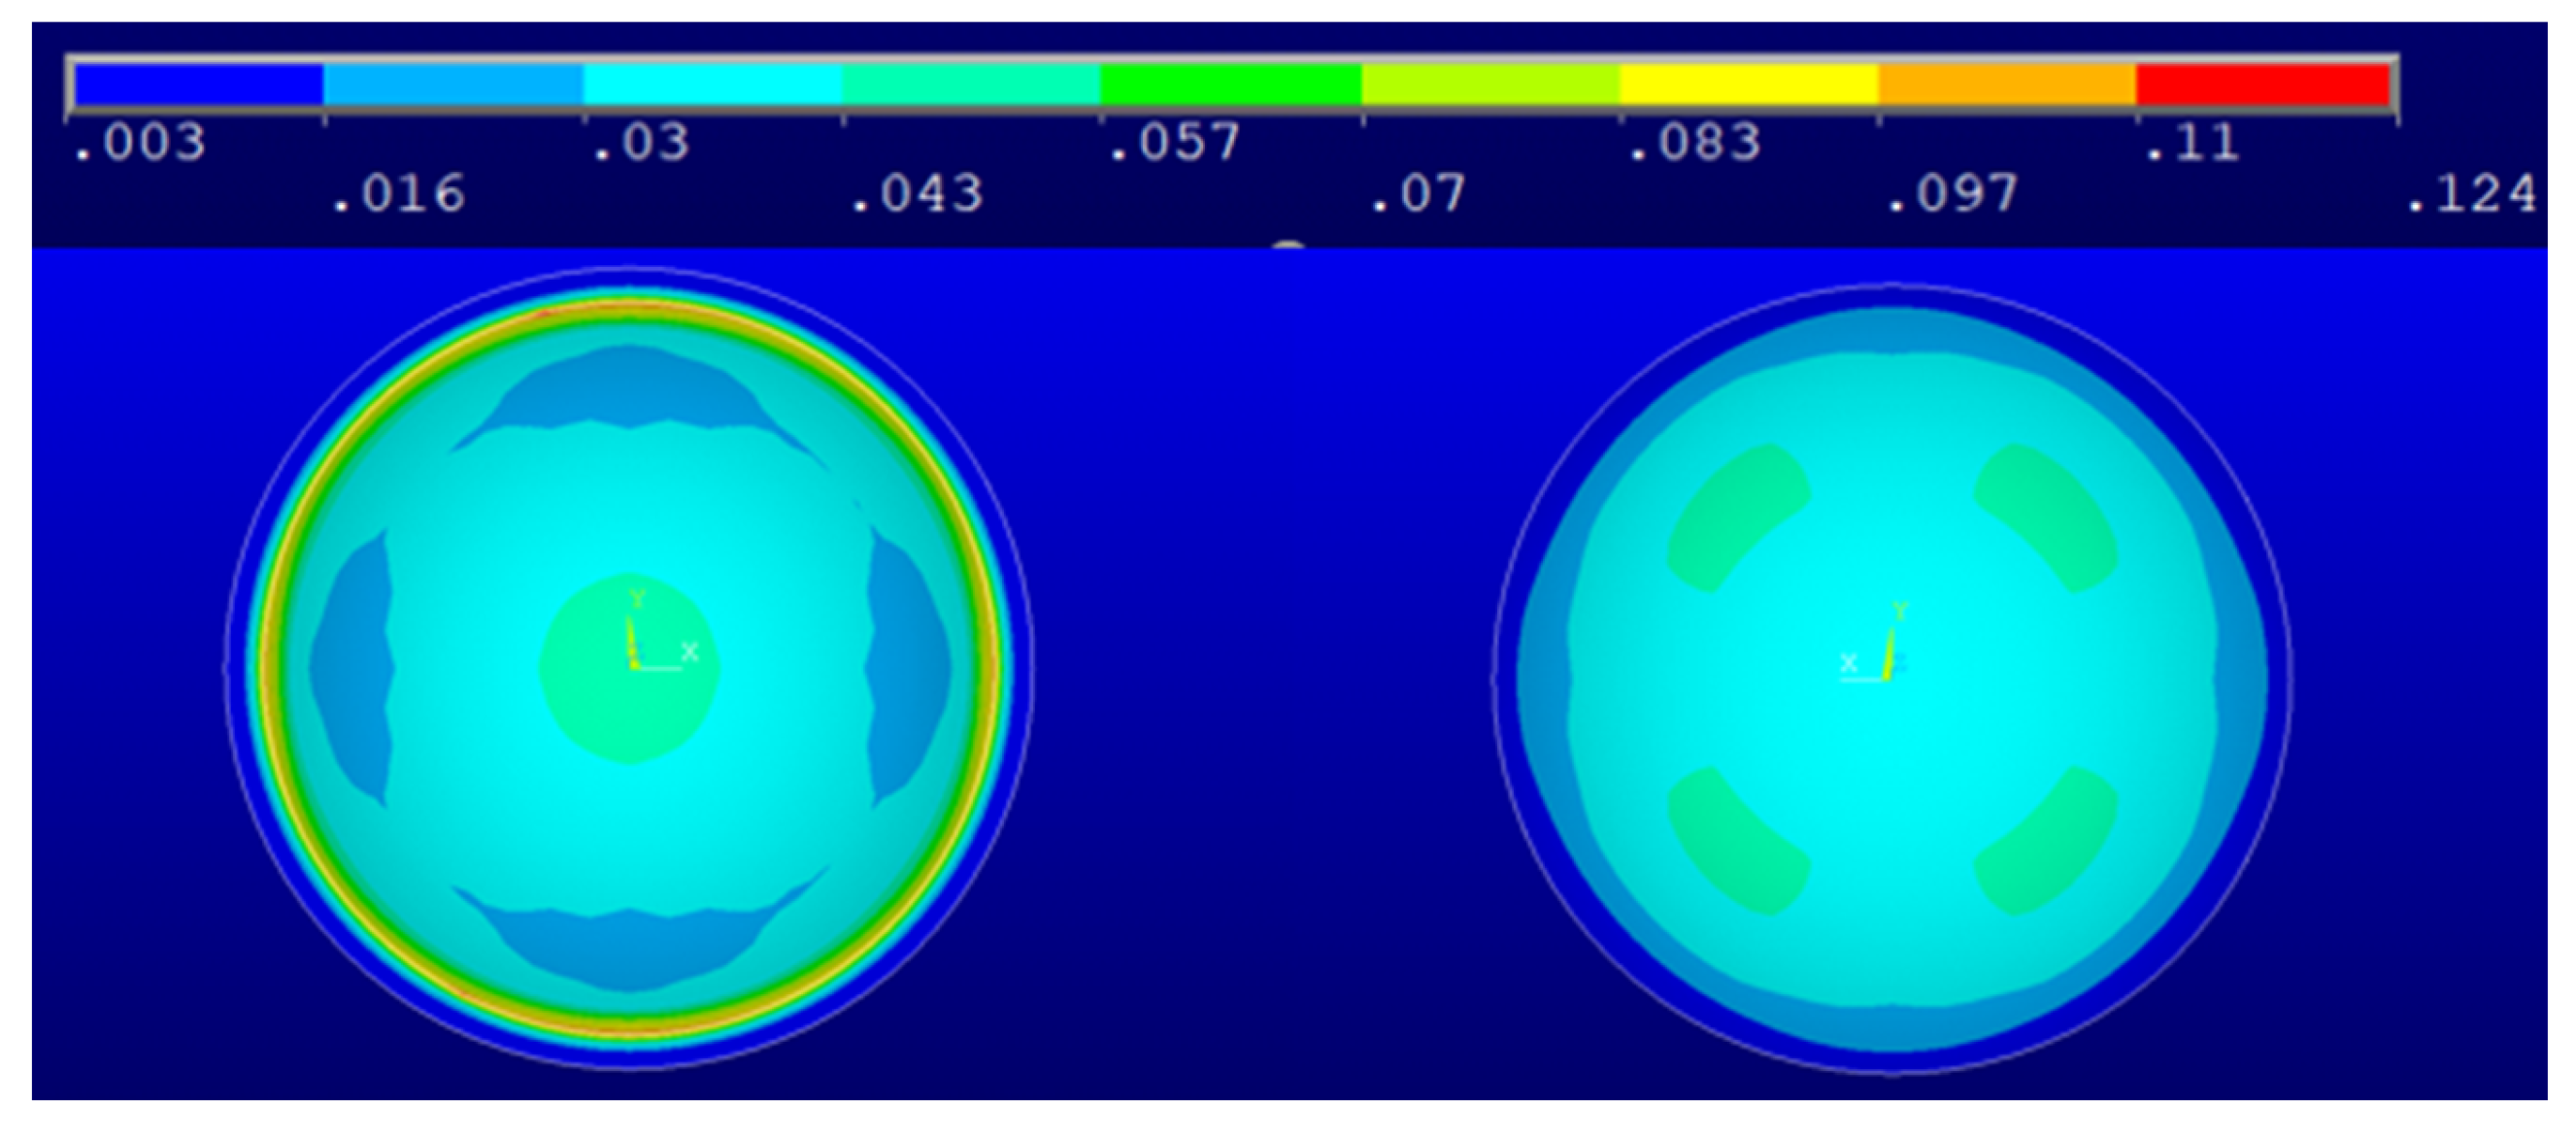
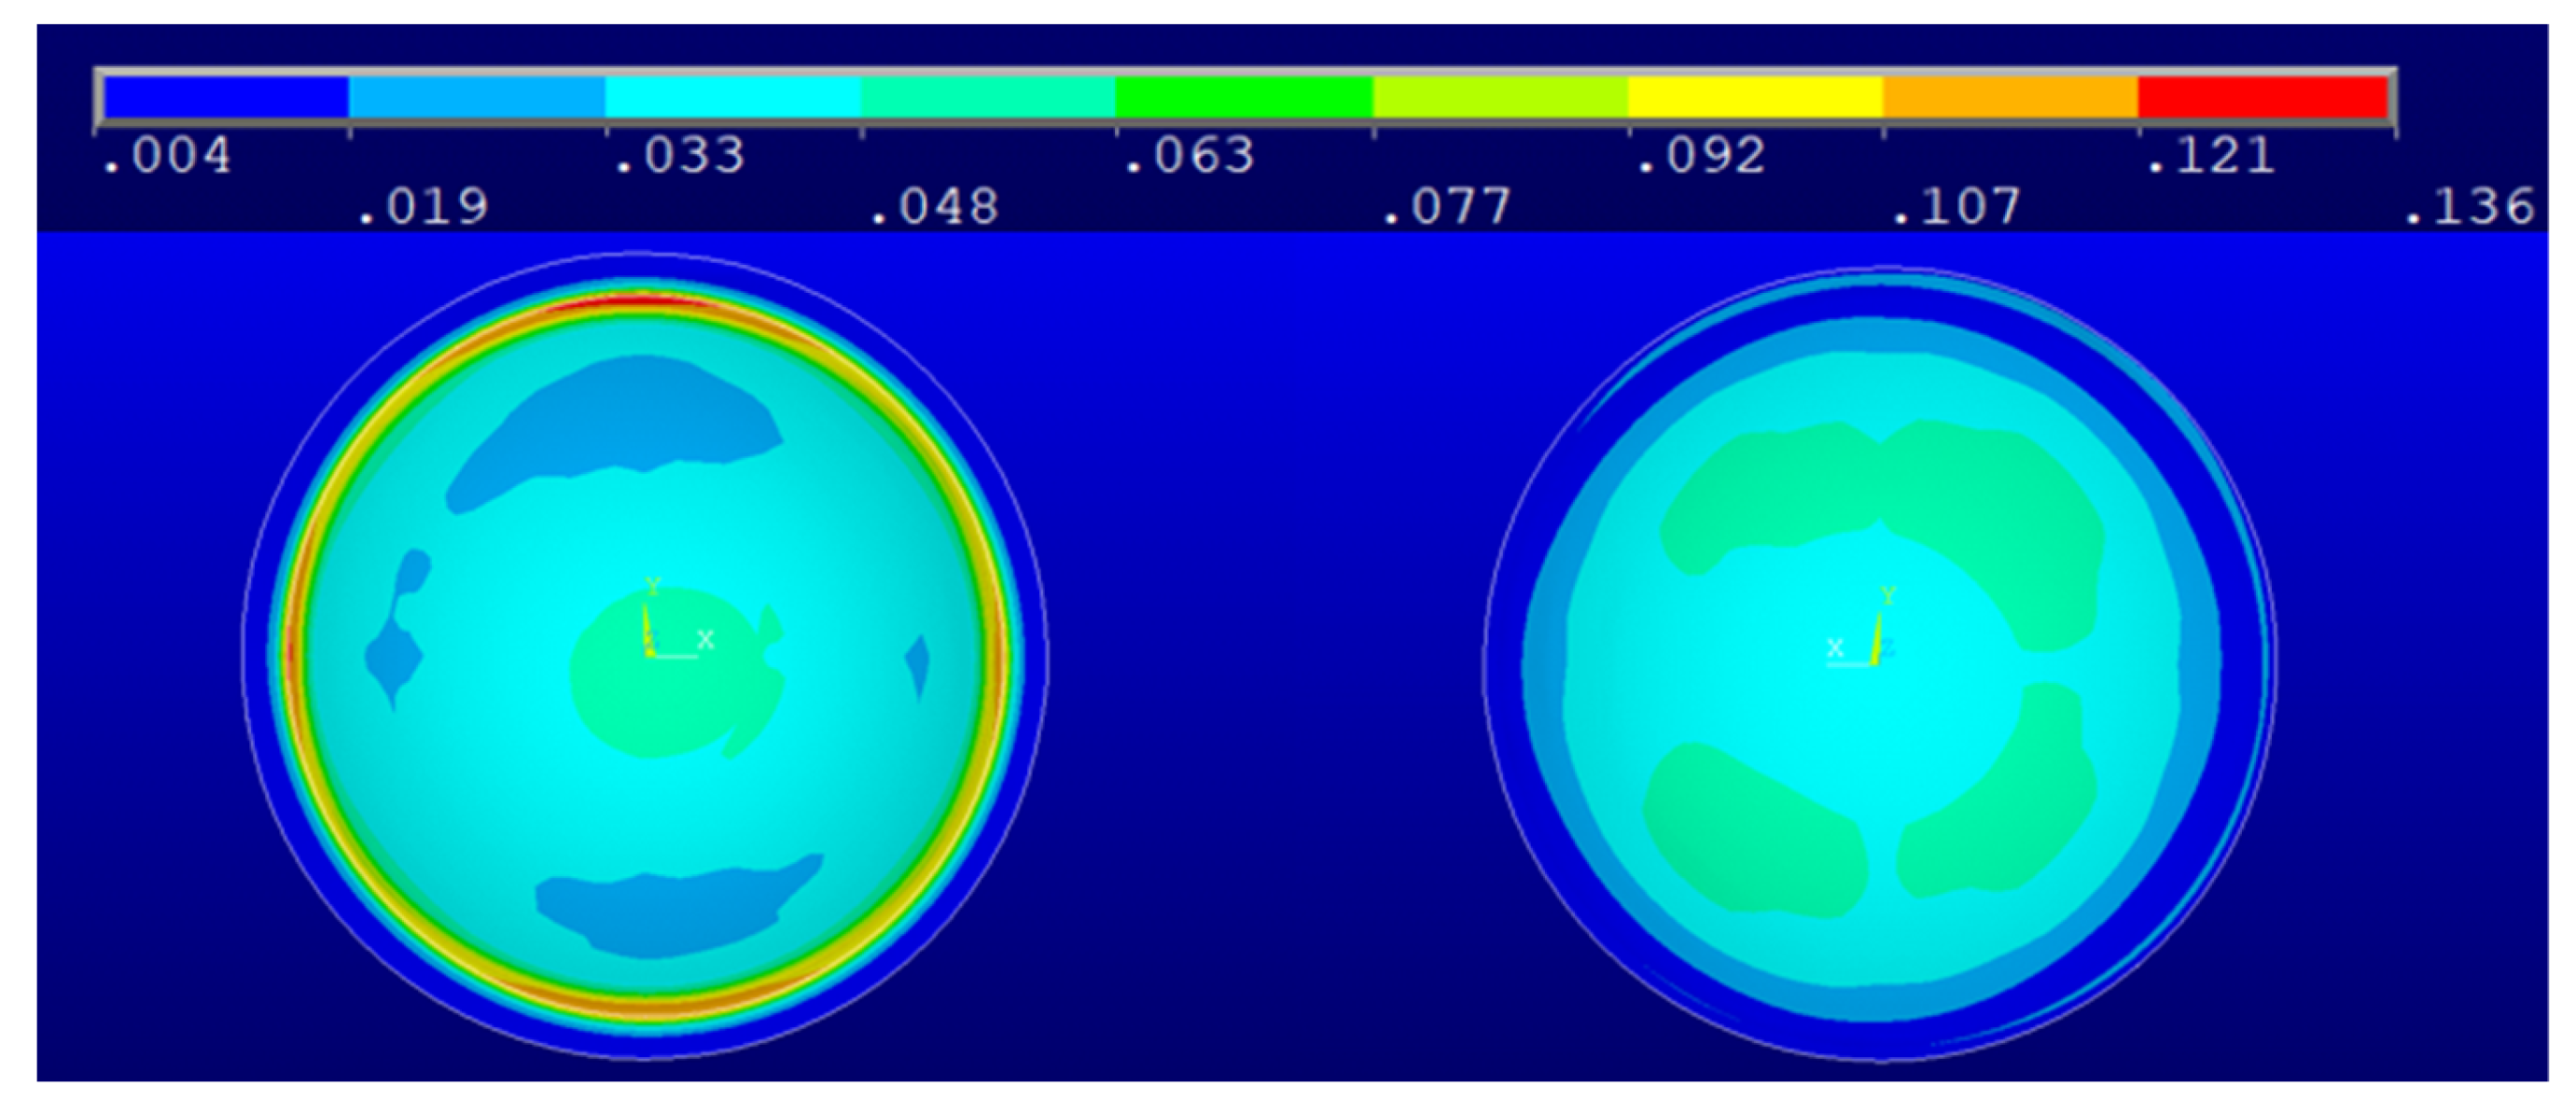
Finally, and for validation purpose, the intraocular pressure (IOP) was directly applied to the free stress geometry of the theoretical Navarro model and patient-specific models, the results obtained showed that this IOP distorts the deformation field in the tissue of the corneal structure as shown in Figure 7, Figure 8 and Figure 9.
On the models, a tangent elastic module was derived in the central zone from the stress and strain values. An average value of 0.34 MPa was obtained for Navarro eye’s geometry (15 mmHg), a value of 0.37 MPa for the G0 geometry (18 mmHg), and 0.37 MPa for the G1 geometry (16 mmHg).
The tangent elastic modulus obtained in the central zone of the modelled corneas is in the range of values reported by other authors in inflation tests [39]; therefore, our models are consistent with the research developed.
The values obtained are limited to the material model chosen and the parameters implemented, that depends on patient-specific tests. This factor does not affect to the results of this research: The two implemented methods, displacement method and prestress method, were equivalent, and the same stress distribution in the measurement phase was obtained. The displacement method allowed the stress-free geometry to be directly recovered and it proved to be a less complex method from the computational point of view.
Regarding the clinical application of simulation models, the main challenges are defined by a realistic simulation in real time [40,41]. In this sense, our research team developed specific real-time patient 3D geometric models [30,31,32,33]. The accuracy of these geometric models allows for a good quality meshing, which leads to the efficient generation of specific models used in preoperative analysis or for surgical planning.

4. Conclusions

In this research, the stress distribution in the measurement phase was calculated by two iterative methods: prestress method and displacement method. The distribution and maximum values reached were similar, and differences were attributed to the numerical methods.
The stress level distribution is coherent with the results of previous works. Maximum values are obtained in the limbus zone, where according to X-ray scattering, a high circumferential fiber density is observed. The stress level in the posterior central zone could explain the different lamellae’s dimensions in the corneal thickness where lamellae are twice as thick in the posterior zone compared to that of the anterior one.
Although both methods allowed the stress distribution to be known in the measurement phase, the displacements method gave the stress-free geometry of the cornea directly, and the field of strains was obtained when real-patient IOP was applied. For the authors’ knowledge, it is the first time that both methods were compared with real geometries of healthy and sick patients.
The knowledge about the stress distribution in the measurement phase is a key factor for accurate mechanical simulations. These simulations can help to develop patient-specific models and to reduce the number of second interventions in clinical practice.
For future research development, more complex material models and other algorithms to recover the free stress configuration can be analyzed to obtain faster and more accurate solutions to assist surgeons.

Author Contributions

Conceptualization, C.G. and F.C.; methodology, C.G., D.P.P. and F.C.; software, M.P. and C.G.; validation, D.P.P., J.L.A. and F.C.; formal analysis, D.P.P. and J.L.A.; investigation, C.G., M.P., and F.C.; resources, D.P.P. and J.L.A.; data curation, C.G., M.P. and F.C.; writing—original draft preparation, C.G., D.P.P., M.P. and F.C.; writing—review & editing, F.C. and J.L.A.; visualization, C.G. and F.C.; supervision, F.C., D.P.P. and J.L.A.; project administration, F.C. and J.L.A.; funding acquisition, J.L.A. and F.C. All authors have read and agreed to the published version of the manuscript.

Funding

This publication was carried out in the framework of the Thematic Network for Co-Operative Research in Health (RETICS) reference number RD12/0034/0007 and RD16/0008/0012, financed by the Carlos III Health Institute—General Subdirection of Networks and Cooperative Investigation Centers (R&D&I National Plan 2008–2011) and the European Regional Development Fund (FEDER). The author David P. Piñero was supported by the Ministry of Economy, Industry, and Competitiveness of Spain within the program Ramón y Cajal, RYC-2016-20471.

Institutional Review Board Statement

The study was conducted according to the guidelines of the Declaration of Helsinki and approved by the Institutional Ethics. Committee of the Technical University of Cartagena (CEI21_001).

Informed Consent Statement

Informed consent was obtained from all subjects involved in the study.

Conflicts of Interest

The authors declare no conflict of interest.

References

  1. Chagnon, G.; Rebouah, M.; Favier, D. Hyperelastic Energy Densities for Soft Biological Tissues: A Review. J. Elast. 2015, 120, 129–160. [Google Scholar] [CrossRef] [Green Version]
  2. Yousefi, A.A.K.; Nazari, M.A.; Perrier, P.; Panahi, M.S.; Payan, Y. A new model of passive muscle tissue integrating Collagen Fibers: Consequences for muscle behavior analysis. J. Mech. Behav. Biomed. Mater. 2018, 88, 29–40. [Google Scholar] [CrossRef] [PubMed] [Green Version]
  3. Yousefi, A.A.K.; Nazari, M.A.; Perrier, P.; Panahi, M.S.; Payan, Y. A visco-hyperelastic constitutive model and its application in bovine tongue tissue. J. Biomech. 2018, 71, 190–198. [Google Scholar] [CrossRef] [PubMed] [Green Version]
  4. Martynenko, A.; Zozulya, V.V. Mathematical modeling of the cardiac tissue. Mech. Adv. Mater. Struct. 2021, 1–17. [Google Scholar] [CrossRef]
  5. Hurtado, D.E.; Zavala, P. Accelerating cardiac and vessel mechanics simulations: An energy-transform variational formulation for soft-tissue hyperelasticity. Comput. Methods Appl. Mech. Eng. 2021, 379, 113764. [Google Scholar] [CrossRef]
  6. Liber-Kneć, A.; Łagan, S. Experimental and Constitutive Approaches for a Study of Mechanical Properties of Animal Tendons. In Advances in Intelligent Systems and Computing; Springer: Cham, Switzerland, 2020; Volume 1033, pp. 288–297. [Google Scholar]
  7. Yousefsani, S.A.; Shamloo, A.; Farahmand, F. Micromechanics of brain white matter tissue: A fiber-reinforced hyperelastic model using embedded element technique. J. Mech. Behav. Biomed. Mater. 2018, 80, 194–202. [Google Scholar] [CrossRef]
  8. Feng, Y.; Okamoto, R.J.; Namani, R.; Genin, G.M.; Bayly, P.V. Measurements of mechanical anisotropy in brain tissue and implications for transversely isotropic material models of white matter. J. Mech. Behav. Biomed. Mater. 2013, 23, 117–132. [Google Scholar] [CrossRef] [PubMed] [Green Version]
  9. Benítez, J.M.; Montáns, F.J. The mechanical behavior of skin: Structures and models for the finite element analysis. Comput. Struct. 2017, 190, 75–107. [Google Scholar] [CrossRef]
  10. Karimi, A.; Faturechi, R.; Navidbakhsh, M.; Hashemi, S.A. A nonlinear hyperelastic behavior to identify the mechanical properties of rat skin under uniaxial loading. J. Mech. Med. Biol. 2014, 14, 1450075. [Google Scholar] [CrossRef]
  11. Hernández, Q.; Peña, E. Failure properties of vena cava tissue due to deep penetration during filter insertion. Biomech. Modeling Mechanobiol. 2016, 15, 845–856. [Google Scholar] [CrossRef] [PubMed]
  12. Veselý, J.; Horný, L.; Chlup, H.; Adámek, T.; Krajíček, M.; Žitný, R. Constitutive modeling of human saphenous veins at overloading pressures. J. Mech. Behav. Biomed. Mater. 2015, 45, 101–108. [Google Scholar] [CrossRef] [Green Version]
  13. Balzani, D.; Brinkhues, S.; Holzapfel, G.A. Constitutive framework for the modeling of damage in collagenous soft tissues with application to arterial walls. Comput. Methods Appl. Mech. Eng. 2012, 213, 139–151. [Google Scholar] [CrossRef]
  14. Kling, S.; Hafezi, F. Corneal biomechanics—A review. Ophthalmic Physiol. Opt. 2017, 37, 240–252. [Google Scholar] [CrossRef] [PubMed] [Green Version]
  15. Nguyen, B.A.; Roberts, C.J.; Reilly, M.A. Biomechanical impact of the sclera on corneal deformation response to an air-puff: A finite-element study. Front. Bioeng. Biotechnol. 2019, 6, 210. [Google Scholar] [CrossRef]
  16. Jiang, Y.; Wang, Y.; Peng, X. A Visco-Hyperelastic Constitutive Model for Human Spine Ligaments. Cell Biochem. Biophys. 2015, 71, 1147–1156. [Google Scholar] [CrossRef] [PubMed]
  17. Wang, J.; Liu, X.; Bao, F.; Lopes, B.T.; Wang, L.; Eliasy, A.; Abass, A.; Elsheikh, A. Review of ex-vivo characterisation of corneal biomechanics. Med. Nov. Technol. Devices 2021, 11, 100074. [Google Scholar] [CrossRef]
  18. Lopes, B.T.; Bao, F.; Wang, J.; Liu, X.; Wang, L.; Abass, A.; Eliasy, A.; Elsheikh, A. Review of in-vivo characterisation of corneal biomechanics. Med. Nov. Technol. Devices 2021, 11, 100073. [Google Scholar] [CrossRef]
  19. Navarro, R.; González, L.; Hernández, J.L. Optics of the average normal cornea from general and canonical representations of its surface topography. J. Opt. Soc. Am. A 2006, 23, 219–232. [Google Scholar] [CrossRef]
  20. Elsheikh, A.; Alhasso, D. Mechanical anisotropy of porcine cornea and correlation with stromal microstructure. Exp. Eye Res. 2009, 88, 1084–1091. [Google Scholar] [CrossRef]
  21. Pandolfi, A. Cornea modelling. Eye Vis. 2020, 7, 2. [Google Scholar] [CrossRef] [Green Version]
  22. Meek, K.M.; Boote, C. The use of X-ray scattering techniques to quantify the orientation and distribution of collagen in the corneal stroma. Prog. Retin. Eye Res. 2009, 28, 369–392. [Google Scholar] [CrossRef] [PubMed]
  23. Aghamohammadzadeh, H.; Newton, R.H.; Meek, K.M. X-Ray Scattering Used to Map the Preferred Collagen Orientation in the Human Cornea and Limbus. Structure 2004, 12, 249–256. [Google Scholar] [CrossRef] [PubMed]
  24. Daxer, A.; Fratzl, P. Collagen fibril orientation in the human corneal stroma and its implication in keratoconus. Investig. Ophthalmol. Vis. Sci. 1997, 38, 121–129. [Google Scholar]
  25. Wang, S.; Hatami-Marbini, H. Constitutive Modeling of Corneal Tissue: Influence of Three-Dimensional Collagen Fiber Microstructure. J. Biomech. Eng. 2021, 143, 031002. [Google Scholar] [CrossRef]
  26. Pandolfi, A.; Gizzi, A.; Vasta, M. A microstructural model of cross-link interaction between collagen fibrils in the human cornea. Philos. Trans. R. Soc. A 2019, 377, 20180079. [Google Scholar] [CrossRef] [Green Version]
  27. Kohlhaas, M. Iatrogenic Keratectasia: A Review. Klin. Mon. Fur Augenheilkd. 2015, 232, 765–772. [Google Scholar] [CrossRef]
  28. Ariza-Gracia, M.A.; Flecha-Lescún, J.; Rodríguez Matas, J.F.; Calzada, B.C. Personalized corneal biomechanics. In Advances in Biomechanics and Tissue Regeneration; Academic Press: London, UK, 2019; pp. 3–20. [Google Scholar] [CrossRef]
  29. Pandolfi, A.; Montanino, A. On the recovery of the stress-free configuration of the human cornea. Modeling Artif. Intell. Ophthalmol. 2020, 2, 11–33. [Google Scholar] [CrossRef]
  30. Toprak, I.; Cavas, F.; Velázquez, J.S.; Alio del Barrio, J.L.; Alio, J.L. Subclinical keratoconus detection with three-dimensional (3-D) morphogeometric and volumetric analysis. Acta Ophthalmol. 2020, 98, e933–e942. [Google Scholar] [CrossRef]
  31. Velázquez, J.S.; Cavas, F.; Piñero, D.P.; Cañavate, F.J.F.; Alio Del Barrio, J.; Alio, J.L. Morphogeometric analysis for characterization of keratoconus considering the spatial localization and projection of apex and minimum corneal thickness point. J. Adv. Res. 2020, 24, 261–271. [Google Scholar] [CrossRef]
  32. Cavas-Martínez, F.; Bataille, L.; Fernández-Pacheco, D.G.; Cañavate, F.J.F.; Alio, J.L. Keratoconus Detection Based on a New Corneal Volumetric Analysis. Sci. Rep. 2017, 7, 15837. [Google Scholar] [CrossRef] [Green Version]
  33. Alifa, R.; Piñero, D.; Velázquez, J.; Alió Del Barrio, J.L.; Cavas, F.; Alió, J.L. Changes in the 3D Corneal Structure and Morphogeometric Properties in Keratoconus after Corneal Collagen Crosslinking. Diagnostics 2020, 10, 397. [Google Scholar] [CrossRef] [PubMed]
  34. Lanchares, E.; Calvo, B.; Cristóbal, J.A.; Doblaré, M. Finite element simulation of arcuates for astigmatism correction. J. Biomech. 2008, 41, 797–805. [Google Scholar] [CrossRef] [PubMed]
  35. Pandolfi, A.; Holzapfel, G.A. Three-dimensional modeling and computational analysis of the human cornea considering distributed collagen fibril orientations. J. Biomech. Eng. 2008, 130, 061006. [Google Scholar] [CrossRef] [PubMed] [Green Version]
  36. Pandolfi, A.; Manganiello, F. A model for the human cornea. Constitutive behavior and numerical analysis. Biomech. Modeling Mechanobiol. 2006, 5, 237–246. [Google Scholar] [CrossRef]
  37. Pitre, J.J.; Kirby, M.A.; Li, D.S.; Shen, T.T.; Wang, R.K.; O’Donnell, M.; Pelivanov, I. Nearly-incompressible transverse isotropy (NITI) of cornea elasticity: Model and experiments with acoustic micro-tapping OCE. Sci. Rep. 2020, 10, 12983. [Google Scholar] [CrossRef] [PubMed]
  38. Holzapfel, G.A.; Gasser, T.C.; Ogden, R.W. A new constitutive framework for arterial wall mechanics and a comparative study of material models. J. Elast. 2000, 61, 1–48. [Google Scholar] [CrossRef]
  39. Moore, J.; Shu, X.; Lopes, B.T.; Wu, R.; Abass, A. Limbus misrepresentation in parametric eye models. PLoS ONE 2020, 15, e0236096. [Google Scholar] [CrossRef]
  40. Ourselin, S.; Emberton, M.; Vercauteren, T. From computer-assisted intervention research to clinical impact: The need for a holistic approach. Med. Image Anal. 2016, 33, 72–78. [Google Scholar] [CrossRef]
  41. Zhang, J.; Zhong, Y.; Gu, C. Deformable Models for Surgical Simulation: A Survey. IEEE Rev. Biomed. Eng. 2018, 11, 143–164. [Google Scholar] [CrossRef] [Green Version]
Figure 1. Definition of material zones in corneal finite element model (example with Navarro Geometry). Central, Nasal-Temporal, Superior-Inferior zones (Light Blue), Oblique Zones (Purple), Limbus (Red), and Transition zones (Blue).
Applsci 11 10819 g001
Figure 2. Preliminary stress calculation with displacement method.
Applsci 11 10819 g002
Figure 3. Calculation of stress distribution in measurement phase by prestress method.
Applsci 11 10819 g003
Figure 4. Stress distribution in measurement phase for Navarro’s Geometry. Displacement method (Upper), prestress method (Lower).
Applsci 11 10819 g004
Figure 5. Stress distribution in measurement phase for cornea G0. Displacement method (Upper), prestress method (Lower).
Applsci 11 10819 g005
Figure 6. Stress distribution in measurement phase for cornea G1. Displacement method (Upper), Prestress method (Lower).
Applsci 11 10819 g006
Figure 7. Von Mises strain distribution in measurement phase for Navarro’s geometry.
Applsci 11 10819 g007
Figure 8. Von Mises Strain distribution in measurement phase for G0 geometry.
Applsci 11 10819 g008
Figure 9. Von Mises Strain distribution in measurement phase for G1 geometry.
Applsci 11 10819 g009
Table 1. Materials’ constants for anisotropic hyperelastic materials definition.
Materials’ Constantsa1 (Pa)a2 (Pa)k1 (Pa)k2 (-)
Central, N-T and S-I Zones40,000−10,00050,000200
Transition Zones40,000−10,00037,500200
Central Oblique Zones40,000−10,00025,000200
Limbus40,000−10,00050,000200
N-T: Nasal-Temporal, S-I: Superior-Inferior.
Table 2. Maximum von Mises stress level in central zone of the cornea (Pa).
GeometryPatient-Specific IOP (Pa)Average Maximum von Mises Stress in the Central Zone (Pa)IOP (Pa)Average Maximum von Mises Stress in the Central Zone (Pa)
Navarro1515,8851515,885
G01819,5031516,253
G11619,6411518,413
Publisher’s Note: MDPI stays neutral with regard to jurisdictional claims in published maps and institutional affiliations.