Article

Far-Red Chlorophyll Fluorescence Radiance Tracks Photosynthetic Carbon Assimilation Efficiency of Dark Reactions

1
State Key Laboratory of Soil Erosion and Dryland Farming on the Loess Plateau, Institute of Soil and Water Conservation, Northwest A&F University, Yangling, Xianyang 712100, China
2
College of Natural Resources and Environment, Northwest A&F University, Yangling, Xianyang 712100, China
3
College of Forestry, Northwest A&F University, Yangling, Xianyang 712100, China
4
Key Laboratory of Water Cycle and Related Land Surface Processes, Institute of Geographic Sciences and Natural Resources Research, Chinese Academy of Sciences, Beijing 100101, China
5
School of Instrumentation Science and Opto-Electronics Engineering, Beihang University, Beijing 100083, China
*
Author to whom correspondence should be addressed.
Appl. Sci. 2021, 11(22), 10821; https://doi.org/10.3390/app112210821
Submission received: 9 October 2021 / Revised: 8 November 2021 / Accepted: 11 November 2021 / Published: 16 November 2021
(This article belongs to the Section Agricultural Science and Technology)

Abstract

:
Solar-induced chlorophyll fluorescence (SIF) observations from space have shown close relationships with terrestrial photosynthesis rates. SIF originates from the light reactions of photosynthesis, whereas carbon fixation takes place during the dark reactions of photosynthesis. Questions remain regarding whether SIF is able to track changes in the efficiency of the dark reactions in photosynthesis. Using concurrent measurements of leaf-scale gas exchange, pulse amplitude-modulated (PAM) fluorescence, and fluorescence spectral radiances, we found that both far-red fluorescence radiances and PAM fluorescence yields responded rapidly to changes in photosynthetic carbon assimilation due to changes in environmental factors or induced stomatal closure under constant light conditions. Uncertainties in outgoing and incoming irradiance mismatch for SIF measurements may very likely obscure the contributions of the dark reactions, thereby causing the inconsistent findings previously reported, which were no change in far-red SIF and PAM fluorescence yields after clear reductions in the photosynthetic carbon assimilation efficiency of dark reactions. Our results confirm that high-quality SIF measurements have the potential to provide insights into the dark reactions of photosynthesis. This study is particularly relevant for better interpreting satellite SIF observations that are obtained under roughly constant overpass times and relatively stable light intensities.

1. Introduction

Nearly all lives on Earth ultimately depend on energy from the sun. Photosynthesis is the only process that can convert light energy to chemical energy [1]. Photosynthesis consists of two sets of reactions: light reactions and dark reactions (the carbon reactions). In the light reactions, the photon energy absorbed by photosystem II (PSII) is consumed in three different pathways: photochemistry, fluorescence, and heat loss (nonphotochemical quenching, NPQ) [2,3]. In the photochemistry pathway, the absorbed light energy is used to remove an electron from H2O, generating linear electron transport from PSII to photosystem I (PSI) [4]. During this electron transport process, absorbed light energy is converted into chemical energy, producing NADPH (the reduced form of nicotine adenine dinucleotide phosphoric acid) and ATP (adenosine triphosphate) [5]. Meanwhile, about 1–2% of absorbed light energy is re-emitted as chlorophyll a fluorescence (ChlF) [6,7]. The probability of partitioning an absorbed photon in a given pathway is dependent on the amount of absorbed light and the efficiency of plant photochemical processes (e.g., the photochemical quantum yield of PSII (ΦPSII) and the fluorescence quantum yield (ΦChlF)) [7]. In the dark reactions, the energy stored in ATP and NADPH is then consumed to assimilate CO2 and produce carbohydrates, primarily glucose [8]. The processes in the dark reactions do not directly require light but are strongly regulated by temperature, water, nutrients, and CO2 from the environment [8].
Advances in observing solar-induced chlorophyll fluorescence (SIF) from space [9,10] have documented promise for improved mapping of global terrestrial gross primary productivity (GPP) [11,12,13,14,15,16,17,18,19,20,21]. Numerous studies have already reported that SIF and GPP are well correlated for a variety of terrestrial ecosystems. For example, Guanter et al. [22] showed that space-borne SIF observations exhibited good performance in estimating crop photosynthesis across the US Corn Belt region. Yang et al. [23] showed that ground-based SIF measurements exhibit a strong linear relationship with GPP at a deciduous forest site. It should be noted that fluorescence emanates from the light reactions, whereas the assimilation of CO2 is accomplished in the dark reactions of photosynthesis [7]. The difference in light and dark reactions naturally raises an important question: does ChlF respond to the efficiency of the dark reactions in photosynthesis? If the answer is no, it might suggest that the strong SIF–GPP correlations found in many previous studies are only because they have a shared driver, namely, absorbed photosynthetically active radiation (APAR). If the answer is yes, it indicates that SIF does provide direct insight into the processes occurring in the dark reactions, including gas exchange and carbon assimilation. This has important implications for better understanding the SIF–GPP relationship when APAR is not a major limiting factor. For instance, it can inform our interpretation of satellite SIF observations commonly acquired around noontime (high light) when the dark reactions of photosynthesis on top of the canopy tend to become more prominent. This is also particularly relevant in the context of rising temperatures and atmospheric CO2, as more climate extremes are likely to occur, but the variability of incident PAR will be relatively small [24].
Previous studies on this question have provided inconsistent results. Marrs et al. [25] found a significant decrease in photosynthetic CO2 assimilation as stomata closed, but no clear trend in fluorescence measurements, suggesting that SIF did not directly track carbon assimilation. Helm et al. [26] also reported that water stress caused a clear and fast decline in both net photosynthesis and stomatal conductance but had a smaller effect on SIF emission. They concluded that SIF may not track changes in photosynthesis due to stomatal closure as long as the light reactions of photosynthesis remained largely unchanged. However, Gu et al. [27] observed saturation of, or even a decrease in, canopy SIF under high irradiance. The saturation of canopy SIF was probably due to their bi-hemispheric instrument setup and the sensor–canopy geometry, but it also implied that SIF might respond to changes in the dark reactions because the SIF yields decreased at a higher light intensity at the top of the canopy [28]. This discrepancy may be partially due to the designs of SIF-observing systems and protocols for measurements [29]. Compared with SIF variability driven by incident light, the magnitude of changes in SIF in response to changes in the dark reactions is so subtle that it may be unobservable or uninterpretable for some measuring systems [30]. In order to quantify possible changes in ChlF due to changes in the dark reactions, all of the involved processes in both the light and dark reactions of photosynthesis should be carefully observed. Specifically, one should simultaneously obtain not only high-quality measurements of passive ChlF radiance and CO2 assimilation but also fluorescence parameters deriving from active pulse amplitude-modulated (PAM) ChlF yields under controlled conditions.
In this study, we developed a leaf-scale measurement system by integrating active (PAM fluorometer) and passive (spectrometer) instruments into a portable gas exchange system. We then used the system to carry out two controlled leaf-scale experiments under constant light conditions to answer the following questions: (1) How do measurements of passive and active ChlF, the derived photosynthetic parameters, and gas exchange measurements respond to changing CO2 concentrations and leaf temperatures? (2) How do these measurements/parameters vary after inducing stomatal closure? We show how leaf-scale energy partitioning changes due to changes in the dark reactions of photosynthesis and relate it to previous studies reporting seemingly inconsistent results. We also discuss the key requirements needed for an SIF observing system to accurately track changes in the dark reactions of photosynthesis under natural conditions.

2. Materials and Methods

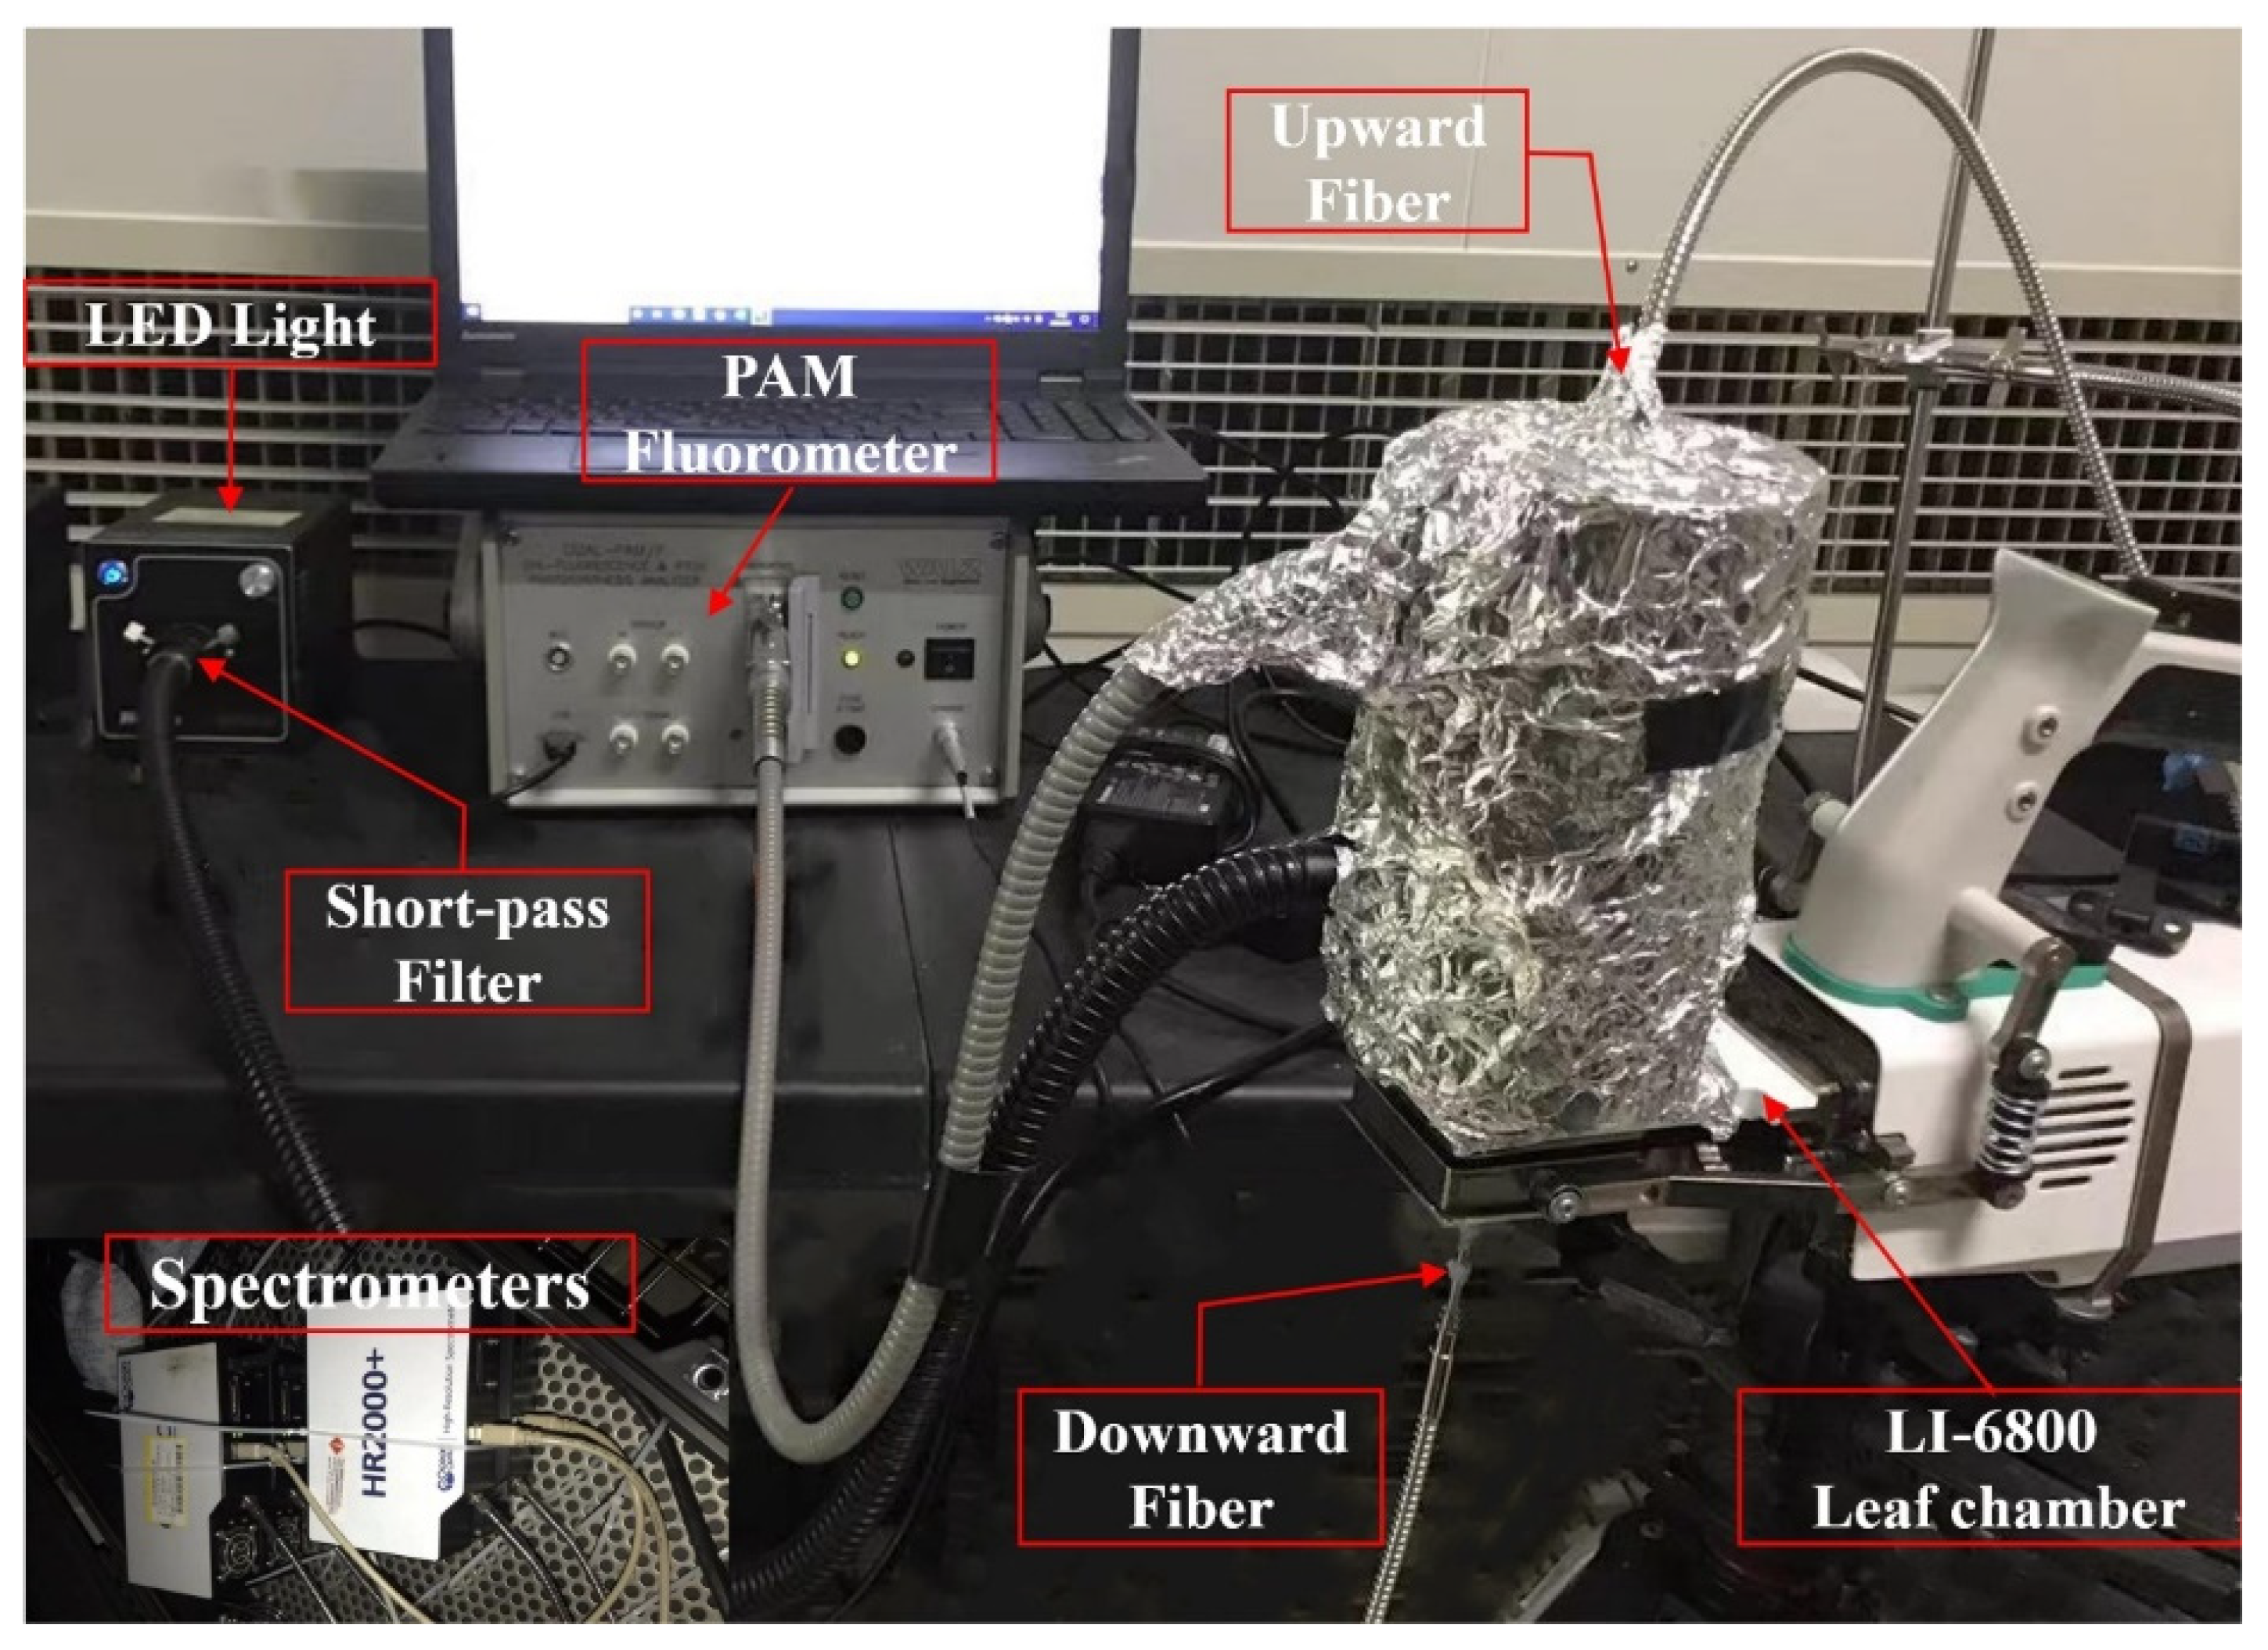
2.1. Leaf-Scale Measurement System Setup

We developed a leaf-scale measurement system to concurrently measure CO2 assimilation, active ChlF yields, and passive ChlF radiances from both adaxial and abaxial leaf sides, which was similar to the instrument in Magney et al. [31]. A gas exchange system was modified to integrate one external LED light source, one PAM fluorometer, and four spectrometers (Figure 1). The main components included: (1) an LI-6800 portable gas exchange system with a clear-top leaf chamber (LI-COR Biosciences, Lincoln, NE, USA), (2) a DUAL-PAM-100 portable fluorometer (Heinz Walz GmbH, Effeltrich, Germany) measuring active ChlF yields, (3) two QEpro spectrometers (Ocean Optics, Dunedin, FL, USA; 630–860 nm, 0.24 nm spectral resolution) measuring backward and forward ChlF emissions in the 640–850 nm region, and (4) a white LED fiber optic O-ring light (S5000, Nanjing Hecho Technology Co., Ltd., Nanjing, China) with a 625 nm short-pass filter (Edmunds Optics, Barrington, NJ, USA).
The top of the leaf chamber was equipped with two vertical airtight slots (Figure 2). One was installed on the top of the leaf chamber, fitting the bundled fiber optic for two spectrometers (backward spectral radiance) and housing the fiber optic of the PAM fluorometer; the second slot was on the bottom of the leaf chamber to fit another bundled fiber optic for the two spectrometers (forward spectral radiance). The top and bottom fibers were aligned to capture the exact same footprint from both sides of a leaf and remained stable during the measurements. The O-ring LED light was horizontally placed above the leaf chamber such that the entire leaf surface was illuminated. A short-pass filter could be inserted into the connector between the LED light sources and the O-ring fiber optic that blocks the incoming light above 625 nm. Using this system, we could simultaneously measure leaf-scale passive and active ChlF, reflected and transmitted radiance, and gas exchange measurements under controlled environmental conditions.

2.2. Experimental Design

The experiment was conducted at the State Key Laboratory of Soil Erosion and Dryland Farming on the Loess Plateau, Northwest A&F University, Yangling, China, from October to December in 2020. Both maize (Zea mays L.) and soybean (Glycine max Linn. Merr.) were grown in a climate chamber under the following conditions: 12 h light/12 h dark, 800 μmol m−2 s−1 irradiance, 25 °C, and 50% relative humidity.

2.2.1. Synchronous Measurements of CO2 and Temperature Curve

Measurements were collected on attached and healthy leaves of maize and soybean. After a >1 h dark adaptation period, a saturation flash from the PAM fluorometer was used to determine minimal fluorescence (Fo) and maximal fluorescence in the dark (Fm) of dark-adapted leaves. One minute later, the dark respiration (Rd, μmol m−2 s−1) at the leaf temperature of 25 °C was recorded by the gas exchange system. Next, the leaves were equilibrated inside the synchronous chamber at a CO2 concentration of 400 μmol mol−1 and under an illumination of 800 μmol m−2 s−1 (soybean) and 1200 μmol m−2 s−1 (maize) for at least 30 min to reach a stable CO2 assimilation. These two high light intensities were kept constant because the impact of the dark reaction aspects of photosynthesis becomes more marked at high light. For both species, the temperature and the CO2 response curves were measured for each leaf and repeated for three individual leaves. During the measurements, the gas exchange system was set to a constant flow rate of 500 μmol s−1 and a relative humidity of 50%. For the CO2 curve, the leaf temperature was set at 25 °C, and air CO2 concentrations were manually adjusted as follows (in ppm): 50, 100, 200, 300, 400, 500, 700, 900, 1200; for the temperature curve, the air CO2 concentration was set at 400 ppm, and leaf temperatures were manually adjusted as follows (in °C): 15, 20, 25, 30, 35, 40.
Through the procedure of determining CO2 and temperature response curves, spectral measurements (reflected radiance, transmitted radiance, backward–forward fluorescence spectral radiant energy flux) were constantly recorded at 1 s intervals. In this study, we focused on the total fluorescence radiant energy flux emitted from both abaxial and adaxial surfaces of a leaf at one oxygen absorption line frequently used in SIF-related applications, namely, 760 nm (TChlF760, mW m−2 nm−1 sr−1). We also estimated the fluorescence quantum yield at 760 nm (ΦChlF_760) from leaf reflectance (R) and transmittance (T), which is described in Text S1. Note that TChlF760 comes from both upper and deeper leaf layers, and thus it is also affected by the inner leaf structure and leaf pigment content [31]. To better interpret passive ChlF radiance, steady-state fluorescence emission (Fs) induced by the measuring beam of the PAM fluorometer was also included in this study. Compared with passive ChlF, Fs mainly comes from the upper leaf surface such that it is less likely to be reabsorbed/scattered. Maximal fluorescence emissions in the dark-adapted and light-adapted states (Fm and Fm′) from PAM were also collected for 45 s and were used to calculate the required photosynthetic parameters, including NPQ and the photochemical quantum yield of PSII (ΦPSII), which are expressed as [32,33]
NPQ = F m F m F m
Φ PSII = F m F s F m
The net CO2 assimilation rate (Anet, μmol m−2 s−1) and stomatal conductance to water vapor (gsw, mol m−2 s−1) provided by the gas exchange system were automatically stored every 5 s. Leaf-scale gross CO2 assimilation (AG, μmol m−2 s−1) was obtained from gas exchange measurements:
A G = A net + R d
where Rd is dark respiration (μmol m−2 s−1) measured in a period of darkness. All measured variables and related equipment are listed in Table 1. For the temperature response curves, leaf respiration was estimated by using the global polynomial respiration–temperature model [34]. To ensure that the gas exchange and fluorescence conditions were stable, measurements for CO2 and temperature curves were performed after waiting at least 5 min between CO2 changes, and after waiting at least 10 min between temperature changes, respectively. We then extracted spectral radiance immediately before the saturation pulse as the steady-state spectral measurements.

2.2.2. Synchronous Measurements after ABA Treatment

To determine the response of ChlF emission to inducing stomatal closure (i.e., the decrease in the dark reactions), we also obtained measurements of gas exchange, spectral ChlF, reflectance, transmittance, and PAM fluorescence before and after adding the plant hormone abscisic acid (ABA, Sigma-Aldrich, St. Louis, MO, USA; purity ≥ 99%). To do so, we followed the protocol proposed by Ceciliato et al. [35] to measure the time-resolved stomatal conductance response to ABA in intact leaves. Because this method is only suitable for leaves with long petioles (leaf stalks), we only included soybean leaves in this experiment. Petioles of soybean leaves were cut and immediately submerged in deionized water. Petioles were then cut a second time under water and transferred to a microcentrifuge tube with the petiole tips submerged in water [35]. Before the beginning of the experiments, leaves attached with a microcentrifuge tube were placed inside the modified leaf chamber and equilibrated for at least 45 min to reach a stable CO2 assimilation and stomatal conductance. Concurrent measurements were recorded for at least 30 min at a steady-state level prior to the addition of ABA. Hereafter, ABA was added to the deionized water in the microcentrifuge tube, reaching a concentration of 10 µM. Concurrent measurements were then recorded for at least 30 min. All of the measurements for pre-treatment and post-treatment of ABA were conducted under the following conditions: the LED light source was set at 800 μmol m−2 s−1, leaf temperature was 25 °C, relative humidity in the chamber was 50%, and a constant flow rate of 500 μmol s−1 was maintained.

3. Results

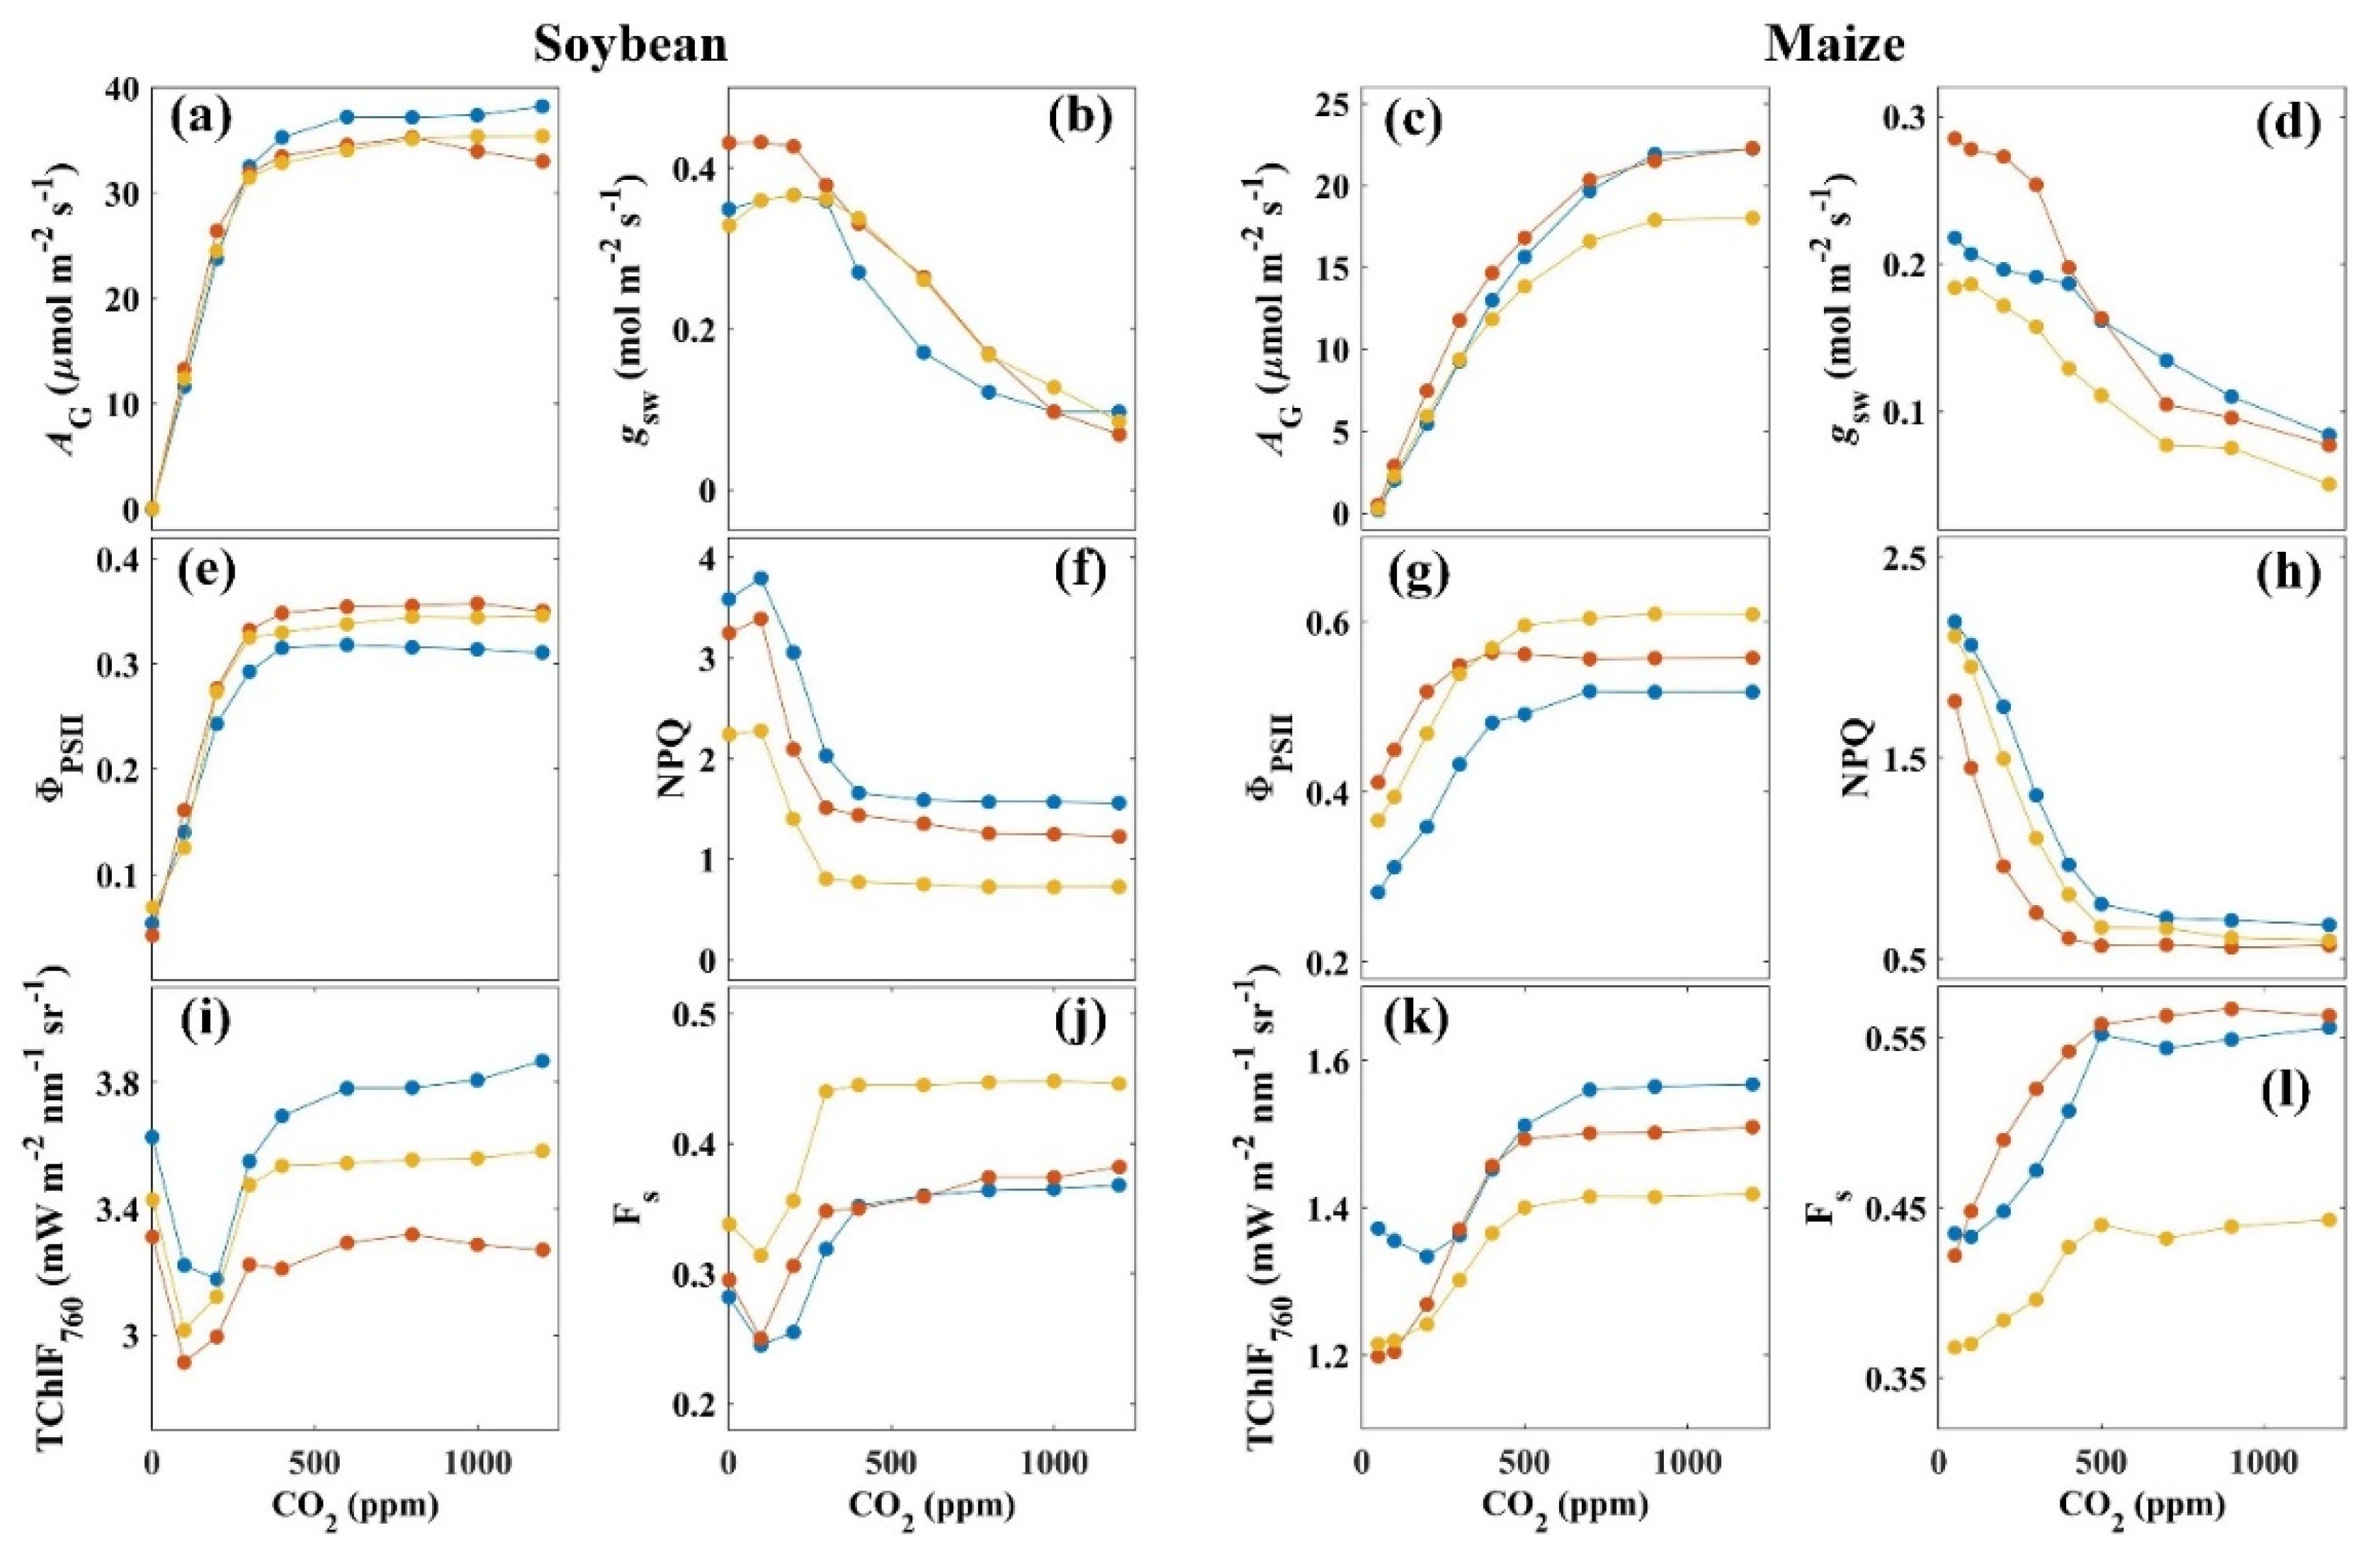
3.1. Effects of CO2 Concentration on the Variations in Carbon Assimilation and Fluorescence Emission

For the CO2 curves with constant irradiance, the proxies of photosynthetic capacity including AG and ΦPSII for soybean (Figure 3a,e) and maize (Figure 3c,g) increased with increasing CO2, until plateaus occurred at a CO2 concentration of about 500 ppm. However, gsw curves declined continuously to nearly 0 in response to the increased CO2 concentration (Figure 3b,d). Except for abrupt increases at the lowest CO2 concentrations (<50 ppm) of maize, TChlF760 and Fs for both species responded similarly: they continuously increased until the external concentration was around 500 ppm CO2 (Figure 3j–l). With the increases in both AG and TChlF760 (Fs), steep decreases in NPQ were observed, as expected, but no adjustments in leaf-level energy partitioning were found when the CO2 concentration exceeded 500 ppm (Figure 3f,h). Excluding measurements at low CO2 concentrations (<50 ppm), TChlF760 of soybean and maize was highly correlated with AG, with R2 = 0.96 and R2 = 0.87, respectively (Table 2); Fs also explained 94% and 95% of the variability in the AG measurements for soybean and maize, respectively (Table 2).

3.2. Effects of Temperature on the Variations in Carbon Assimilation and Fluorescence Emission

For the temperature response of CO2 assimilation, soybean AG and gsw showed a bell-shaped response to leaf temperatures (Tleaf), with an optimum temperature (Topt) at around 25 °C (Figure 4a,b). The temperature response curves of soybean ΦPSII were also symmetrical but more shallow, showing that the potential range of Topt for soybean ΦPSII was likely broader (Figure 4e). Soybean NPQ changed with changing Tleaf in an opposite direction to AG (Figure 4f), exhibiting a bowl-like shape, and the net effect of AG and NPQ on fluorescence flux tended to diminish. As a result, TChlF760 and Fs of soybean appeared to be sensitive to varying leaf temperatures (Tleaf < 30 °C) when the light intensity was fixed (Figure 4i,j). Maize showed higher Topt and CO2 fixation rates at Topt: AG and ΦPSII of maize increased rapidly with increasing Tleaf below Topt, and they tended to stabilize or slightly decrease at high Tleaf (Figure 4c,g). The temperature dependency of maize NPQ also followed a bowl-shaped optimum curve, but with a more asymmetrical pattern than observed for soybean (Figure 4h). At variable Tleaf and a fixed light intensity, TChlF760 accounted for more than 92% of the variability in AG (Table 2). By contrast, Fs showed an unstable predictive power, accounting for 89% of the variability in soybean AG, compared with 71% for maize AG (Table 2). This variation was possibly due to the fluorescence measurements probing a small leaf area, while gas exchange techniques provide an integrated measurement over an entire leaf.

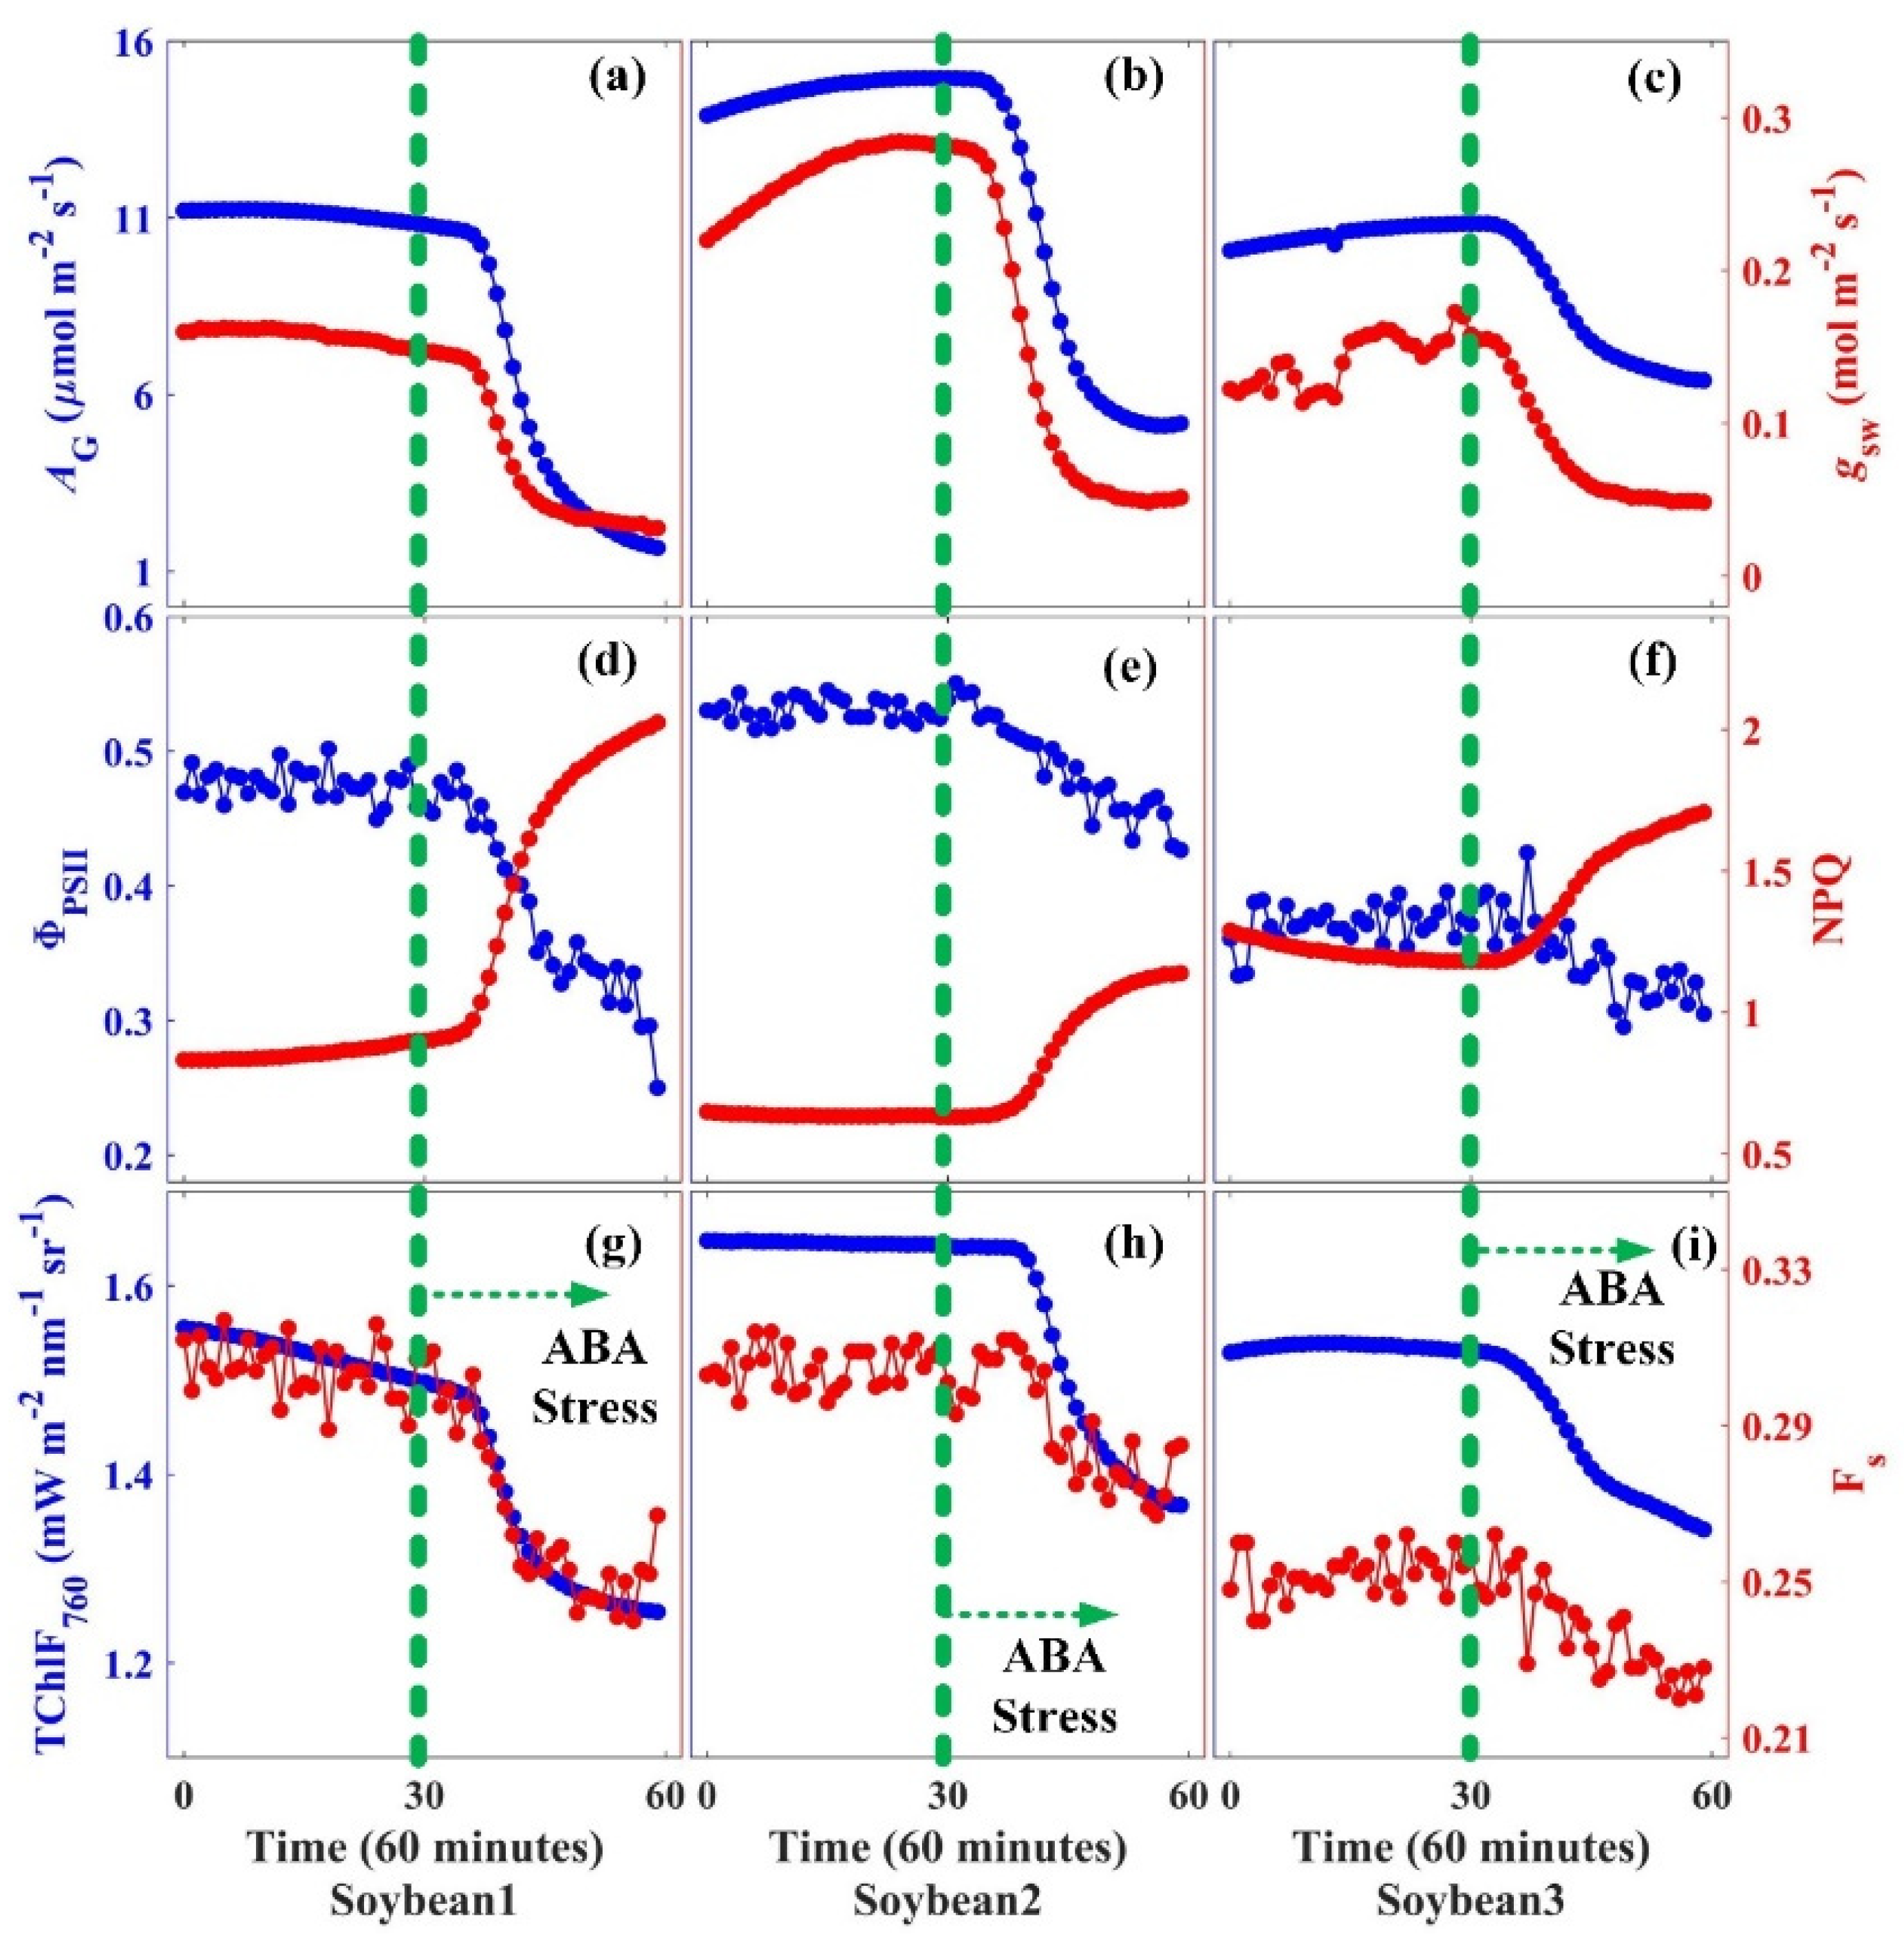
3.3. Effects of Stomatal Closure on the Variations in Carbon Assimilation and Fluorescence Emission

An apparent decrease in both AG and gsw was observed within 30 min after ABA addition (Figure 5a–c), confirming that the ABA treatment effectively induced stomatal closure and inhibited leaf CO2 assimilation. Moreover, in the context of the energy distribution in these treatment leaves, a similarly large reduction was also observed in ΦPSII (Figure 5d–f), thereby revealing the decline in photochemical quenching and lower light use efficiency of PSII. As a compensating pathway for dissipating the extra energy that could not be used in photochemistry, NPQ showed a significant increase following treatment (Figure 5d–f). More importantly, the apparent decreases in both TChlF760 and Fs were consistently observed for all three ABA-treated leaves (Figure 5g–i): TChlF760 and Fs decreased by 15.4 ± 2.0% and 13.5 ± 3.0%, respectively, after the treatment. We found that ChlF emission was well correlated with CO2 fixation rates during stomatal closure invoked by ABA: TChlF760 explained 99% and 73% of the variability in AG after the treatment. These results confirm that far-red fluorescence radiance could respond to the ABA treatments, resulting in a reduction in the efficiency of dark reactions.

4. Discussion and Conclusions

Marrs et al. [25] showed that leaf-scale fluorescence signals (SIF and Fs) did not exhibit a clear trend after stomatal closure, suggesting that changes in SIF emissions only responded to changes in the light reactions of photosynthesis. They further hypothesized that the linearity between SIF and GPP observed in many previous studies resulted from a shared driver: APAR. However, our results show that both ChlF and Fs could track changes in the photosynthetic CO2 rate due to variations in the CO2 concentration and leaf temperature under constant light conditions. Further, we observed a significant reduction in both ChlF(Fs) and AG after inducing stomatal closure. Our findings, in contrast, suggest that changes in SIF can not only track the impacts of stresses on the light reactions of photosynthesis but also offer relevant insight into carbon assimilation.
Under steady-state conditions, the efficiencies of the light and dark reactions would coordinate with each other to optimally match the surrounding environmental conditions and internal substrate availability [36]. Downregulation or upregulation of the photochemical quantum yield should accompany the inhibition or promotion of light reaction centers, resulting in variations in the fluorescence intensity and NPQ. However, changes in the SIF magnitude related to changes in the overall efficiency of the dark reactions should be limited. Our experiment showed that the variations in ChlF and Fs were less than 22% in response to the experimental treatments. It should also be noted that the light intensities were kept constant in this study. Further research is needed to quantify the contribution of the dark reactions to SIF emissions under other light levels.
Marrs et al. [25] used a two-spectrometer approach to retrieve SIF at O2-A absorption, that is, two spectrometers were used to measure incoming solar irradiance (EI) and outgoing radiance from the canopy (EO). As described by Gu et al. [27], however, it is virtually impossible to perform a precise cross-calibration between the upwelling and downwelling channels, and therefore EI and EO measurements are not sufficiently compatible for retrieving SIF emissions. To analyze the SIF response to factors other than incident PAR, it is important to reduce (or normalize) the impact of the variations in incoming irradiance. Although Marrs et al. [25] tried to minimize the impact of varying PAR by performing the pre/post-treatment measurements at nearly the same time (but on a different date), their strategy may not effectively rule out uncertainties such as cloud passages that may result in fluctuating light conditions. Considering these issues in their experiment, it is unlikely that they could accurately identify the response of the dark reactions of photosynthesis from their measurements. Helm et al. [26] suggested that SIF was mainly controlled by the light reactions, and the fluorescence response occurred much later than the stomatal response. However, most of SIF and SIF yields in their study showed a large standard deviation of about 30% of their mean values, most likely caused by large differences among the samples. Thus, the simultaneous SIF response to stomatal closure might be overwhelmed by their large standard deviations.
Our experiments also showed that changes in ΦChlF and ΦPSII are largely congruent under constant light, suggesting that both of them have a similar response to changes in the dark reactions. This appeared to be inconsistent with previous studies that reported the decoupling of SIF emissions and the carbon reactions of photosynthesis under certain conditions. For example, SIF emissions showed a rapid increase shortly after the application of a herbicide, resulting in a large reduction in CO2 assimilation rates [37]. Liu et al. [38] showed that the GPP of C3 crops exhibited so-called ‘midday depression’, a stable or even decreasing trend in photosynthesis at high light, whereas an increase in the SIF curve was observed. Kim et al. [39] reported a strongly non-linear relationship between GPP and SIF in an evergreen needleleaf forest based on tower observations, where GPP exhibited a saturation pattern under high-light conditions, while SIF did not.
We propose that these findings are not contradictory to our results. In the application of the herbicide, the electron transport chain was blocked such that carbon assimilation decreased and SIF emissions were triggered as one of the de-excited paths to quickly dissipate absorbed excessive light energy, causing a divergence in the SIF–GPP relationship over short time scales. In contrast, the electron transport was not inhibited in the ABA treatment, and the feedback between light and dark reactions still remained normal. Although Liu et al. [38] used one single spectrometer in their field experiment, avoiding wavelength mismatch between EI and EO [27], the uncertainties in their SIF observations due to the too long basic set sampling time (30 min) may very likely have caused the impact of the dark reactions to be indistinguishable. It is worth noting that Kim et al. [39] also reported that leaf-level ΦChlF exhibited a negative response to light intensity. This somewhat counterintuitive linkage between decreasing photosynthesis, increasing SIF, and decreasing SIF yield could be explained by the different sensitivity of ΦPSII and ΦChlF to light levels: ΦPSII shows a much steeper decline than ΦChlF in response to increasing stress levels such as light intensities [36]. As a consequence, the small decrease in ΦChlF may be overwhelmed by the large increase in PAR, with the net effect of an increase in SIF emissions. Taken together, a well-designed SIF-observing system should have the potential to detect the contributions of the dark reactions of photosynthesis under field conditions. A tower-based canopy SIF system called FAME, developed very recently by Gu et al. [27], significantly improved both the hardware and software designs, and their measurements showed that canopy-leaving directional SIF emissions saturated or even decreased at high light. In a recent high-temperature experiment, Kimm et al. [30] found that both light use efficiency and SIF yield decreased with increasing heat stress when PAR was not a limiting factor. These two studies highlighted the role of the dark reactions in the partitioning of absorbed solar radiation to the different pathways.
Our experiments confirm that SIF had the capacity to track changes in the dark reactions of photosynthesis—in other words, the gas exchange and carbon assimilation of plants. A well-designed measurement system with the ability to measure EI and EO almost simultaneously is needed to fully realize its potential. This study highlights the role of the dark reactions that have been ignored or misinterpreted in previous studies and will support our understanding of how elevated CO2 concentrations and warming under future climate change influence photosynthesis activities.

Supplementary Materials

The following are available online at https://www.mdpi.com/article/10.3390/app112210821/s1, Text S1: Fluorescence quantum yield, Figure S1: Fluorescence yield at 760 nm (ΦChlF_760) with CO2 concentrations (ppm) measured on three leaves of soybean (left column) and maize (right column) under illumination of 800 (soybean) and 1200 (maize) μmol m−2 s−1, Figure S2: Fluorescence yield at 760 nm (ΦChlF_760) with leaf temperature (T, °C) measured on three leaves of soybean (left column) and maize (right column) under illumination of 800 (soybean) and 1200 (maize) μmol m−2 s−1, Figure S3: Fluorescence yield at 760 nm (ΦChlF_760) for pre-treatment and post-treatment of abscisic acid (ABA) under the illumination of 800 μmol m−2 s−1. The vertical green dashed line indicates the start of ABA treatment.

Author Contributions

Conceptualization, Z.L. and X.L.; methodology, Z.L. and C.G.; investigation, Z.L., C.G., Y.B. and N.Z.; writing—original draft preparation, Z.L.; writing—review and editing, Z.L., F.Z. and X.L.; supervision, X.L. and Q.Y.; project administration, X.L.; funding acquisition, Z.L. and X.L. All authors have read and agreed to the published version of the manuscript.

Funding

This research was funded by the National Natural Science Foundation of China, grant numbers 41901293 and 42071328, the China Postdoctoral Science Foundation, grant number 2019M663828, and the Chinese Universities Scientific Fund, grant number 24520212452021125.

Data Availability Statement

Data supporting the conclusions of this manuscript may be accessed through the Harvard Dataverse at https://dataverse.harvard.edu/privateurl.xhtml?token=bf5bab38-0bdf-49a7-b3a6-37e9557157f7.

Acknowledgments

We thank Juan Chen, Xuanbin Xu, and Juan Xie for administrative and technical support.

Conflicts of Interest

The authors declare no conflict of interest.

References

  1. Baker, N.R. Chlorophyll fluorescence: A probe of photosynthesis in vivo. Annu. Rev. Plant Biol. 2008, 59, 89–113. [Google Scholar] [CrossRef] [Green Version]
  2. Porcar-Castell, A.; Tyystjärvi, E.; Atherton, J.; van der Tol, C.; Flexas, J.; Pfündel, E.E.; Moreno, J.; Frankenberg, C.; Berry, J.A. Linking chlorophyll a fluorescence to photosynthesis for remote sensing applications: Mechanisms and challenges. J. Exp. Bot. 2014, 65, 4065–4095. [Google Scholar] [CrossRef] [PubMed]
  3. Schreiber, U.; Schliwa, U.; Bilger, W. Continuous recording of photochemical and non-photochemical chlorophyll fluorescence quenching with a new type of modulation fluorometer. Photosynth. Res. 1986, 10, 51–62. [Google Scholar] [CrossRef] [PubMed]
  4. Butler, W.L. Energy Distribution in the Photochemical Apparatus of Photosynthesis. Annu. Rev. Plant Physiol. 1978, 29, 345–378. [Google Scholar] [CrossRef]
  5. Krause, G.H.; Weis, E. Chlorophyll Fluorescence and Photosynthesis: The Basics. Annu. Rev. Plant Biol. 1991, 42, 313–349. [Google Scholar] [CrossRef]
  6. Mohammed, G.H.; Colombo, R.; Middleton, E.M.; Rascher, U.; van der Tol, C.; Nedbal, L.; Goulas, Y.; Pérez-Priego, O.; Damm, A.; Meroni, M.; et al. Remote Sensing of Solar-Induced Chlorophyll Fluorescence (Sif) in Vegetation: 50 Years of Progress. Remote Sens. Environ. 2019, 231, 111177. [Google Scholar] [PubMed]
  7. Papageorgiou, G.C. Chlorophyll a Fluorescence: A Signature of Photosynthesis; Springer: Dordrecht, The Netherlands, 2004; Volume 19. [Google Scholar]
  8. Von Caemmerer, S. Biochemical Models of Leaf Photosynthesis; The Sax Institute: Glebe, Australia, 2000. [Google Scholar]
  9. Sun, Y.; Frankenberg, C.; Jung, M.; Joiner, J.; Guanter, L.; Köhler, P.; Magney, T. Overview of Solar-Induced chlorophyll Fluorescence (SIF) from the Orbiting Carbon Observatory-2: Retrieval, cross-mission comparison, and global monitoring for GPP. Remote Sens. Environ. 2018, 209, 808–823. [Google Scholar] [CrossRef]
  10. Köehler, P.; Frankenberg, C.; Magney, T.S.; Guanter, L.; Joiner, J.; Landgraf, J. Global Retrievals of Solar-Induced Chlorophyll Fluorescence With TROPOMI: First Results and Intersensor Comparison to OCO-2. Geophys. Res. Lett. 2018, 45, 456–463. [Google Scholar] [CrossRef] [Green Version]
  11. Du, S.; Liu, L.; Liu, X.; Zhang, X.; Gao, X.; Wang, W. The Solar-Induced Chlorophyll Fluorescence Imaging Spectrometer (SIFIS) Onboard the First Terrestrial Ecosystem Carbon Inventory Satellite (TECIS-1): Specifications and Prospects. Sensors 2020, 20, 815. [Google Scholar] [CrossRef] [Green Version]
  12. Guanter, L.; Frankenberg, C.; Dudhia, A.; Lewis, P.; Gómez-Dans, J.; Kuze, A.; Suto, H.; Grainger, R. Retrieval and global assessment of terrestrial chlorophyll fluorescence from GOSAT space measurements. Remote Sens. Environ. 2012, 121, 236–251. [Google Scholar] [CrossRef]
  13. He, L.; Magney, T.; Dutta, D.; Yin, Y.; Köhler, P.; Grossmann, K.; Stutz, J.; Dold, C.; Hatfield, J.; Guan, K.; et al. From the Ground to Space: Using Solar-Induced Chlorophyll Fluorescence to Estimate Crop Productivity. Geophys. Res. Lett. 2020, 47, e2020GL087474. [Google Scholar] [CrossRef]
  14. Jeong, S.-J.; Schimel, D.; Frankenberg, C.; Drewry, D.T.; Fisher, J.B.; Verma, M.; Berry, J.A.; Lee, J.-E.; Joiner, J. Application of satellite solar-induced chlorophyll fluorescence to understanding large-scale variations in vegetation phenology and function over northern high latitude forests. Remote Sens. Environ. 2017, 190, 178–187. [Google Scholar] [CrossRef]
  15. Joiner, J.; Yoshida, Y.; Vasilkov, A.; Schaefer, K.; Jung, M.; Guanter, L.; Zhang, Y.; Garrity, S.; Middleton, E.; Huemmrich, K.; et al. The seasonal cycle of satellite chlorophyll fluorescence observations and its relationship to vegetation phenology and ecosystem atmosphere carbon exchange. Remote Sens. Environ. 2014, 152, 375–391. [Google Scholar] [CrossRef] [Green Version]
  16. Magney, T.S.; Barnes, M.L.; Yang, X. On the Covariation of Chlorophyll Fluorescence and Photosynthesis across Scales. Geophys. Res. Lett. 2020, 47, e2020GL091098. [Google Scholar] [CrossRef]
  17. Magney, T.S.; Bowling, D.R.; Logan, B.; Grossmann, K.; Stutz, J.; Blanken, P.D.; Burns, S.P.; Cheng, R.; Garcia, M.A.; Kӧhler, P.; et al. Mechanistic evidence for tracking the seasonality of photosynthesis with solar-induced fluorescence. Proc. Natl. Acad. Sci. USA 2019, 116, 11640–11645. [Google Scholar] [CrossRef] [Green Version]
  18. Porcar-Castell, A.; Malenovský, Z.; Magney, T.; Van Wittenberghe, S.; Fernández-Marín, B.; Maignan, F.; Zhang, Y.; Maseyk, K.; Atherton, J.; Albert, L.P.; et al. Chlorophyll a fluorescence illuminates a path connecting plant molecular biology to Earth-system science. Nat. Plants 2021, 7, 998–1009. [Google Scholar] [CrossRef] [PubMed]
  19. Qiu, B.; Li, W.; Wang, X.; Shang, L.; Song, C.; Guo, W.; Zhang, Y. Satellite-observed solar-induced chlorophyll fluorescence reveals higher sensitivity of alpine ecosystems to snow cover on the Tibetan Plateau. Agric. For. Meteorol. 2019, 271, 126–134. [Google Scholar] [CrossRef]
  20. Sun, Y.; Frankenberg, C.; Wood, J.D.; Schimel, D.S.; Jung, M.; Guanter, L.; Drewry, D.T.; Verma, M.; Porcar-Castell, A.; Griffis, T.J.; et al. OCO-2 advances photosynthesis observation from space via solar-induced chlorophyll fluorescence. Science 2017, 358, eaam5747. [Google Scholar] [CrossRef] [Green Version]
  21. Wang, J.; Lu, S.; Wang, W.; Tang, L.; Ma, S.; Wang, Y. Estimating vegetation productivity of urban regions using sun-induced chlorophyll fluorescence data derived from the OCO-2 satellite. Phys. Chem. Earth Parts A/B/C 2019, 114, 102783. [Google Scholar] [CrossRef]
  22. Guanter, L.; Zhang, Y.; Jung, M.; Joiner, J.; Voigt, M.; Berry, J.A.; Frankenberg, C.; Huete, A.R.; Zarco-Tejada, P.; Lee, J.-E.; et al. Global and time-resolved monitoring of crop photosynthesis with chlorophyll fluorescence. Proc. Natl. Acad. Sci. USA 2014, 111, E1327–E1333. [Google Scholar] [CrossRef] [Green Version]
  23. Yang, X.; Tang, J.; Mustard, J.F.; Lee, J.-E.; Rossini, M.; Joiner, J.; Munger, J.W.; Kornfeld, A.; Richardson, A.D. Solar-induced chlorophyll fluorescence that correlates with canopy photosynthesis on diurnal and seasonal scales in a temperate deciduous forest. Geophys. Res. Lett. 2015, 42, 2977–2987. [Google Scholar] [CrossRef]
  24. Wohlfahrt, G.; Gerdel, K.; Migliavacca, M.; Rotenberg, E.; Tatarinov, F.; Müller, J.D.; Hammerle, A.; Julitta, T.; Spielmann, F.M.; Yakir, D. Sun-induced fluorescence and gross primary productivity during a heat wave. Sci. Rep. 2018, 8, 14169. [Google Scholar] [CrossRef]
  25. Marrs, J.K.; Reblin, J.S.; Logan, B.A.; Allen, D.W.; Reinmann, A.B.; Bombard, D.M.; Tabachnik, D.; Hutyra, L.R. Solar-Induced Fluorescence Does Not Track Photosynthetic Carbon Assimilation Following Induced Stomatal Closure. Geophys. Res. Lett. 2020, 47, e2020GL087956. [Google Scholar] [CrossRef]
  26. Helm, L.T.; Shi, H.; Lerdau, M.T.; Yang, X. Solar-induced chlorophyll fluorescence and short-term photosynthetic response to drought. Ecol. Appl. 2020, 30, e02101. [Google Scholar] [CrossRef] [PubMed]
  27. Gu, L.; Wood, J.D.; Chang, C.Y.; Sun, Y.; Riggs, J.S. Advancing Terrestrial Ecosystem Science with a Novel Automated Measurement System for Sun-Induced Chlorophyll Fluorescence for Integration With Eddy Covariance Flux Networks. J. Geophys. Res. Biogeosci. 2019, 124, 127–146. [Google Scholar] [CrossRef] [Green Version]
  28. Chang, C.Y.; Wen, J.; Han, J.; Kira, O.; LeVonne, J.; Melkonian, J.; Riha, S.J.; Skovira, J.; Ng, S.; Gu, L.; et al. Unpacking the drivers of diurnal dynamics of sun-induced chlorophyll fluorescence (SIF): Canopy structure, plant physiology, instrument configuration and retrieval methods. Remote Sens. Environ. 2021, 265, 112672. [Google Scholar] [CrossRef]
  29. Marrs, J.K.; Jones, T.S.; Allen, D.W.; Hutyra, L.R. Instrumentation sensitivities for tower-based solar-induced fluorescence measurements. Remote Sens. Environ. 2021, 259, 112413. [Google Scholar] [CrossRef]
  30. Kimm, H.; Guan, K.; Burroughs, C.H.; Peng, B.; Ainsworth, E.A.; Bernacchi, C.J.; Moore, C.E.; Kumagai, E.; Yang, X.; Berry, J.A.; et al. Quantifying high-temperature stress on soybean canopy photosynthesis: The unique role of sun-induced chlorophyll fluorescence. Glob. Chang. Biol. 2021, 27, 2403–2415. [Google Scholar] [CrossRef]
  31. Magney, T.; Frankenberg, C.; Fisher, J.B.; Sun, Y.; North, G.B.; Davis, T.S.; Kornfeld, A.; Siebke, K. Connecting active to passive fluorescence with photosynthesis: A method for evaluating remote sensing measurements of Chl fluorescence. New Phytol. 2017, 215, 1594–1608. [Google Scholar] [CrossRef] [Green Version]
  32. Bilger, W.; Björkman, O. Role of the Xanthophyll Cycle in Photoprotection Elucidated by Measurements of Light-Induced Absorbance Changes, Fluorescence and Photosynthesis in Leaves of Hedera Canariensis. Photosynth. Res. 1990, 25, 173–185. [Google Scholar] [CrossRef]
  33. Genty, B.; Briantais, J.-M.; Baker, N.R. The relationship between the quantum yield of photosynthetic electron transport and quenching of chlorophyll fluorescence. Biochim. Et Biophys. Acta (BBA)-Gen. Subj. 1989, 990, 87–92. [Google Scholar] [CrossRef]
  34. Heskel, M.; O’Sullivan, O.S.; Reich, P.; Tjoelker, M.; Weerasinghe, L.K.; Penillard, A.; Egerton, J.J.G.; Creek, D.; Bloomfield, K.J.; Xiang, J.; et al. Convergence in the temperature response of leaf respiration across biomes and plant functional types. Proc. Natl. Acad. Sci. USA 2016, 113, 3832–3837. [Google Scholar] [CrossRef] [PubMed] [Green Version]
  35. Ceciliato, P.H.O.; Zhang, J.; Liu, Q.; Shen, X.; Hu, H.; Liu, C.; Schäffner, A.R.; Schroeder, J.I. Intact leaf gas exchange provides a robust method for measuring the kinetics of stomatal conductance responses to abscisic acid and other small molecules in Arabidopsis and grasses. Plant Methods 2019, 15, 38. [Google Scholar] [CrossRef] [PubMed] [Green Version]
  36. Gu, L.; Han, J.; Wood, J.D.; Chang, C.Y.; Sun, Y. Sun-induced Chl fluorescence and its importance for biophysical modeling of photosynthesis based on light reactions. New Phytol. 2019, 223, 1179–1191. [Google Scholar] [CrossRef] [Green Version]
  37. Pinto, F.; Celesti, M.; Acebron, K.; Alberti, G.; Cogliati, S.; Colombo, R.; Juszczak, R.; Matsubara, S.; Miglietta, F.; Palombo, A.; et al. Dynamics of Sun-Induced Chlorophyll Fluorescence and Reflectance to Detect Stress-Induced Variations in Canopy Photosynthesis. Plant Cell Environ. 2020, 43, 1637–1654. [Google Scholar] [CrossRef]
  38. Liu, L.; Guan, L.; Liu, X. Directly estimating diurnal changes in GPP for C3 and C4 crops using far-red sun-induced chlorophyll fluorescence. Agric. For. Meteorol. 2017, 232, 1–9. [Google Scholar] [CrossRef]
  39. Kim, J.; Ryu, Y.; Dechant, B.; Lee, H.; Kim, H.S.; Kornfeld, A.; Berry, J.A. Solar-induced chlorophyll fluorescence is non-linearly related to canopy photosynthesis in a temperate evergreen needleleaf forest during the fall transition. Remote Sens. Environ. 2021, 258, 112362. [Google Scholar] [CrossRef]
Figure 1. Photograph of the practical synchronous measurement system. The picture demonstrates a custom-made leaf chamber system for concurrent fluorescence measurements on a leaf sample under various environmental factors. It shows the main components in this system, including an LED light source with a short-pass filter, a PAM fluorometer, an LI-6800 gas exchange system, and four spectrometers with two bundled fibers.
Applsci 11 10821 g001
Figure 2. Enlarged views of the leaf chamber and abscisic acid (ABA) treatment with a microcentrifuge tube.
Applsci 11 10821 g002
Figure 3. Variation in gross carbon assimilation (AG, μmol m−2 s−1, a,c), stomatal conductance to water vapor (gsw, mol m−2 s−1, (b,d)), quantum efficiency of photosystem II (ΦPSII, (e,g)), nonphotochemical quenching (NPQ, (f,h)), total fluorescence radiance at 760 nm measured from both sides of leaves (TChlF760, mW m−2 nm−1 sr−1, (i,k)), and light-adapted steady-state PAM fluorescence (Fs, (j,l)) with CO2 concentrations (ppm) measured on three leaves of soybean (left two columns) and maize (right two columns) under irradiance of 800 (soybean) and 1200 (maize) μmol m−2 s−1. The three different colored lines represent three individual samples. nCO2 = 9 for each leaf.
Applsci 11 10821 g003
Figure 4. Variation in gross carbon assimilation (AG, μmol m−2 s−1, (a,c)), stomatal conductance to water vapor (gsw, mol m−2 s−1, (b,d)), quantum efficiency of photosystem II (ΦPSII, (e,g)), nonphotochemical quenching (NPQ, (f,h)), total fluorescence radiance at 760 nm measured from both sides of leaves (TChlF760, mW m−2 nm−1 sr−1, (i,k)), and light-adapted steady-state PAM fluorescence (Fs, (j,l)) with leaf temperature (T, °C) measured on three leaves of soybean (left two columns) and maize (right two columns) under irradiance of 800 (soybean) and 1200 (maize) μmol m−2 s−1. The three different colored lines represent three individual samples. nT = 6 for each leaf.
Applsci 11 10821 g004
Figure 5. Variation in soybean gross carbon assimilation (AG, μmol m−2 s−1, (ac), left y-axis), stomatal conductance to water vapor (gsw, mol m−2 s−1, (ac), right y-axis), quantum efficiency of photosystem II (ΦPSII, (df), left y-axis), nonphotochemical quenching (NPQ, (df), right y-axis), total fluorescence radiance at 760 nm measured from both sides of leaves (TChlF760, mW m−2 nm−1 sr−1, (gi), left y-axis), and light-adapted steady-state PAM fluorescence (Fs, (gi), right y-axis) for pre-treatment and post-treatment of ABA under irradiance of 800 μmol m−2 s−1. The vertical green dashed line indicates the start of the ABA treatment. The three columns represent three individual soybean leaves. nABA = 30 for each leaf.
Applsci 11 10821 g005
Table 1. Measured variables and related equipment used in this study.
Measured
Variables
DefinitionsRelated
Equipment
Anetleaf net CO2 assimilation (μmol m−2 s−1)LI-6800 portable
gas exchange system
Rdleaf dark respiration (μmol m−2 s−1)LI-6800 portable
gas exchange system
AGleaf-scale gross photosynthetic CO2 assimilation estimated from the gas exchange system (μmol m−2 s−1)LI-6800 portable
gas exchange system
gswstomatal conductance to water vapor (mol m−2 s−1)LI-6800 portable
gas exchange system
Fmmaximum fluorescence yield induced by a saturation pulse in the dark-adapted stateDUAL-PAM-100
fluorometer
Fmmaximum fluorescence yield induced by a saturation pulse in the light-adapted stateDUAL-PAM-100
fluorometer
Fssteady-state fluorescence yield from PAMDUAL-PAM-100
fluorometer
ΦPSIIphotochemical quantum yield of PSIIDUAL-PAM-100
fluorometer
NPQnonphotochemical quenchingDUAL-PAM-100
fluorometer
TChlF760the total chlorophyll fluorescence radiance emitted from both abaxial and adaxial surfaces of a leaf at 760 nm (mW m−2 nm−1 sr−1)QEpro spectrometer
Table 2. Coefficients of determination (R2) for the linear regressions between fluorescence radiance and photosynthetic capacity for the measurements driven by CO2 concentration (ppm), leaf temperature (°C), and abscisic acid (ABA) treatments under constant irradiance of 800 μmol m−2 s−1. AG represents gross carbon assimilation (μmol m−2 s−1). TChlF760 and Fs represent the total emitted fluorescence radiance at 760 nm (mW m−2 nm−1 sr−1) and light-adapted steady-state PAM fluorescence. Bold values indicate regression insignificance (p ≥ 0.05). This table analyzes four groups of datasets: three individual samples (leaf numbers 1–3) and their average (Set). nCO2 = 8 for individual leaves and 24 for a set. nT = 5 for individual leaves and 15 for a set. nABA = 30 for individual leaves and 90 for a set.
SpeciesTreatmentsFluorescenceAG
Leaf 1Leaf 2Leaf 3Set
SoybeanCO2TChlF7600.930.940.950.96
Fs0.930.940.910.94
Leaf
temperature
TChlF7600.860.910.950.96
Fs0.810.920.750.89
ABATChlF7600.990.950.990.99
Fs0.860.760.730.93
MaizeCO2TChlF7600.830.830.920.87
Fs0.900.920.940.95
TemperatureTChlF7600.790.930.940.92
Fs0.480.850.780.71
Publisher’s Note: MDPI stays neutral with regard to jurisdictional claims in published maps and institutional affiliations.

