Article

Study on Fluid Behaviors of Foam-Assisted Nitrogen Flooding on a Three-Dimensional Visualized Fracture–Vuggy Model

1
Research Institute of Unconventional Petroleum Science and Technology, China University of Petroleum, Beijing 102249, China
2
Basic Theory Laboratory of Improving Oil Recovery in Low Permeability Oilfields, Tertiary Oil Recovery Key Laboratory, CNPC, Beijing 102249, China
*
Authors to whom correspondence should be addressed.
The author has the same contributions.
Appl. Sci. 2021, 11(23), 11082; https://doi.org/10.3390/app112311082
Submission received: 25 September 2021 / Revised: 30 October 2021 / Accepted: 16 November 2021 / Published: 23 November 2021

Abstract

:
Tahe Oilfield, located in northwest China, is an unconventional fracture–vuggy carbonate reservoir. The foam-assisted nitrogen gas flooding technology has been proven to be a potential EOR technology. However, the flow behaviors of foam-assisted nitrogen gas in fracture–vuggy structures are not clear due to the complex fracture–vuggy structures and their strong heterogeneity. In this work, a three-dimensional visualized fracture–vuggy model is designed and fabricated to investigate the fluids behaviors of foam-assisted N2 flooding and classify the residual oil types after foam-assisted N2 flooding. Experimental results reveal that foam slug can enlarge the sweep efficiency, suppress the formation of nitrogen gas channeling, and detach the oil film. Additionally, the evolution processes of the gas–oil and oil–water interfaces are investigated and analyzed. Moreover, the residual oil types after foam-assisted N2 flooding and nitrogen gas flooding, respectively, are classified and summarized. Compared to nitrogen gas flooding after water flooding, 12.36% more oil can be recovered through foam-assisted N2 flooding. This work further studies the fluid flow behaviors of foam-assisted N2 in the three-dimensional visualized fracture–vuggy carbonate model and also confirms the previous achievements.

1. Introduction

Over recent decades, there has been an imbalanced supply–demand energy relationship owing to continuously large-scale development of oil and gas resources. Despite the gradual rise of new energy sources, the demand for crude oil remains high [1,2]. Fracture–vuggy carbonate reservoirs are one of the most important reservoirs in the world [3]. More than half of the hydrocarbon production in the world is contributed by fracture–vuggy carbonate reservoirs [4,5]. Tahe Oilfield, located in the Tarim Basin, western China, is a typical fracture–vuggy carbonate reservoir (billion tons-level) [6,7]. The recovered oil production has exceeded 0.5 billion tons since its exploitation from 1997. More than half of the oil and gas is still trapped within fractures and vuggs in Tahe Oilfield because 1.7 billion tons of original oil in place (OOIP) have been discovered. However, it is a challenge to decrease residual oil saturation in Tahe Oilfield due to its unique reservoir conditions. The fracture–vuggy reservoir is composed of the matrix, fractures, and vuggs. The matrix has no ability to store oil due to its ultra-low permeability. The fractures mainly provide flow channels for fluids such as water and crude oil, while the vuggs (meter level) can store crude oil owing to their vast spaces [8,9,10]. The severe heterogeneity in fracture–vuggy carbonate reservoir results in the complicated distribution of fluids and lower oil recovery [7,11,12].
At the beginning, natural energy is utilized to recover crude oil from the subsurface to the surface. However, crude oil production declines very fast due to the rapid depletion of natural energy. The water cut for production wells increases quickly due to the occurrence of bottom water cone [13,14]. Afterwards, the water-flood production method is applied to replenish reservoir pressure. This technology can recover a certain amount of crude oil, but some drawbacks such as early water breakthrough and a short stable crude oil production period still exist [7,14,15,16]. Recently, to overcome these shortcomings deriving from water flooding, nitrogen gas (N2) has been injected to enhance crude oil recovery. N2 can recover the attic oil by entering the top of fracture–vuggy unit due to its low density [17,18,19,20]. A total of 20% of oil recovery can be achieved in two-dimensional visualized models during N2 flooding [21]. Additionally, the phase flow behaviors of water and N2 in a three-dimensional visualized fracture–vuggy model were studied and investigated [22]. Nr was proposed to describe the synergistic effects between the gas cap and bottom water. The field application in Tahe Oilfield has proven the potential of N2 flooding for enhancing oil recovery [23]. However, gas channeling occurs easily during the N2 flooding because of the low viscosity and density of N2.
Foam can control N2 mobility and inhibit gas channeling during foam-assisted nitrogen flooding [24,25]. Additionally, foam can improve oil displacement efficiency and sweep efficiency, contributing to oil recovery [26,27]. The foam-polymer flooding method was also proposed to significantly enhance oil recovery in reservoirs [28]. Recent years, the foam-assisted N2 flooding method, a combination of foam and nitrogen gas flooding, has attracted considerable attention to increase crude oil production [29,30]. Foam with low mobility can virtually plug the high permeable channel [31,32]. Zhang [33] systematically studied the plugging behaviors of foam at various conditions. A two-dimensional visualized physical model was used to study the migration behaviors of foam [34]. Results indicate that foam can increase the sweep volume by increasing the flow resistance of high permeable channels. Hou [3] fabricated a two-dimensional visualized fracture–vuggy model to clarify the mechanisms of foam-assisted N2 flooding. The results show that foam can control N2 mobility, inhibit N2 channeling, improve sweep efficiency, exfoliate oil film, and make crude oil emulsification. The released surfactants from defoamed foam can reduce interfacial tension (IFT) of oil and water [35]. However, many foam-assisted gas flooding experiments were conducted in one or two-dimensional visualized models. Work on the application of foam-assisted N2 in a three-dimensional visualized fracture–vuggy physical model has been lacking.
In this work, a three-dimensional visualized fracture–vuggy model was designed and fabricated to investigate the migration characteristics of foam-assisted N2 flooding and classify the residual oil types after foam-assisted N2 flooding. This work extends the previous work concentrating on the fluids flow features of water and nitrogen flooding [22]. These results from this work can be trusted due to the high similarity between the three-dimensional model and the actual reservoir.

2. Experimental Preparation

2.1. Materials Used

The simulated oil was prepared by mixing paraffin and kerosene at the mass ratio of 20:1. The oil is 23.9 mPa·s in viscosity. The simulated oil was dyed red using a small amount of Sudan III to increase the visual effects.
The simulated water was made based on the inorganic salt compositions from Tahe Oilfield (Table 1). The water is 1.339 g/cm3 in density. The methyl blue with a proper amount was used to color the simulated water blue for distinguishing with simulated oil.
The N2 was provided from Beijing Chengxin Shunxing Ltd., Beijing, China. The N2 foam liquid, a mixture of 0.3 wt% SDS and 0.15 wt% HPAM, was prepared. The foam volume is 950 mL and the half-life of foam is 163 min when using 200 mL foam liquid. The N2 foam was pre-generated by mixing N2 and foam liquid in the sand pack before injecting it into the three-dimensional visualized model.

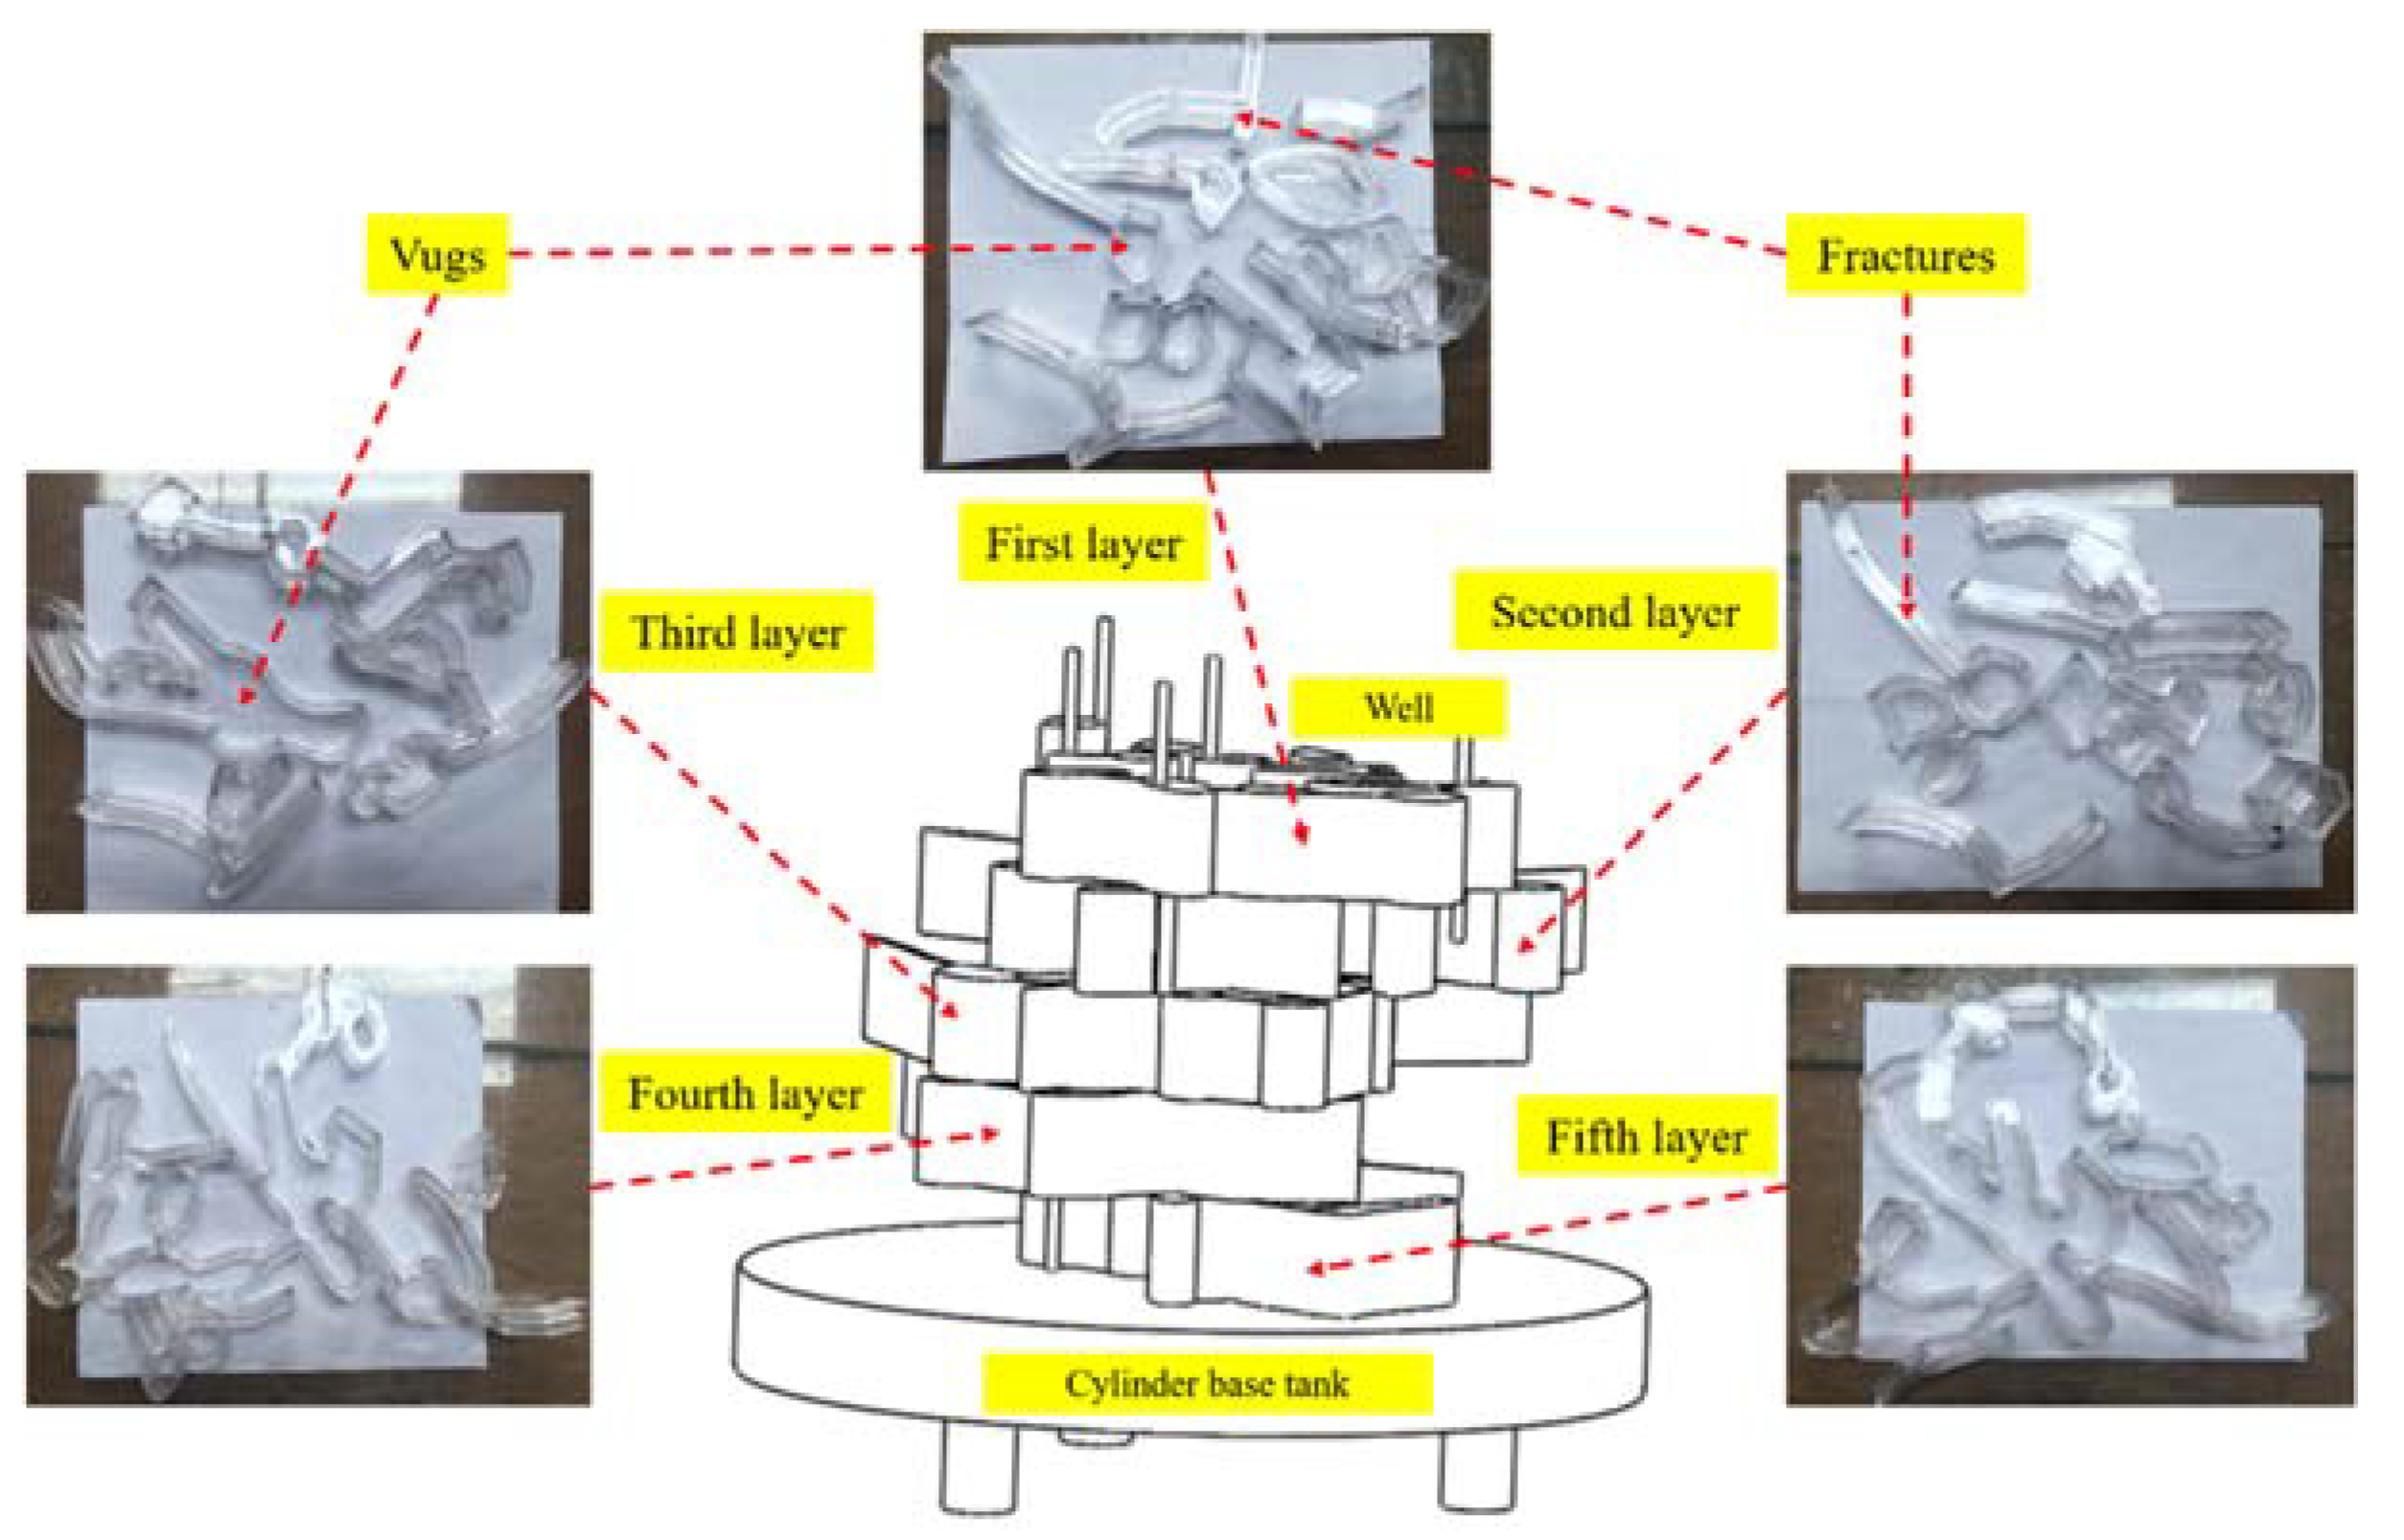
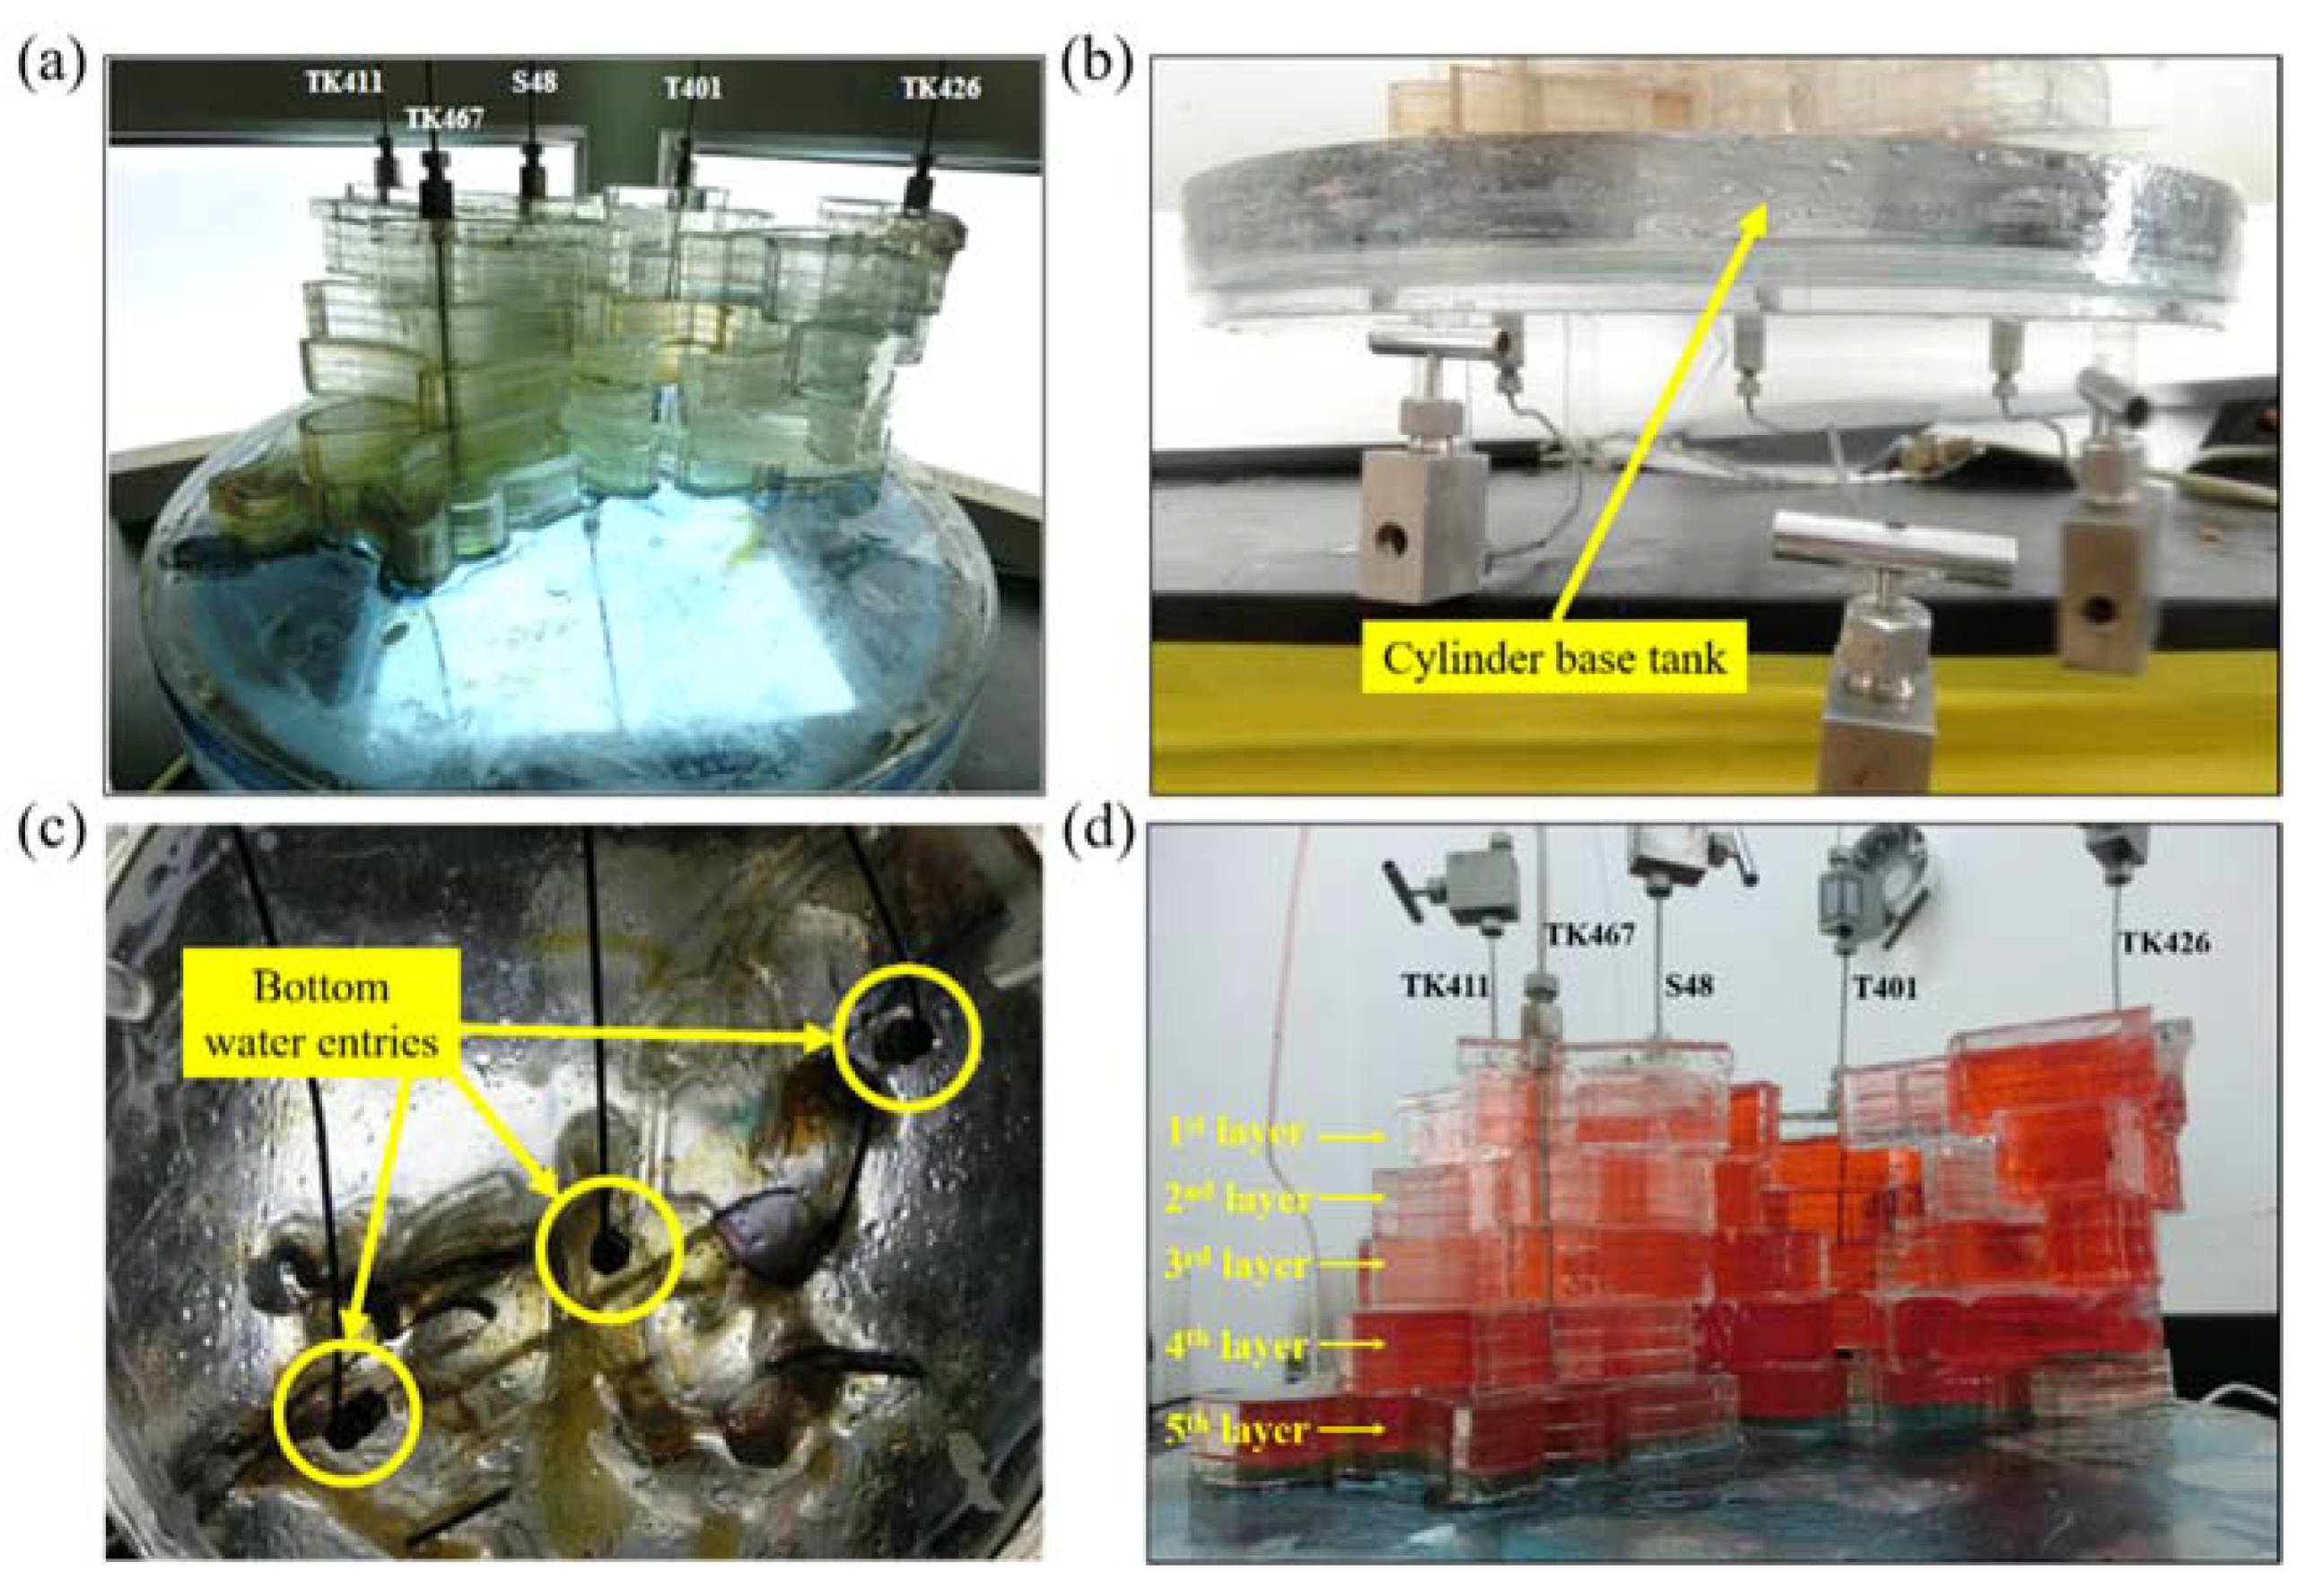
2.2. Design of Three-Dimension Visualized Fracture–Vuggy Physical Model

Owing to the complex fracture–vuggy structures in actual reservoirs, it is impossible to restore a physical laboratory model to study fluid flow behaviors. The similarity criterion has been commonly used to design the laboratory model to simulate fluid flow behaviors in actual reservoirs [36]. The fluid flow behaviors can be affected significantly by fracture–vuggy structures and fluid properties. Hence, a three-dimensional visualized fracture–vuggy model was designed based on geometric, dynamic, and motion similarities to study the fluids flow behaviors from foam-assisted N2 in the Tahe Oilfield. The three-dimensional fracture–vuggy model and actual reservoir are similar in vug and fracture size and injection rates with these similar properties. Consequently, the migration behaviors of the fluids are also similar both in the three-dimensional visualized fracture–vuggy physical model and the actual reservoir [22,30]. The parameters of the three-dimensional visualized fracture–vuggy model were calculated based on the three similarity criteria when the similarity criteria index is 1, shown in Table 2. The similarity criteria index can be determined by the similarity coefficient, which is defined as the ratio of factors of actual reservoirs and the three-dimensional visualized fracture–vuggy physical model. Therefore, all corresponding parameters of the three-dimensional visualized fracture–vuggy physical model, seen in Table 3, were calculated.
The three-dimensional visualized fracture–vuggy physical model is made up of five layers, seen in Figure 1. The height of each fracture–vuggy layer is 3 cm. The fractures and vugs were designed and engraved in each fracture–vuggy layer according to the actual fracture–vuggy reservoir structures and similarity criteria. The three-dimensional visualized fracture–vuggy model body was assembled by gluing and sealing each fractured–vuggy layer with epoxy. Afterwards, the three-dimensional visualized fracture–vuggy body was fixed to a cylinder tank with a height of 1 cm. The cylinder tank was used to provide bottom water. Finally, the pre-designed wells (S48, T401, TK411, TK426, and TK467) were drilled and extended into the specific positions, seen in Figure 2. The parameters of wells are displayed in Table 4. The well type depends on the borehole location. For instance, the vug well TK411 means that its borehole locates at a vug. One PV (pore volume) of the three-dimensional visualized physical model body is 1571.29 cm3, while the volume of the cylinder tank is 1384.74 cm3. Moreover, the three-dimensional visualized physical model is made of polymethyl methacrylate with oil-wet properties.

2.3. Experimental Procedures

(1)
The three-dimensional visualized fracture–vuggy physical model experiments are vacuumed and conducted at room temperature and pressure conditions.
(2)
The cylinder base tank is filled with simulated formation water from the model’s bottom, while the three-dimensional visualized fracture–vuggy model body is filled with simulated oil from the model’s top.
(3)
The bottom water flooding is carried out at a 10 mL/min flow rate when five wells are open initially. The well TK467 is converted to an injection well with a 4 mL/min flow rate from a production well as its water cut increases to 98%; meanwhile, the velocity of bottom water is also adjusted to 4 mL/min.
(4)
Close one well when its water cut reaches 98% until the other wells are all closed.
(5)
Open all wells, and the pre-generated N2 foam is injected from TK467 with 12 mL/min flow rate. The volume of injected N2 foam is 0.5 PV (785.6 cm3). Afterwards, N2 is also injected from TK467 with 12 mL/min flow rate. The bottom water keeps the velocity of 4 mL/min during foam or N2 flooding. One well is closed when its water cut reaches 98% or N2 channeling occurs until the other wells are all closed.
The fluids flow behaviors from water-driven were systematically investigated and analyzed in our previous work [22]. Therefore, this work mainly focuses on foam-assisted N2 fluid flow behaviors and the residual oil types after foam-assisted N2 flooding in the three-dimensional visualized fracture–vuggy model.

3. Results and Discussions

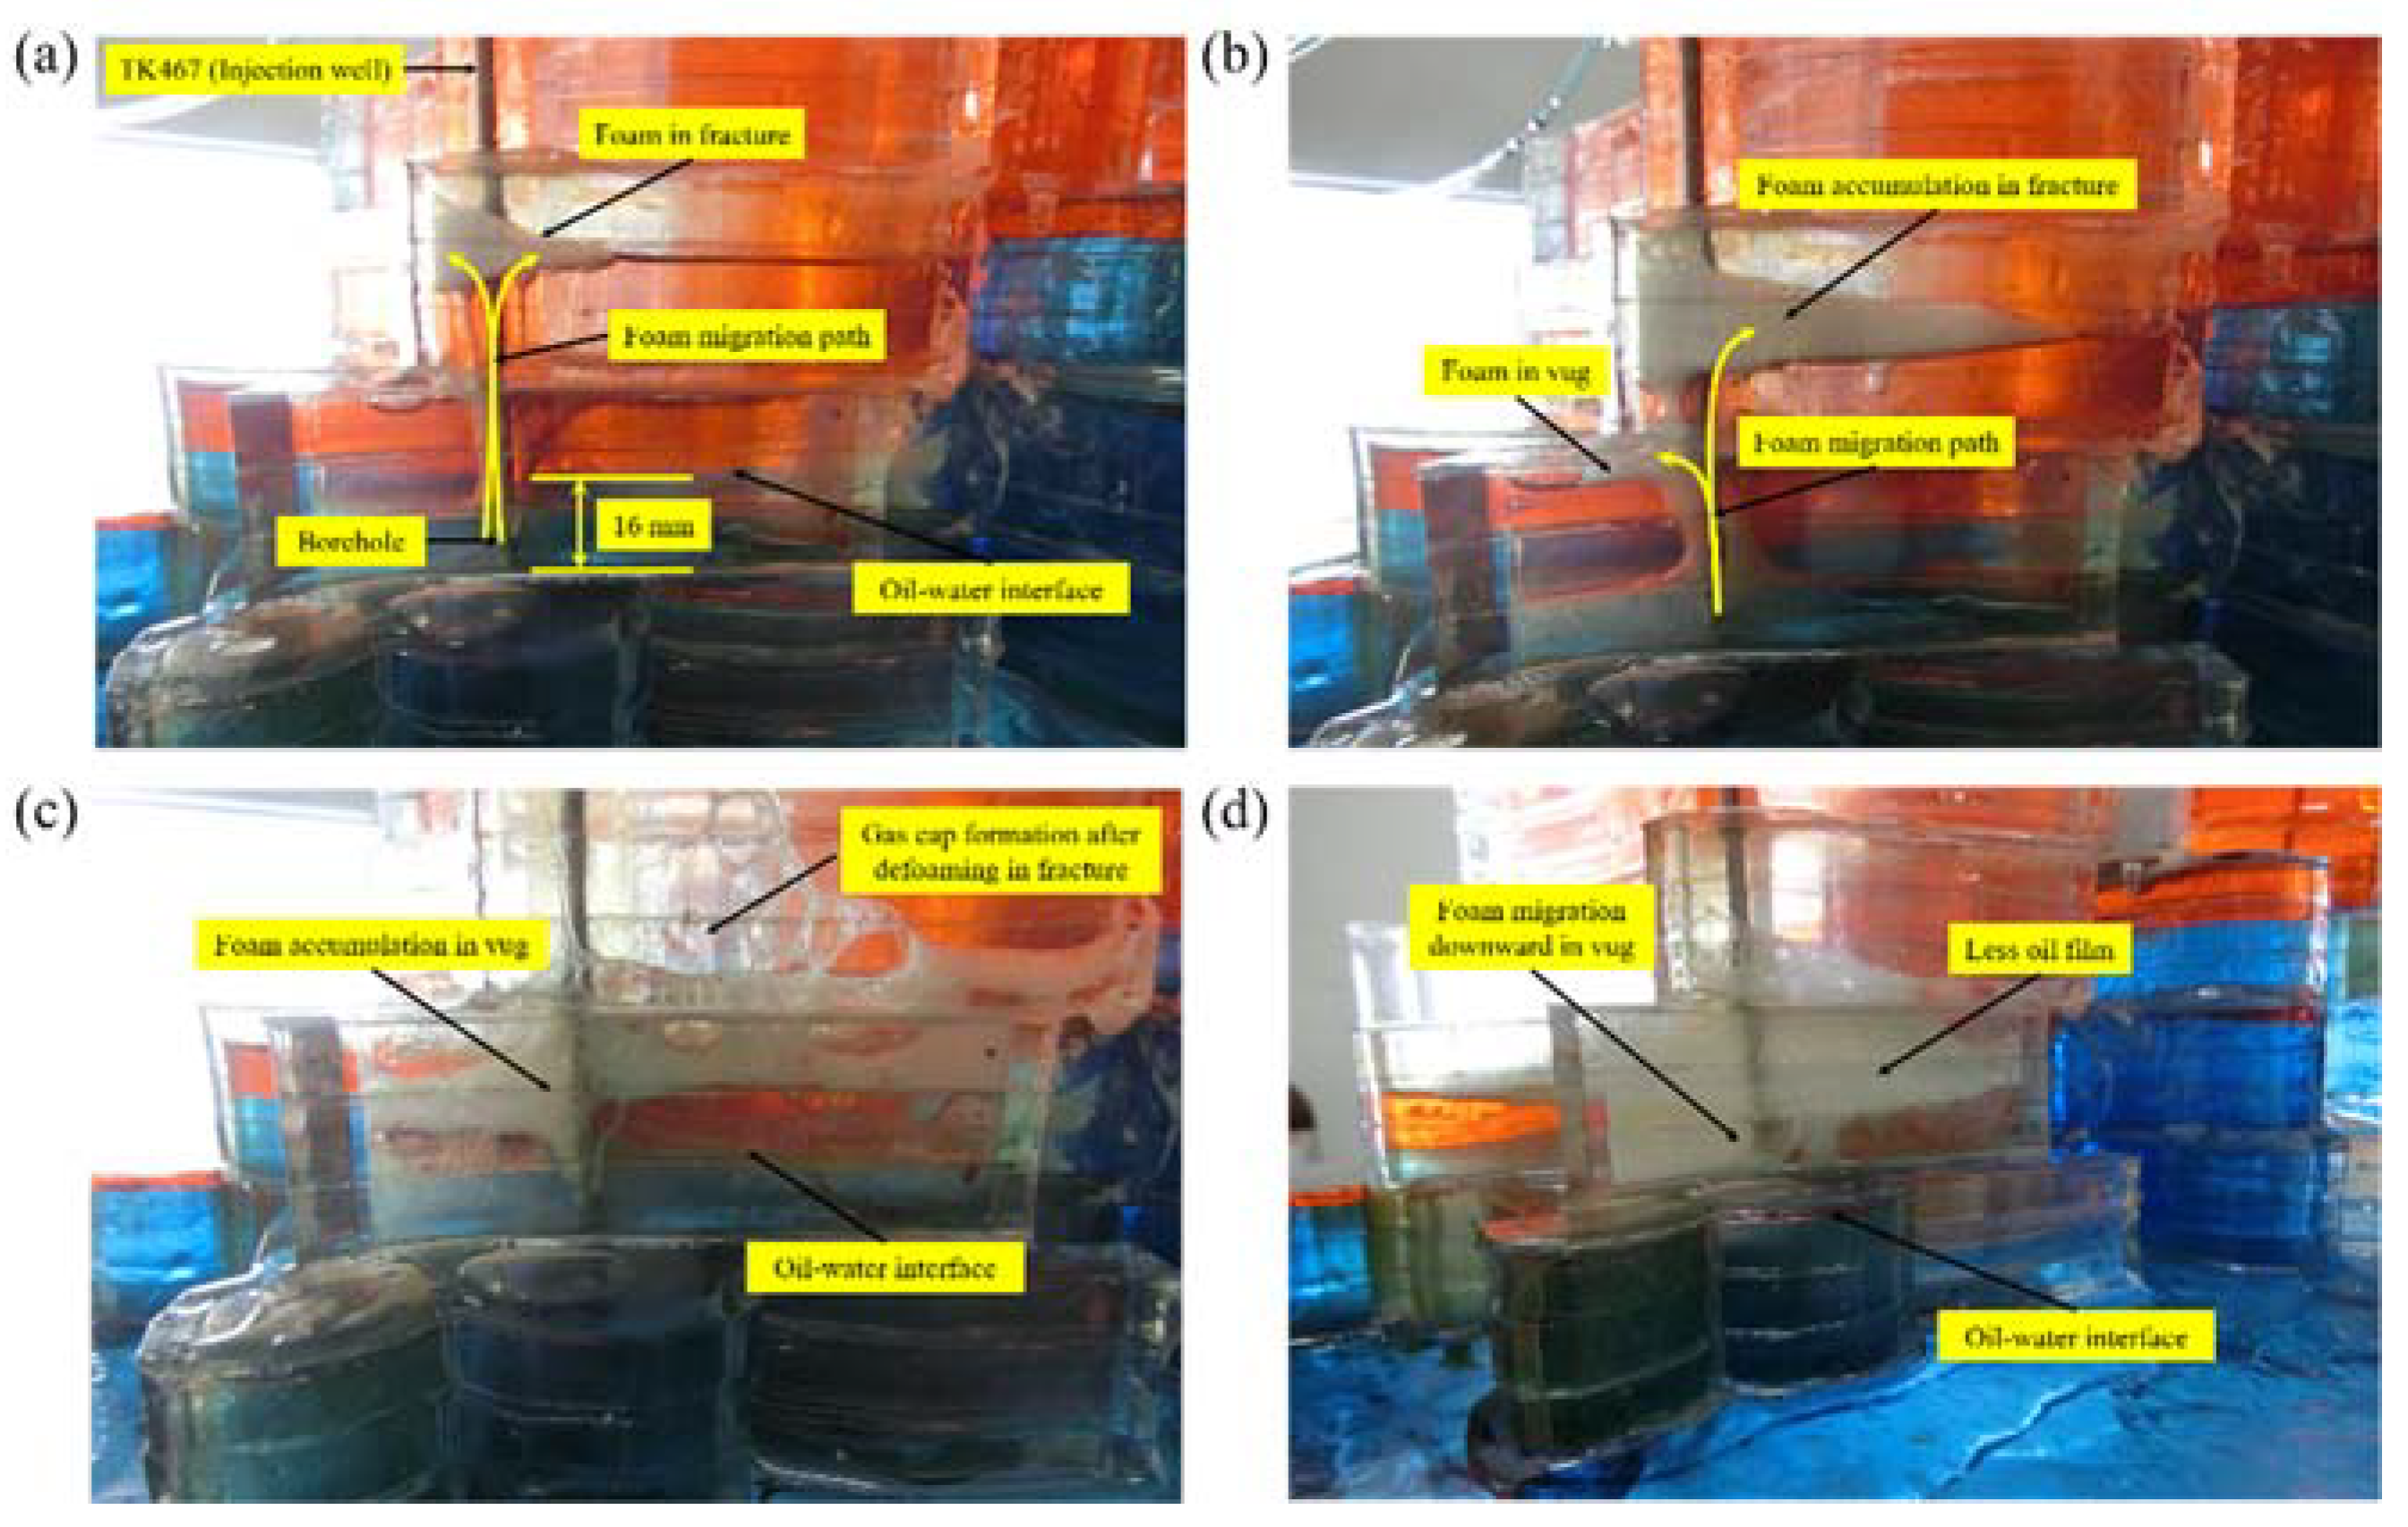
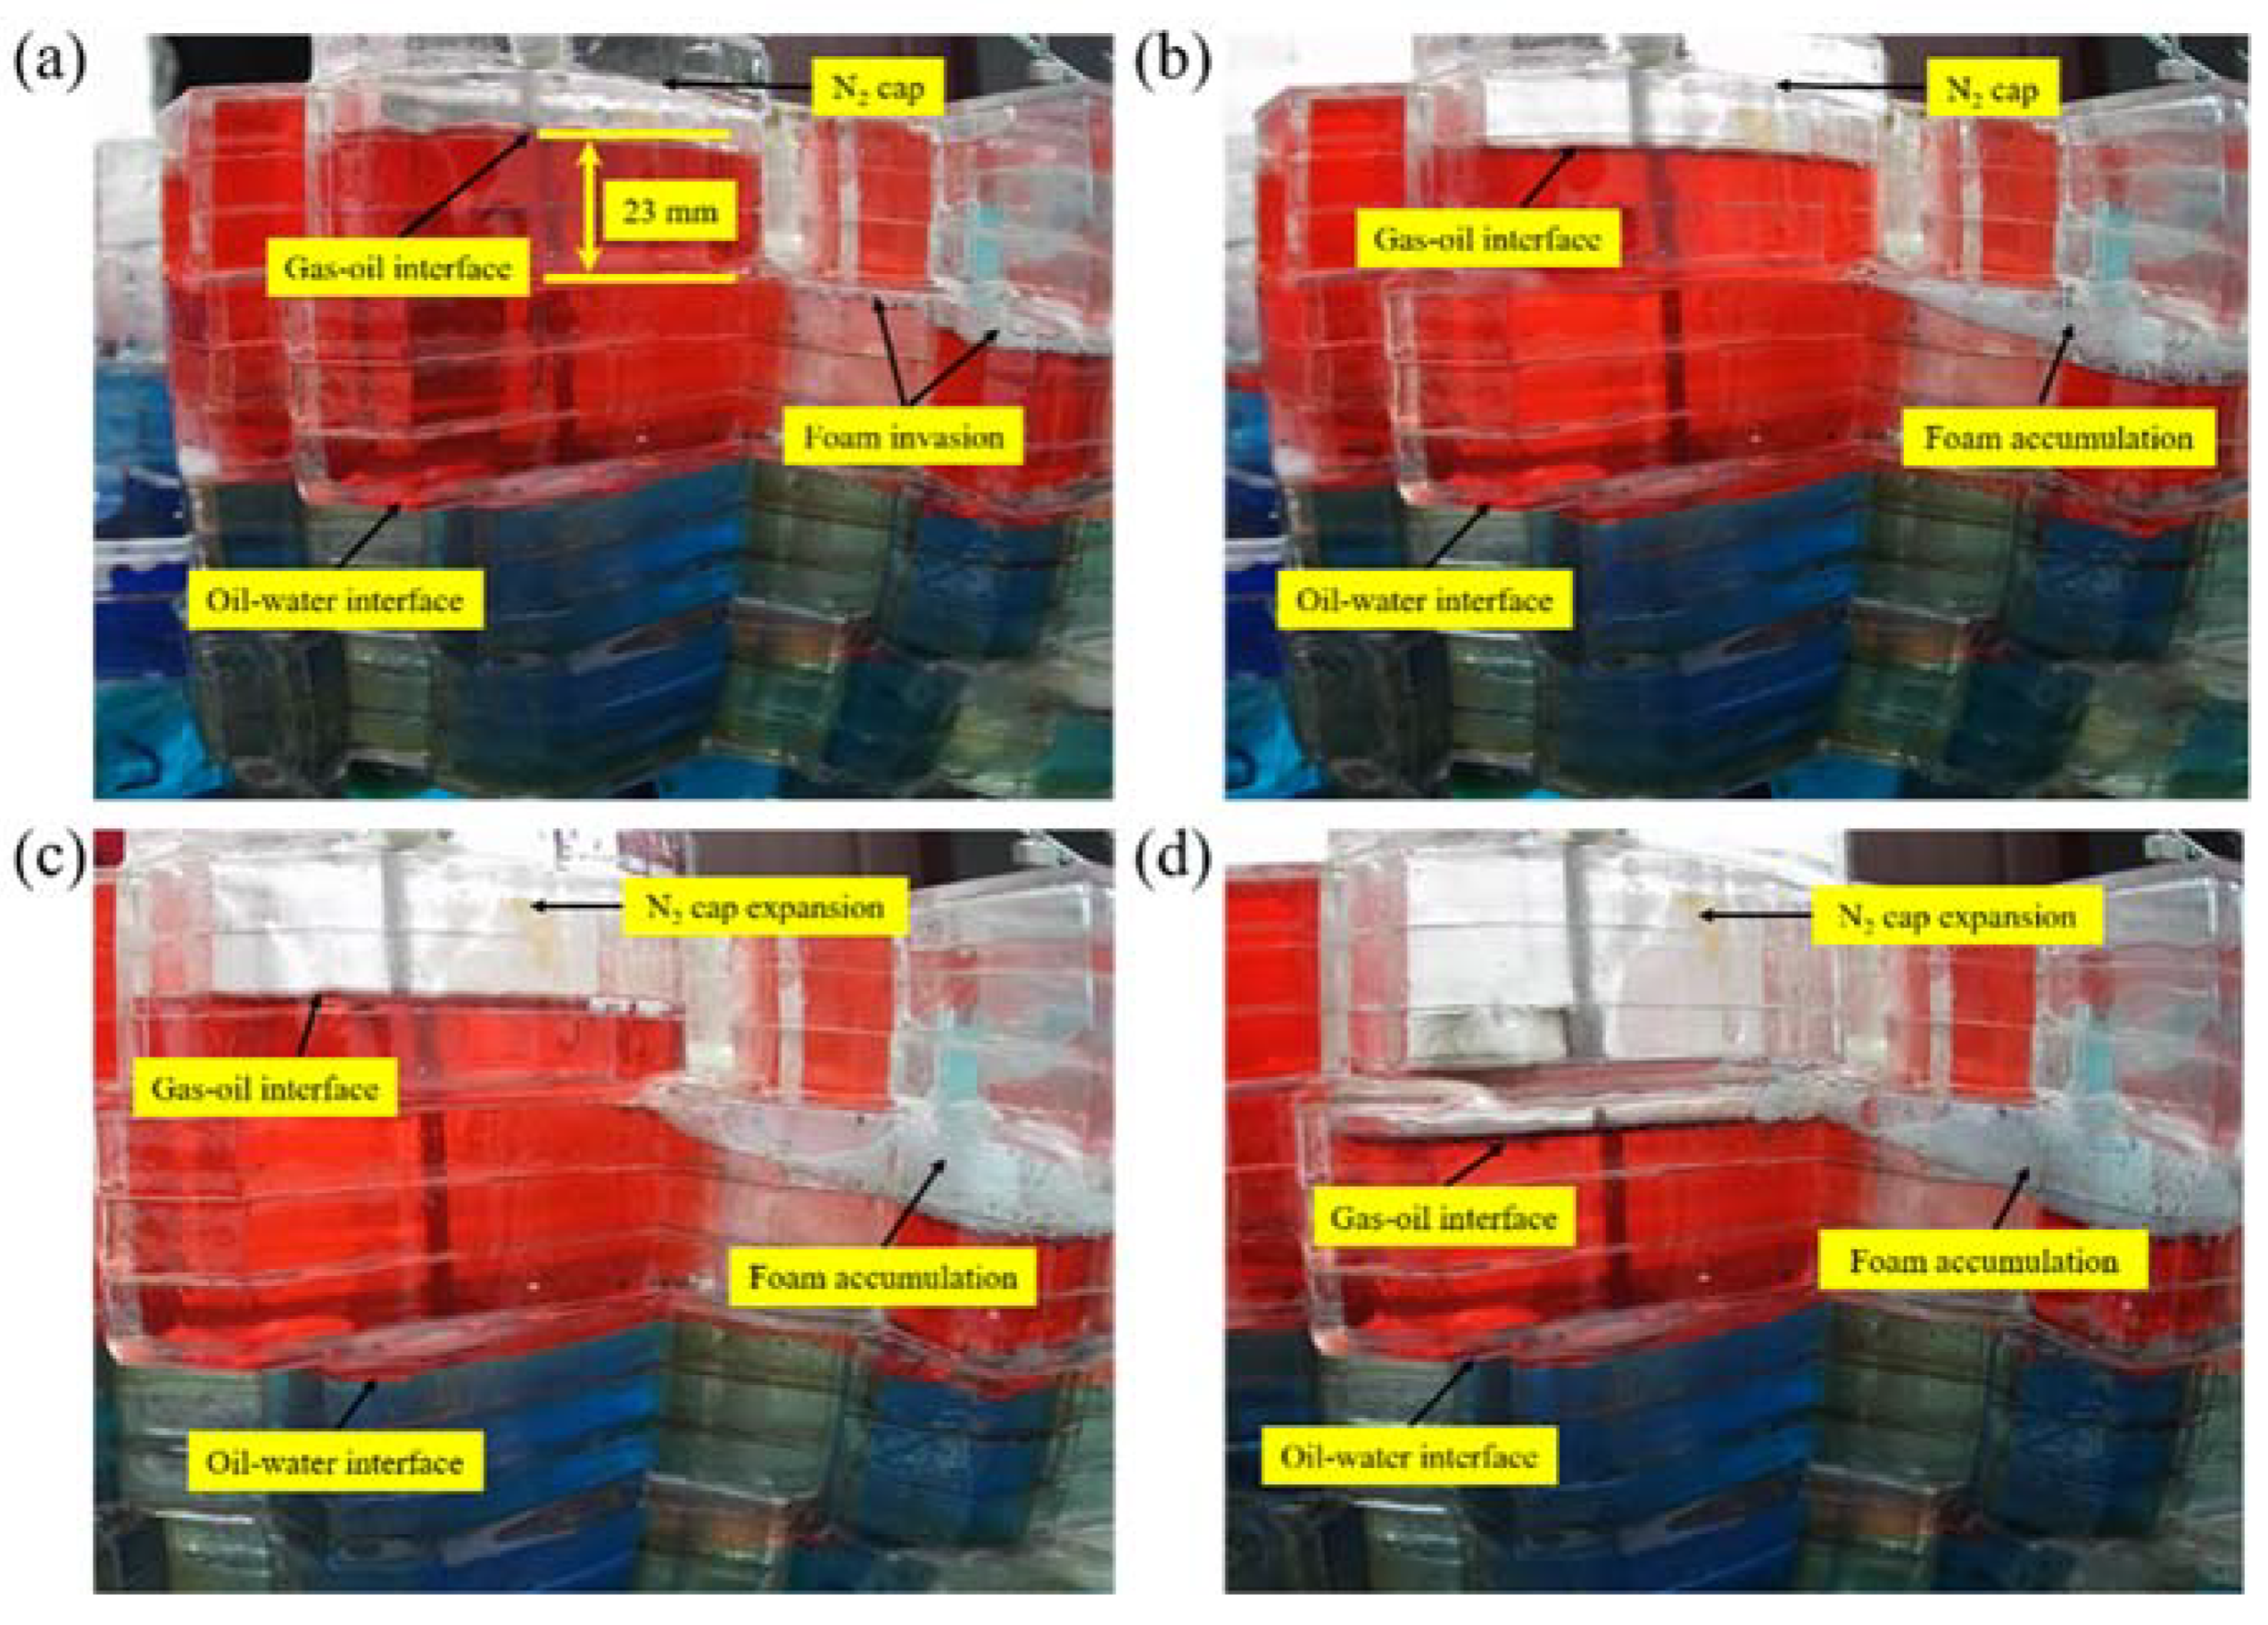
3.1. Foam Flow Characteristics around Injection Well TK467

The N2 foam was injected into the three-dimensional visualized fracture–vuggy physical model though well TK467. The injected rate of N2 foam is 12 mL/min. The oil–water interface (OWI) height around the TK467 is higher than the borehole’s height owing to the synergism of injected water and bottom water (Figure 3a). The injected N2 foam preferentially migrates to the upper part of the fracture–vuggy unit controlled by well TK467 because of the density difference of water and N2 foam. Figure 3a shows that the N2 foam enters the upper fracture along the wellbore. The foam can accumulate in the upper fracture through continuous foam injection, making N2 foam migrate into the vug, as shown in Figure 3b. The N2 cap is formed after the N2 foam in the upper fracture is defoamed (Figure 3c). The N2 cap with pressure acts on the gas–oil interface (GOI) and pushes the oil belt moving downward, resulting in a decrease of OWI height. Additionally, the N2 foam can also accumulate in the vug and inhibit the rise of the OWI, as shown in Figure 3d. Compared to Figure 3a, Figure 3d shows that the oil film is significantly detached where the N2 foam spreads, which is attributed to the IFT reduction with surfactants’ help.
A graph depicting the evolution of the OWI position around the well TK467 with time is plotted in Figure 4. The slope of this curve represents the moving rate of the OWI. The injected foam accumulates in the fracture–vuggy unit’s top controlled by TK467 and then acts on the residual attic oil, leading to the OWI’s height decrease. The decline rate of the OWI height keeps stable at 0.0357 mm/s until the OWI decreases to the cylinder base tank.

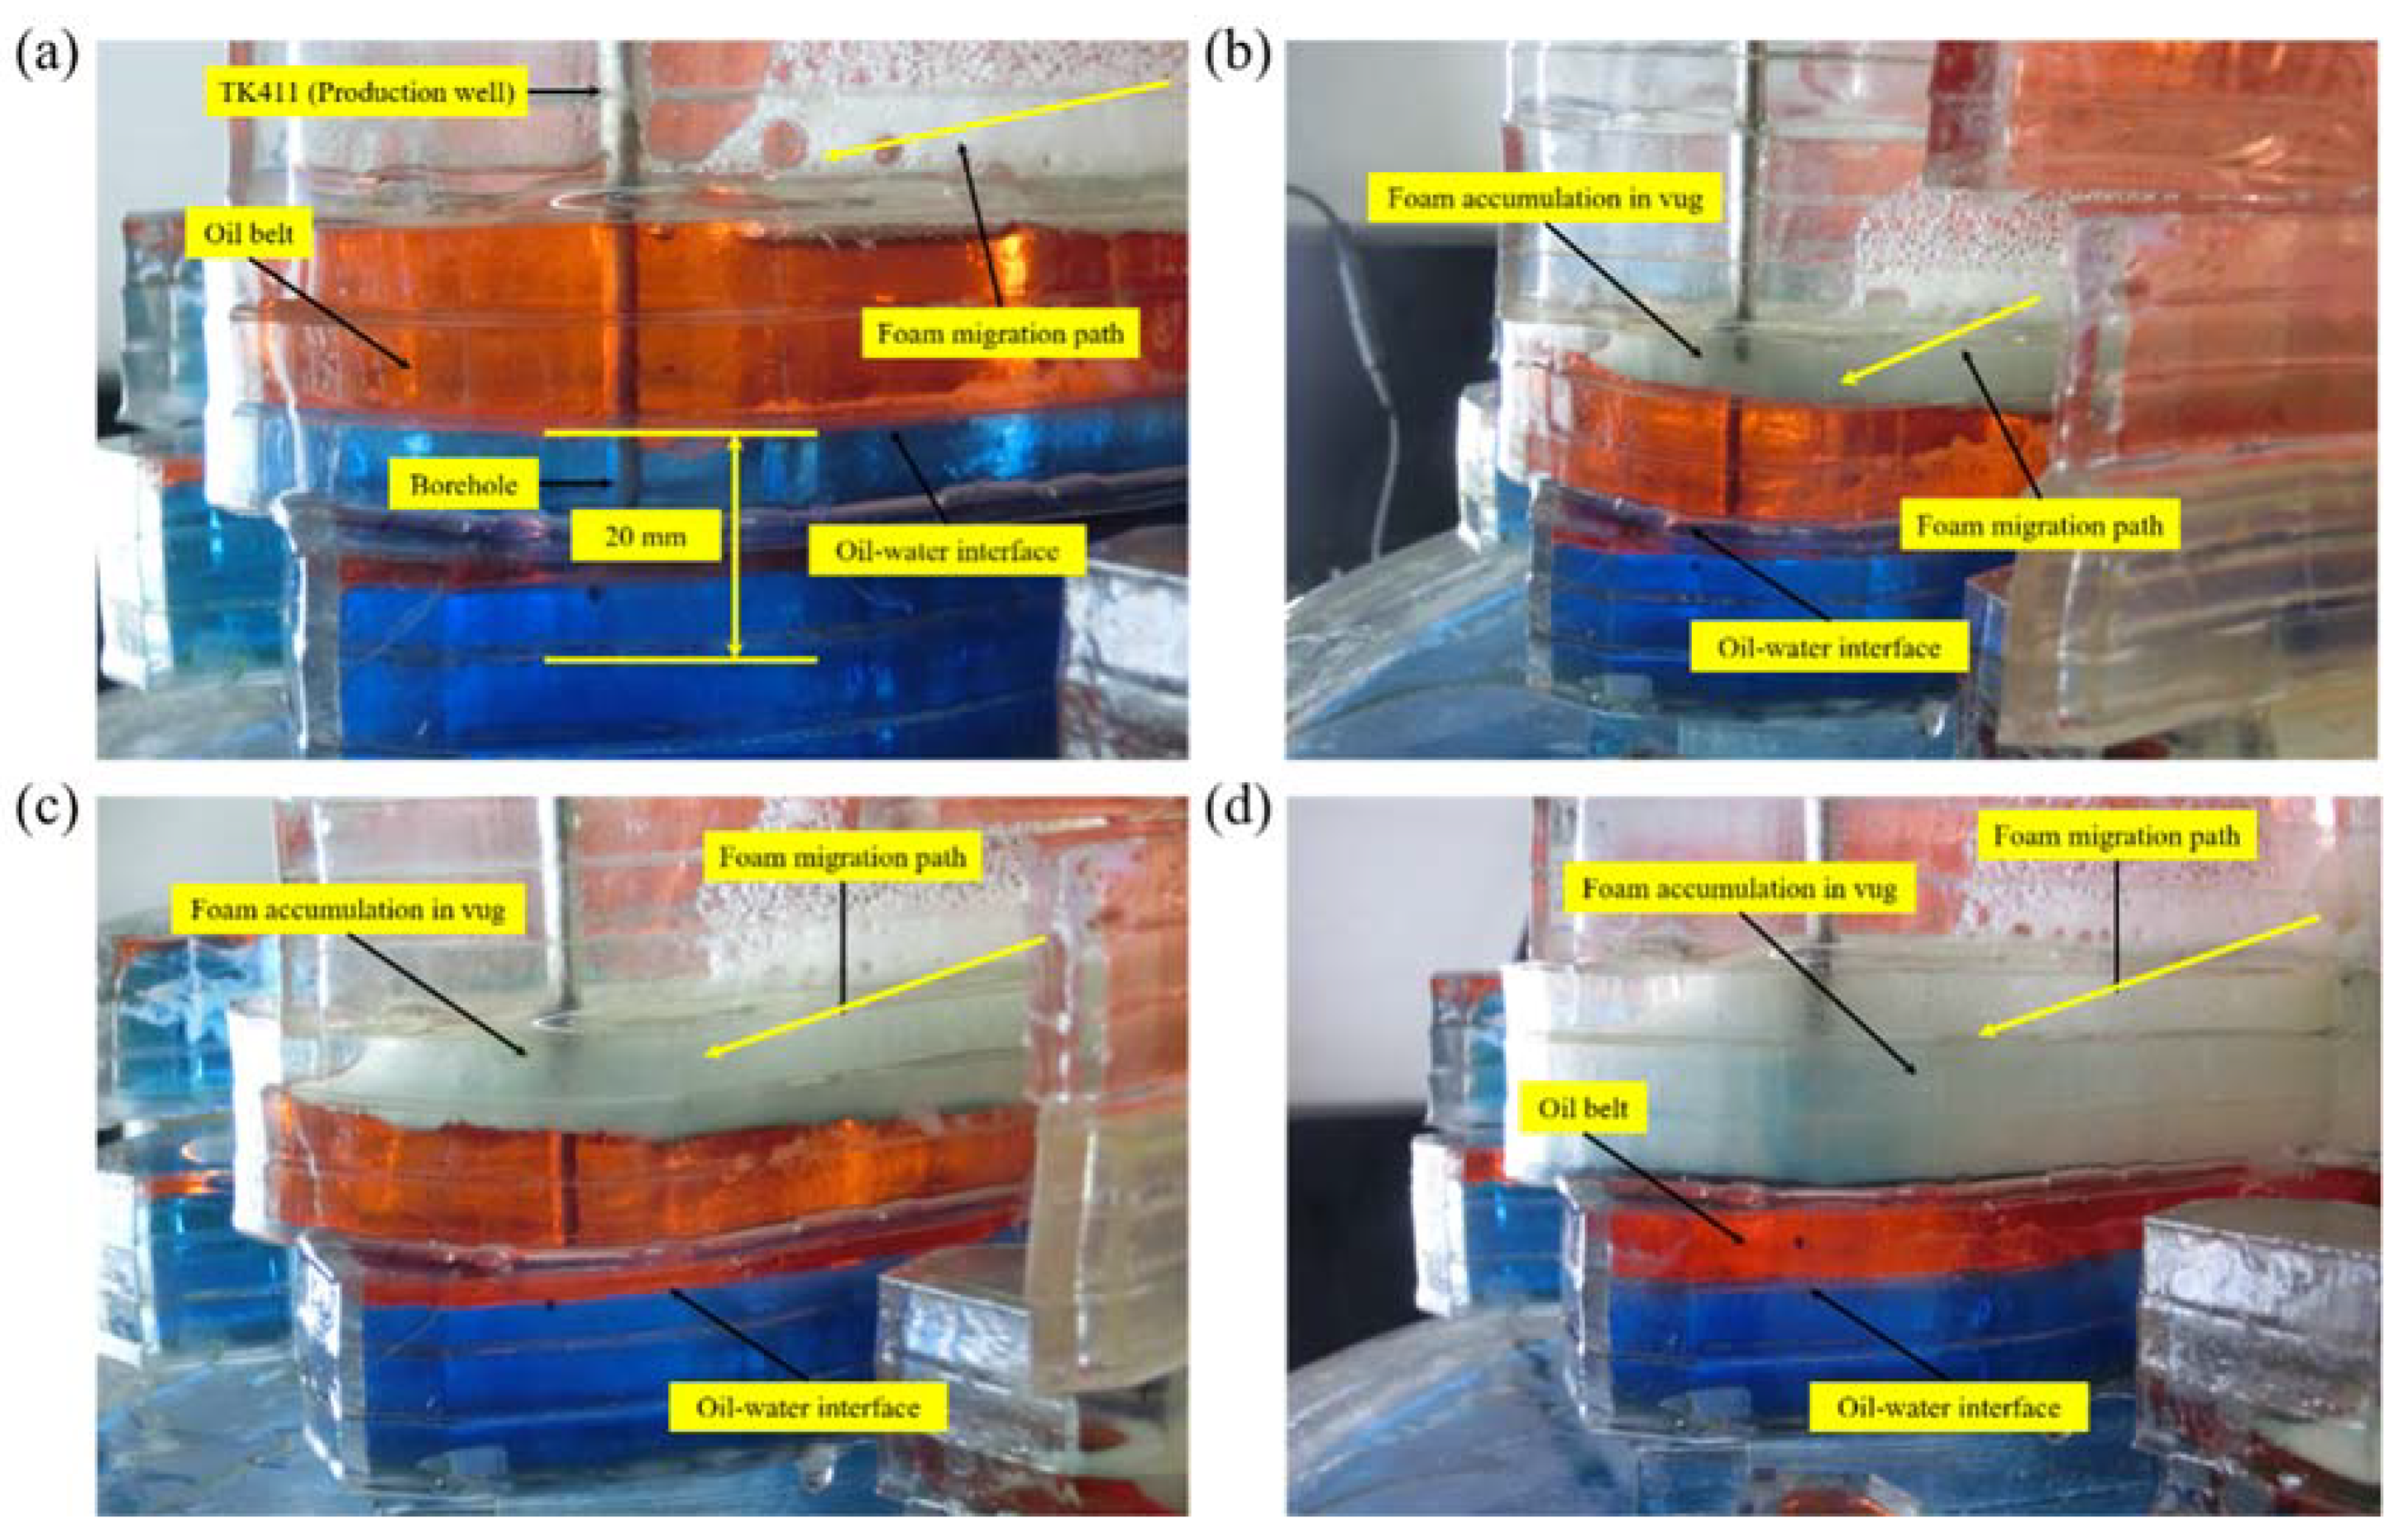
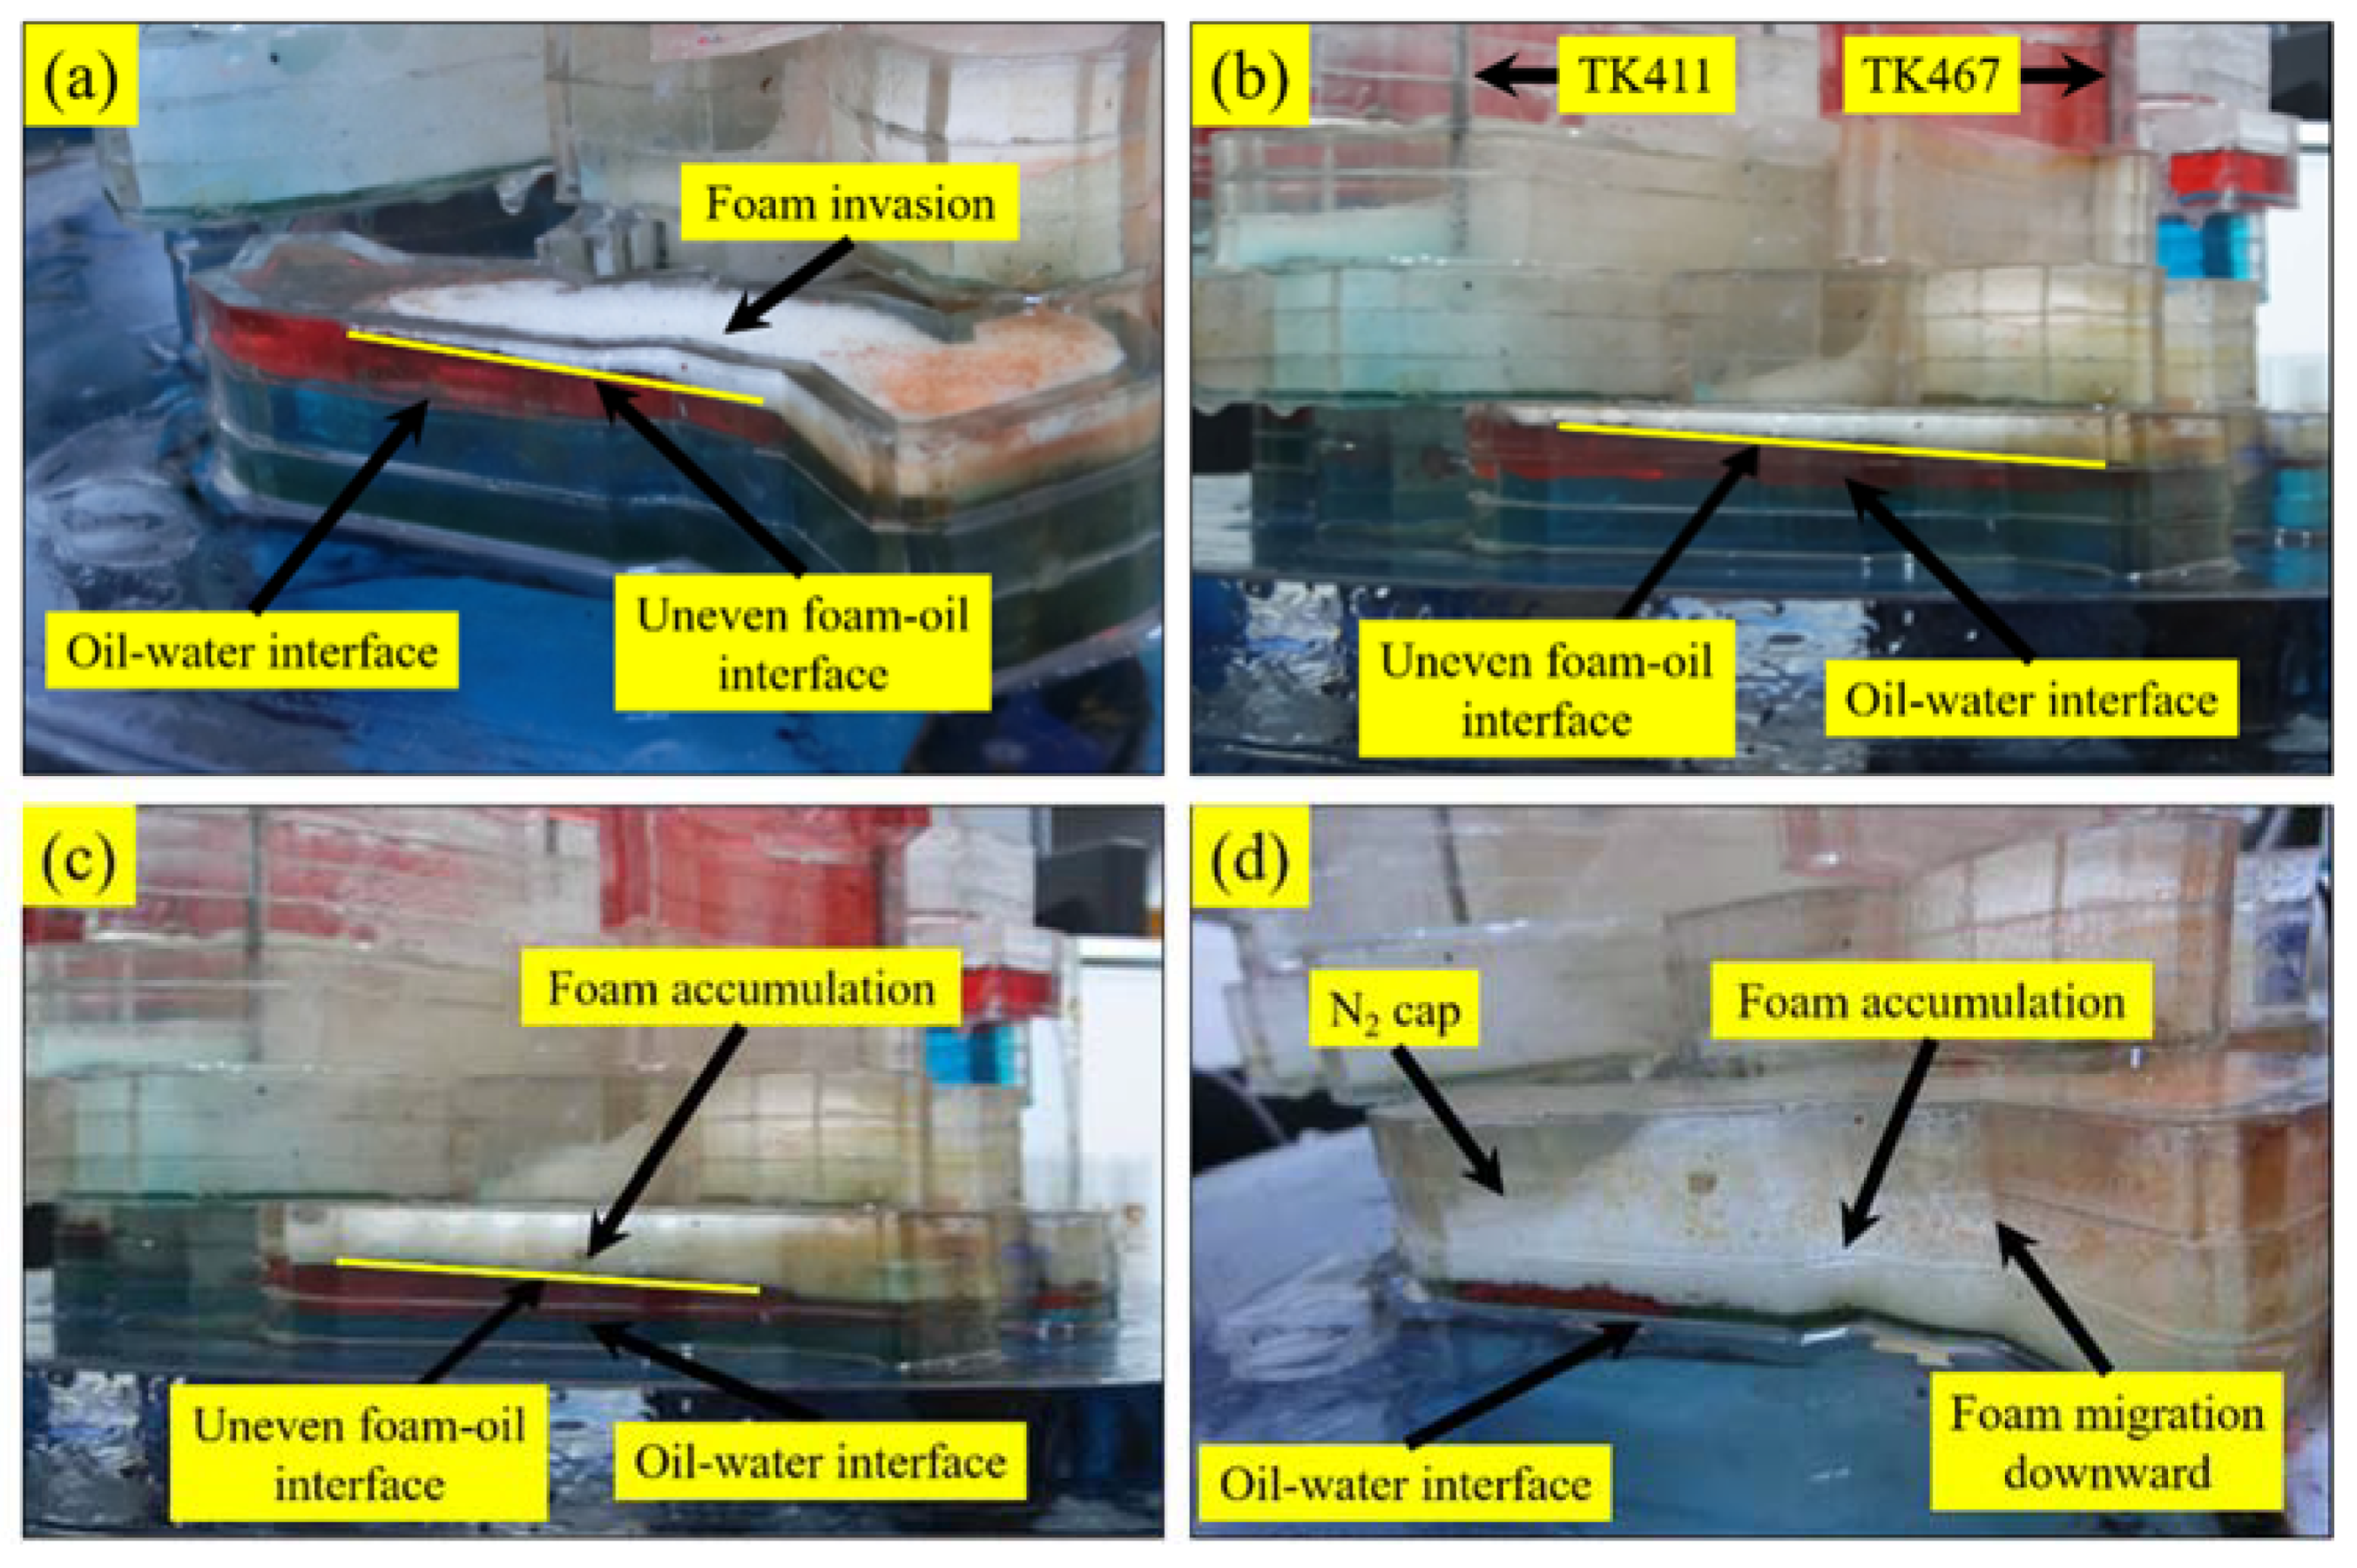
3.2. Foam Flow Characteristics around Production Well TK411

Because of the excellent connectivity between fracture–vuggy units controlled by wells TK467 and TK411, the injected N2 foam quickly migrates to the fracture–vuggy unit controlled by the TK411 from the fracture–vuggy unit controlled by the TK467, as shown in Figure 5a. The OWI locates at the third layer of the three-dimensional visualized fracture–vuggy model body due to the synergism of injected water and bottom water. With the accumulation of N2 foam in the fracture–vuggy unit’s top controlled by the TK411, seen in Figure 5b, the OWI height reduces to the fourth layer (Figure 5c). The foam accumulation can generate a downward driven force, which pushes the oil belt to the borehole of well TK411 (Figure 5d) [37]. Afterwards, the oil belt between upper foam and lower water can be recovered significantly.
A typical graph depicting the evolution of the OWI position around the well TK411 with time is drawn in Figure 6. The slope of this graph depicts the moving rate of the OWI. This graph exhibits that the OWI moves in two stages. The steep stage, where the slope of this graph is 0.028 mm/s, results from the rapid foam accumulation in the vug. However, the gentle stage, where the slop is 0.008 mm/s, is due to the expansion of accumulation foam to other fracture–vuggy units. The expansion behaviors of foam weaken the driven force on the oil belt. Thereby, there is a difference in evolution progresses for two OWIs around TK467 and TK411 (Figure 4).

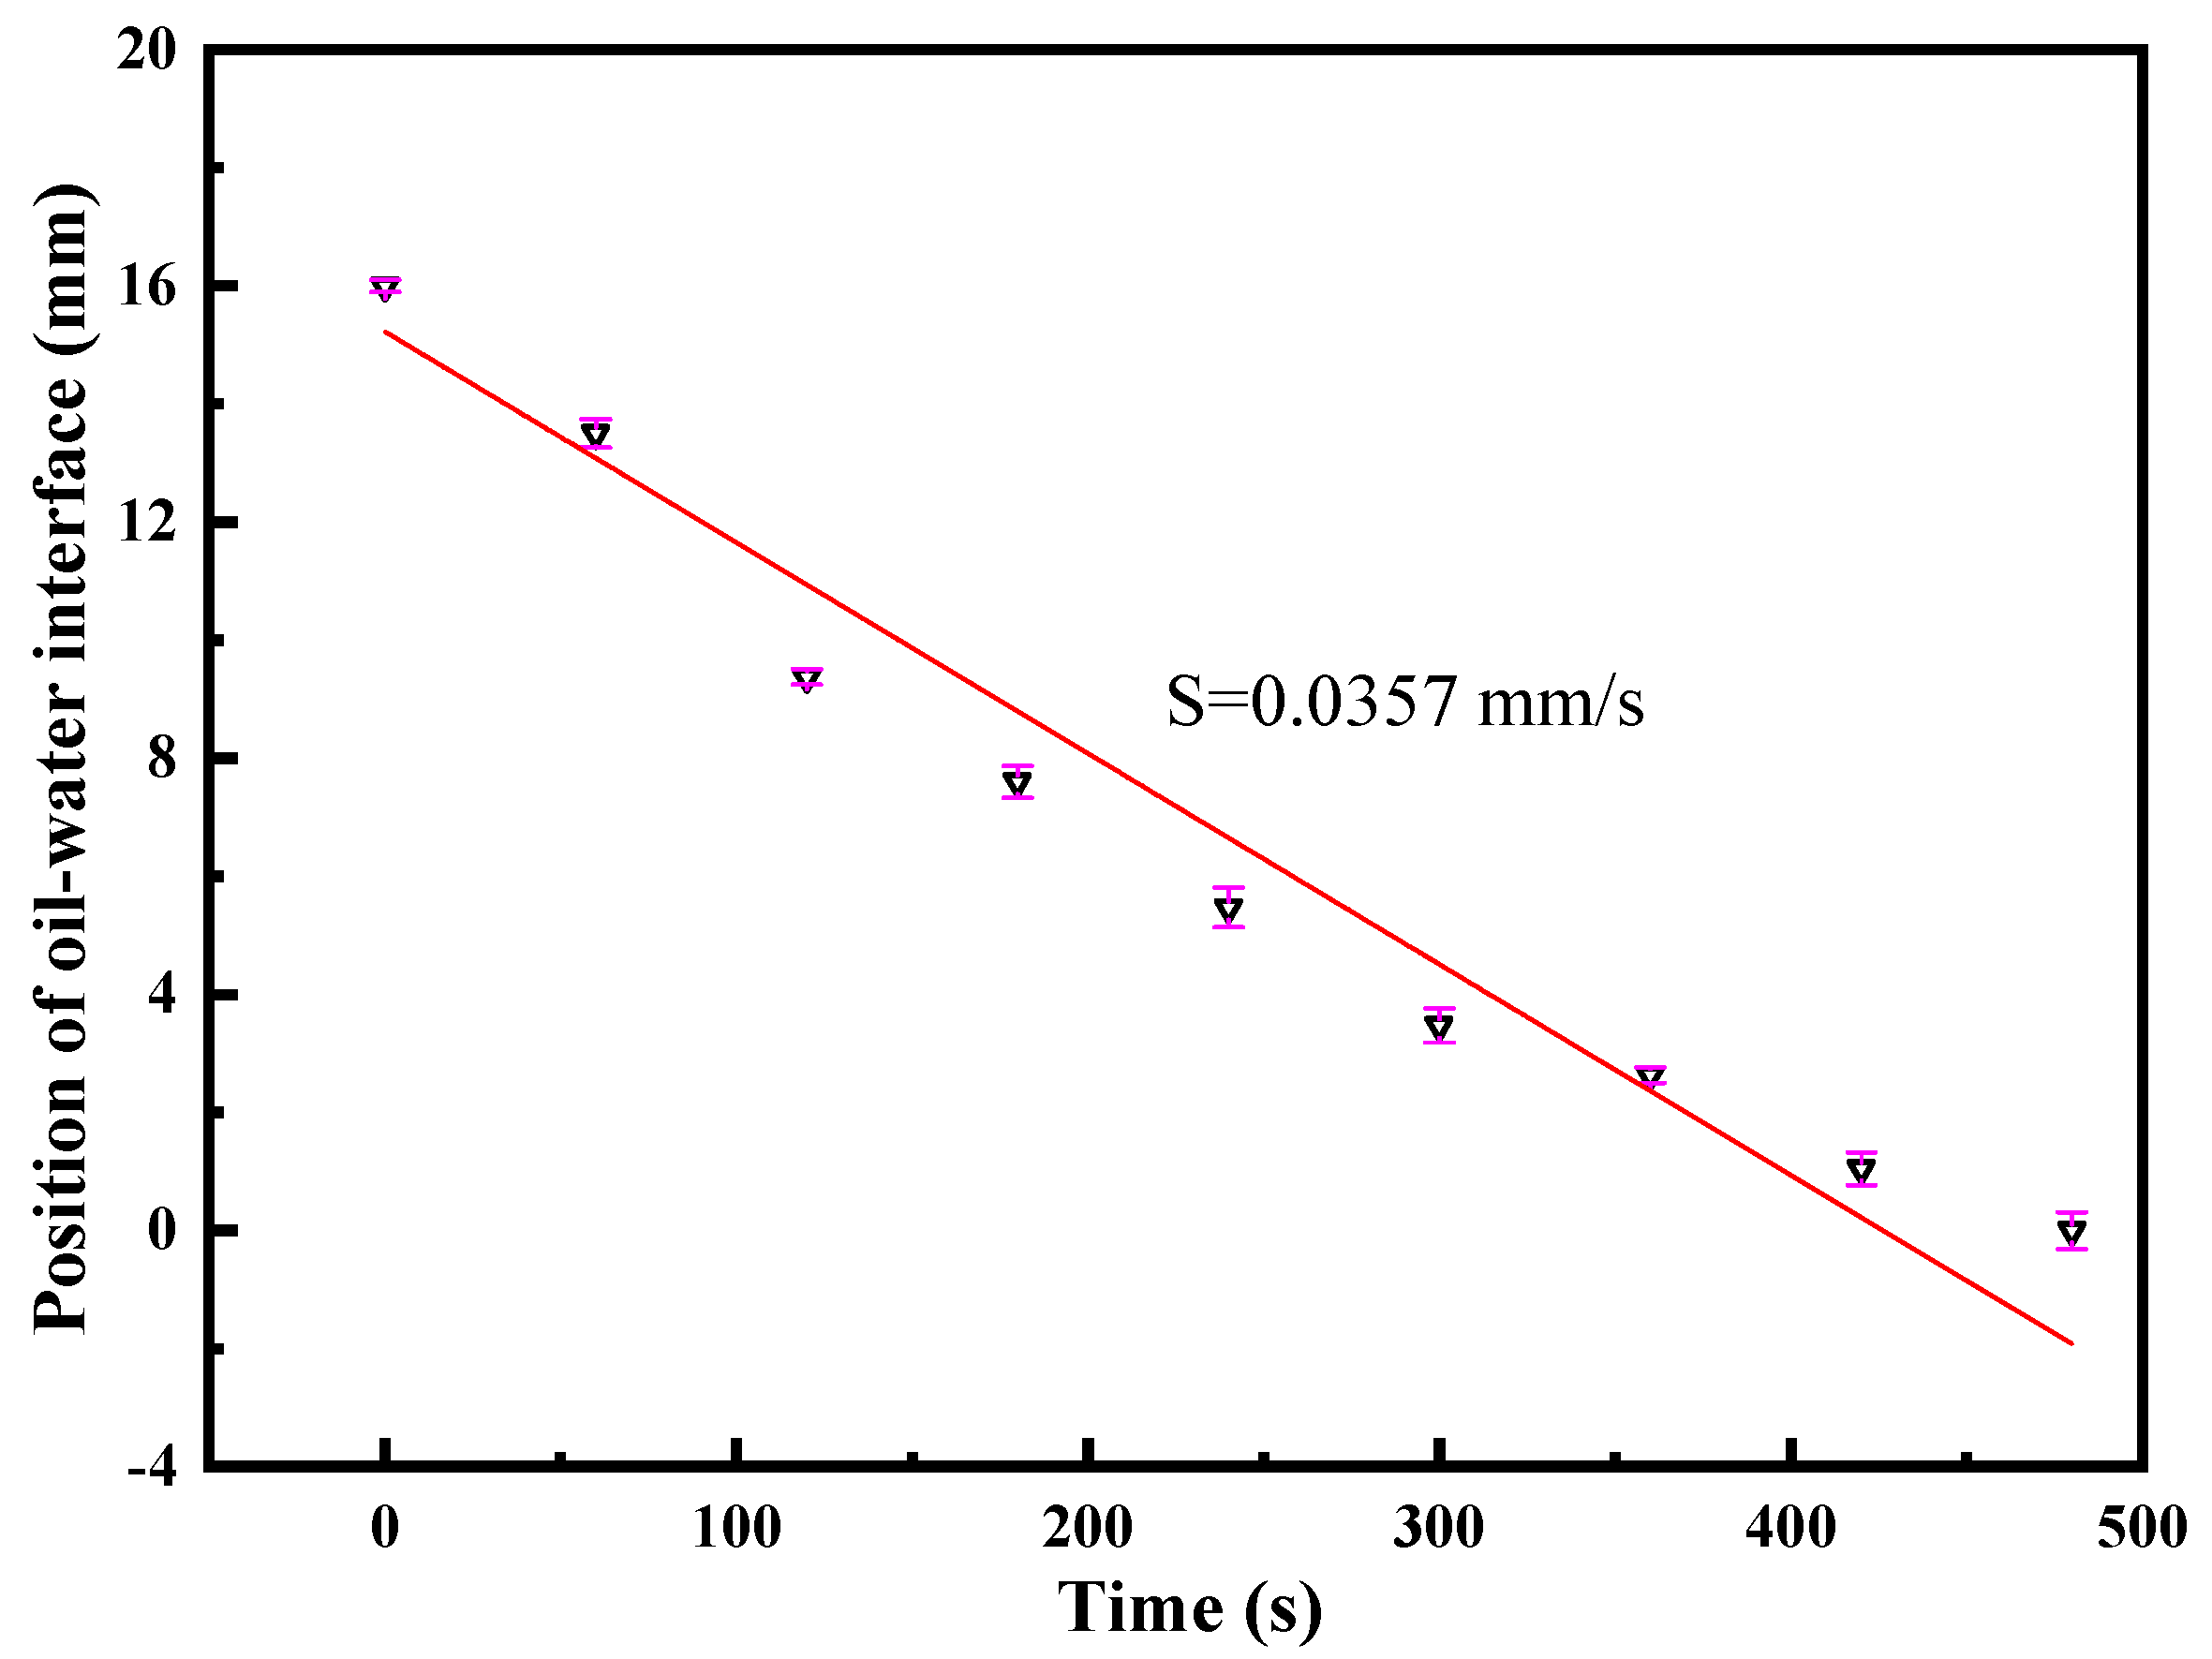
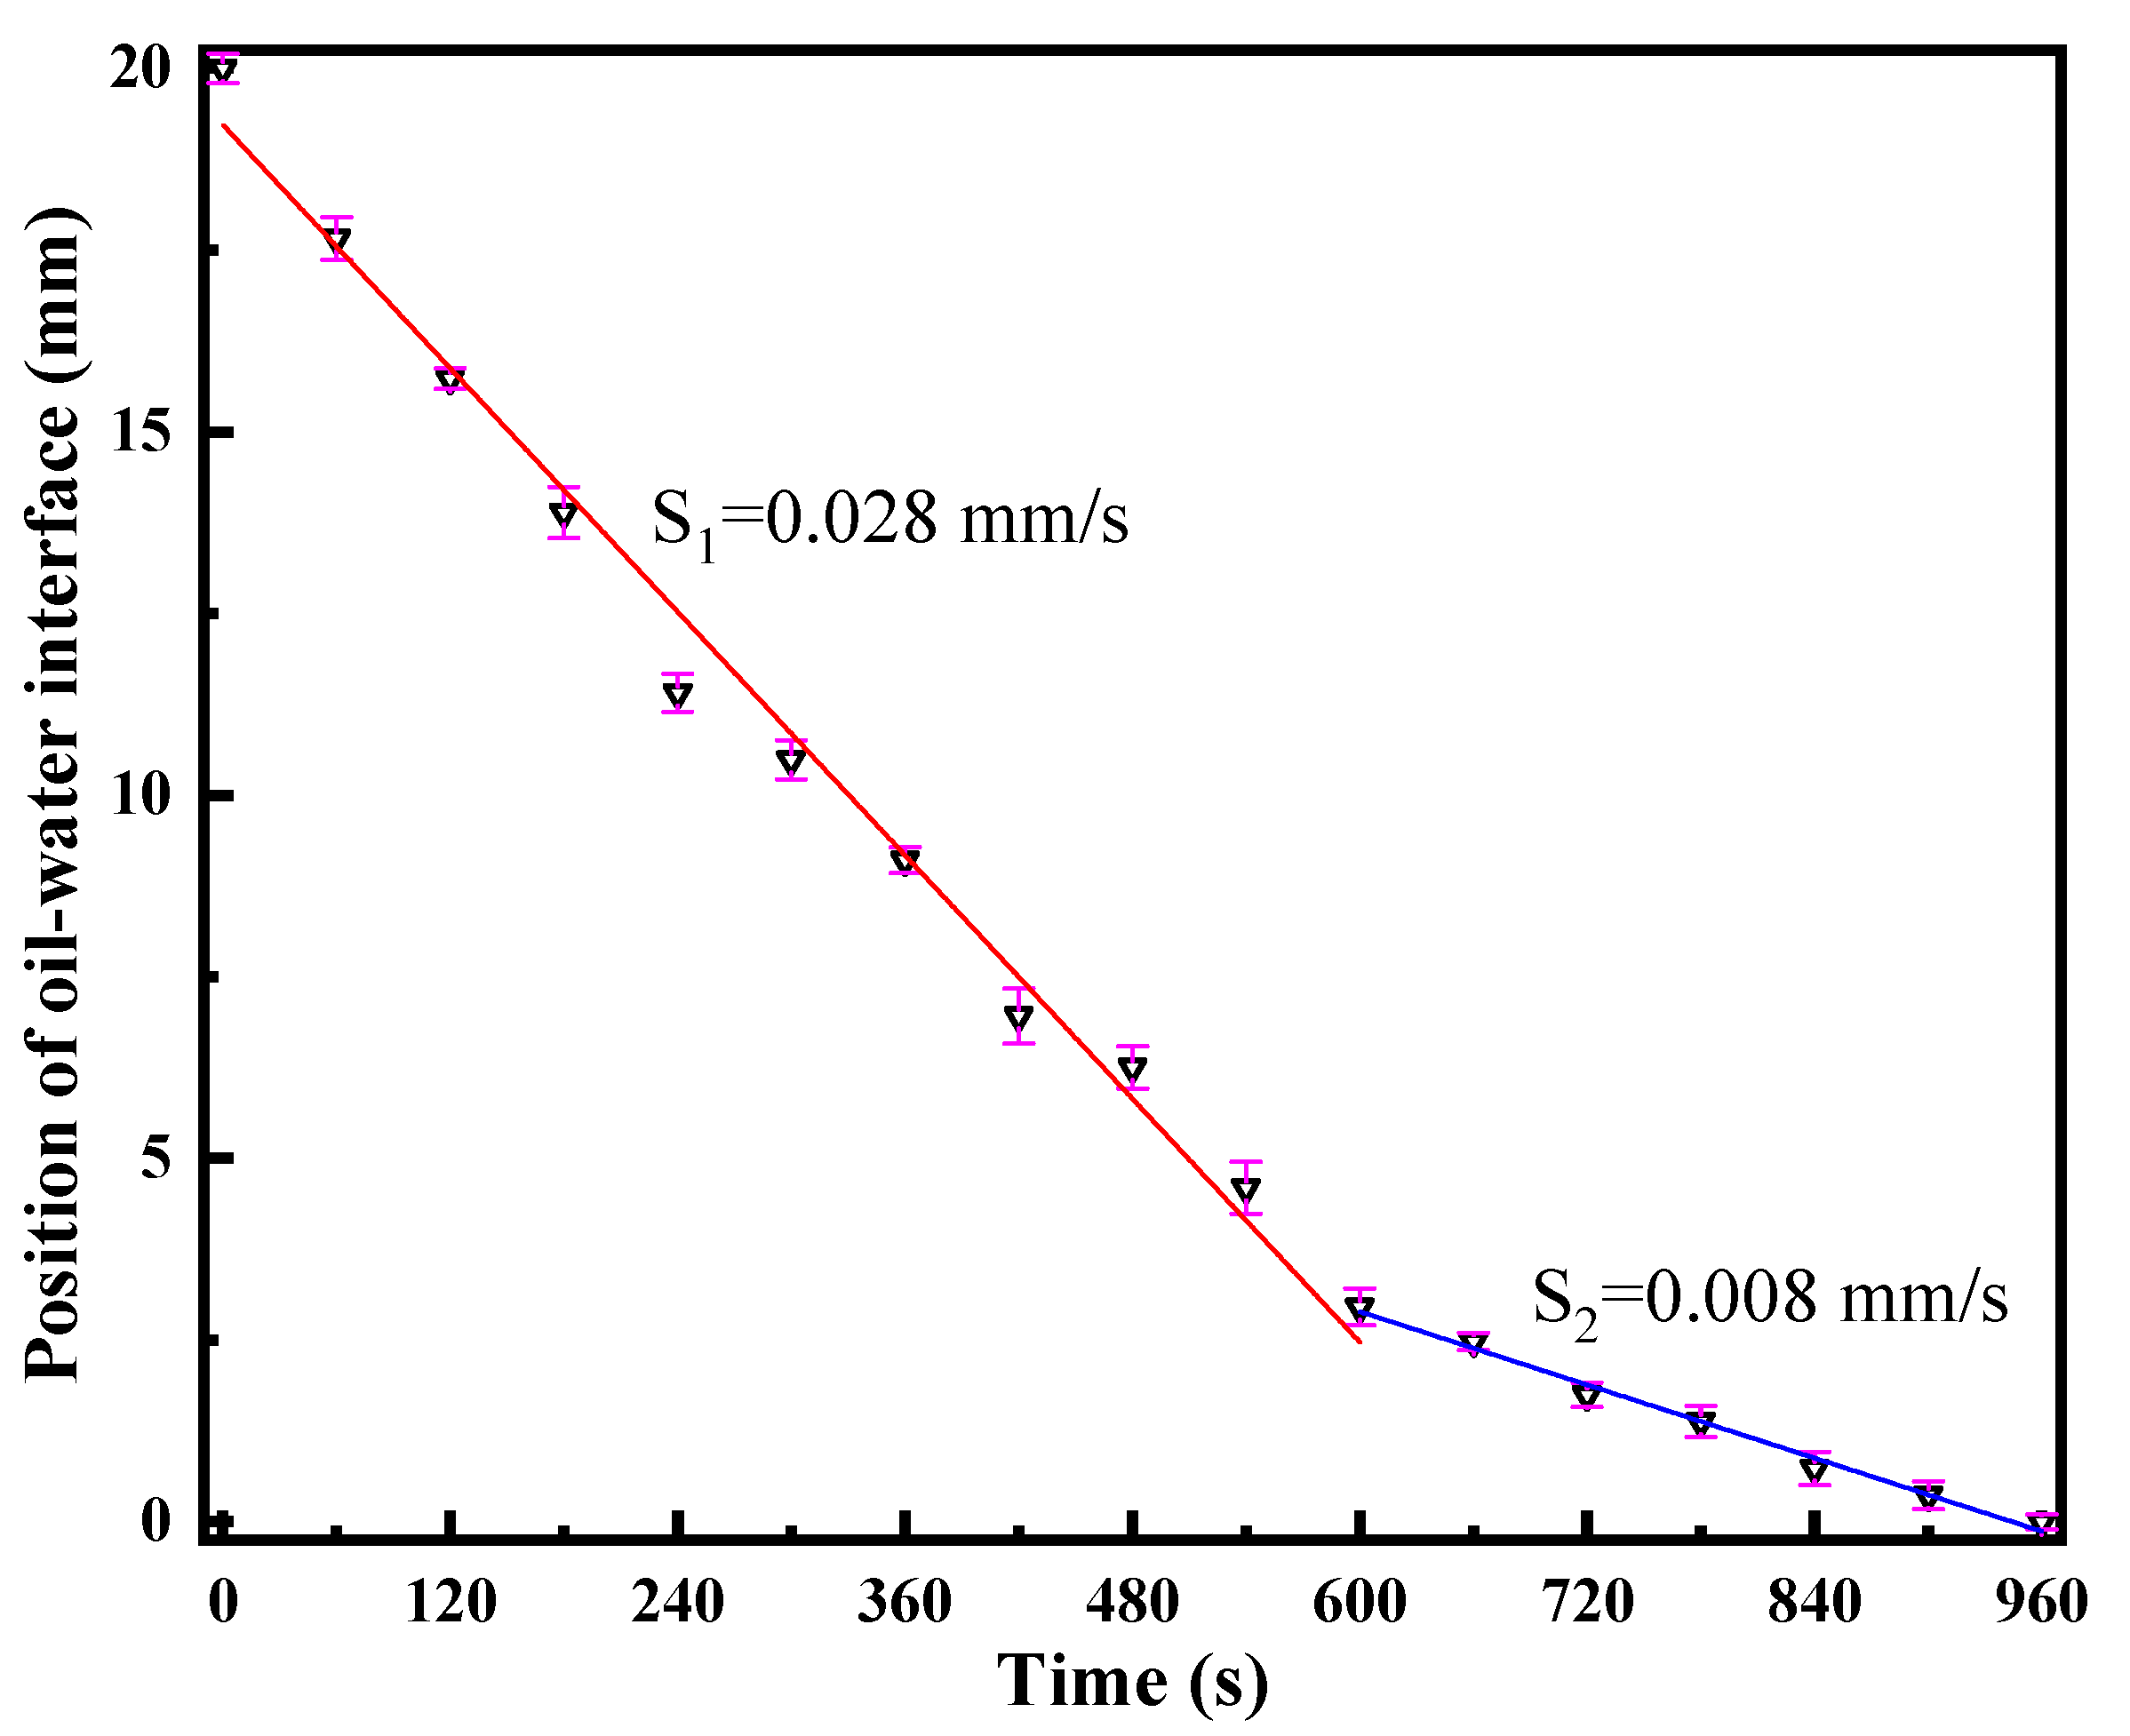
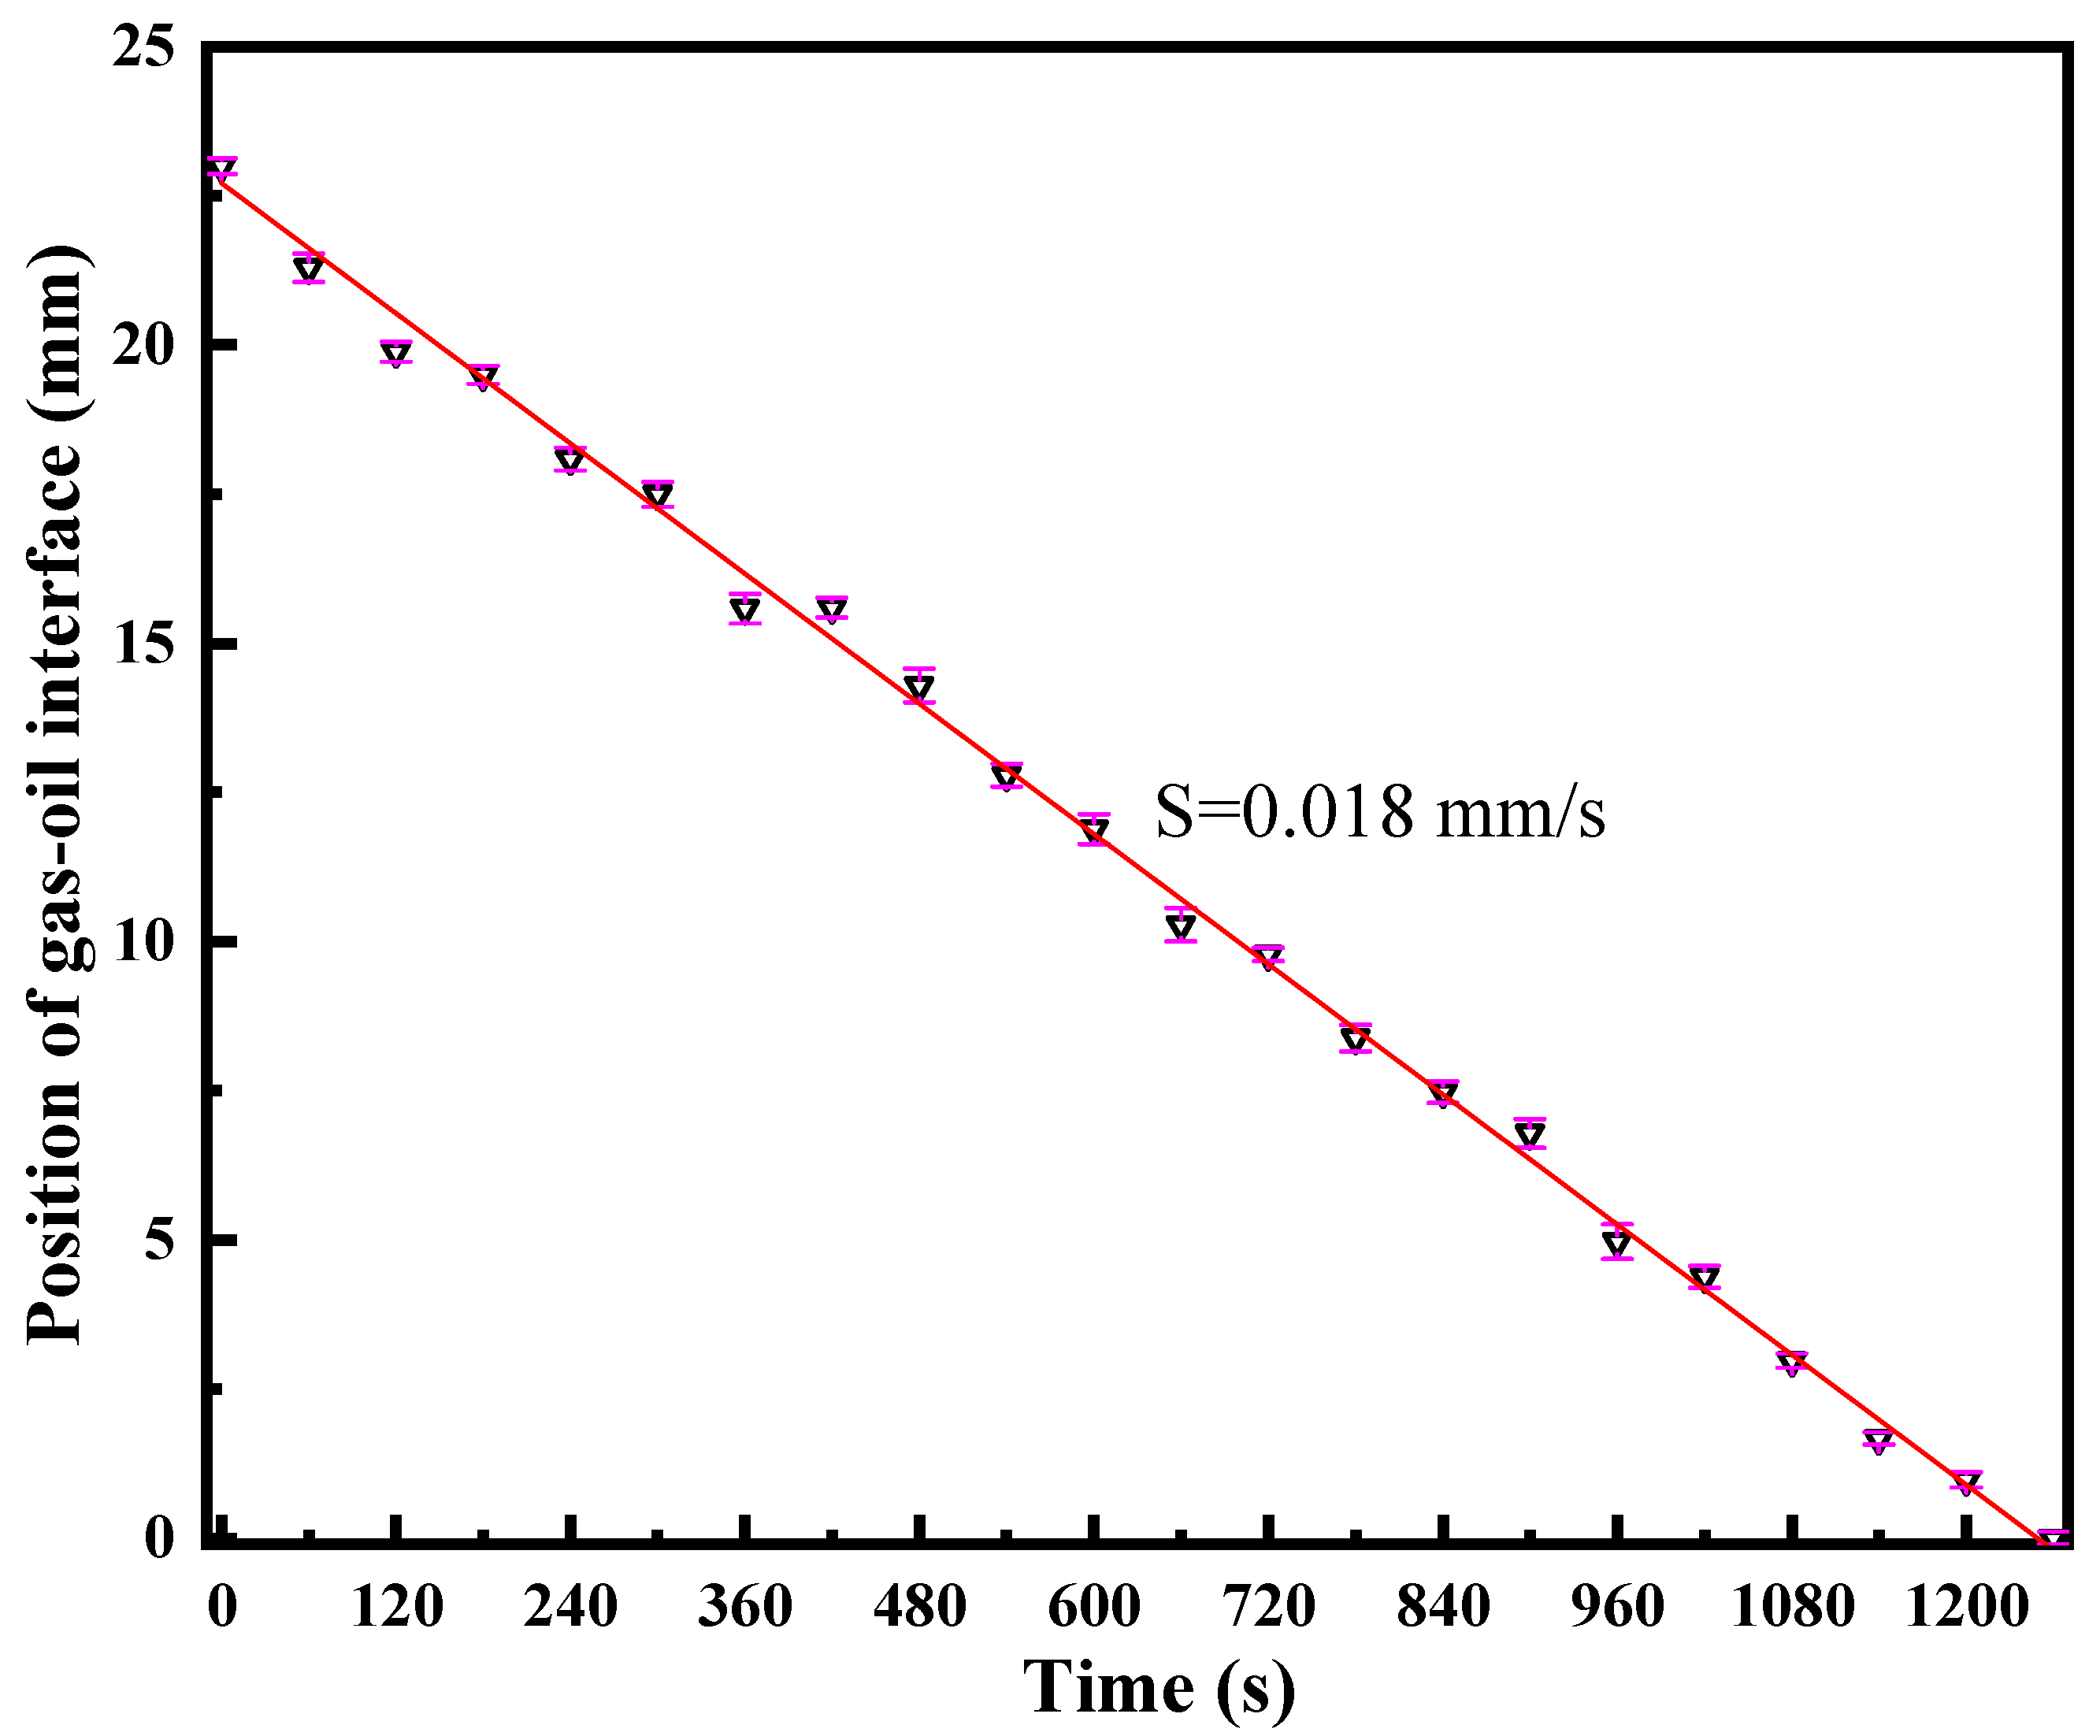
3.3. Synergistic Effects of Foam-Assisted N2 and Bottom Water on Interface Evolution

Foam cannot form a channeling path due to its low mobility, coating effect on N2, and Jamin effect when flows in the fracture–vuggy units [30,37]. The foam accumulation in a fracture–vuggy unit can increase the flow resistance of N2 and inhibit the N2 channeling formation, resulting in the increase of sweep efficiency [30]. This accumulation behavior in the top of a fracture–vuggy unit can also suppress the rise of bottom water. The vug, locating between wells TK411 and TK467, is almost submerged by bottom water before foam invasion, as shown in Figure 7a. The N2 foam gradually enters the vug due to the excellent connectivity between the vug and well TK467. However, the foam–oil interface (FOI), seen in Figure 7b,c, is not horizontal, unlike the N2–oil interface [22]. The FOI away from the injection well is higher than that close to the injection well. The N2 with a lower flow resistance can evenly accumulate in the top of the fracture–vuggy unit, while the N2 foam with a higher migration resistance preferentially accumulates in the top of the fracture–vuggy unit close to the injection well [29,30]. With the foam injection, the N2 foam accumulates in the whole top of the vug, generating a downward-driven force. This force can suppress the rise of the OWI and inhibit the occurrence of the bottom water cone. Figure 7d shows that the foam slug moves downward with the N2 cap, and the OWI decreases back to the cylinder base tank. Finally, the originate oil belt between the foam and bottom water is recovered significantly, and especially, no residual oil film is left on the wall.

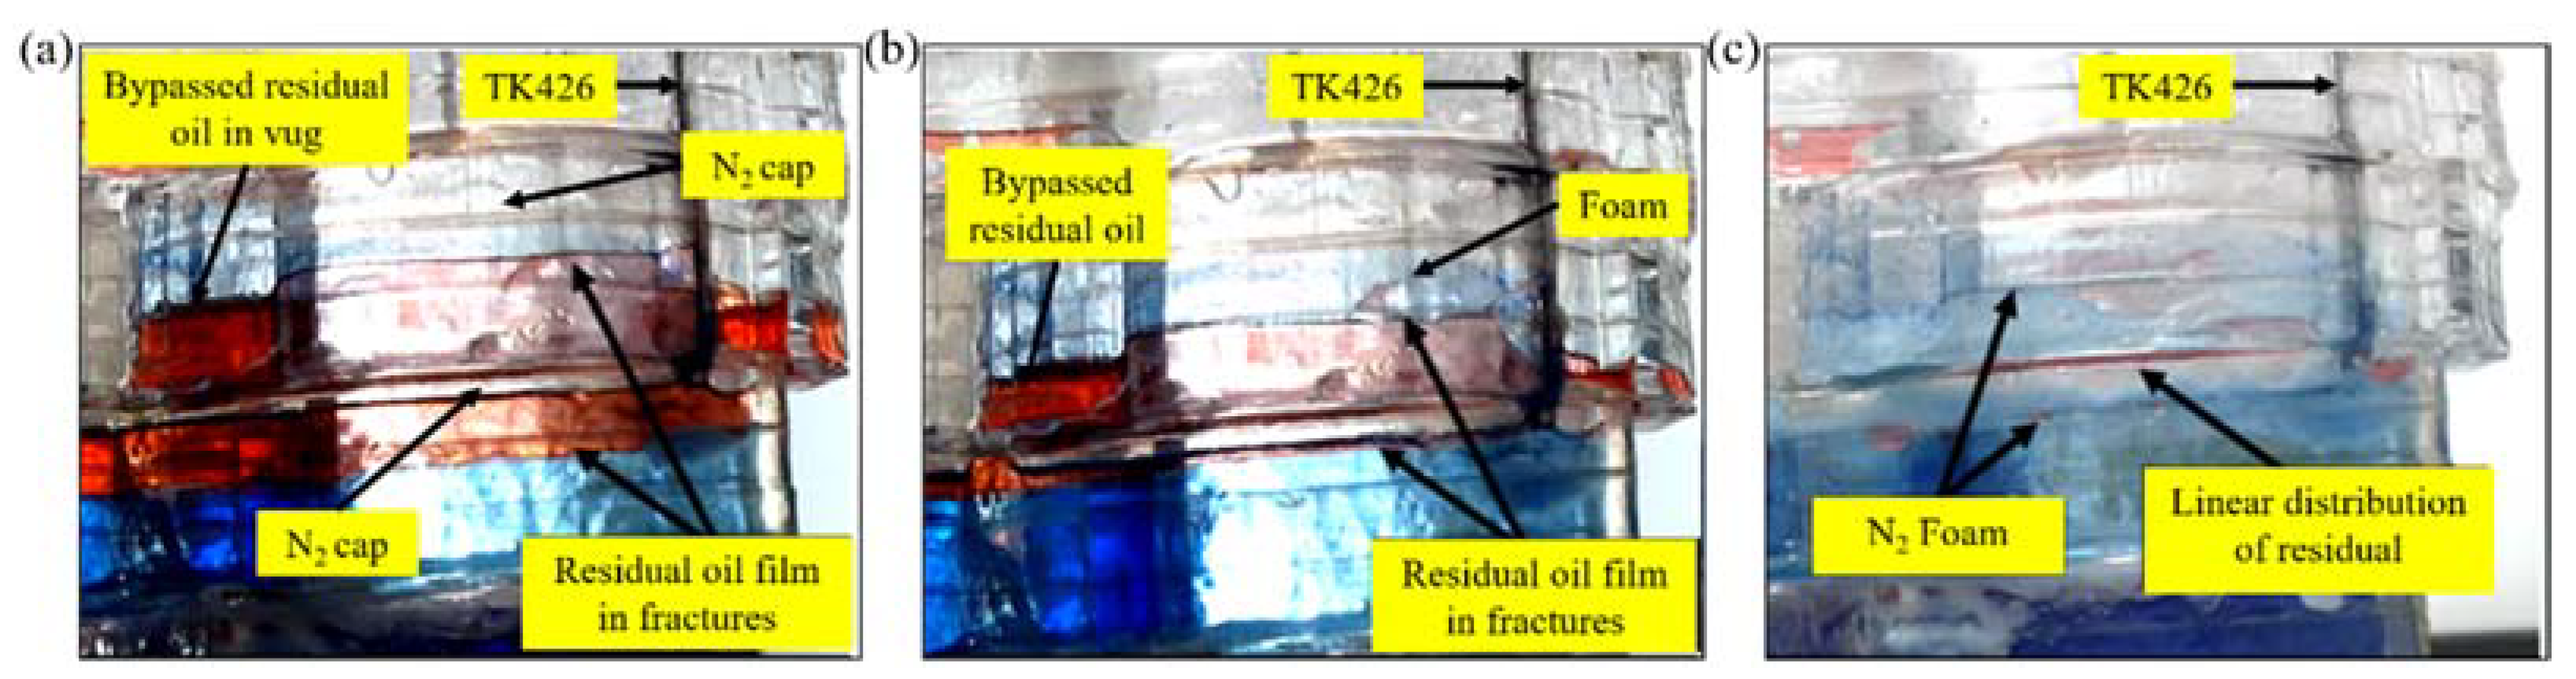
3.4. Foam-Assisted N2 on Mobilizing Residual Oil Formed from Water Flooding

(1)
Residual attic oil mobilization
The vug, located at the top of the fracture–vuggy unit controlled by T401, has poor connectivity. A lot of residual attic oil is left after being water-driven, as shown in Figure 8a. The attic oil represents the residual oil at the fracture–vuggy reservoir’s top. The injected foam and N2 gradually spread into the poor connectivity vug with time. N2 migrates to the vug top and forms an N2 cap because of the density difference of oil and N2. With the N2 and foam injection, the N2 can accumulate at the vug top and decrease the GOI height. The foam also accumulates to suppress the N2 channeling owing to the coating effects on N2, displayed in Figure 8b. The GOI height decreases further with the N2 cap expansion downward. However, the OWI position remains unchanged, although the GOI height decreases downward (Figure 8c). The higher pressure existing between the GOI and OWI is released from the production well T401. As a result, most attic oil is recovered with the release of pressure. Additionally, compared to the FOI in Figure 7, the GOI always keeps horizontal, corresponding to the discoveries in two-dimensional fracture–vuggy models [29,30,37]. Figure 8d shows a stable OWI and a significant decrease in the GOI with the N2 cap further expansion.
Moreover, the position of GOI around well T401 with time is depicted in Figure 9. The slope of this graph represents the decline rate of GOI height. It shows that the GOI height in the vug top of the fracture–vuggy unit controlled by T401 decreases at a constant rate (0.018 mm/s). The result is different from the results obtained from the OWI height decline trends (Figure 6). The GOI height decline rate (0.018 mm/s) is lower than that of the OWI (steep stage, 0.028 mm/s) due to the different distances between their fracture–vuggy structures and the injection well TK467. The closer the distance, the greater the downward driven force, resulting in a fast decline rate [29,30]. The OWI decline rate (gentle stage, 0.008 mm/s) is lower than that of the GOI (0.018 mm/s), which results from the different connectivity between their fracture–vuggy structures and around structures. The vug, which locates at the top of the fracture–vuggy unit, has poor connectivity. Therefore, the accumulated N2 and foam are less likely to spread to other fractures and vugs. On the contrary, the accumulated N2 and foam in an excellent connectivity vug can migrate into other fractures and vugs, causing a lower OWI height decline rate.
(2)
Residual oil film and bypassed oil mobilization
The fracture–vuggy unit controlled by well TK426 has complex fracture and vug structures and is far away from the injection well TK467. Various residual oil types are formed in the fracture–vuggy unit controlled by TK426, such as oil film and bypassed oil (Figure 10a). The oil film is mainly left in fractures, while the bypassed oil is primarily left in blind vugs, which cannot be mobilized during water flooding. Foam from the adjacent fracture–vuggy unit gradually migrates to the top of the fracture–vuggy unit controlled by TK426. The upward migration behaviors of foam and N2 result from the density difference between oil and N2 foam. The foam slug moves downward with the action of the N2 cap and can detach oil film and mobilize bypassed oil, seen in Figure 10b. In addition, the foam between N2 and oil can suppress N2 channeling and increase the sweep efficiency of N2 due to the foam plugging effect. With the injection of foam and N2, the most residual oil after water flooding is mobilized and recovered from well TK426 (Figure 10c). Additionally, Figure 10c shows that little residual oil is left in the form of linear distribution after foam-assisted nitrogen gas flooding.

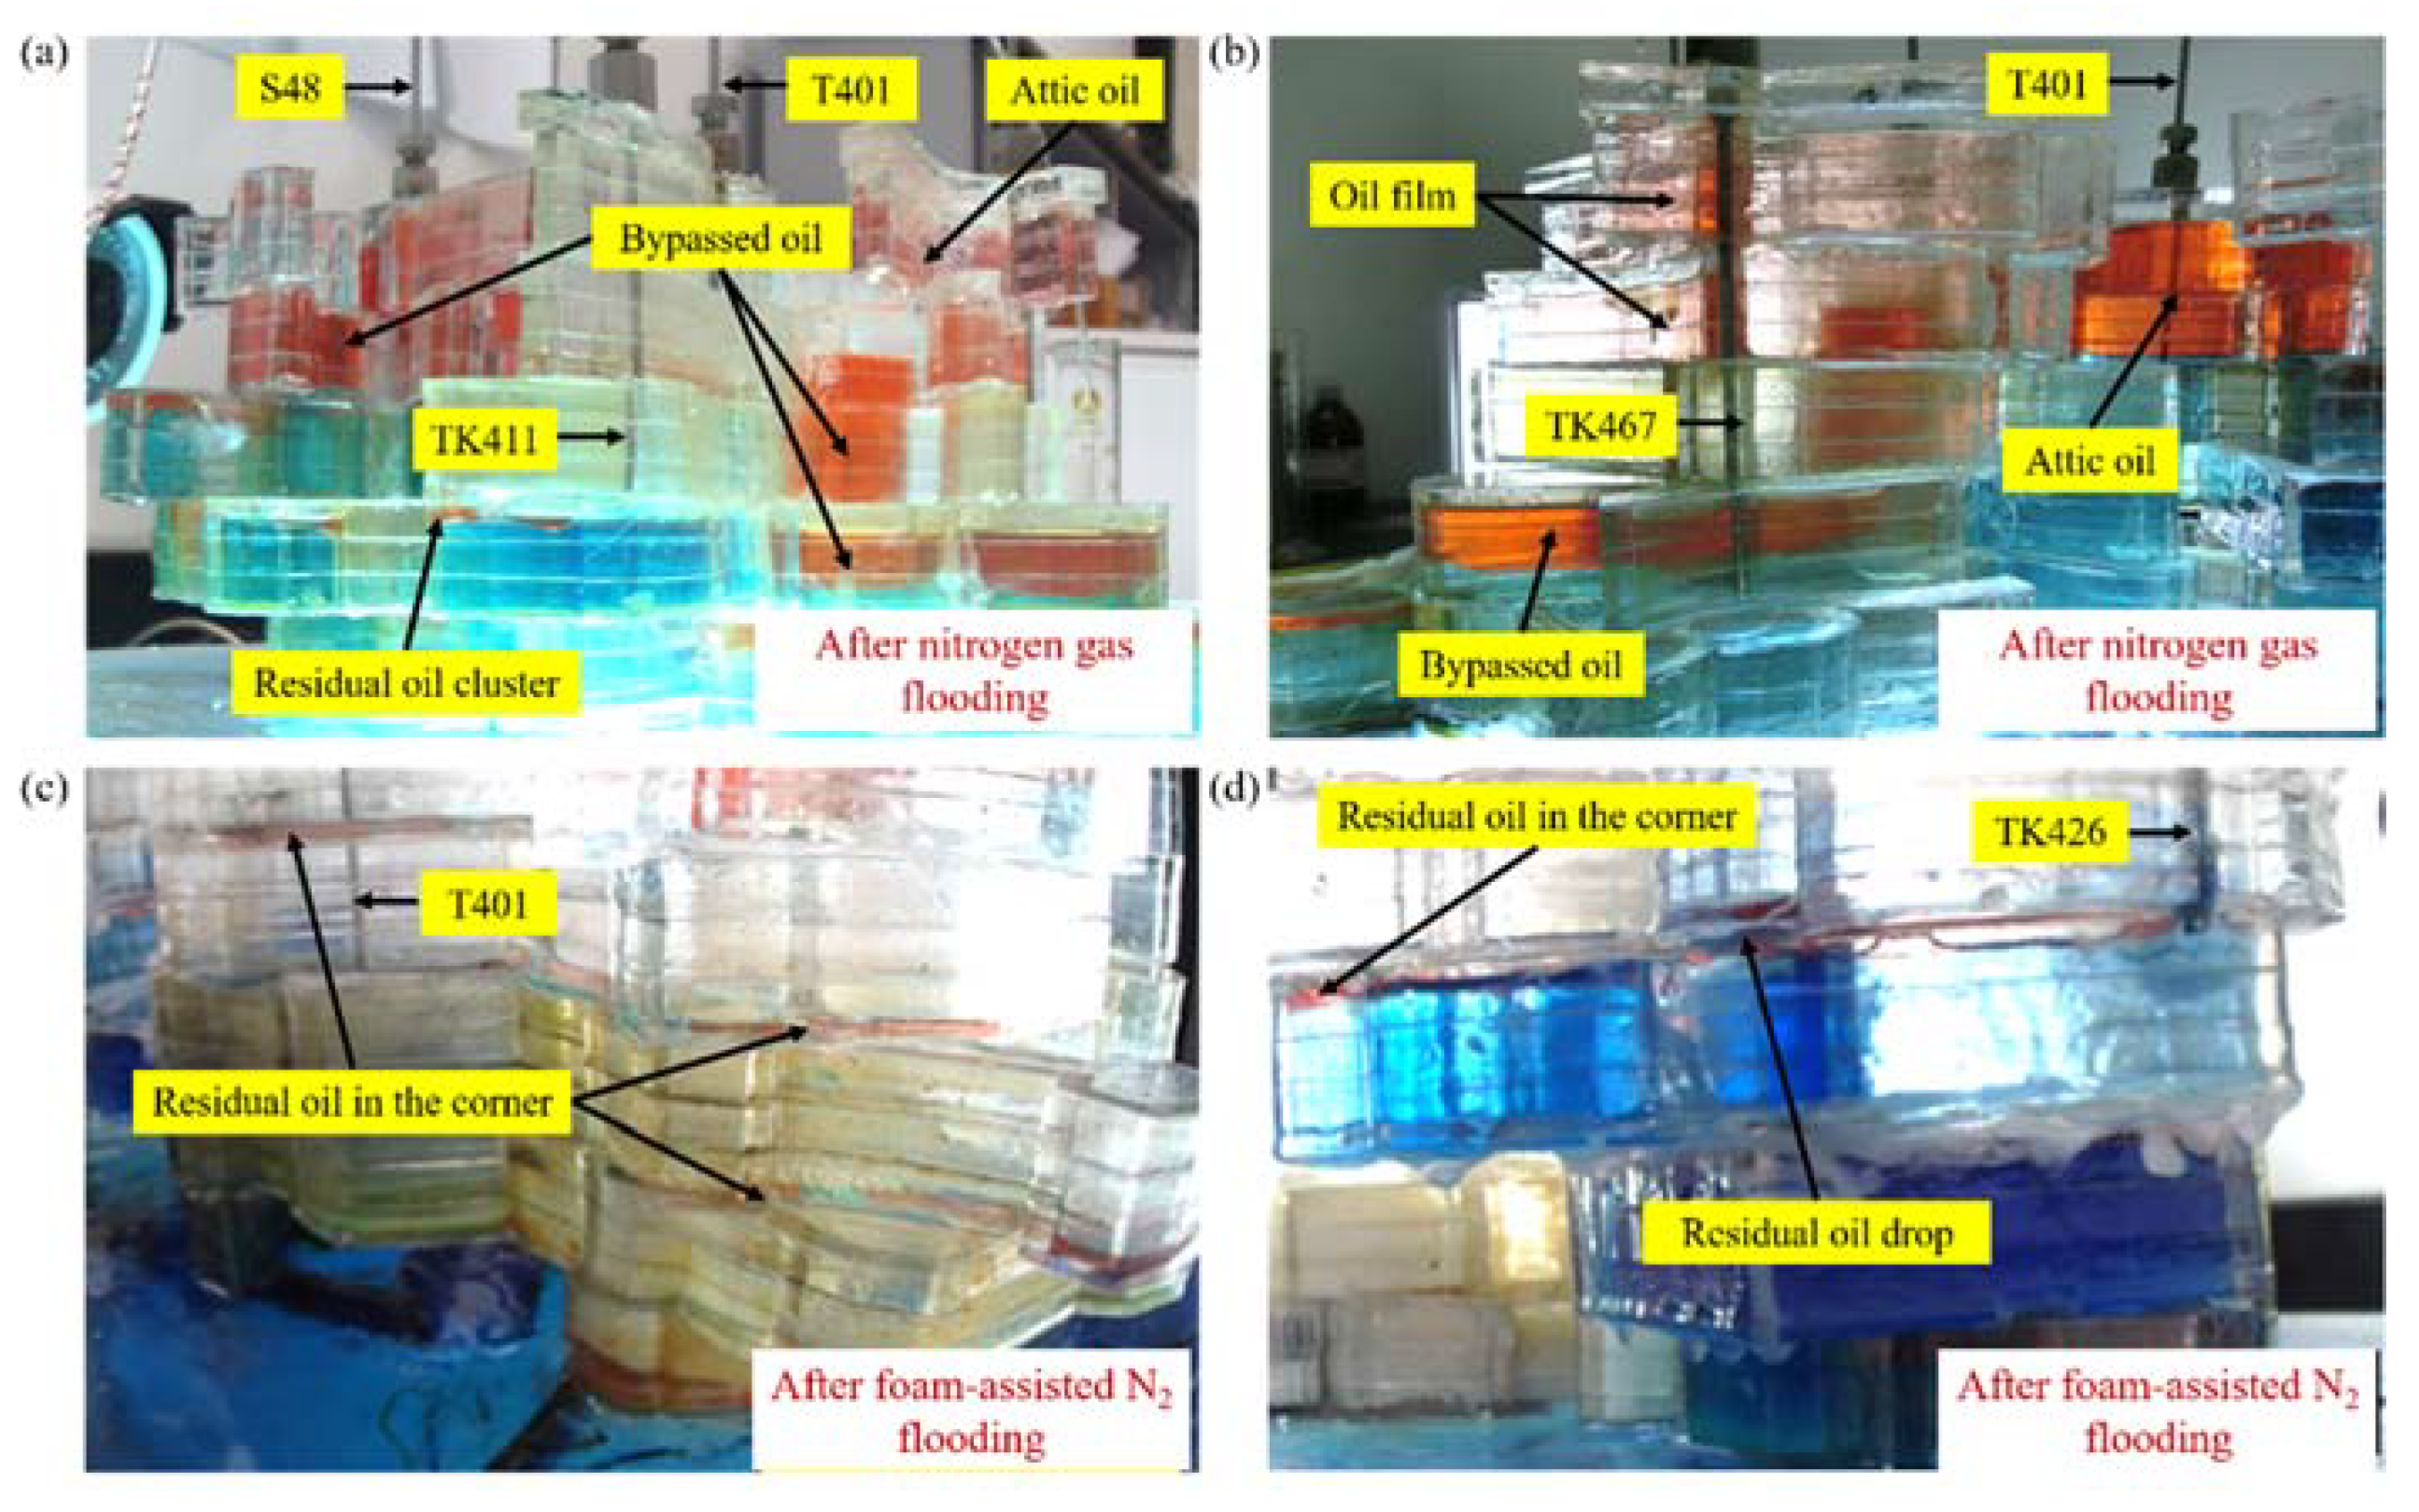
3.5. Classification of Residual Oil after Foam-Assisted N2 Flooding

Figure 11 shows the residual oil types in the three-dimensional visualized fracture–vuggy physical model after foam-assisted N2 and nitrogen flooding. Most residual oil can be observed in the three-dimensional visualized fracture–vuggy physical model after nitrogen gas flooding compared with foam-assisted nitrogen flooding. In other words, foam-assisted nitrogen flooding technology has better oil displacement capacity than nitrogen gas flooding technology.
Figure 11 shows the different residual oil types after foam-assisted N2 flooding and nitrogen gas flooding, respectively. The detailed descriptions and formation progress for the residual oil are exhibited as follows:
(1)
Residual oil types after nitrogen gas flooding;
(a)
Residual bypassed oil
Most residual bypassed oil can be found in isolated or poorly connected fracture–vuggy units. The displacing phases (water or nitrogen gas) preferentially enter the fracture–vuggy units with excellent connectivity. Once the mainstream channel is formed, the oil in the isolated or poorly connected fracture–vuggy units is locked by displacing phases. As a result, the residual bypassed oil is formed, seen in Figure 11a,b.
(b)
Residual oil film
The oil has strong adhesion to the oil-wet surface of model. The injected water and nitrogen gas have no ability to change the IFT between oil and the model’s surfaces. Hence, many oil films are left after water and nitrogen flooding because of the high IFT, seen in Figure 11a,b. However, the injected foam can release surfactants to the water phase to reduce IFT. The reduction in IFT is conducive to detaching oil film, shown in Figure 11c,d.
(c)
Residual attic oil
Residual attic oil represents the residual oil at the fracture–vuggy unit’s top. As the water cut reaches 100%, or the dominant gas channeling is formed, the residual attic oil at the fracture–vuggy unit’s top is left, especially in some isolated or poorly connected fractures and vugs, as shown in Figure 11a,b.
(d)
Residual oil cluster
The continuous oil phase can be broken up into large-scale size oil clusters by displacement phases. As the oil is recovered continuously, some of the oil clusters are left in the corner, seen in Figure 11a.
(2)
Residual oil types after foam-assisted N2 flooding;
(a)
Residual oil in the corner
During foam-assisted N2 flooding, there is almost no oil film left because of the IFT reduction of oil and solid surface. However, some oil film in the corner that is not in the main flow field cannot be detached and displaced, seen in Figure 11c,d.
(b)
Residual oil drop
Residual oil drops refer to the oil droplets with a smaller size compared to the residual oil cluster. The oil droplets are formed because the IFT of oil and water can be decreased as a result of the presence of surfactants, shown in Figure 11d.

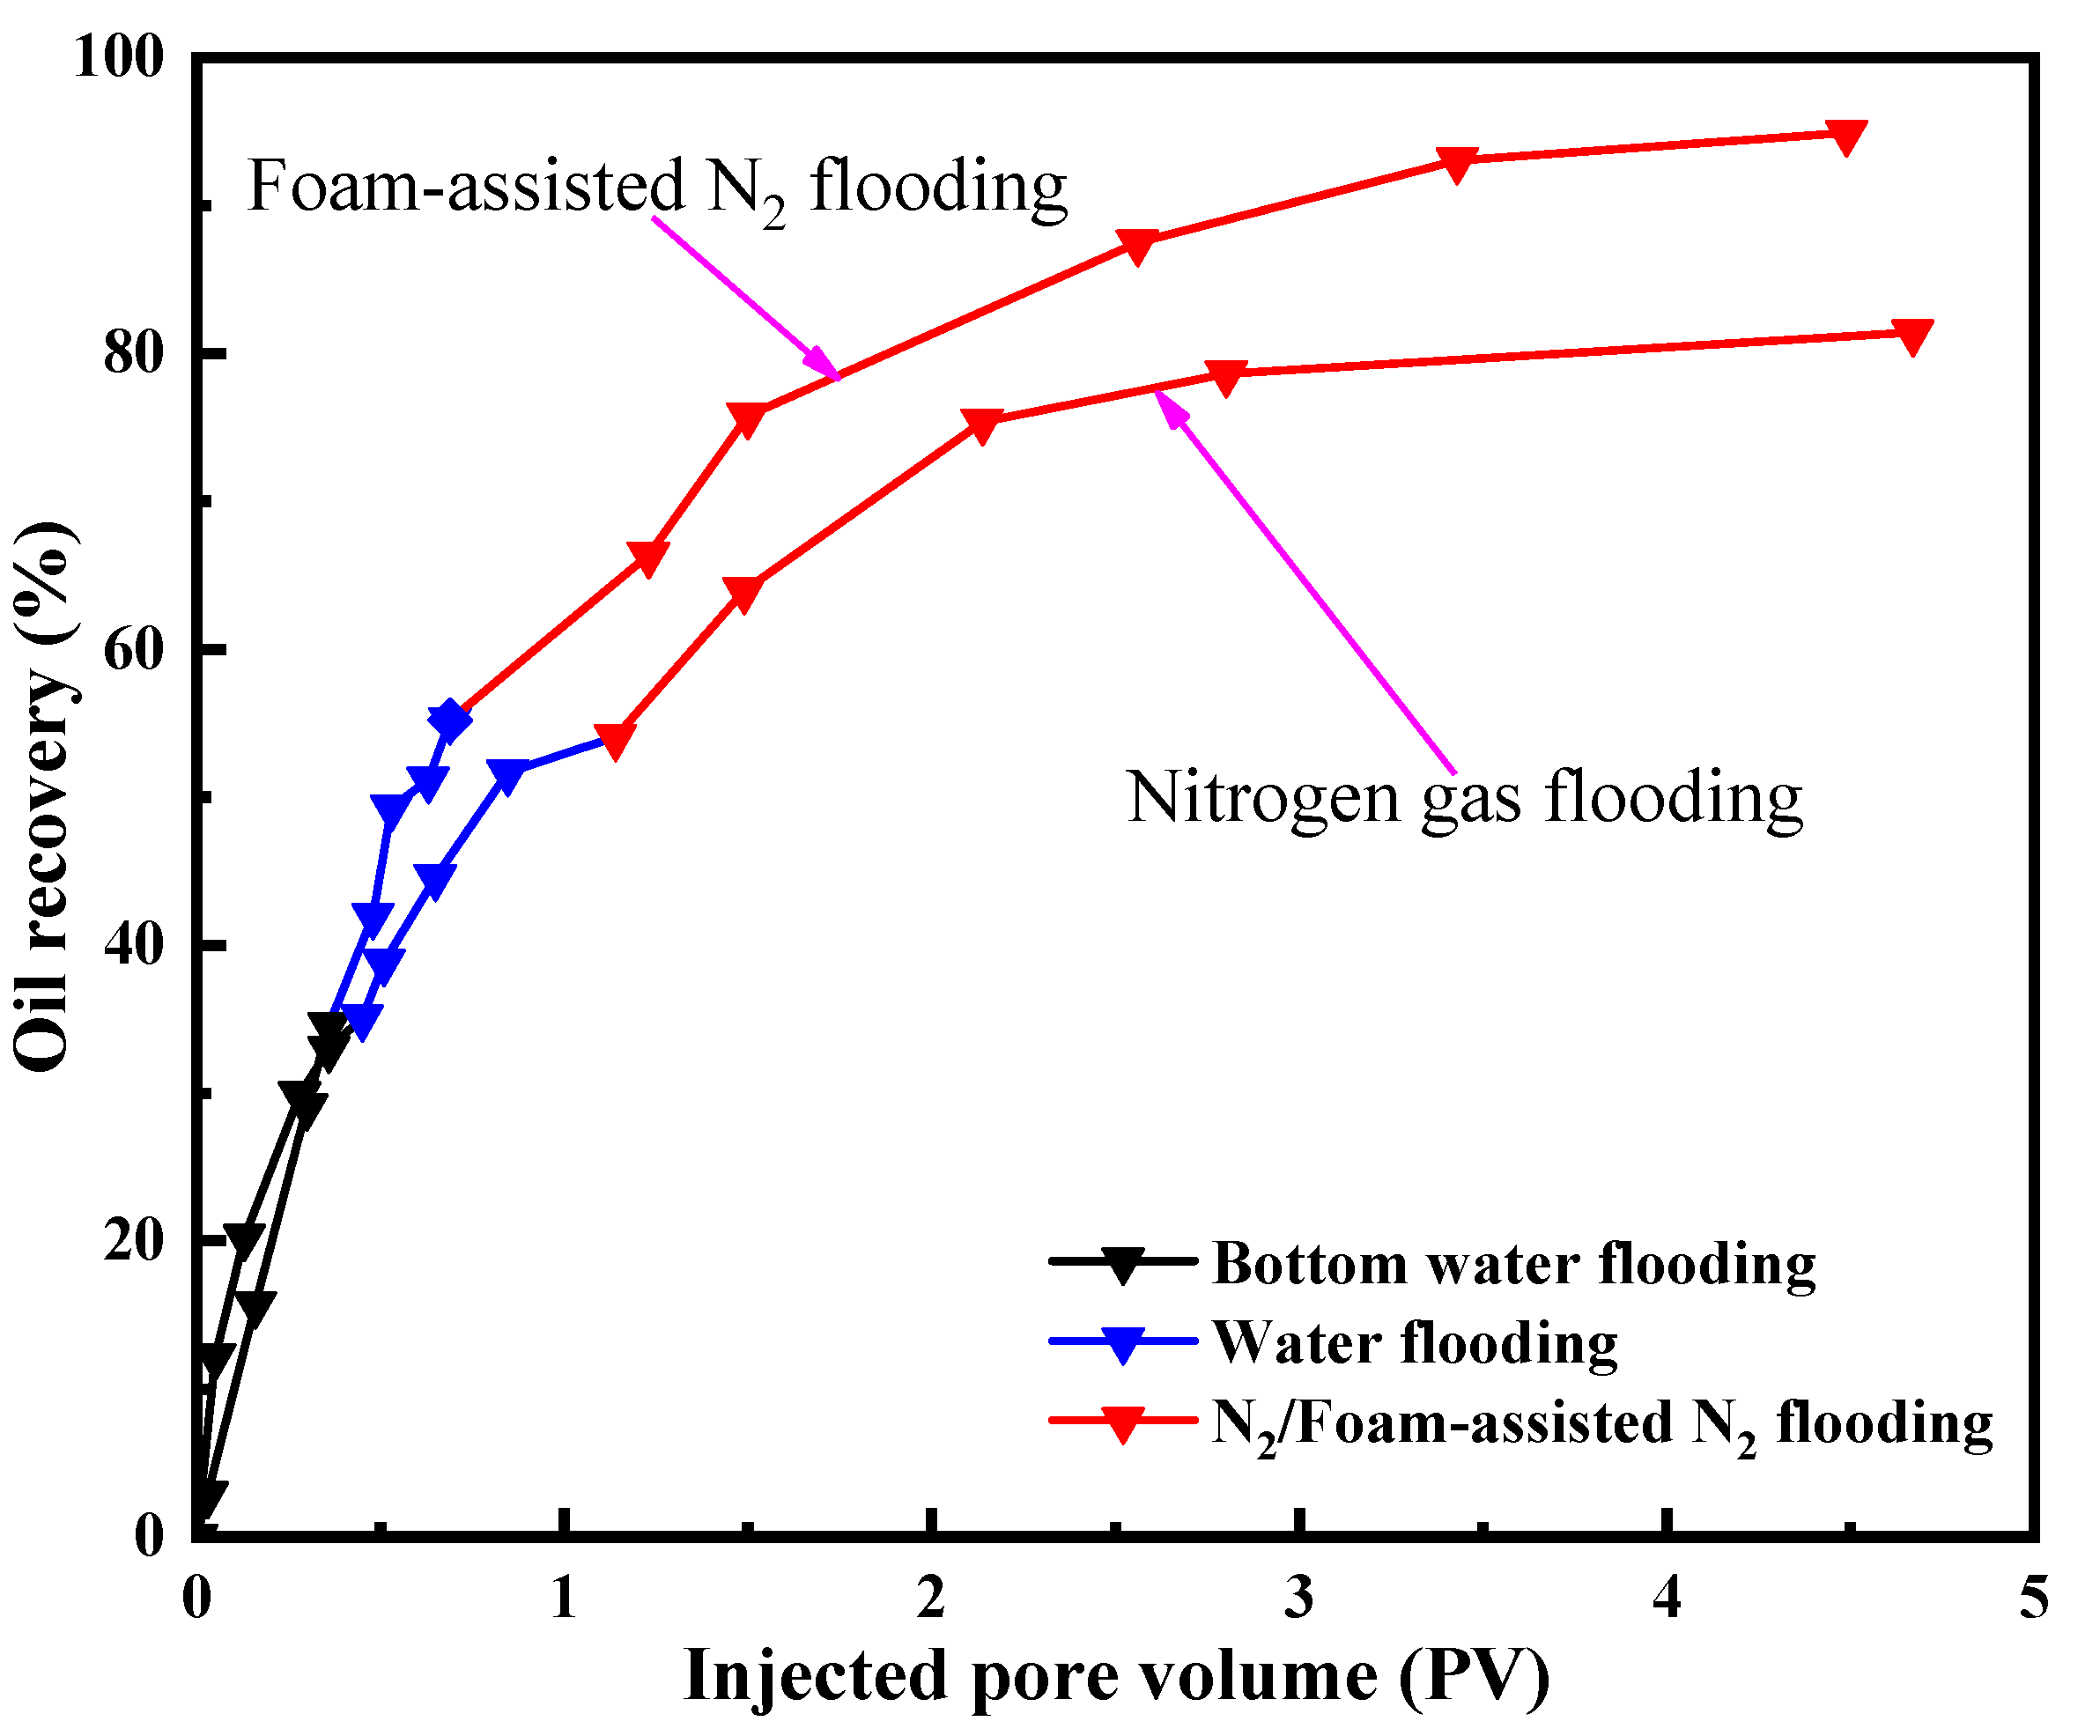
3.6. Dynamic Oil Recovery

Figure 12 shows the dynamic oil recovery with injected pore volume (PV) at different flooding stages with different technologies. The increase in oil recovery is recorded in Table 5. The increases in oil recovery during bottom water flooding and water flooding processes are around 35% and 20%, respectively. However, there are different values in increased oil recovery during nitrogen flooding and foam-assisted nitrogen flooding. A total of 39.7% of increased oil recovery is achieved after foam-assisted N2 flooding, while nitrogen gas technology contributes 27.34% of oil recovery. It can be seen that the nitrogen gas flooding technology has a relatively fast EOR rate at the beginning stage compared with foam-assisted N2 flooding technology. This result is attributed to the lower flow resistance of nitrogen gas possessing a rapid expansion rate. However, once the gas channeling is formed, the oil recovery is almost stable. The foam slug with higher flow resistance can enlarge the sweep efficiency of N2 and suppress the gas channeling formation. In addition, the surfactants released from foam can reduce the IFT and improve the oil washing efficiency. Thereby, foam-assisted nitrogen flooding technology has better potential for EOR in fracture–vuggy reservoirs compared to nitrogen gas flooding technology.

4. Conclusions

In conclusion, the fluid flow behaviors from foam-assisted N2 flooding are intuitively observed in a three-dimensional visualized fracture–vuggy model. Foam and N2 can migrate to the upper region of the fracture–vuggy units due to gravity overlap effects. The accumulation of foam and N2 at the top of the fracture–vuggy unit is conducive to enhancing oil recovery. Significantly, foam slug can enlarge the sweep efficiency of N2, suppress the formation of nitrogen channeling, and detach the oil film. Additionally, the decline rate of OWI height near the injection well is faster than that of the OWI height far away injection well. The FOI of the foam displacement front is higher than that of the foam displacement behind, which is highly consistent with the published results from the two-dimension fracture–vuggy model. The residual oil types after nitrogen gas flooding include bypassed oil, oil film, attic oil, and oil cluster, while the residual oil types after foam-assisted N2 flooding include residual oil in the corner and residual oil drop. Finally, 39.70% of oil recovery can be increased by foam-assisted N2 flooding, which has a 12.36% higher oil recovery than nitrogen gas flooding.

Author Contributions

Conceptualization, M.Q.; methodology, M.Q., T.L. and J.H.; software, M.Q. and T.L.; formal analysis, M.Q. and T.L.; investigation, M.Q. and T.L.; data curation, M.Q.; writing—original draft preparation, M.Q., T.L. and J.H.; writing—review and editing, M.Q., T.L. and J.H.; visualization, T.L.; supervision, J.H.; project administration, J.H.; funding acquisition, M.Q. All authors have read and agreed to the published version of the manuscript.

Funding

This research was funded by the Science Foundation of China University of Petroleum, Beijing (Grant No. 2462020XKBH013 and 2462017YJRC037) and the National Natural Science Foundation of China (Grant No. 51804316).

Institutional Review Board Statement

Not applicable.

Informed Consent Statement

Not applicable.

Acknowledgments

Thanks for the contributions with this article from Yulong Yang (China University of Petroleum-Beijing), Chuanzhen Song (Sinopec Petroleum Exploration and Production Research Institute), Nuo Yuan (Sinopec Petroleum Exploration and Production Research Institute), Tao Tan (Sinopec Northwest China Petroleum Bureau), Xinbian Lu (Sinopec Northwest China Petroleum Bureau) and Xingquan Liu (Daqing Oil Field Limited Company The No. 8 Oil Production Sub-Company).

Conflicts of Interest

The authors declare no conflict of interest.

References

  1. Aftab, A.; Ismail, A.R.; Ibupoto, Z.H.; Akeiber, H.; Malghani, M.G.K. Nanoparticles based drilling muds a solution to drill elevated temperature wells: A review. Renew. Sustain. Energy Rev. 2017, 76, 1301–1313. [Google Scholar] [CrossRef]
  2. Rezk, M.Y.; Allam, N.K. Impact of Nanotechnology on Enhanced Oil Recovery: A Mini-Review. Ind. Eng. Chem. Res. 2019, 58, 16287–16295. [Google Scholar] [CrossRef] [Green Version]
  3. Hou, J.; Luo, M.; Zhu, D. Foam-EOR method in fractured-vuggy carbonate reservoirs: Mechanism analysis and injection parameter study. J. Petrol. Sci. Eng. 2018, 164, 546–558. [Google Scholar] [CrossRef]
  4. Akbar, M.; Vissapragada, B.; Alghamdi, A.H.; Allen, D.; Herron, M.; Carnegie, A.; Saxena, K. A Snapshot of Carbonate Reservoir Evaluation. Oilfield Rev. 2001, 12, 20–41. [Google Scholar]
  5. Li, Y. The theory and method for development of carbonate fractured-cavity reservoirs in Tahe oilfield. Acta Pet. Sin. 2013, 34, 115–121. [Google Scholar]
  6. Bai, Y.; Li, J.; Xiong, C.; Shang, X.; Wei, F.; Zhang, M. Effect of a polymer on chromium(III) diffusion during gelant injection in fractured media. J. Appl. Polym. Sci. 2016, 133, 43447. [Google Scholar] [CrossRef]
  7. Hou, J.; Li, H.; Jiang, Y.; Luo, M.; Zheng, Z.; Zhang, L.; Yuan, D. Macroscopic three-dimensional physical simulation of water flooding in multi-well fracture-cavity unit. Petrol. Explor. Dev. 2014, 41, 784–789. [Google Scholar] [CrossRef]
  8. Chen, Z.H.; Dai, Y.; Lang, Z.X. Storage-percolation modes and production performance of the karst reservoirs in Tahe Oilfield. Pet. Explor. Dev. 2005, 32, 101–105. [Google Scholar]
  9. Corbett, P.W.; Geiger, S.; Borges, L.; Garayev, M.; Gonzalez, J.G.; Valdez, C. Limitations in Numerical Well Rest Modelling of Fractured Carbonate Rocks. In Proceedings of the Spe Europec/eage Conference & Exhibition, Barcelona, Spain, 14–17 June 2010. [Google Scholar]
  10. Yousef, A.N.; Behzad, T.; Abolghasem, K.R.; Shahram, S.; Kaveh, K.; Amin, J. A combined Parzen-wavelet approach for detection of vuggy zones in fractured carbonate reservoirs using petrophysical logs. J. Pet. Sci. Eng. 2014, 119, 1–7. [Google Scholar] [CrossRef]
  11. Li, Y.; Jing, Q.; Zhong, J.; Zou, S. Karst zonings and fracture-cave structure characteristics of Ordovician reservoirs in Tahe oilfield, Tarim Basin. Acta Pet. Sin. 2016, 37, 289–298. [Google Scholar]
  12. Yong, L.; Wang, D.; Liu, Z.; Ma, X. Development Strategy Optimization of Gas Injection Huff and Puff for Fractured-Caved Carbonate Reservoirs. In Proceedings of the Spe Kingdom of Saudi Arabia Technical Symposium & Exhibition, Dammam, Saudi Arabia, 25–28 April 2016. [Google Scholar]
  13. Wang, D.; Li, Y.; Hu, Y.; Li, B.; Deng, X.; Liu, Z. Integrated dynamic evaluation of depletion-drive performance in naturally fractured-vuggy carbonate reservoirs using DPSO–FCM clustering. Fuel 2016, 181, 996–1010. [Google Scholar] [CrossRef]
  14. Wu, X.; Hou, J.; Zheng, Z.; Luo, M.; Gao, Y. Effect of bottom water on subsequent water flooding and gas drive in fractured-vuggy carbonate oil reservoir. Pet. Geol. Recovery Effic. 2016, 23, 111–115. [Google Scholar]
  15. Gong, Y.; Gu, Y. Experimental Study of Water and CO2 Flooding in the Tight Main Pay Zone and Vuggy Residual Oil Zone of a Carbonate Reservoir. Energy Fuel 2015, 29, 6213–6223. [Google Scholar] [CrossRef]
  16. Hou, J.-R.; Zheng, Z.-Y.; Song, Z.-J.; Luo, M.; Li, H.-B.; Zhang, L.; Yuan, D.-Y. Three-dimensional physical simulation and optimization of water injection of a multi-well fractured-vuggy unit. Pet. Sci. 2016, 13, 259–271. [Google Scholar] [CrossRef] [Green Version]
  17. Li, Y.-B.; Pu, W.-F.; Wei, B.; Chen, Y.-F.; Bai, B.-J. The feasibility of CO2 and N2 injection for the Tahe fracture-cavity carbonate extra-heavy oil reservoir: An experimental study. Fuel 2018, 226, 598–606. [Google Scholar] [CrossRef]
  18. Lyu, X.; Liu, Z.; Hou, J.; Lyu, T. Mechanism and influencing factors of EOR by N2 injection in fractured-vuggy carbonate reservoirs. J. Nat. Gas Sci. Eng. 2017, 40, 226–235. [Google Scholar] [CrossRef]
  19. Yuan, D.; Hou, J.; Song, Z.; Wang, Y.; Luo, M.; Zheng, Z. Residual oil distribution characteristic of fractured-cavity carbonate reservoir after water flooding and enhanced oil recovery by N2 flooding of fractured-cavity carbonate reservoir. J. Petrol. Sci. Eng. 2015, 129, 15–22. [Google Scholar] [CrossRef]
  20. Yuan, D.; Hou, J.; Wang, Z.; Su, W.; Zhao, D. Research of N2 flooding and N2 foam flooding for EOR in fractured-vuggy carbonate reservoirs of the Tahe oil field. Geol. Explor. 2016, 52, 791–798. [Google Scholar]
  21. Su, W.; Hou, J.; Zhao, T.; Xi, Y.; Cui, C. Experimental investigation on continuous N2 injection to improve light oil recovery in multi-wells fractured-cavity unit. Petroleum 2017, 3, 367–376. [Google Scholar] [CrossRef]
  22. Qu, M.; Hou, J.; Qi, P.; Zhao, F.; Ma, S.; Churchwell, L.; Wang, Q.; Li, H.; Yang, T. Experimental study of fluid behaviors from water and nitrogen floods on a 3-D visual fractured-vuggy model. J. Petrol. Sci. Eng. 2018, 166, 871–879. [Google Scholar] [CrossRef]
  23. Hou, J.R.; Zhang, L.; Li, H.B. Influencing factors on EOR nitrogen flooding in fractured-vuggy carbonate reservoir. Pet. Geol. Recovery Effic. 2015, 22, 64–68. [Google Scholar]
  24. Wang, Y.; Ge, J.; Zhang, G. Foaming Properties of Commercial Lauramide Amide Oxide in High-Salinity Water. J. Surfactants Deterg. 2017, 20, 755–760. [Google Scholar] [CrossRef]
  25. Zhu, D.; Bai, B.; Hou, J. Polymer Gel Systems for Water Management in High-Temperature Petroleum Reservoirs: A Chemical Review. Energy Fuels 2017, 31, 13063–13087. [Google Scholar] [CrossRef]
  26. Telmadarreie, A.; Trivedi, J. Evaluation of foam generated with the hydrocarbon solvent for extra-heavy oil recovery from fractured porous media: Pore-scale visualization. J. Petrol. Sci. Eng. 2017, 157, 1170–1178. [Google Scholar] [CrossRef]
  27. Yang, H.; Shao, S.; Zhu, T.; Chen, C.; Liu, S.; Zhou, B.; Hou, X.; Zhang, Y.; Kang, W. Shear resistance performance of low elastic polymer microspheres used for conformance control treatment. J. Ind. Eng. Chem. 2019, 79, 295–306. [Google Scholar] [CrossRef]
  28. Xu, X.; Saeedi, A.; Liu, K. An experimental study of combined foam/surfactant polymer (SP) flooding for carbone dioxide-enhanced oil recovery (CO2-EOR). J. Petrol. Sci. Eng. 2017, 149, 603–611. [Google Scholar] [CrossRef] [Green Version]
  29. Liang, T.; Hou, J. Fluids flow behaviors of nitrogen and foam-assisted nitrogen floods in 2D visual fault-karst carbonate reservoir physical models. J. Petrol. Sci. Eng. 2021, 200, 108286. [Google Scholar] [CrossRef]
  30. Liang, T.; Hou, J.; Qu, M.; Song, C.; Li, J.; Tan, T.; Lu, X.; Zheng, Y. Flow behaviors of nitrogen and foams in micro-visual fracture-vuggy structures. RSC Adv. 2021, 11, 28169–28177. [Google Scholar] [CrossRef]
  31. Singh, R.; Mohanty, K.K. Foam flow in a layered, heterogeneous porous medium: A visualization study. Fuel 2017, 197, 58–69. [Google Scholar] [CrossRef]
  32. Wang, D.; Hou, Q.; Luo, Y.; Zhu, Y.; Fan, H. Blocking Ability and Flow Characteristics of Nitrogen Foam Stabilized with Clay Particles in Porous Media. J. Dispers. Sci. Technol. 2015, 36, 170–176. [Google Scholar] [CrossRef]
  33. Zhang, Y.; Chang, Z.; Luo, W.; Gu, S.; Li, W.; An, J. Effect of starch particles on foam stability and dilational viscoelasticity of aqueous-foam. Chin. J. Chem. Eng. 2015, 23, 276–280. [Google Scholar] [CrossRef]
  34. Wu, Z.; Liu, H.; Pang, Z.; Wu, Y.; Wang, X.; Liu, D.; Gao, M. A visual investigation of enhanced heavy oil recovery by foam flooding after hot water injection. J. Petrol. Sci. Eng. 2016, 147, 361–370. [Google Scholar] [CrossRef]
  35. Simjoo, M.; Zitha, P.L.J. Effects of Oil on Foam Generation and Propagation in Porous Media. In Proceedings of the SPE Enhanced Oil Recovery Conference. Society of Petroleum Engineers, Kuala Lumpur, Malaysia, 2–4 July 2013; p. 16. [Google Scholar]
  36. Bai, Y.; Li, J.; Zhou, J. Sensitivity analysis of similar parameters in physical simulation of two phase flow in water drive. Sci. China Ser. E Eng. Mater. Sci. 2005, 35, 761–772. [Google Scholar]
  37. Yang, J.; Hou, J.; Qu, M.; Liang, T.; Wen, Y. Experimental study the flow behaviors and mechanisms of nitrogen and foam assisted nitrogen gas flooding in 2-D visualized fractured-vuggy model. J. Pet. Sci. Eng. 2020, 194, 107501. [Google Scholar] [CrossRef]
Figure 1. Fabrication of three-dimensional visualized fracture–vuggy physical model.
Applsci 11 11082 g001
Figure 2. Three-dimensional visualized fracture–vuggy physical model: (a) initial state, (b) cylinder base tank, (c) bottom water entries, (d) saturated simulated oil state.
Applsci 11 11082 g002
Figure 3. Foam flow characteristics around the injection well TK467: (a) Early stage of foam migration, (b) Accumulation of foam, (c) Formation of N2 cap, (d) Detachment of oil film.
Applsci 11 11082 g003
Figure 4. Graph depicting the position of the OWI around the well TK467 with time.
Applsci 11 11082 g004
Figure 5. Foam flow characteristics around production well TK411: (a) Migration of Foam, (b) Accumulation of N2 foam, (c) Further accumulation of N2 foam, (d) Migration of oil belt.
Applsci 11 11082 g005
Figure 6. Graph depicting the position of the OWI around the well TK411 with time.
Applsci 11 11082 g006
Figure 7. Synergistic effects of foam-assisted N2 and bottom water on interface evolution: (a) Foam invasion, (b,c) Foam migration, (d) Formation of N2 cap.
Applsci 11 11082 g007
Figure 8. Mobilization of residual attic oil in the fracture–vuggy unit controlled by T401: (a) residual attic oil after water-driven, (b) Foam accumulation, (c,d) Decrease of gas-oil interface.
Applsci 11 11082 g008
Figure 9. Graph depicting the position of the GOI around well T401 with time.
Applsci 11 11082 g009
Figure 10. Mobilizing compound residual oil after water flooding in the fracture–vuggy unit controlled by well TK426: (a) Formation of various residual oil, (b) Mobilization of oil film and bypassed oil, (c) Formation of residual oil after foam-assisted nitrogen gas flooding.
Applsci 11 11082 g010
Figure 11. Residual oil types in three-dimensional visualized fracture–vuggy physical model: (a,b): after nitrogen gas flooding and (c,d): after foam-assisted N2 flooding.
Applsci 11 11082 g011
Figure 12. Dynamic oil recovery comparison.
Applsci 11 11082 g012
Table 1. Inorganic salt compositions of simulated water from Tahe Oilfield.
Salinity (mg/L)Inorganic Salt Concentration (mg/L)
Na2SO4NaHCO3NaClCaCl2MgCl2
253,407417576207,75941,1063549
Table 2. Similarity criteria.
Similarity TypesSimilarity CriteriaPhysical InterpretationSimilarity Criterion Index
Geometric similarity π 1 = d l Vug diameter divided by the well-controlled diameter0.95–1.05
π 2 = w l Fracture width divided by the well-controlled diameter0.97–1.03
Motion similarity F Q = Q ur 2 Recovery velocity divided by the injection velocity0.98–1.02
Dynamic similarity R e = ρ ul μ Inertial force divided by the viscous force0.99–1.01
Table 3. Parameter design of the three-dimensional visualized fracture–vuggy physical model based on similarity criteria.
FactorsActual ReservoirThree-Dimensional Visualized Model
Vug diameter (d)/cm250–30001.5–15
Oil viscosity (μ)/(mPa·s)18.3–29.719–65
Oil density (ρo)/(g·cm−3)0.910.82
Gravity acceleration (g)/(m·s−2)9.89.8
Injection velocity (Q)/(m3·d−1)8–550.002–0.025
Well diameter (r)/mm1203
Fracture width (w)/mm0.3–71.5–5.0
Table 4. Well parameters of three-dimensional visualized fracture–vuggy model.
Well NameWell Height (cm)Well TypeCoordination Number
TK41110.8Vug well, production well3
TK46718.0Fracture well, convert well1
S4814.8Vug well, production well4
T40112.2Vug well, production well2
TK4269.2Fracture well, production well4
Tips: The coordination number refers to the fractures number connecting to the reservoir unit where the borehole locates. The well TK467 is a convert well, while the other four wells are production wells all the time.
Table 5. Summary of EOR at different stages with different technologies.
StageEOR during Bottom Water Flooding (%)EOR during Water Flooding (%)EOR during Foam-Assisted N2 Flooding (%)EOR during Nitrogen Gas Flooding (%)
Technologies
Foam-assisted N2 technology34.6020.6039.70/
Nitrogen gas technology35.0818.99/27.34
Publisher’s Note: MDPI stays neutral with regard to jurisdictional claims in published maps and institutional affiliations.

