Article

Algorithmic Method for the Design of Sequential Circuits with the Use of Logic Elements

by
Adam Szcześniak
1,* and
Zbigniew Szcześniak
2
1
Faculty of Mechatronics and Mechanical Engineering, Kielce University of Technology, 25-314 Kielce, Poland
2
Faculty of Electrical Engineering, Automation and Computer Science, Kielce University of Technology, 25-314 Kielce, Poland
*
Author to whom correspondence should be addressed.
Appl. Sci. 2021, 11(23), 11100; https://doi.org/10.3390/app112311100
Submission received: 16 September 2021 / Revised: 12 November 2021 / Accepted: 18 November 2021 / Published: 23 November 2021

Abstract

:
This article presents issues related to the design of sequential control systems. The algorithmic design method of sequential control systems is discussed, which allows the design of a diagram of any sequential system. The algorithmic method uses the description in the form of a connection formula. The connection formula defines the order of actuations of driver elements, in this case actuators. The algorithmic method is used, among others, for systems with actuators cooperating with distributors controlled electrically on both sides. The process of creating a system graph has been characterized. The operation of the system has been shown graphically. On the basis of the created graph describing the functions of signal processing, a method for rapid programming of sequential electro-pneumatic systems with the use of logic elements has been provided. A separate dedicated timing unit has been used to perform memory functions. Its operation is based on successive states, in such a way that the next state deletes the previous one. Graph-based systems have been validated through simulation using Festo’s FluidSim computer-aided design software.

1. Introduction

The quality and effectiveness of automation systems to a large extent depends on the technical characteristics of the systems applied in them. Therefore, special attention is paid to the design of electronics and automation systems, which includes several stages, starting with the development of a technical task and ending with the serial manufacture of entire devices.
Many tasks are involved in designing, and the most significant among these is the analysis and synthesis of the device’s schematic diagram. Its correct implementation considerably reduces the time to execute, prepare and verify the diagram, and also decreases the number of corrections to the technical documentation after testing the prototype, and the experimental and trial series. All of the above not only expedite the developed device production but also reduce the cost of its manufacture. That is why it seems expedient to present the issues related to the design of control systems.
A digital circuit in which the current state of the outputs depends not only on the current state of the inputs but also on the sequence of previous input states, is called a sequential circuit. Generally, when the system has n inputs ( x 1 , x 2   x n ) and m outputs ( y 1 , y 2   y m ) then
Y t = f ( x t , x t τ 1 ,   x t τ 2 , . )
where:
  Y t = ( y 1 , y 2   y m ) t —the current state of the system outputs at time “ t ”,
X t = ( x 1 , x 2   x n ) t —the current state of the system inputs and
x t τ i —previous input states of the system (appearing in moments t τ i   ),
wherein i = 1, 2, …, 0 < τ 1   < τ 2 < … and
f is a Boolean function.
A digital circuit in which the current state of the outputs Y t depends only on the current state of the inputs X t is the name of the combination circuit.
Y t = f ( x t )
In sequential systems, the relationship between the states of the outputs and the states of the inputs is not clear. The same states of inputs may in these systems correspond to different states of outputs.
The status of the outputs is decided by the states of the inputs, which precede the current state of the inputs, i.e., the history of inputs. The memory of the circuit is responsible for including this history in sequential circuits.
The memory of the sequential circuit is represented by a k-element sequence of binary signals ( Q i ) defining the states of its individual elements. States ( Q i ) of memory elements make up the so-called internal state of the sequential circuit.
A = ( Q 1 , Q 2   Q n )
In the automation of technological processes, a large variety of control systems and the use of new components lead to the fact that the issues of synthesis are quite well developed but only for specific systems [1,2,3,4,5].
By formulating a description of the sequential system using the concept of the internal state, it can be concluded that the current state of system outputs depends both on the current state of its inputs and the current internal state, while the current internal state is the function of the previous state of inputs and previous internal state [6,7].
Formally, the sequential system can be described by the following functions
A t + τ = δ ( A t ,   X t )
Y t = λ ( A t ,   X t )
where:
Y t = ( y 1 , y 2   y m ) t —current state of outputs in time “t”,
X t = ( x 1 , x 2   x n ) t —current state of inputs of the system,
A t = ( Q 1 , Q 2   Q n ) t —current input state of the system and
A t + τ is the next internal state.
The quantity τ symbolizes the delay introduced by the system implementing the functions δ (in fact, with each signal Q of vector A may be related to a different delay time, but for general considerations it is not important). The relationship clearly defines the emergence of the “new” internal state of A on the basis of the “old” (current) state of A and the current input signals of X. The functions δ and λ in expressions are the transition function and the function of the outputs of the system, respectively. From the current internal state of A and the state of the X inputs, the transition function δ determines the new internal state, and the function of outputs λ determines the current state of the Y outputs. For a new state A and some X, the transition function determines the next state of A, while the function of outputs determines the appropriate state of Y, etc. The mathematical model of a sequential system is often called a machine and the above relationships describe the so-called Mealy machine. Since the internal state of the system depends on the state of the inputs, the state of the outputs can be directly dependent on the internal state (the dependence on the state of the inputs will be indirect). Such a model of the sequential system is called the Moore machine, and it is described by the functions [6,7]
A t + τ = δ ( A t ,   X t )
Y t = λ ( A t )
The two basic structures of the sequential system are shown in Figure 1, resulting from the above functions.
In both cases, the blocks performing the λ functions are combinational circuits, while the blocks performing the δ functions are sequential. Each sequential circuit can be performed either as a Mealy or Moore machine. In general, it is difficult to predict in advance what structure is simpler and, therefore, often two of them are to be resolved [8].
In order to ensure correct operation of the asynchronous system, it is assumed that two conditions are met:
(a)
each time the state of the inputs changes, only one input signal changes at a time;
(b)
another input signal may change only after the time τ necessary for the internal state of the system to settle.
In the synthesis of sequential circuits, a complete description of the circuit is needed, represented as a transition and output graph or transition and output tables. Transition and output tables are a full equivalent of graphs, perhaps less pictorial, but much more convenient for further transformations in the subsequent stages of the synthesis of sequential systems.
The transition table describes the transition function δ , so each pair (A,X) is assigned a new state A.
On the left side of the board all internal states of the machine are written, and at the top, all states of inputs. In the array fields with the coordinates ( A i   , X k ) for each current internal state A i and for each current state of the X k inputs, the next internal state is given A j = δ   ( A i ,   X k ) .
The current state of the outputs in the Mealy machine is usually entered in the fields of the same table because the output function in this case depends on the same arguments as the transition function. The rules for creating transition and output tables, ways to minimize internal states, the problem of coding transition and output tables and the principles of implementing sequential circuits with the use of digital elements of a small, medium and large scale of integration are presented in the literature [6,7].
In sequential synchronous systems, the rhythm of changes in internal states is determined by the clock signal. The state of the inputs affects the internal state only at times determined by the appropriate edges of the clock signal [9]. However, there is no clock signal in asynchronous systems. The input signals have a direct impact on the internal state of the system all the time. Thus, each change in the input causes an immediate (taking into account the propagation time of signals through the system) reaction of the system [9]. The lack of a clock signal makes the synthesis of asynchronous systems (in general) more difficult than the synthesis of synchronous systems.
In these systems, devices that process the transmitted digital information serially (bit by bit) cannot be implemented because without an additional signal, the asynchronous system is unable to distinguish successive “ones” or “zeros” (given side by side). Asynchronous systems are mainly used in automation switching systems.
The above difficulties are probably the cause of the dominance of asynchronous systems by synchronous systems, which can be confirmed by the fact of producing complex digital circuits with a high degree of integration (e.g., microprocessors), precisely in the synchronous version.
The synthesis of sequential circuits using the conventional state transition and output table method is simple if the number of inputs and the number of internal states are not large. However, for systems with more than three inputs and eight internal states, the difficulty of using transition and output tables increases significantly; the synthesis algorithms become more complicated (for example, the excitation functions depend on seven arguments) and the chance of obtaining an optimal solution decreases [7].
In this situation, it seems advisable to search for methods reducing the difficulty of synthesis and eliminating the above-mentioned defects. These methods can be, for example [6]:
(a)
decomposition of the system into smaller components that are easier to design,
(b)
the use of a computer to assist the designer in solving large numbers of tasks variables.
(c)
different from the previously described principles of system construction, and, therefore, also requiring different synthesis methods.
Decomposition is an important stage of synthesis and is often used, but, firstly, it is not always possible (not all systems can be decomposed) and, secondly, the methods of decomposition are not satisfactorily formalized and, therefore, decomposition is carried out intuitively, and this requires experience and does not always lead to the optimal solution.
The use of synthesis methods (using other forms of layout description, for example, a computer-assisted flow chart with specialized software) can reduce the problems resulting from a large number of variables but will not prevent functional complexities occurring in large systems without decomposition. The review of the above possibilities shows that the only constructive way to reduce the difficulty of designing complex digital circuits is to search for qualitatively new methods of synthesis.
In order to meet these expectations, the article presents an algorithmic method used for the synthesis of sequential, asynchronous electro-pneumatic systems with the use of logic elements. The algorithmic method of designing asynchronous control systems is discussed, which allows for the synthesis of virtually any electro-pneumatic systems used in the automation of technological processes. The algorithmic method of designing sequential control systems presents the operation of the system in a graphical manner. The drawn graph describes the signal processing functions that enable fast programming of sequential asynchronous systems.
Executive elements are actuators cooperating with electrically operated pneumatic valves [10,11]. In the technological process, actuators create a kinematic structure [12,13,14].
The position of the actuator is measured in two points. These solenoid valves are used wherever it is necessary to cooperate between pneumatic systems and electronic devices. These are bistable solenoid valves that fulfill the function of a flip-flop [11].
It should be emphasized that the algorithmic method of synthesizing asynchronous actuator control system valve-actuators can also be used if the actuator is a proportional solenoid valve-actuator. In such a case, to measure the position of the actuator in the technological process, precise, optoelectronic position transducers [15] should be used as a feedback for the proportional valve-actuator control system.

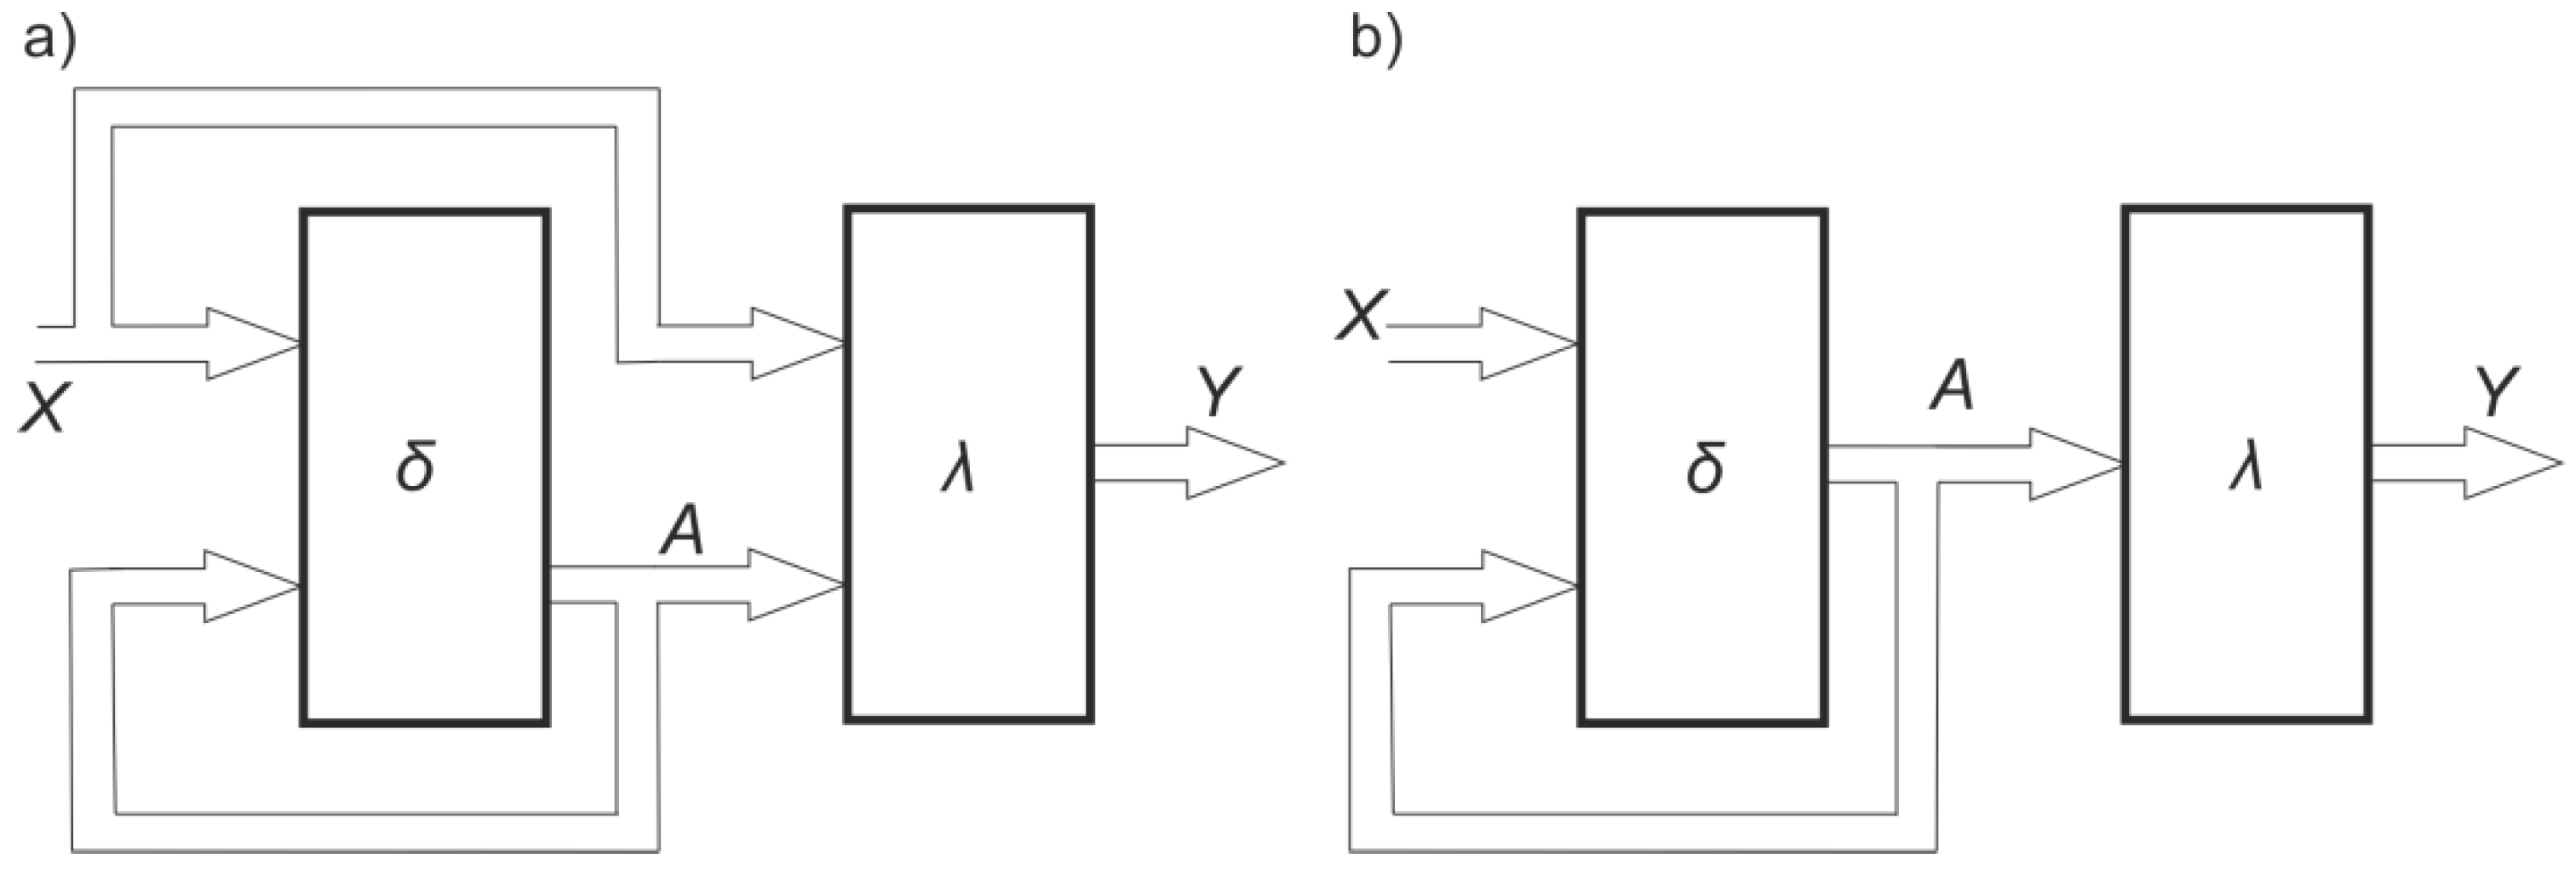
2. Algorithmic Method of Sequential Circuit Design

The algorithmic method is used, among others, for systems with actuators cooperating with distributors controlled pneumatically, hydraulically or electrically on both sides. A separate dedicated timing unit has been used to perform memory functions. Its operation is based on successive states, in such a way that the next state deletes the previous one.
The basis for designing the system is a description of the device’s operation and specifying the conditions necessary for the proper operation [11]. The simplest way to describe the system operation is a control narrative, which is transformed into descriptions in the form of an operating cycle diagram or connection formula. The connection formula defines the order of actuations of driver elements, in this case actuators. Indeed, the algorithmic method uses the description in the form of a connection formula. When adopting this method of description, several assumptions should be made, namely:
  • the driver element (actuator) used in the project is marked with a capital letter of the alphabet starting from A–Z;
  • the sign “+” after the symbol of a given driver element (actuator) means activation (full extension of the piston);
  • the sign “−” next to the symbol of a given driver element (actuator) means deactivation of the driver element (extension of the piston);
  • the sign “±” next to the symbol of a given element means a short-term actuation of the element;
  • each cylinder is equipped with sensors detecting the position of the cylinder piston;
  • the position of the driver element (actuator) in the ON state is indicated by the symbol of the given element with the index 0—from logical state 0 (e.g., for element A symbol a0);
  • the position of the driver element (actuator) in the OFF state is indicated by the symbol of the given element with the index 1—from logical state 1 (e.g., for element B symbol b1).
Based on the description of the operation of individual driver elements (actuators) and the adopted markings, a formula is created that shows the operation of the automaton, i.e., the order of operation of the actuators. If in the formula there are two symbols of the actuators one above the other, it means that they operate at the same time. The connection formula on the example of which the system design will be discussed is as follows
S ± A + B + B C + B + B A C
On the basis of the connection formula, the operating cycle diagram of the process unit is presented in Figure 2.
The selected sequence is based on three actuators and is as follows:
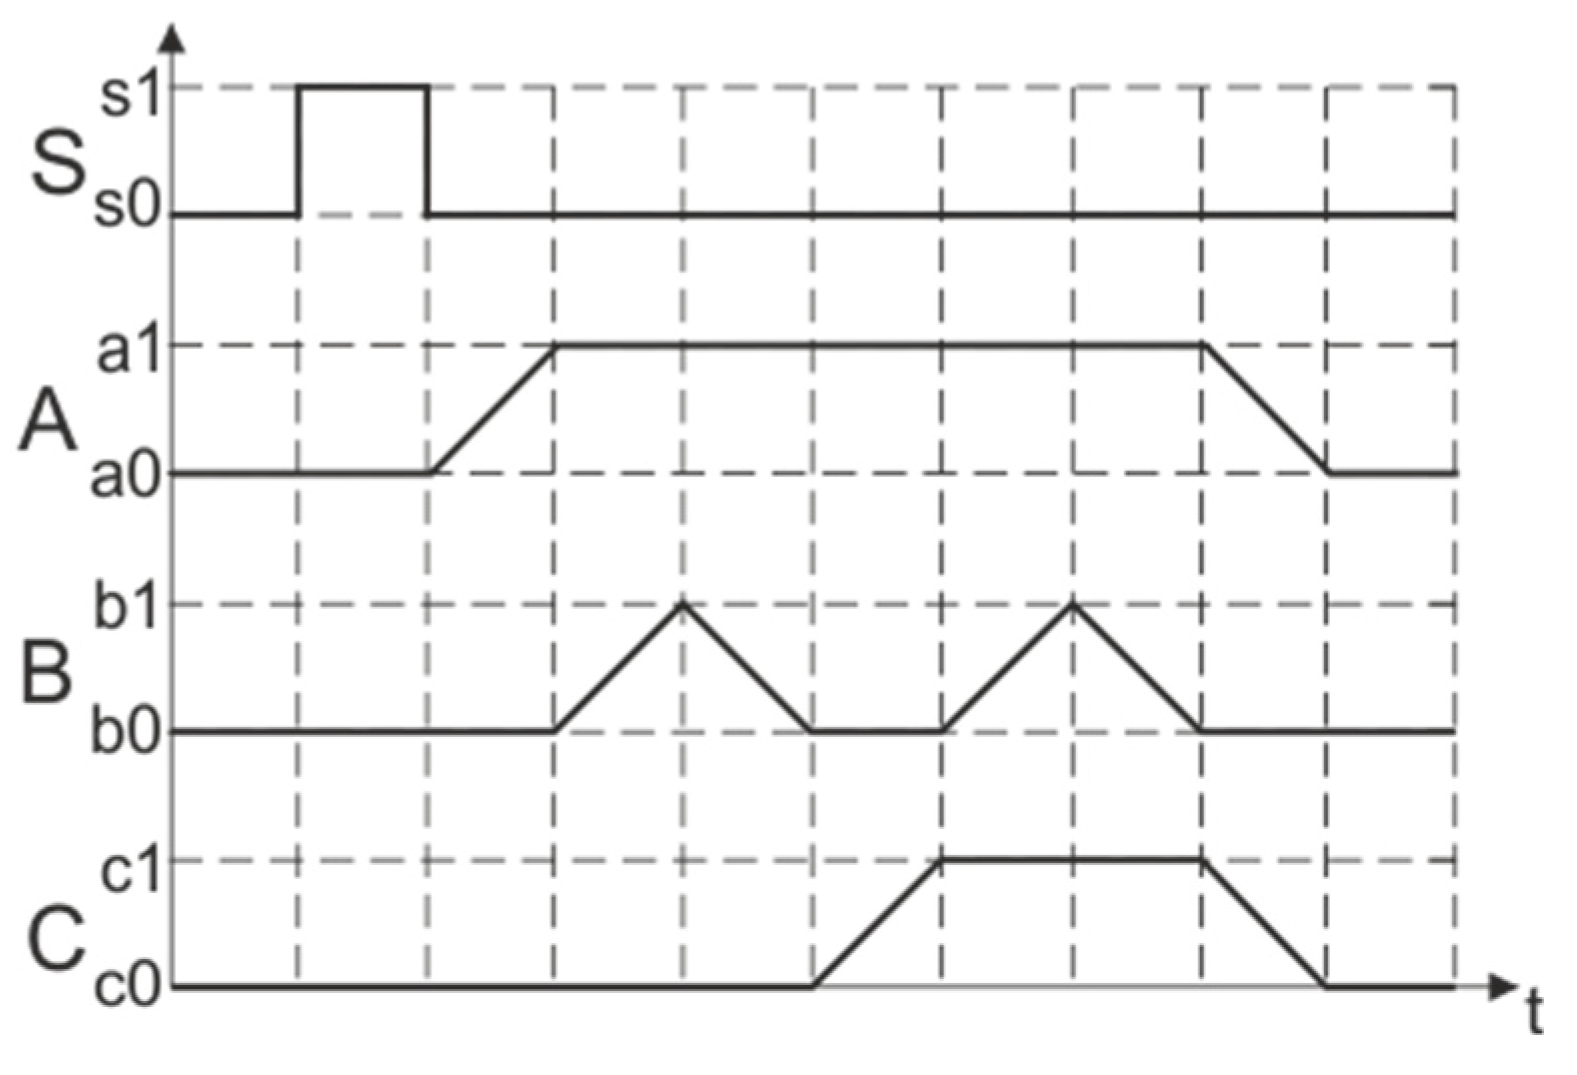
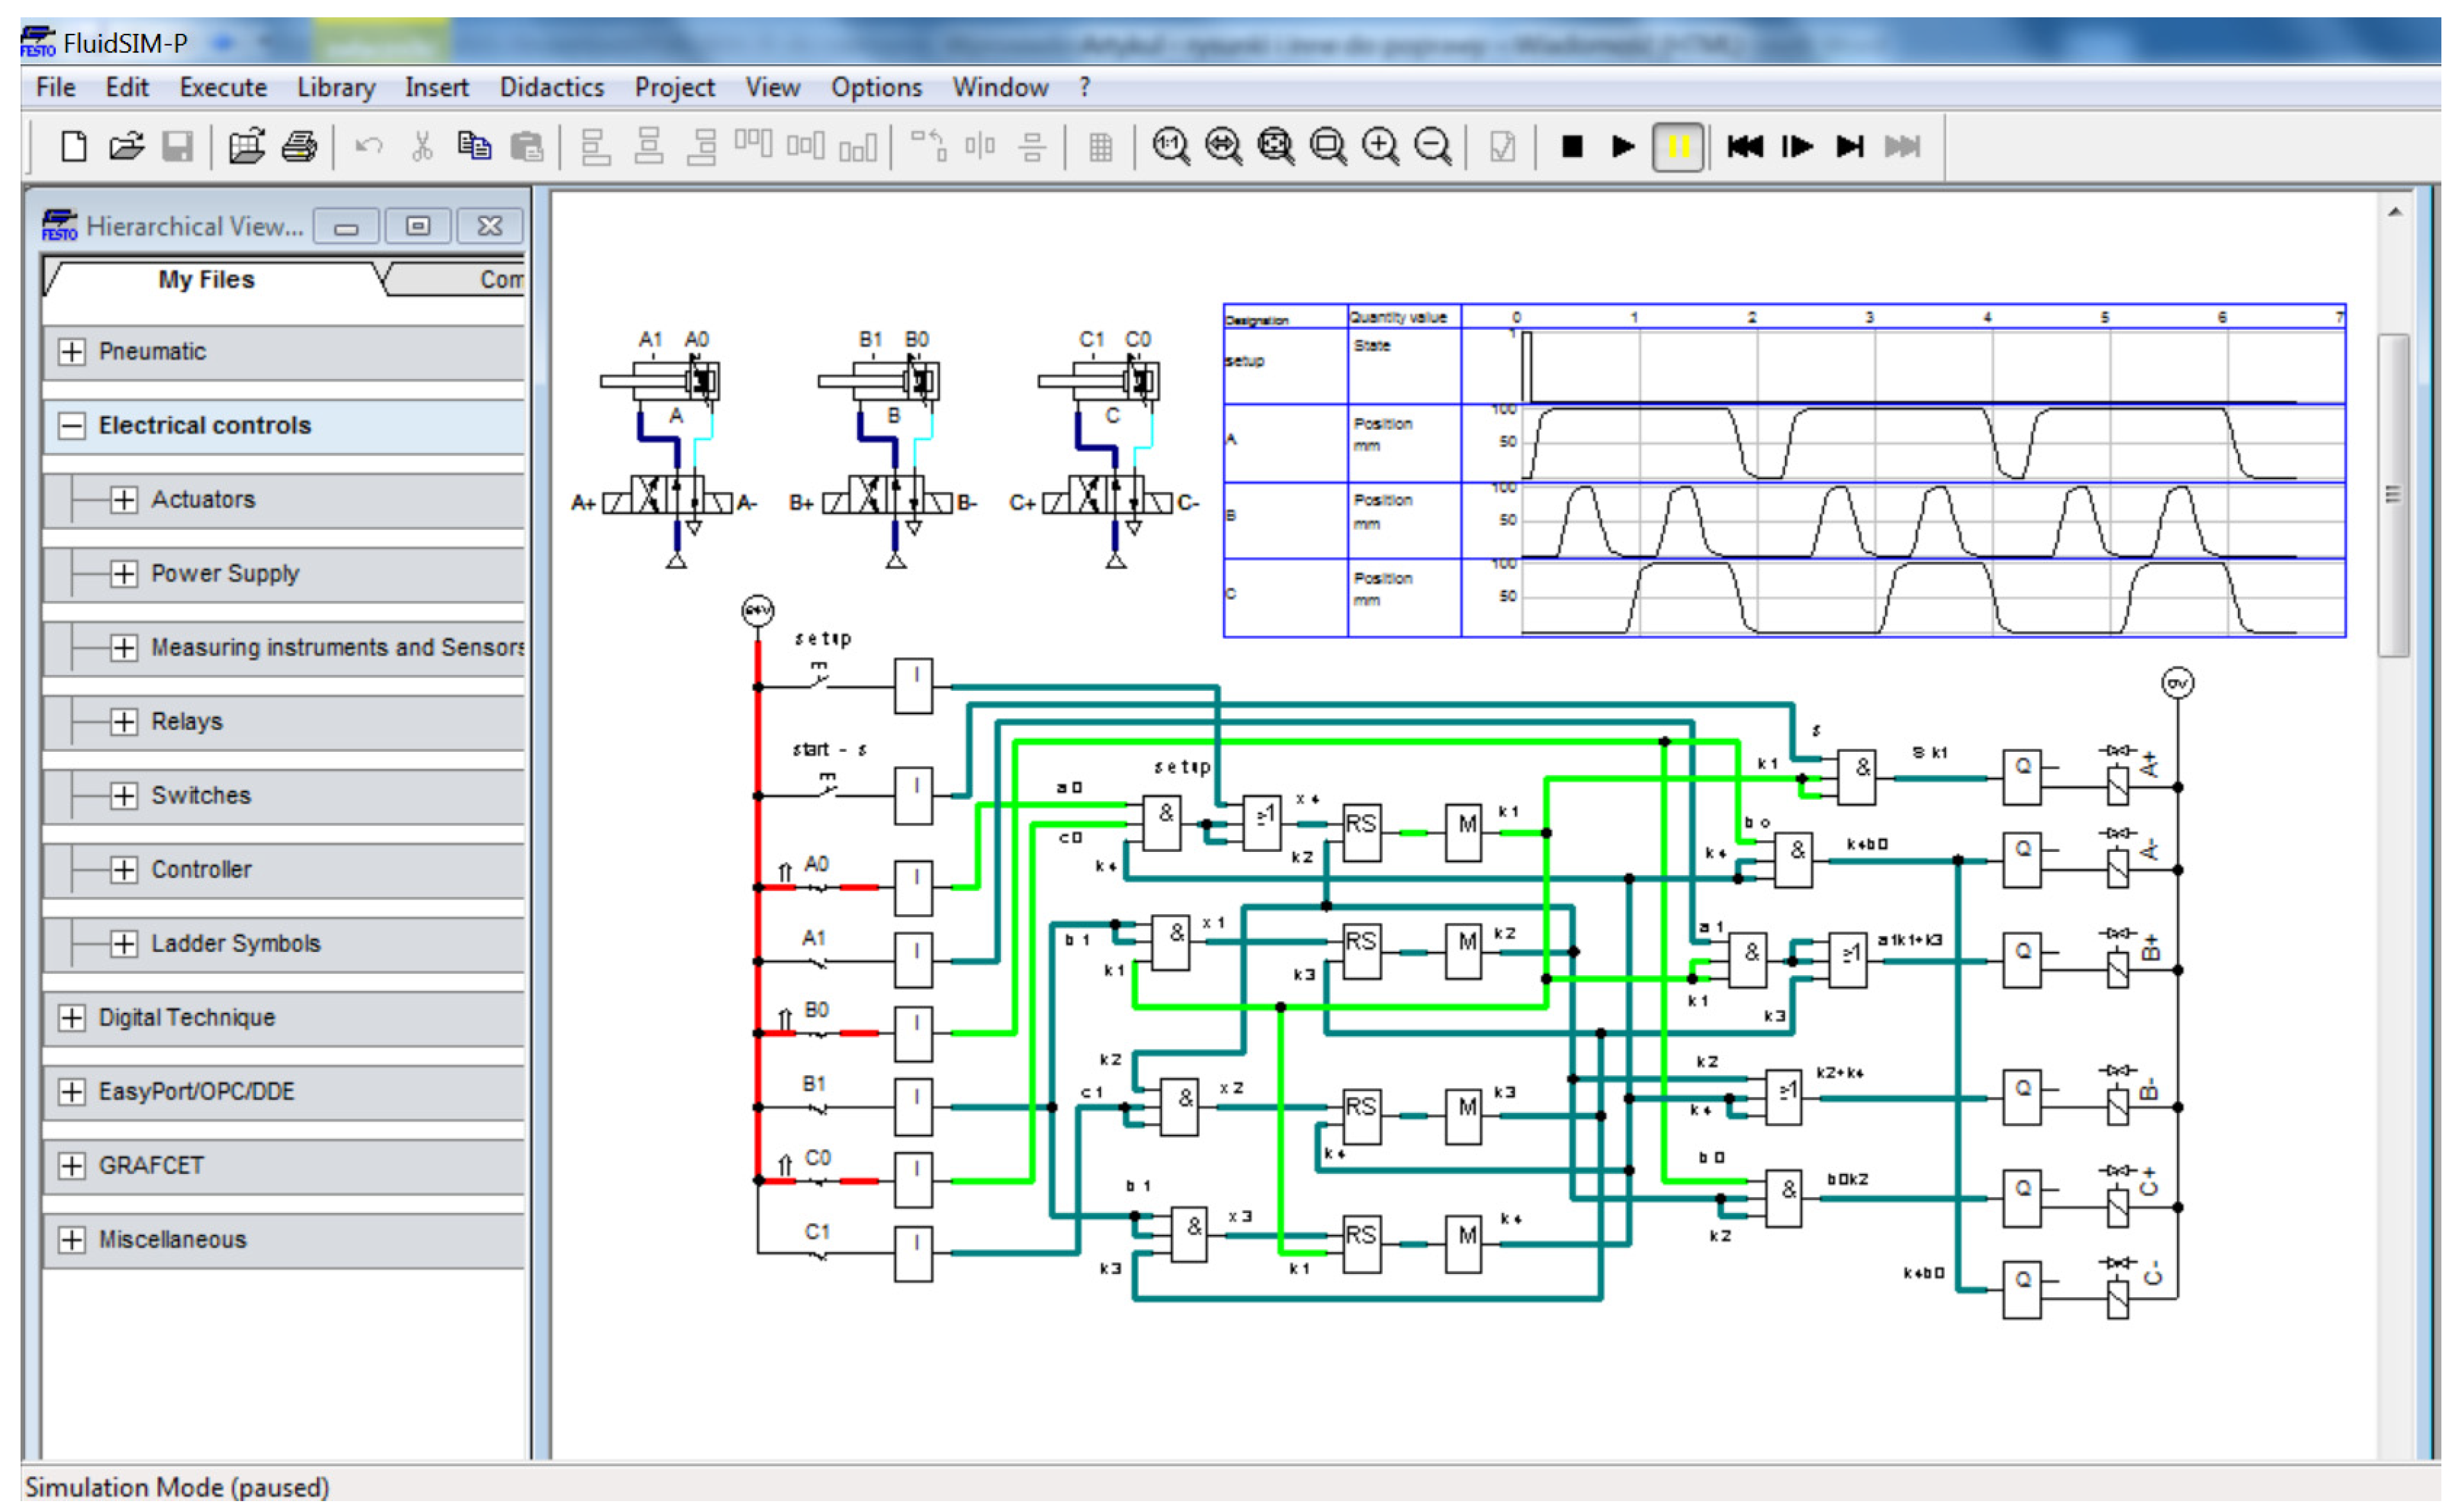
  • in the initial state all actuators A, B and C are retracted,
  • after pressing the S button, the actuator A begins to extend,
  • after the actuator A is extended, the actuator B begins to extend,
  • after the actuator B is extended, it is retracted again,
  • after the actuator B is retracted, the actuator C begins to extend,
  • after the actuator C is extended, the actuator B begins to extend,
  • after the actuator B is extended, it is retracted again,
  • after the actuator B is retracted, the actuators A and C start to retract simultaneously.
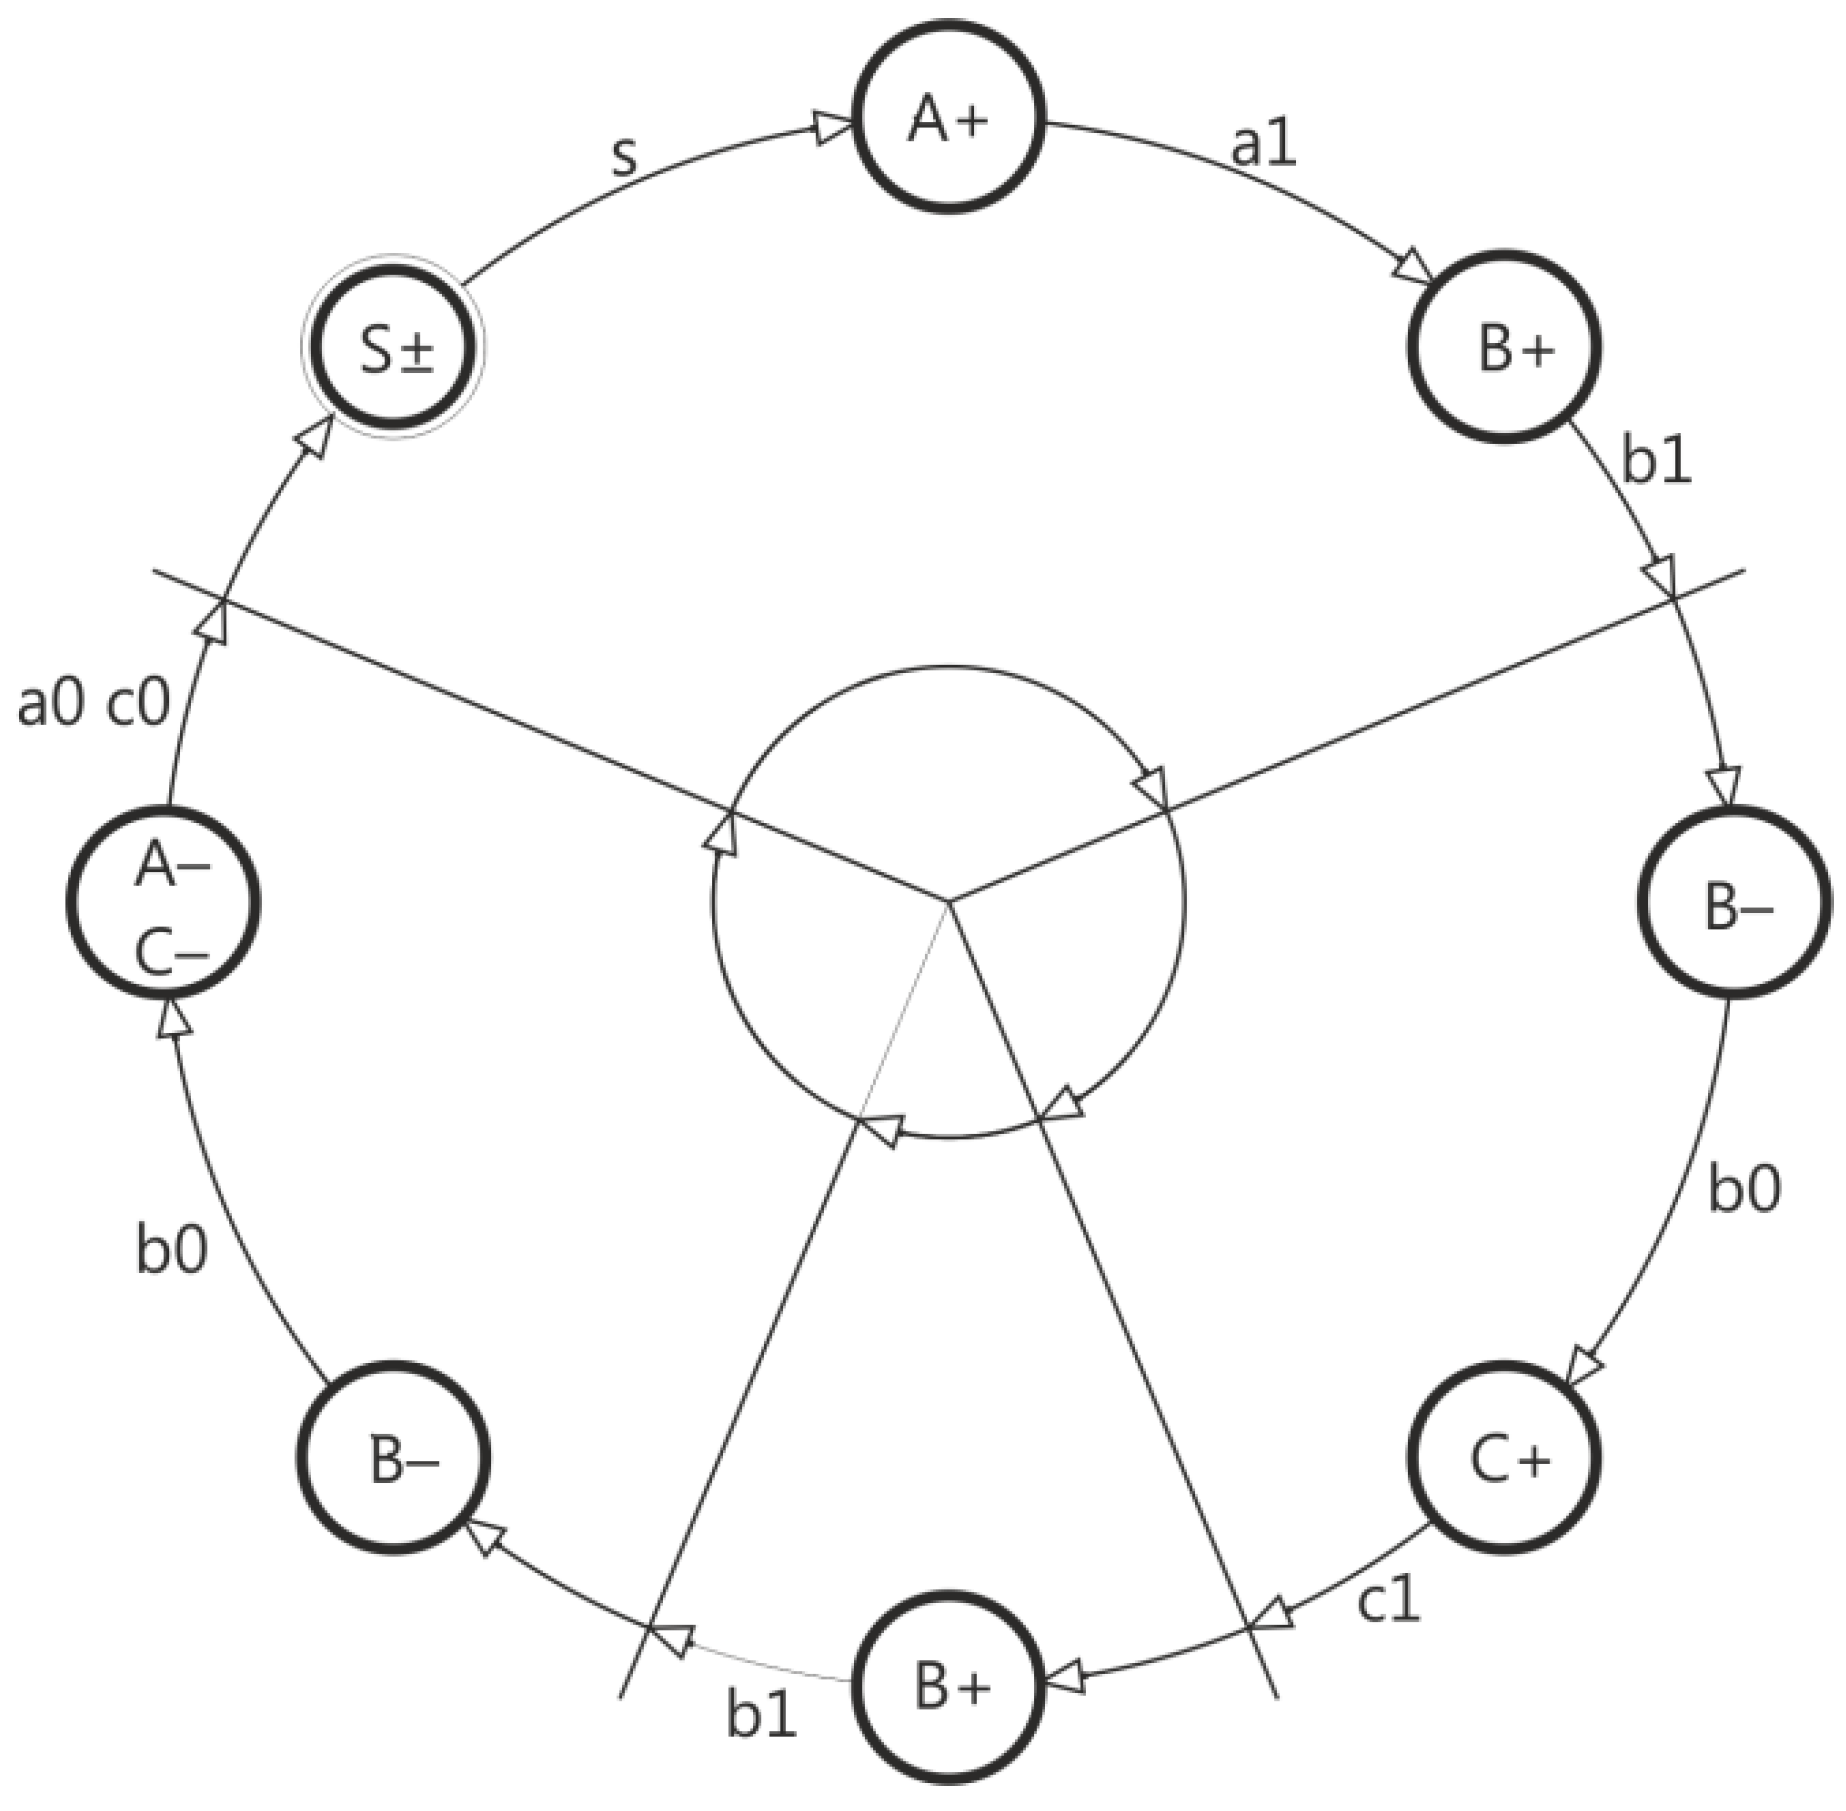
At this stage, the sequence is completed and the system is waiting for the S button to be pressed again. Based on the connection formula, a diagram of the system is created, which is shown in Figure 3. Such a graph is created by placing on its circle as many circles showing the state of the system as there are elements in the connection formula. Each state circle will be the vertex of the system graph. The system graph is described in such a way that the vertices of the graph are assigned symbols denoting a change in the state of elements in the order according to the connection formula, while the arches of the graph circle directed to the vertices of the graph are assigned the signals that cause a change in the state of the element.
The arches coming out of the vertices are assigned signals informing that the desired state has been reached. These signals are, therefore, the signals causing a change in the state of the element to which they enter. For example, in the case of the presented graph, the signal coming from the B− vertex is a signal b0 informing the retraction of the B actuator and a signal that goes to the C+ vertex, which will cause the C actuator to extend. State S± (system start) is drawn in a double circle as a stable state, and other states, as transient states, are drawn in a single circle.
The graph obtained in this way is divided into groups. Each group comprises a segment of the graph circle selected so that the same element occurs only once. The segments are made of as many elements as possible in a clockwise direction. The section is created starting from the stable state of the system. The division of groups is created radially, by running a line from the centre of the circle outside, so that each group is located between two lines. The number of groups determines the selection of a memory block—the number of inputs/outputs must be equal to the number of groups. Each created group is marked with k1, k2,..., kn starting from the group with the S± signal as shown in Figure 4. Each drawn line dividing the groups is marked with an index letter (e.g., x1, x2,..., xn), starting from the line closing the first group. Group division signals (x1, x2,..., xn) are generated by the last output signal in the group, e.g., x2 is generated by the product of the k2 and c1 signal, which is the last signal in the k2 group. The resulting signal causes the system to move to the next state of memory, i.e., x2 causes the transition to the state of k3, while x3 to the state of k4, etc. The first element in a given group is always forced by the state it is in, e.g., B− being the first state in groups k2 and k4 is forced by each of them. The graph after division into states has been presented in Figure 4.
General rules for creating the graph:
1.
The graph is drawn based on the operating conditions of the system—the connection formula.
2.
The graph is divided into groups in such a way that in each group the state of individual elements occurs only once.
3.
Each separate group is numbered from k1 to kn, starting with the group with the start signal “S”.
4.
The division lines of groups have been marked from x1 to xn, where x1 corresponds to the end of the group k1, while xn to the end of group kn.
5.
Arrows are drawn for each dividing line: from the last circle towards the dividing line.
6.
The arch between the dividing line and the next state is designated as the state in which the arch is located.
7.
The arch between the state and the dividing line directed to the dividing line is designated as signals coming out of that state.
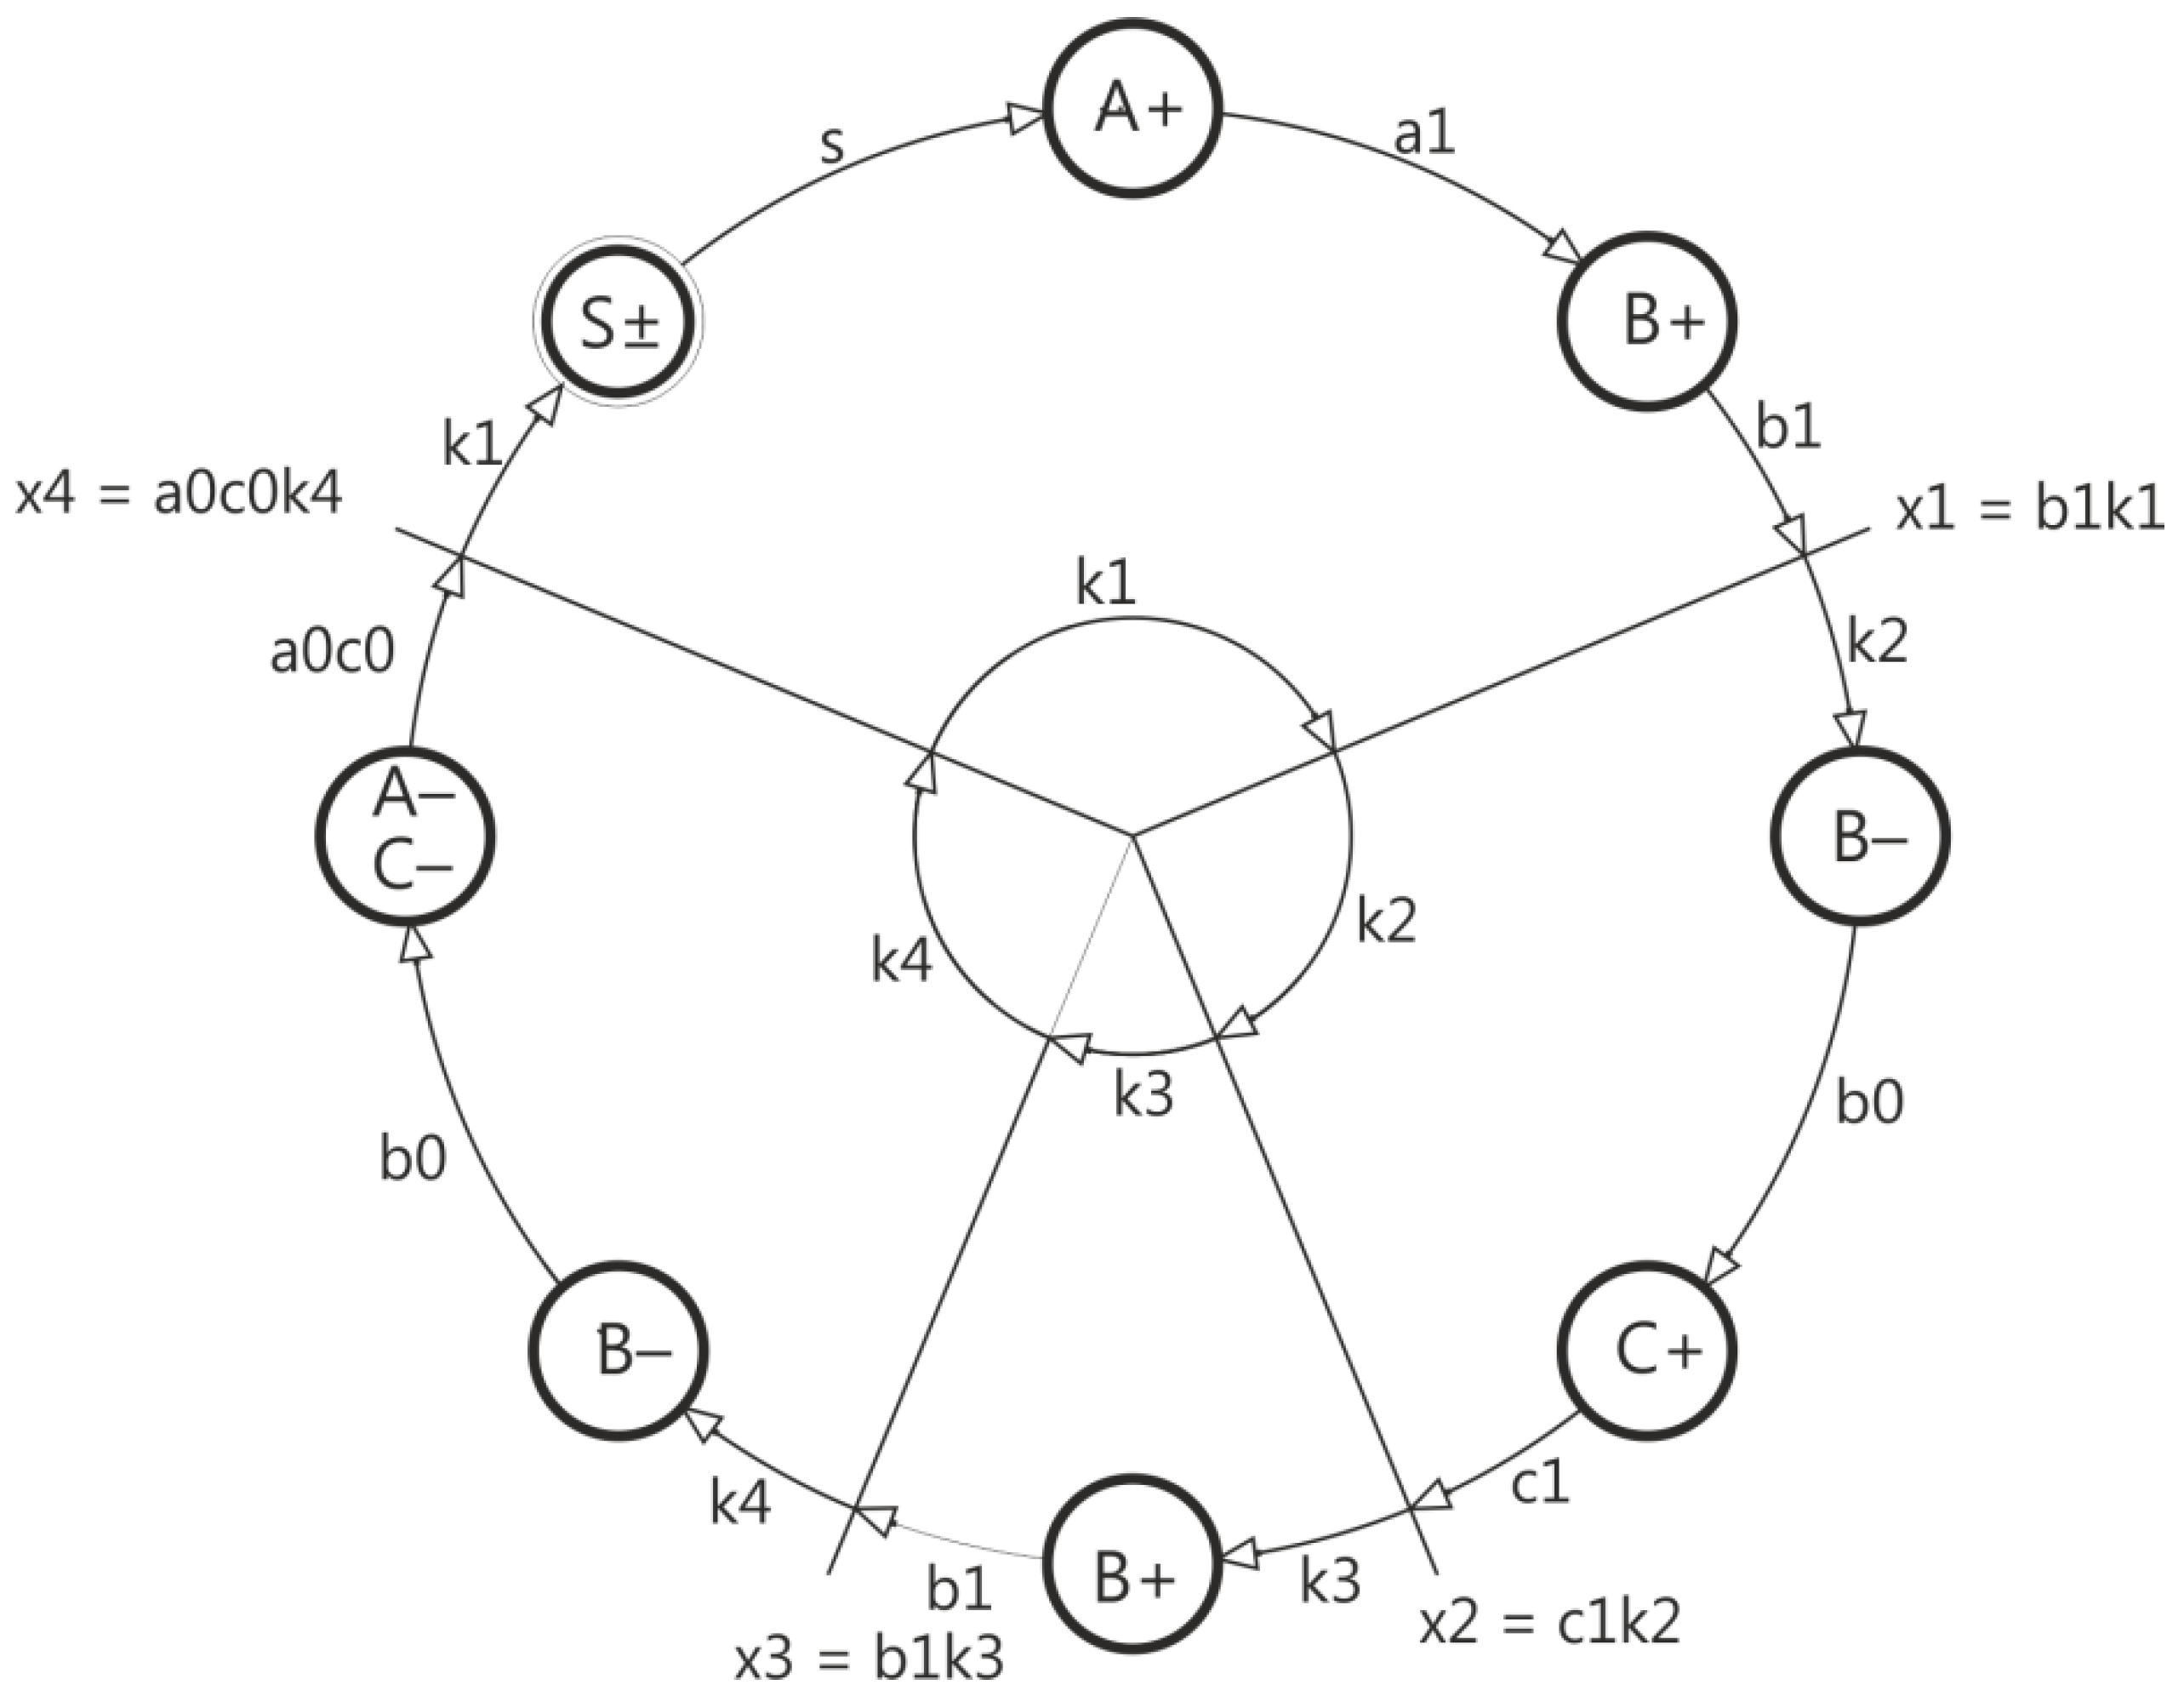
8.
Each dividing line is described by an equation in which we multiply the signals from the arc directed to the dividing line with the value of the state before the dividing line.

3. Designing of Sequential Circuits Using Logic Elements

Based on the graph of the system shown in Figure 4, we find that:
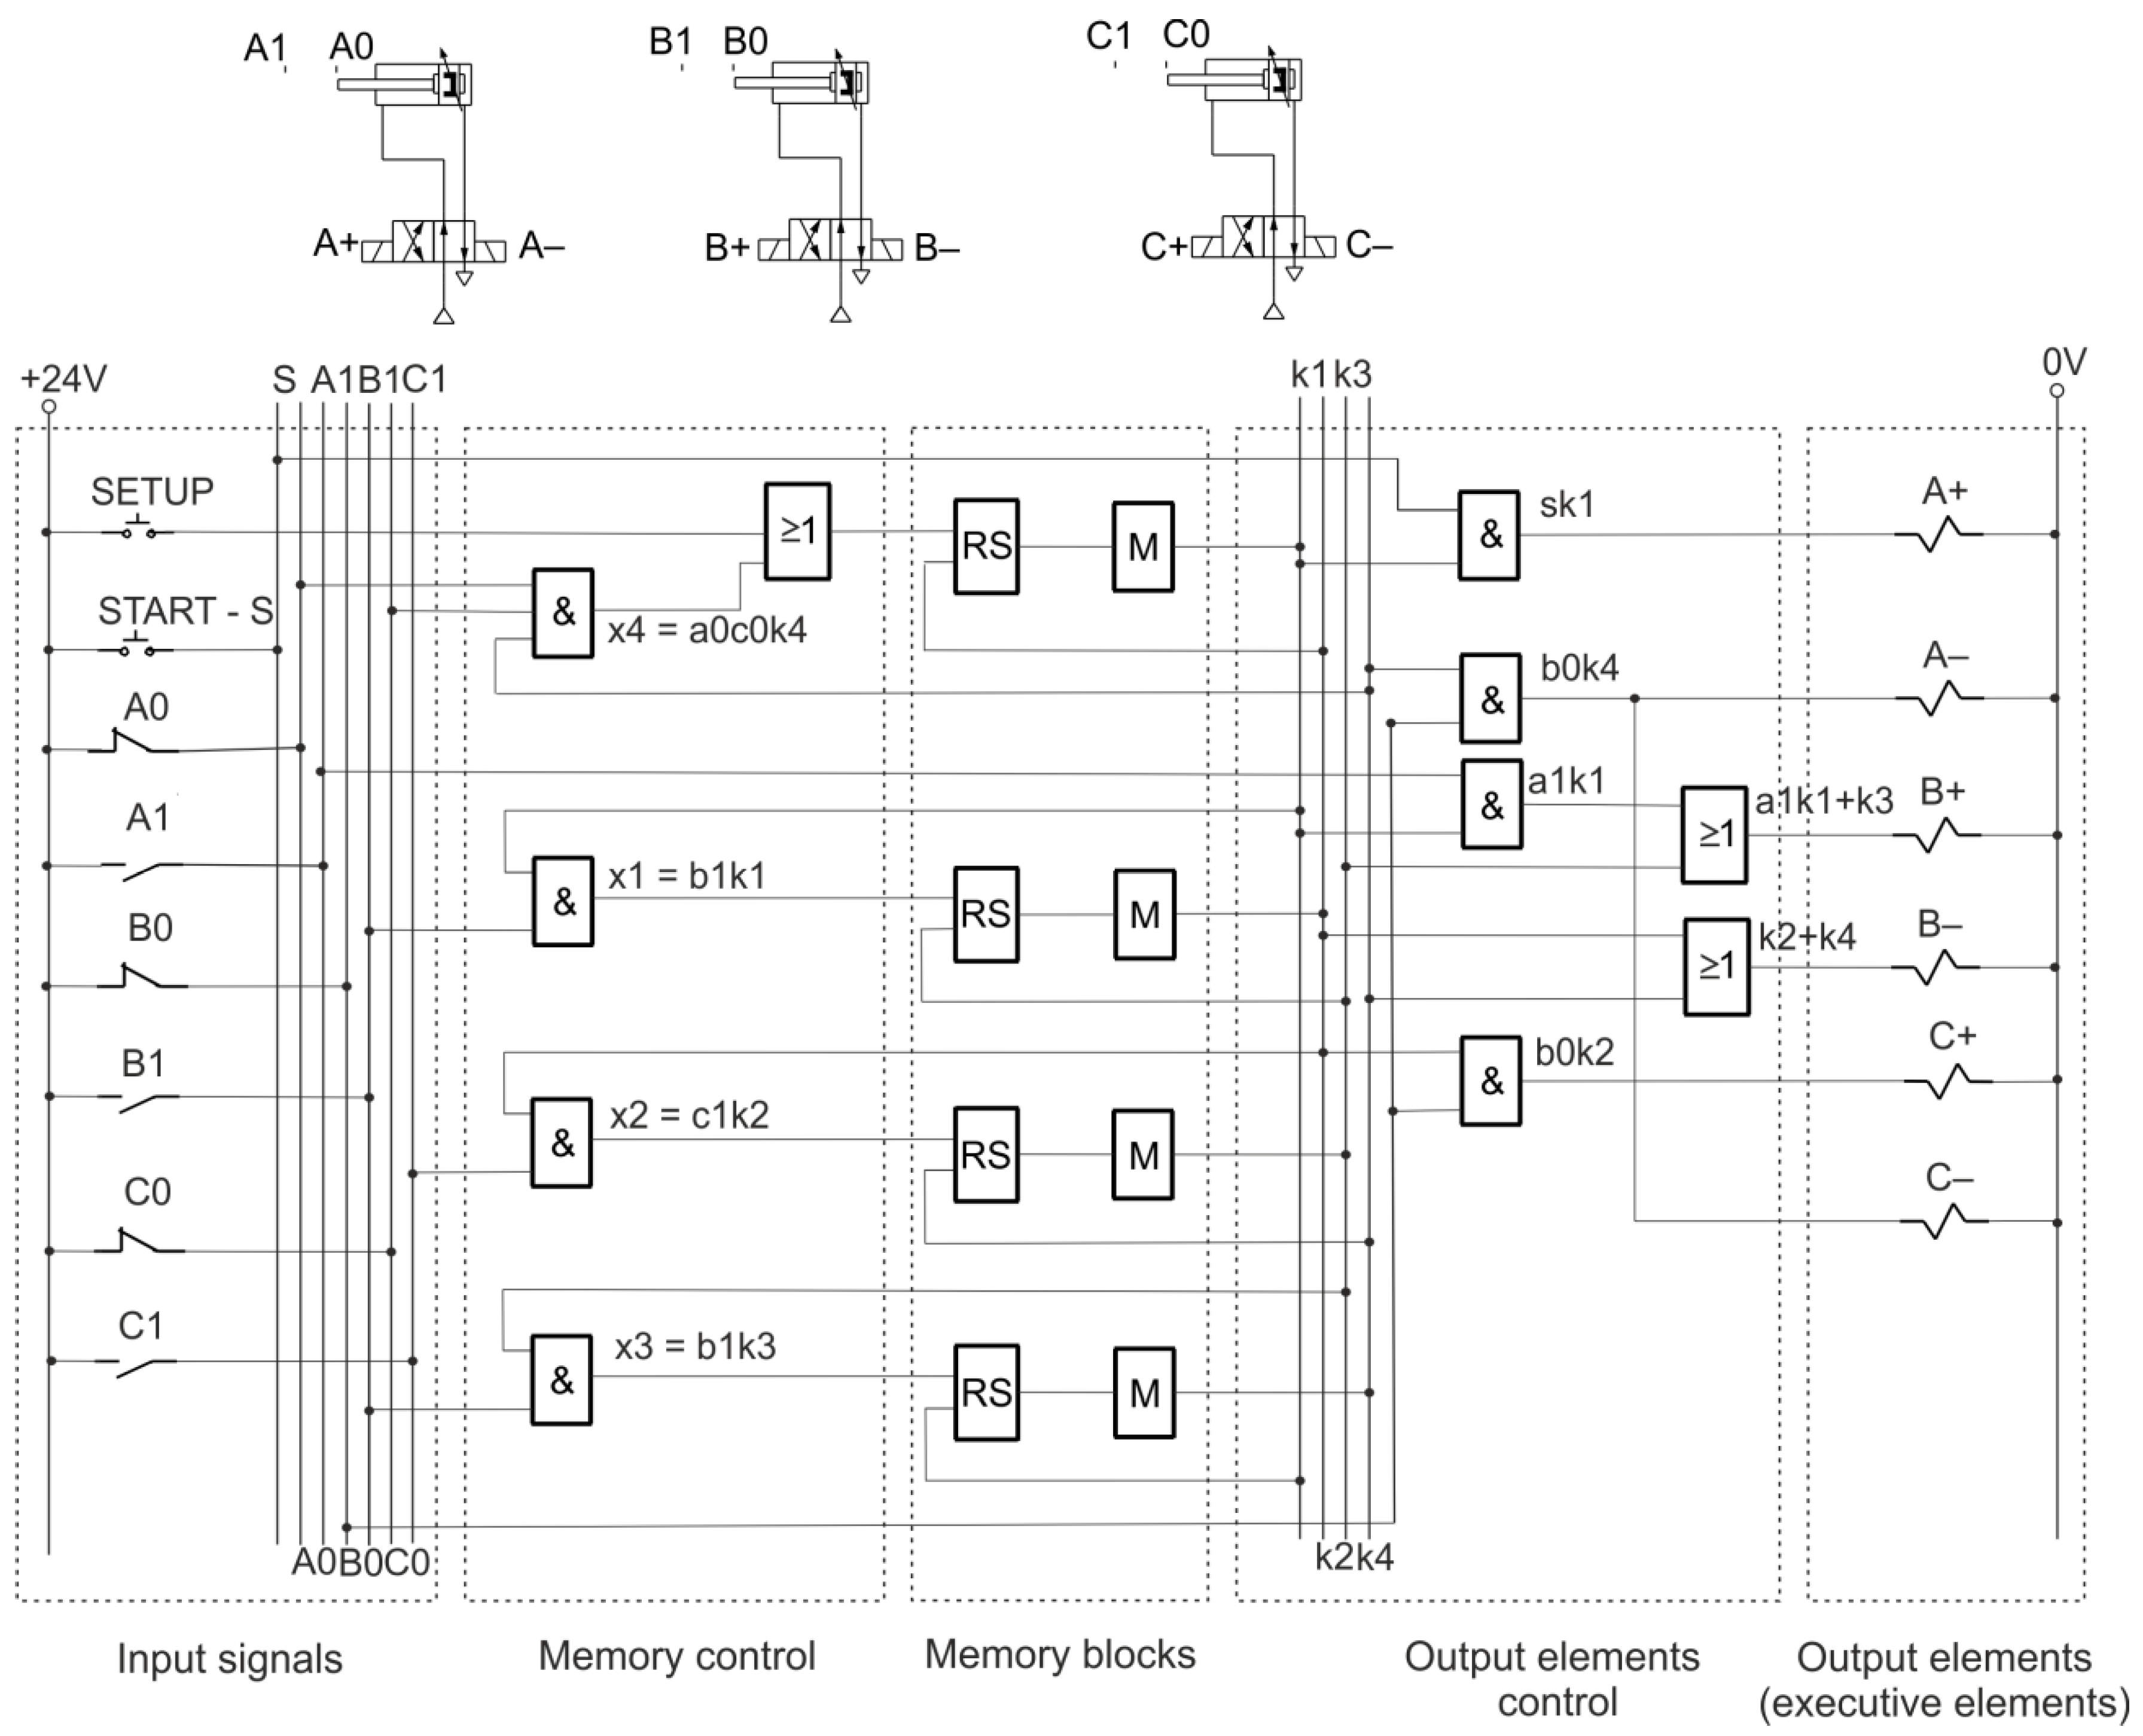
  • A+ input requires the product function s k1 to be implemented (s signal from start button, k1 memory status),
  • B+ input requires the sum function execution of two components (a1 k1 + k3) because the actuation state of the B actuator occurs twice, where the product a1 k1 is the first state appearing under the influence of the position of the actuator A and the memory state k1, while the second state of activation of the B actuator appears under the influence of the state of memory k3,
  • input B− requires the implementation of the function of the sum of two components (k2 + k4) because the B actuator OFF state occurs twice: i.e., under the influence of memory state k2 and memory state k4,
  • C+ input requires the product function b0 k2 to be implemented (product of the state of the actuator B position and memory k2),
  • inputs C− and A− require the implementation of the product function b0 k4 (product of the state of the actuator B position and the state of memory k4).
In the electro-pneumatic system (Figure 5), the actuators are controlled by solenoid valves.
The signals generated on the border of the graph segments are used to control the memory of the system. The system graph (Figure 4) shows that memory switching occurs according to the following relationships:
x1 = b1 k1,  x2 = c1 k2,  x3 = b1 k3,  x4 = a0 c0 k4,
The input signals to the memory block are read from the graph because they correspond to those arches that occur on the border of division into groups:
  • the x1 signal generates the k2 state (through the memory input setting the k2 state), which simultaneously resets the k1 state (through the memory input resetting the k1 state),
  • the x2 signal generates the k3 state (through the memory input setting the k3 state), which simultaneously resets the k2 state (through the memory input to reset the k2 state),
  • the x3 signal generates the k4 state (through the memory input setting the k4 state), which simultaneously resets the k3 state (through the memory input to reset the k3 state),
  • the x4 signal generates the k1 state (through the memory input setting the k1 state), which simultaneously resets the k4 state (through the memory input to reset the k4 state).
In the designed electro-pneumatic system, the 4/2 valves with electric control have been used (Figure 5). The valve state is set by applying a voltage signal to its coil. Loss of this voltage keeps the valve in the same state. Applying voltage to the second coil causes a change in its state.
It should be noted that the use of a circuit memory consisting of a flip-flop RS and a buffer M is advantageous. The voltage buffer circuit has a high buffer input impedance and provides a gain of unity.
Based on the graph of a simple system (Figure 4.) and the resulting diagram (Figure 5) general rules for creating an electro-pneumatic system diagram with the use of logic circuits can be formulated:
1.
Executive elements appearing in the graph are drawn in the general case of A–N, i.e., double-acting actuators cooperating with bistable solenoid valves;
2.
The input signals bus, power signals bus and the memory bus are drawn;
3.
The memory bus reflects the division of the graph from k1–kn;
4.
To the input signals bus A1–N1, A0–N0 measuring sensors of executive elements A–N are connected.
5.
System memory is created consisting of n RS flip-flops and M buffers, generating the memory state k1–kn;
6.
The memory is controlled by signals generated as a result of the radial division of the graph x1–xn, respectively, whereby the signal x1 sets the memory to the state k2, the signal x2 to the state k3, etc., and the signal xn sets the memory to the state k1. The state of k2 clears the state of k1, the state of k3 clears the state of k2, etc., the state of k1 clears the state of kn, through appropriate connections of the setting and resetting inputs of the flip-flops;
7.
The setting signals x1–xn the state of memories k1–kn are produced as the products of the state of the last element present in a given state of memory and the state of that memory; (e.g., x1 = b1k1);
8.
Switching on, switching off the output elements through the solenoid valve coils from A +, A− to N +, N− takes place by creating products of the state signals of the element preceding switching on, switching off the next element and the memory state in which it occurs according to the system graph;
9.
The first element in a given memory state is always controlled by that memory signal;
10.
In the case of multiple occurrences of the actuator state, the executive element switching on/off is performed by summing up the signals that are creating its switching on and off.
For the system, a simulation has been carried out in which the selected state from the system cycle has been presented below (Figure 6).
The computer-aided design program FluidSim by Festo ( Warsaw, Poland) was used to verify the designed system. The description of the procedure for creating the electro-pneumatic system in the FluidSim Pneumatics program is presented [11].
Figure 7 shows the view of the program window in the simulation mode of the designed electro-pneumatic system. The simulation shows the performed three cycles of the system operation. Verification of the designed system uses the ability to define the colors of the lines of electric logic signals (low—dark green color, high—bright green color) and pneumatic power in the simulation program.

4. Discussion

Modern developments require major technical novelty. Such novelty is achieved through the application of new elements and innovative connections, which often precludes the possibility of using known formulas. The designer must be familiar with alternative methods that will allow the diagram analysis of any control system included in the device s/he develops.
This article presents an algorithmic method of analyzing control systems. An algorithmic method of designing sequential circuits has been presented, taking into account computer support for electro-pneumatic systems. The main emphasis has been placed on the knowledge of system analysis methods, paying special attention to the algorithmic (graph) method, which supports the design of any sequential system.
The algorithmic design method of sequential control systems presents the operation of the system in a graphical manner. The devised graph describes the functions of signal processing, which enables the rapid programming of sequential electro-pneumatic systems with the use of logic elements.
The systems designed based on the graph method have been verified by simulation with the use of Festo’s FluidSim computer-aided design program.
Further research will aim to develop an algorithmic method for designing asynchronous electro-pneumatic systems used in the automation of technological processes, leading to obtaining a control system in the form of ladder diagrams, which are extensively used by PLC programmers.

5. Patents

The generalized structure of the control system, developed on the basis of the algorithmic method, was submitted to the Patent Office of the Republic of Poland [16].

Author Contributions

Conceptualization, A.S. and Z.S.; methodology, A.S. and Z.S.; software, A.S. and Z.S.; writing—original draft preparation, Z.S.; writing—review and editing, A.S.; visualization, A.S.; supervision, Z.S.; funding acquisition, Z.S. All authors have read and agreed to the published version of the manuscript.

Funding

The research was carried out as part of the research work: Analysis of the operation of power and control systems in the systems of the Industry 4.0 directive—source of financing 03.0.21.00/2.01.01.00.0000 SUBB.EKUE.21.001, Poland.

Institutional Review Board Statement

Not applicable.

Informed Consent Statement

Not applicable.

Conflicts of Interest

The authors declare no conflict of interest.

References

  1. Borden, T.; Cox, R.A. Technician’s Guide to Programmable Controllers, 6th ed.; Cengage Learning: Boston, MA, USA, 2021; ISBN 978-1111544096. [Google Scholar]
  2. Wikarek, J.; Sitek, P. A Data-Driven Approach to Constraint Optimization. In Advances in Intelligent Systems and Computing; Springer: Singapore, 2019; Volume 920, pp. 135–144. [Google Scholar]
  3. Sanver, U.; Yavuz, E.; Eyupoglu, C.; Uzun, T. Design and implementation of a programmable logic controller using PIC18F4580. In Proceedings of the 2018 IEEE Conference of Russian Young Researchers in Electrical and Electronic Engineering (EIConRus), Moscow, Russia, 29 January–1 February 2018; pp. 231–235. [Google Scholar]
  4. Vasu, P.; Chouhan, H.; Naik, N. Design and implementation of optimal soft—Programmable logic controller on multicore processor. In Proceedings of the 2017 International conference on Microelectronic Devices, Circuits and Systems (ICMDCS2017), Vellore, India, 10–12 August 2017; pp. 410–414. [Google Scholar]
  5. Vinces, L.P.; Fernández, P.; Carpio, C.D.; Rocca, E. An Automatic Control System Using the S7-1200 Programmable Logic Controller for the Ethanol Rectification Process. In Proceedings of the 2018 IEEE XXV International Conference on Electronics, Electrical Engineering and Computing (INTERCON), Lima, Peru, 8–10 August 2018; pp. 96–100. [Google Scholar]
  6. Gorzałczany, M.B. Układy Cyfrowe—Metody Syntezy. Tom II: Układy Sekwencyjne, Układy Mikroprogramowane; Wydawnictwo Politechniki Świętokrzyskiej: Kielce, Poland, 2003; p. 370. [Google Scholar]
  7. Tocci, R.; Widmer, N.; Moss, G. Digital Systems, 12th ed.; Pearson: London, UK, 23 March 2016; ISBN 0134220137. [Google Scholar]
  8. El-Maleh, A. A Note on Moore Model for Sequential Circuits. ResearchGate.com. Published on July 2016. Available online: https://www.researchgate.net/publication/305268049_A_Note_on_Moore_Model_for_Sequential_Circuits (accessed on 10 September 2021).
  9. Chhillar, K.; Dahiya, S. Design of Sequential Circuits with Timing Analysis and Considerations. Int. J. Eng. Sci. Comput. 2017, 7, 808–11809. [Google Scholar]
  10. Szcześniak, Z.B. Control of manipulator drive mechanism in smith forging process. Przegląd Elektrotechniczny 2011, 12a, 178–182. [Google Scholar]
  11. Szcześniak, A.; Szcześniak, Z.B. Designing of Control Systems for Automation of Technological Processes; Kielce University of Technology: Kielce, Poland, 2015. [Google Scholar]
  12. Li, I.-H.; Lee, L.-W. Design and development of an active suspension system using pneumatic-muscle actuator and intelligent control. Appl. Sci. 2019, 9, 4453. [Google Scholar] [CrossRef] [Green Version]
  13. Jing, X.; Yong, X.; Jiang, Y.; Li, G.; Yokoi, H. Anthropomorphic prosthetic hand with combination of light weight and diversiform motions. Appl. Sci. 2019, 9, 4203. [Google Scholar] [CrossRef] [Green Version]
  14. Dávila-Vilchis, J.-M.; LAZ-Avilés; Avilés Vilchis, J.C.; Vilchis-González, A.H. Design methodology for soft wearable devices—The MOSAR case. Appl. Sci. 2019, 9, 4727. [Google Scholar] [CrossRef] [Green Version]
  15. Szcześniak, A.; Szcześniak, Z.B. Methods and analysis of processing signals of incremental optoelectronic transducer. Rev. Sci. Instrum. 2009, 80, 1–6. [Google Scholar] [CrossRef] [PubMed]
  16. Szcześniak, A.; Szcześniak, Z.B. Układ sekwencyjnego sterowania elementami wykonawczymi, zwłaszcza elektropneumatycznymi. Patent Application PL432845, 5 February 2020. [Google Scholar]
Figure 1. Structure of a sequential machine: (a) Mealy, (b) Moore.
Applsci 11 11100 g001
Figure 2. System operating cycle diagram.
Applsci 11 11100 g002
Figure 3. System graph.
Applsci 11 11100 g003
Figure 4. Division of the graph into states.
Applsci 11 11100 g004
Figure 5. Diagram of the electro-pneumatic system with the use of logic circuits.
Applsci 11 11100 g005
Figure 6. Simulation—system in k4 state, actuator valve B OFF, retraction start of actuator B.
Applsci 11 11100 g006
Figure 7. View of the program window during the simulation of the electro-pneumatic system.
Applsci 11 11100 g007
Publisher’s Note: MDPI stays neutral with regard to jurisdictional claims in published maps and institutional affiliations.

