1. Introduction
High-speed rail (HSR) and stations are important vehicles for urban interaction, and their rapid development has shortened the spatial and temporal distances among cities, improved the accessibility of cities, and affected the spatial agglomeration and diffusion of populations and of socioeconomic activities. From the perspective of the urban interior, the “catalyst effect” [
1] and “agglomeration and diffusion effect” [
2] of HSR stations can improve the transportation infrastructure in cities. Moreover, HSR causes increases in social and economic activities and leads populations to gather in cities with stations [
3], which promotes the diversified development of industries, especially business services, communication and entertainment, retail, real estate, and tourism [
4]. This increase can not only promote the improvement of the industrial structure and of urban socioeconomic levels but also lead to the development of new comprehensive hub areas with HSR stations at their core, inducing resetting of the urban spatial structure. The continuous expansion of HSR networks and the development of station areas can promote the flow of materials, energy, and information and strengthen regional exchanges, which can help cultivate new urban economies and cause significant changes in urban and regional spaces. It is highly important to study the relationship between HSR and urban development and identify the mechanism by which HSR impacts urban space.
The impact of HSR on urban space stems from changes in accessibility [
5,
6]. In recent years, most studies have focused on the impact of HSR on accessibility [
7], spatial equity [
8,
9], travel patterns, urban sectoral employment [
10], commuting behavior [
11], spatial development [
12], land use [
13], and economic development [
14]. Despite the importance of these previous studies, the impacts of HSR on station area spatial structure remain largely unexplored. China is rapidly urbanizing and is constructing HSR on a large scale. To cope with the rapid development of urban space, China’s HSR stations are usually located at the edge or on the periphery of the city. Therefore, HSR station areas are regarded as important vehicles of urban expansion and structural optimization and adjustments for most cities in China. It has been proposed that new HSR cities centered on HSR stations be developed to help these cities become urban nodes in the HSR network. However, many HSR station areas have run into planning problems, such as the pursuit of large-scale construction and unreasonable expectations for growth. In view of the very large HSR network and the large number of HSR stations connecting cities in China, it is urgent to evaluate and analyze the development status and spatial structure of the areas surrounding HSR stations. Therefore, based on POI and land use data, this paper defines the spatial scope of the Zhengzhou East railway station area and explores the characteristics and influencing factors of its spatial structure from the perspective of industry.
3. Settings, Data, and Method
In this section, the study area is described (
Section 3.1). Then, the data sources are pointed out in detail, including point of interest (POI), land use, etc. (
Section 3.2). Thereafter, the methods used in this study are described (
Section 3.3). Finally, factors including location selection are introduced (
Section 3.4).
3.1. Study Area: Zhengzhou East Railway Station
Zhengzhou East railway station is the starting station of the Zhengzhou Kaifeng intercity railway, Zhengzhou Jiaozuo intercity railway, and Zhengji intercity railway. It is also an intermediate station on the Xulan HSR and the Beijing Guangzhou HSR. It is a typical example of a new HSR station. It is integrated with the urban public transportation system and rail transit system and is consistent with the direction of urban spatial development in that area. The area around the station has become a new functional urban area. Since it began operating in 2012, on the one hand, the construction of high-speed railway station reduces the commuting time between the city where the station is located and other cities and improves the accessibility of the city. On the other hand, the development and construction activities surrounding Zhengzhou East railway station have been strong, the landscape around the station has changed greatly, and significant centers of industrial and economic activity have developed around the station. Therefore, this paper uses Zhengzhou East railway station as a case study to explore the characteristics of the evolution of the spatial structure and analyze its impacting factors.
3.2. Data Sources
POI data are from 2010, 2015, 2019, and 2020 and were collected from the open API of Auto Navi Map. During data processing, duplicate and unrelated data were eliminated. Based on the national economic industry classification standards (GB/T4754-2017), 14 industry categories were selected as research subjects: accommodation and catering, real estate, construction, transportation, education, financial, residential services, scientific research and technology services, wholesale and retail sales, health and social welfare, culture and entertainment, information transmission, computer services and software, manufacturing, and leasing and business services. City-related data are from official statistical data and the relevant websites of the government and planning departments as well as field research and relevant website searches.
Using Landsat TM digital images from the cloud platform for geographic information monitoring (
http://www.dsac.cn/, accessed on 2 November 2021), human interactions with the remote-sensing, fully digital, fast extraction method were used to extract information. Combining the standard of urban land classification and planning, the land-use types of Zhengzhou East railway station are divided into 12 categories: road land, traffic hub land, industrial land, commercial land, educational land, square land, residential land, grass land, cultivated land, wood land, bare land, and water area.
3.3. Methods
3.3.1. Kernel Density
Kernel density analysis is a spatial analysis method based on the distribution characteristics of the research object. The sample points in the research area are given different weights through the kernel density function, showing a smooth density map to reveal the regional density attribute. It has obvious advantages in the quantitative analysis of the spatial agglomeration characteristics of points in the whole region. Therefore, kernel density analysis was used to calculate the density of spatial point and line elements within the neighborhood around the station to simulate the continuity of the industry density distribution. The kernel function can be expressed as:
where
is the location density estimation,
represents the bandwidth,
represents the distance between position
and observation point
, and
represents the kernel function.
3.3.2. Poisson Regression
Poisson regression is introduced as a statistical tool for estimating the association between a count outcome and one or more covariates. It is the baseline model for analyses of count data [
48]. The advantage of this method is that it can effectively simulate the event count frequency or event rate. The dependent variable is the number of POI in each grid of Zhengzhou East railway station. The number of POI in each grid is discontinuous and has obvious discrete characteristics. Assuming that the number of POI observed in the ith spatial cell follows a Poisson distribution with parameter B, the probability that the number of POI observed in each grid is
is as follows:
where
depends on the explanatory variable
and
represents the factors affecting the choice of industrial location.
represents the regression coefficients on each variable, and its maximum likelihood estimator is obtained by the logarithmic likelihood function
An important assumption of the Poisson distribution regression model is that the mean value and variance of the dependent variable are equal. If the Poisson distribution assumption is satisfied, the variance is estimated by the logarithmic likelihood function. The estimated value of
is obtained as follows:
If
is significantly greater than zero, it indicates that the mean value and variance of the dependent variable are not equal. In this case, the Poisson distribution regression model needs to be modified. Generally, a negative binomial regression model is used to replace the quasi-maximum likelihood estimation of
:
3.4. Factors Influencing Location Selection
The factors that affect the choice of industrial location mainly include two types of micro-market factors and location accessibility factors, including the following dimensions (
Table 1).
- (1)
Industrial agglomeration involves a specific core industry or several related enterprises in an industrial field being highly concentrated in a geographical region to cultivate industrial advantages. This study chooses the total density of each industry within a grid and various types of density measures to characterize the degree of industrial agglomeration. At present, the Zhengzhou East railway station area is rapidly developing, and agglomeration economies still play a leading role in its development. Therefore, the agglomeration benefits index is expected to have a positive impact on industrial location selection.
- (2)
The level of land rent directly affects the formation of the urban spatial structure. The land price of different locations are different, which leads to differences in industrial location choices. This study chooses land rent as the measure of land costs for industrial location selection. Through a shell search for real estate and residential guests, browsing good rental real estate agent platforms, and conducting field investigations and interviews, 100 enterprises’ rents were obtained, including shops, office buildings, shopping squares and commercial centers, residential merchants, and other types of firms. The land rent level in all the research area grids is obtained by the kriging interpolation method using Arcgis.
- (3)
Industries choosing to locate near HSR station areas need to consider whether they can obtain external services such as financial and commercial services. It is possible that the closer the commercial center is to the station area, the more attractive that area is to the industry. In this study, the distance between the grid center and Zhengdong International Convention and Exhibition Center is selected to characterize the association between the station area and the economic center.
- (4)
The accessibility of the regional external and internal traffic infrastructure has an impact on the choice of industrial location. A good traffic infrastructure is highly attractive to industries, and the accessibility of external and internal links is expected to have a negative impact on an industry’s decision to locate near the station area. This paper uses the spatial distances to various traffic facilities as indicators to measure differences in infrastructure.
Table 1.
Factors and explanation of industrial location selection of Zhengzhou East railway station.
Table 1.
Factors and explanation of industrial location selection of Zhengzhou East railway station.
| Category | Variable | Definition | Expected Impact |
|---|
| Industrial location | Location choice of industry in different grid (Y) | Number of POI per grid | |
| Micro-market factor | Land rent level (X1) | Grid rent price | − |
| Agglomeration effect (X2) | Grid industry density in the last period | + |
| Location accessibility | Distance to high-speed railway station (X3) | Distance from grid center to Zhengzhou East railway station (log) | − |
| Distance to nearest subway station (X4) | Distance from grid center to subway station (log) | − |
| Distance to nearest commuter bus stop (X5) | Distance from grid center to commuter bus stop (log) | − |
| Distance to nearest shopping mall (X6) | Distance from grid center to nearest shopping mall (log) | − |
| Distance from bus station (X7) | Distance from grid center to bus station (log) | − |
| Distance from Zhengzhou International Convention and Exhibition Center (X8) | Distance from grid center to International Exhibition (log) | − |
| Distance from high-speed entrance and exit (X9) | Distance between grid center and expressway intersection (log) | − |
4. Results
This section first provides defining the spatial scope of Zhengzhou East railway station (
Section 4.1). Then, it analyzes the industrial spatial structure of the HSR station area from three aspects (
Section 4.2). Finally, the factors influencing overall industrial location selection and industrial differences in impact factors are analyzed (
Section 4.3).
4.1. Defining the Spatial Scope of Zhengzhou East Railway Station
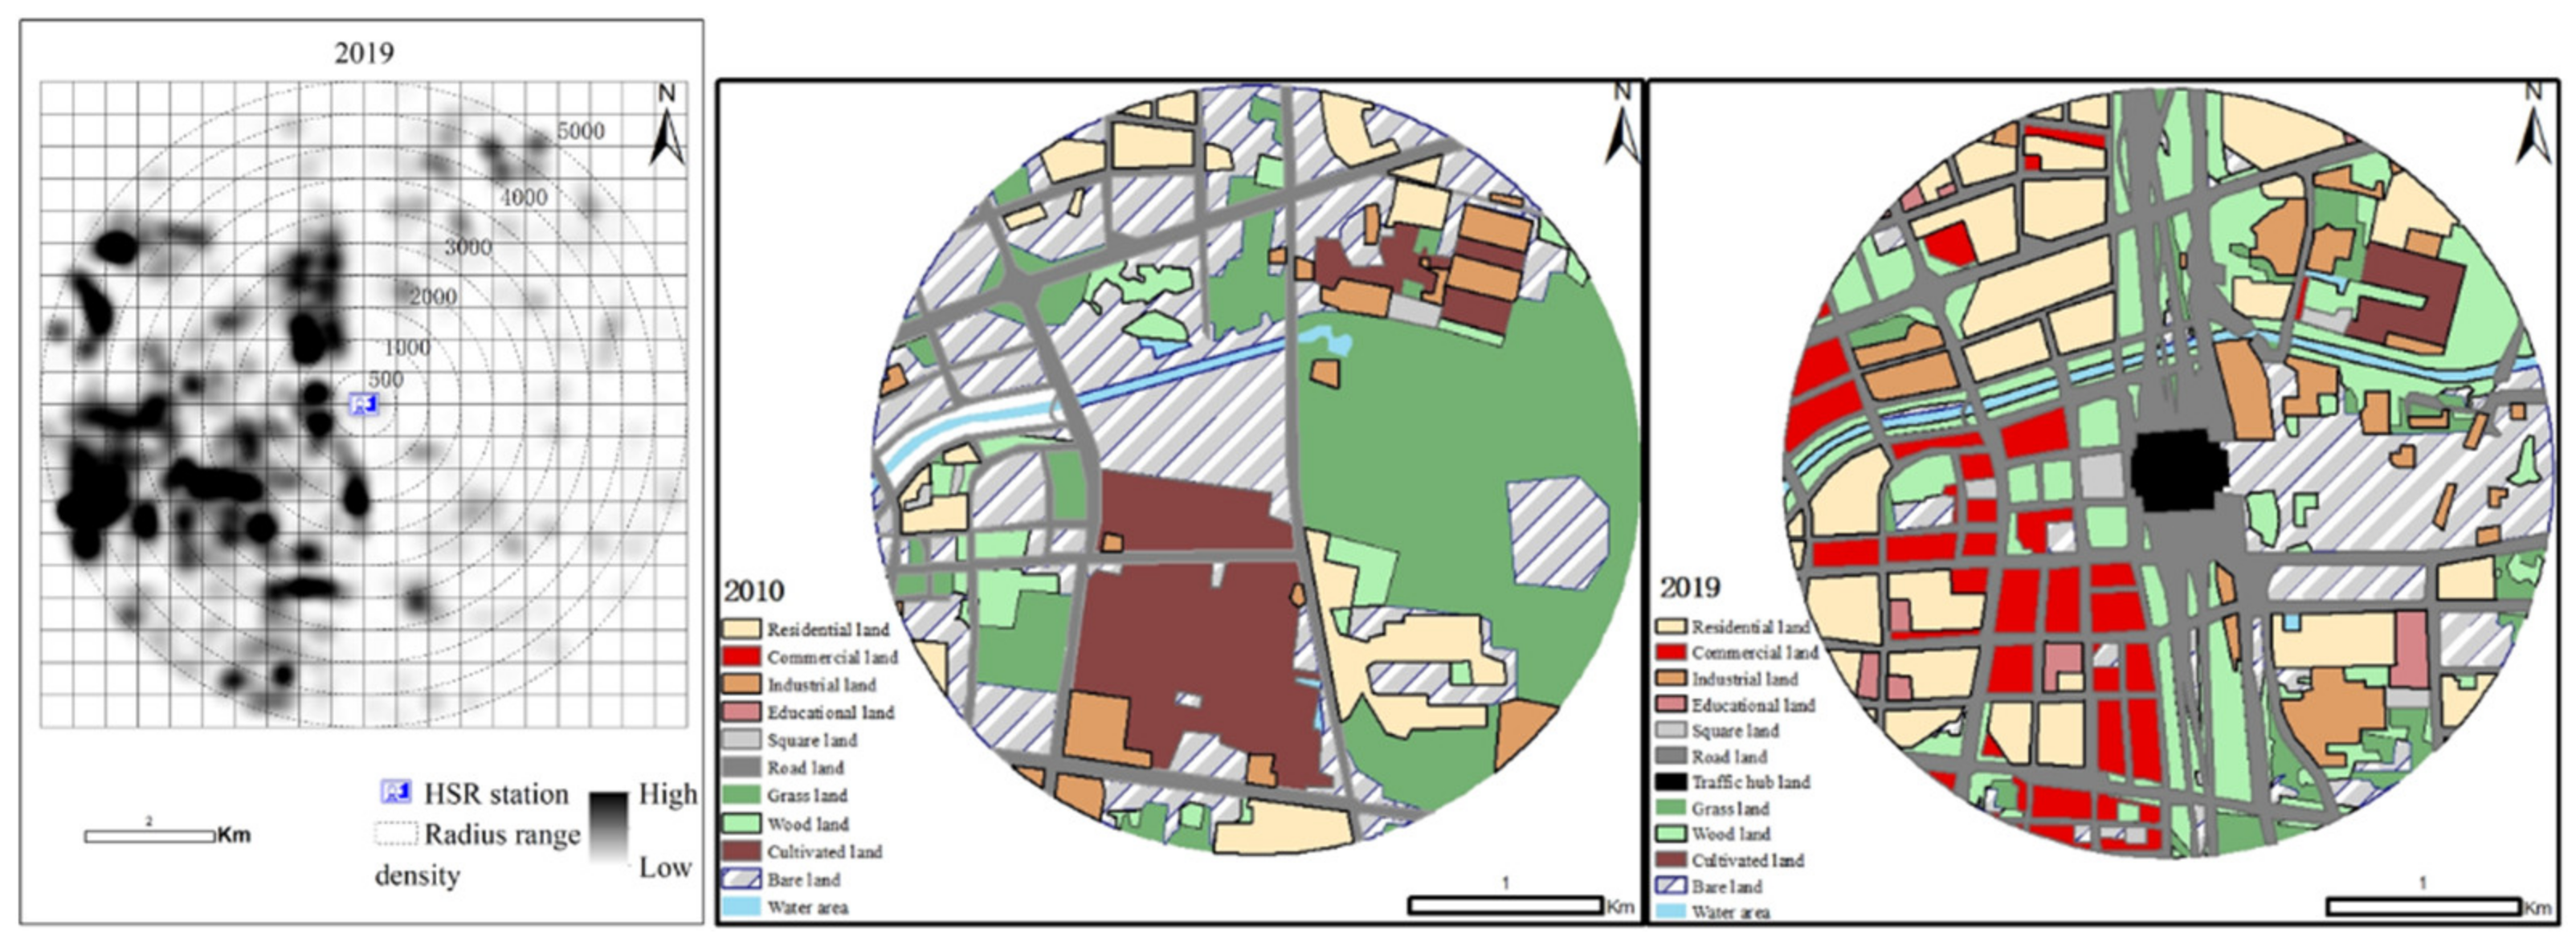
Defining the spatial scope of the station area is the basis of studying urban spatial structure. This was done in three steps: First, drawing on the previous research results and HSR station location, we determined the research spatial scope, which centers on the area around an HSR station within a radius of 5000 m, and we searched the POI data in this area in 2019, dividing the region into 500 × 500 m grids centered around the station. The higher the development level of the station, the greater the density of industrial activities around it, and the greater the POI density. Second, because there may be some variations due to defining the station area only by the spatial distribution and density of POI, we combined the land-use data from the 2010 map data, capturing land-use types before and after the opening of the HSR. Third, we took the station as the center and conducted on-the-spot investigations and visits of industries in eight directions to make further examinations and corrections, and finally defined the spatial scope of the HSR station area, including east, south, west, north, southeast, northeast, southwest and northwest.
According to the results from analyzing the kernel POI density within 5 km of Zhengzhou East railway station by Formula (1) (
Figure 1), the level of development in this area is relatively high, and there are several high-value kernel density areas. First, there are two high-value areas on the west side of the station within 500–1000 m. Referring to the land-use types in
Figure 1, these are composed of commercial land, mainly Shenlong Square, Greenland Plaza, and the Green Center twin towers. The second set of high-value areas are the northern and southern areas within the range of 1000–1500 m to the north of the station. From the land-use data, the high-value agglomeration areas in the north are mainly residential areas and office areas, while the high-value cluster areas in the south are mainly office buildings, mixed with hotels. Third, within the range of 2000–3000 m to the southwest of the station, the land-use map shows that the agglomeration area is mainly commercial land belonging to the existing built-up area. In terms of functional areas, this cluster belongs to the commercial and residential logistics area of Zhengdong New District, which has no direct connection to the development of the Zhengzhou East railway station area. It existed before the HSR station was built, and the degree of agglomeration was already relatively high at that time. Fourth, there are several high-value areas within 3500 and 5000 m to the southwest and northwest of the station, respectively. From the type of land use, it can be seen that the agglomeration area is mainly commercial and residential land, and the emergence of high-value points in these agglomerations is mainly influenced by the central business district and the commercial and residential logistics area of Zhengdong New District and has little correlation with the station.
Through the field investigation of Zhengzhou East railway station, the main development projects of the station were found to be mainly concentrated in the west square, within 1500 m to the south and north of the station, while Zhengdong commercial center is mainly outside the 2000-m range. Most of these areas are composed of offices and shopping malls within 1000 m of the station, and the hotels are mainly low-end and chain hotels. Between 1000 and 1500 m, offices and residences are the main types of buildings, high-end hotels are the main type of accommodation, and high-end residential areas are the main type of residential areas. There are obvious circular boundaries at approximately 1000 m. Therefore, we determine that the range of Zhengzhou East railway station is 2000 m, in which the core area is 0–1000 m, the influence area is 1000–1500 m, and the peripheral area is 1500–2000 m.
4.2. Analysis of the Industrial Spatial Structure of the HSR Station Area
4.2.1. Evolutionary Characteristics of the Industrial Circle Structure
Overall, the spatial distribution of industries around the Zhengzhou East railway station area is clearly circular in 2015 and 2020. Before the completion of the HSR, industries were mainly distributed in the peripheral areas and were highly dispersed. The results in
Table 2 and
Table 3 show that after the opening of the HSR, the spatial distribution of industries around the Zhengzhou East railway station area developed a significant circular structure. A horizontal comparison of the distribution of industrial density in the three circles shows that development intensity in the core area is relatively low and development to the west, south, and north of the station is relatively saturated. Due to the influence of the station facilities layout, the number and density of POI are lower in the core area than in the area of influence. Development intensity in the area of influence is increasing, the number and density of POI are relatively high, and several commercial buildings and commercial squares are under construction, which will provide more sufficient space for enterprises located in the area of influence around the station area. The third circle extends the development of the area of influence, and some office buildings and relatively low-grade residential areas have appeared, which seem from the landscape to be connected with the sub-central business district (CBD) of Zhengdong New District.
Compared with the industrial circle before and after the opening of the HSR, the results in
Table 2 and
Table 3 show that there are obvious differences in the core area, area of influence, and peripheral area. In the core area, the opening of the HSR has had the greatest impact on the catering and accommodations industry and the wholesale and retail industry, followed by the leasing and business services industry. At the same time, the proportions of the real estate; transportation; education; financial; residential services; scientific research and technology services; and culture, sports, and entertainment industries have increased to varying degrees. In the area of influence, before the opening of the HSR, the catering and accommodations industry had the largest share of all industries. After the opening of the HSR, the proportions of the wholesale and retail; financial; health and social welfare; and culture, sports, and entertainment industries decreased. It is worth noting that the proportion of leasing and business services increased significantly from 4.5% to 16.4%, the proportion of other industries increased to varying degrees, and the range of improvement was larger than that in the core area. In the peripheral area before and after the opening of the HSR, the highest proportion of industries was that of the wholesale and retail industry, and its proportion has increased, while the proportion of the residential service industry has increased significantly. Except for those of the construction industry and financial industry, the proportions of other industries have decreased. Through field research, the peripheral area was found to be mainly composed of contiguous residential areas, so there are many industries closely related to residential life. On the whole, the demand generated by HSR station facilities is mainly for catering and accommodation, wholesale and retail industries, and other basic service industries. Because of business passengers, HSR has a significant impact on demand for leasing and business services in addition to the basic services mentioned above. The development of the HSR station area is increasing the tertiary industry, changing the industrial structure of the Zhengzhou East railway station area, and optimizing and upgrading the industrial structure in this area.
4.2.2. Evolutionary Characteristics of the Overall Industrial Spatial Structure
ArcGIS Kernel density analysis was used to identify the characteristics of the overall industrial distribution in the Zhengzhou East railway station area in 2010 before the opening of the HSR and in 2015 and 2020 after the opening of the HSR. According to the results of the kernel density analysis (
Figure 2), before the opening of the HSR, industries were mainly concentrated in the peripheral area of 1500–2000 m from the stations, specifically distributed around villages and towns such as Jicheng and Chenzhuang, and the overall distribution of industries was sparse. At this time, the stations were not open, and the spatial correlation between residential areas and traffic lines was significant. In 2015, after the opening of the HSR, the industrial clusters in the peripheral area disappeared, while the East Square of Zhanqian and the Henan Province Free Trade Zone to the northwest of the area of influence became new agglomeration areas. Additionally, weak agglomeration areas appeared in the southern portion of the area of influence. In 2020, the trend towards industrial agglomeration was further strengthened, forming a more obvious agglomeration center and multi-core spatial structure. The specific agglomeration areas are the south and north areas of the west square of Zhengzhou East railway station, the Henan Province Free Trade Zone, and the Zhengshangjian Zhengdong center, which are distributed along Xinyi Road. A large number of industries are distributed within these four agglomeration areas, and a belt has developed along Xinyi Road to the northwest and southeast.
With the opening of the HSR, the overall industrial spatial structure of the Zhengzhou East railway station area has obvious agglomeration characteristics, with a number of agglomeration cores having formed. The agglomeration area has gradually expanded from the peripheral area to the station’s core area and area of influence, and the locations of the agglomeration areas vary across periods. With the opening of the HSR and the development of the station area, there have been four significant agglomeration areas in the station area through 2020, and the Zhengzhou East railway station area exhibits multi-core and axial belt spatial structure characteristics.
4.2.3. Evolutionary Characteristics of the Spatial Structure of the Subdivided Industries
With the construction of the station area, the structural characteristics of each industry subdivision are different, and 14 industries are mainly developed into different gathering areas in different places and distributed along the main trunk roads. The number of agglomeration areas can be divided into the following three categories: first, single core spatial structure. The main performance is to form a relatively single high concentration area, including the transportation industry (one main and two deputy) and the culture, sports, and entertainment industries (one main and one deputy). Taking the transportation industry as an example, the specific analysis is as follows: with the development and construction of the station area, the transportation industry has developed one main cluster with two auxiliary clusters (
Figure 3). In 2015, a number of small-scale agglomeration areas appeared, mainly distributed near the intersection of Xinyi Road and Jinshui East Road and the north section of Huipu Road and Puji Road. By 2020, the agglomeration area in the north section of Puji Road had weakened. In addition to forming an obvious high-density area in the affected area, there will be two secondary agglomeration areas along Puji Road and Fulu Street.
The second category is the dual-core space structure. It is mainly manifested in the formation of two high concentration areas and several sub-concentration areas. Such industries include the construction industry, scientific research and technology service industries, health and social welfare industries, and the manufacturing industry. Taking the construction industry as an example, the specific analysis is as follows: with the development and construction of the station area, the construction industry clusters have shifted from the peripheral area to the core area and the area of influence. Two obvious, highly concentrated areas have formed in the area of influence around the station. The third-level centers are distributed on the north and south sides of the station square (
Figure 4). On the whole, from 2010 to 2020, the construction industry shows the pattern of “large dispersion and small agglomeration”.
The third type is multi-core spatial structure, which mainly shows that there are more than two high concentration areas. Such industries include accommodation and catering industries, real estate industry, education industry, financial industry, residential services industry, wholesale and retail industries, information transmission and computer services industries, and leasing and business services industries. Taking the accommodation and catering industries as an example, the specific analysis is as follows: From 2010 to 2020, these industries gradually expanded into the core area and area of influence around the station and developed a spatial structure with multiple points of support and linear connections (
Figure 5).
4.3. Factors Impacting Industrial Location Selection
4.3.1. Analysis of the Factors Influencing Overall Industrial Location Selection
Before the variables were introduced into the model, the Pearson correlation coefficient method was used to analyze and evaluate the correlations among nine independent variables capturing the factors that influence industrial location selection, and no high correlations were found among these factors. Assuming that the number of POI in each grid conformed to a Poisson distribution, Poisson regression analysis could be conducted using Stata software. For 2015 and 2020, because the results of the goodness-of-fit test do not satisfy the assumption of equal variance and mean value, the negative binomial regression model was used to revise the Poisson distribution regression model by Equations (2)–(5). The model results are shown in
Table 4. R
2 values are relatively low. They are meaningful values in this research because the direction and significance of the variables are referential.
Agglomeration effects have a significant positive impact on the location selection of industries. As the correlation coefficient becomes larger, industries shows a preference for the original industrial agglomeration layout within the region, which further increases the level of agglomeration within the original regional industries and has a sustained impact on the spatial structure of the station area. With the development of HSR station areas, the influence of land rents on industrial location decreases.
Distance from the HSR station has a significant impact on industrial location selection, and the coefficient on this variable is positive in 2015 and 2020. Contrary to the expected results, the coefficient shows that, with an increase in the distance from the HSR station, the number of industries also increases. For each unit of distance from the HSR station, the probability of an industry choosing that location increases by 3.01%. This is consistent with the previous research showing that there is fewer POI in the core area than in the area of influence or the peripheral area. Zhengzhou East bus station is located to the northeast of Zhengzhou East railway station, and its impact on industrial locations is similar.
The coefficient of distance from a bus stop is negative, and the correlation coefficient increased in 2020, which indicates that industries prefer a local layout in which access to transportation via the bus station is convenient. With the development of the station area, this trend has increased. The distance from a subway station had a significant negative influence in 2015 and has no influence on the development of the station area. With the development of the HSR station area, greater distance from expressway entrances and exits reduces accessibility and reduces the probability of an industry choosing that location. The distance from the nearest shopping center has a significant negative impact on industrial location choices, and the correlation coefficient decreased in 2020, which indicates that the probability of choosing a given location decreases with increasing distance from a shopping center. The distance from the CBD Convention and Exhibition Center has a significant negative impact on industrial location selection, which is in contrast to the influence of distance from HSR stations. The correlation coefficient decreased in 2020, which indicates that the probability of an industry choosing that location decreases as the distance from the Convention and Exhibition Center increases.
4.3.2. Industrial Differences in Impact Factors
The calculation results are shown in
Table 5. Agglomeration effects have a significant impact on the spatial layout of industries, and the agglomeration effect coefficients for the 14 industries are positive, which indicates that external economies of scale and agglomeration effects are highly attractive to firms in the 14 industries. The development of Zhengzhou East railway station is rapid, and agglomeration economies are still dominant, which plays an important role in changes in the spatial layout and structure of industries. Additionally, there are obvious differences among the different industries. Land rents have a significant impact on the distribution of the accommodations and catering, real estate, transportation, wholesale and retail, and leasing and business services industries. Of these, leasing and business services are positively correlated with land rents, while the other industries are negatively correlated.
Distance from the HSR station has a significant impact on the distribution of the accommodation and catering, wholesale and retail, and leasing and business services industries, which indicates that the opening of the HSR station has attracted more basic service industries. Of these, the accommodation and catering industry has a negative correlation, and the other industries have a positive correlation. Distance to a subway station has a significant impact on the accommodation and catering, transportation, and construction industries, among which the impact on the transportation and construction industries is positive and that on the catering and accommodation industry is negative. Distance from a commuter bus stop has a significant impact on the accommodation and catering and real estate industries. The former is a positive correlation, and the latter is a negative correlation. Distance from a shopping center has a significant impact on the residential services and manufacturing industries. The former is a negative correlation, and the latter is a positive correlation. Distance from the bus station has a significant impact on the accommodation and catering, financial, wholesale and retail, manufacturing, and leasing and business services industries. Of these, the catering and accommodation industry is positively correlated, and the others are negatively correlated.
5. Discussion
The formation of HSR station spatial structure has its deep-seated internal mechanism. We tried to discuss the improvement of location accessibility brought by HSR service, micro-market factors, node-place attributes, government policies, undeveloped land area, passenger attributes, and demand, in order to better understand the formation of HSR station spatial structure.
5.1. Location Accessibility Significantly Affects the Spatial Structure of the Station Area
The most direct impact of the HSR station is an improvement in accessibility. The reduction in travel times brought about by the improved accessibility of the station area is the foundation for the formation of the station area spatial structure. The construction of the HSR station has improved accessibility and the image of the station area, stimulated local government investment, and attracted new industrial activity to the HSR station area, which can lead to large-scale gatherings of people, large-scale information sharing, and development of diversified industries, thus affecting the distribution and spatial layout of industries around the station. This generates the circular and multi-core spatial structure found in the station area. However, different transportation facilities have different effects on different industries, which affects the agglomeration and dispersion of those industries.
5.2. Micro-Market Factors Are the Structural Mechanism That Affects the Spatial Structure of the Station Area
Micro-market factors have an impact on the spatial structure of the station area through land rents and agglomeration economies. Land rent is the price paid by the land user for the land used or the land transfer price obtained by the landowner. The above analysis shows that the level of land rent is significantly negatively correlated with the industrial distribution. However, with the development and construction of the station area, the degree of its impact decreases. First, the implementation of a preferential rent policy in the station area attracts different types of industries to locate in that area. Through field research and social interviews, we found that, to support the development of Zhengzhou East railway station, the local government implemented a preferential rent policy to ensure the long-term industrial development of the area and to attract enterprises. Second, the spatial distribution of land rents determines the spatial distribution of different industries. From the field investigation, the land rent in the study area was found to be generally 3–5 yuan/day/square m, especially in Shenglong Square near the HSR station and Greenland Plaza, which attract a large number of industries that have formed a high-concentration area. The places with high land rents are concentrated around Greenland Xinduhui, the Huida Business Building, and the Henan Free Trade Zone, 1200–1500 m away from the HSR station area. The comprehensive support facilities in these areas are complete, attracting leasing and business service industries, among others, to form a cluster.
Zhengzhou East railway station is rapidly developing, and agglomeration economies are still dominant. Driven by reductions in transaction costs, economies of scale, agglomeration economies, increasing competitiveness, and increasing innovation, different industries have formed agglomeration areas near Zhengzhou East railway station, and the industries show a tendency to locate near the original industrial agglomeration areas. This trend further increases the agglomeration in the original industries and in different industries. Cluster areas around the station drive the multi-core industrial spatial structure of the whole area and the spatial agglomeration of different industries.
5.3. Node–Place Attributes Are Key Factors Affecting The Spatial Structure of the Station Area
With the construction of the station area, nearby villages are demolished, resulting in the disappearance of original industrial cluster areas and the emergence of new diversified industries related to the station, which form a new cluster area. Due to the influence of the station facilities layout, development intensity in the core area is relatively low, relating mainly to square and traffic facilities, and the number and density of industries are lower than those in the area of influence. With an increase in the distance from the HSR station, urban functions appear, land-use intensity in the area of influence increases, and industrial activities increase. At present, a number of commercial buildings and commercial squares are under construction, providing more sufficient space for industrial settlement and thereby affecting the spatial structure of the industrial area.
5.4. Attributes and Demands of HSR Passengers Are Important Factors in the Formation of the Spatial Structure of the Station Area
The characteristics of HSR passengers are closely related to the spatial structure of HSR stations. HSR passengers can be divided into five categories based on their travel purposes: business passengers, commuters between two places, visitors to relatives and friends, tourists and shopping passengers, and daily local-resident travelers. Regardless of the type of passenger, they may need the catering industry, retail industry, etc., so the wholesale and retail industry and catering and accommodation industry in the station area are sizeable. In addition to travel, business passengers also expect business, office, consulting, and other related functions to be provided in the station area. Therefore, the proportion of leasing and business services in the station area has increased significantly. Tourist passengers expect the station area to provide tourism, leisure, and entertainment services, so the distribution of such industries in the station area affects its circular structure.
HSR station areas can provide a large consumer population to fuel industrial development. To meet the needs of HSR passengers, the industrial structure of the station area is closer to what HSR passengers demand. The proportions of industries related to HSR passengers, such as catering and accommodation, wholesale and retail, and business services, are relatively large. First, HSR stations mainly drive the development of passenger transport infrastructure (internal and external transport) and squares, so the development intensity in the core area is lower than in other areas. With an increase in the distance from the HSR station, the residential services; culture, sports, and entertainment; education; and other industries gradually increase and transition to a normal urban functional space, integrating with the urban activities in the non-station areas, and the spatial structure ultimately exhibits obvious characteristics.
5.5. Sufficient Amounts of Unused Land Provide Sufficient Space for the Spatial Development of the Station Area
The distance between Zhengzhou East railway station and the center of Zhengzhou is 10.12 km, meaning that Zhengzhou East railway station is located in a suburban area. Before the opening of the HSR, the land was mainly bare or cultivated land. Therefore, there was sufficient undeveloped land to construct the station. The construction of an HSR station improves the accessibility of the station area, thus improving regional conditions and attracting catering and accommodation, wholesale and retail, business services, residential services, and other industries. Diversified economic activities emerge in the area, which greatly changes the land use and industrial activity in the station area and then the spatial structure of the station area.
5.6. Policies Are the Driving Force behind the Development of the Station Area
How the site spatial structure develops is the result of the comprehensive action of the market and the government. Policies are the driving force behind the development of the station area. The government influences the development of station areas through industrial policies, preferential rent policies, and station planning, from the macro level. First, in terms of industrial policy, on the one hand, the goal of Zhengdong New District, where the HSR station is located, is to develop a new urban area integrating multiple functions, such as business offices, scientific and technological research and development, transportation and logistics. As an important part of the development of Zhengdong New Area, Zhengzhou East railway station is strictly following its implementation plan, laying a solid foundation for the introduction of the business services industry and scientific and technological R&D industry, among other basic industries. Therefore, the proportions of the business services and scientific and technological R&D industries near Zhengzhou East railway station are gradually increasing. Second, regarding preferential rent policy, to improve the attractiveness of HSR stations, the government collects rents according to enterprises’ operational status or allows rent reductions for well-known enterprises or chain brand stores for a certain period. This reduces the threshold for entry into the industry, objectively increases the expected income of the region, and attracts diversified industries to locate there. Third, in terms of HSR station positioning, Zhengzhou East railway station is positioned in one of three regional centers in Zhengzhou. The HSR station not only is meant to drive the suburbanization of the city but also has been given the responsibility of reshaping the spatial structure of its jurisdictional area in Zhengzhou. Therefore, the government hopes to use the HSR as an opportunity to create a high-end service industry demonstration area and implement a series of policies to attract talent and enterprises, directly promoting the development of and construction in the station area and providing the basic conditions for the reformation of the area’s spatial structure.
6. Conclusions
Each breakthrough in transportation technologies and methods has profoundly affected the evolution of urban space. As an emerging transportation center, an HSR station can gather large-scale population, large-capacity information, diversified industries, etc. With its convenient transportation connection, it causes changes in accessibility and connectivity and becomes an important “catalyst element” of the city, thus affecting the spatial structure of the station area. This paper uses a representative station as a case study: Zhengzhou East railway station. Based on POI and land use data, this paper defines the spatial scope of the Zhengzhou East railway station area and explores the characteristics, influencing factors of its spatial structure from the perspective of industry. The major findings are as follows:
- (1)
The station area Zhengzhou East railway station is set at 2000 m. After the opening of the HSR, the industrial distribution took on a circular spatial character.
- (2)
With the construction of the HSR, the overall industrial spatial structure of the Zhengzhou East station area has developed from a continuous single-core structure to a multi-core spatial structure with a shaft shape. The characteristics of the spatial structure of each subdivided industry are different and can be divided into three main categories: single-core, dual-core, and multi-core structures.
- (3)
On the whole, internal and external transportation factors and agglomeration economies have a significant impact on the spatial distribution of industries, and land rents have gradually decreased in importance with the development of HSR station areas. The intensity of the effects of different factors varies among industries. Agglomeration benefits have a significant positive impact on all industries.
The main contribution of this paper is, first, it describes “three steps” to define the spatial scope of the HSR station area. Second, this paper studies the spatial structure evolution of overall industry and 14 sub-industries in HSR station areas, is to study the urban spatial structure in detail. However, this study has some limitations. First, it is necessary to strengthen multidimensional research on HSR station area spatial structure. In the future, we need to strengthen the measurement from the dimension of spread and compactness, etc. At present, China’s HSR has been operating for only a short time, so it will be necessary to track the impact of HSR on urban development for a long time. Additionally, research on HSR station area spatial structure supported by multi-source data should be strengthened. “Micro blog sign in data”, “night light data”, “mobile phone signaling” and other big data can be used in future research in a more detailed and accurate way.


