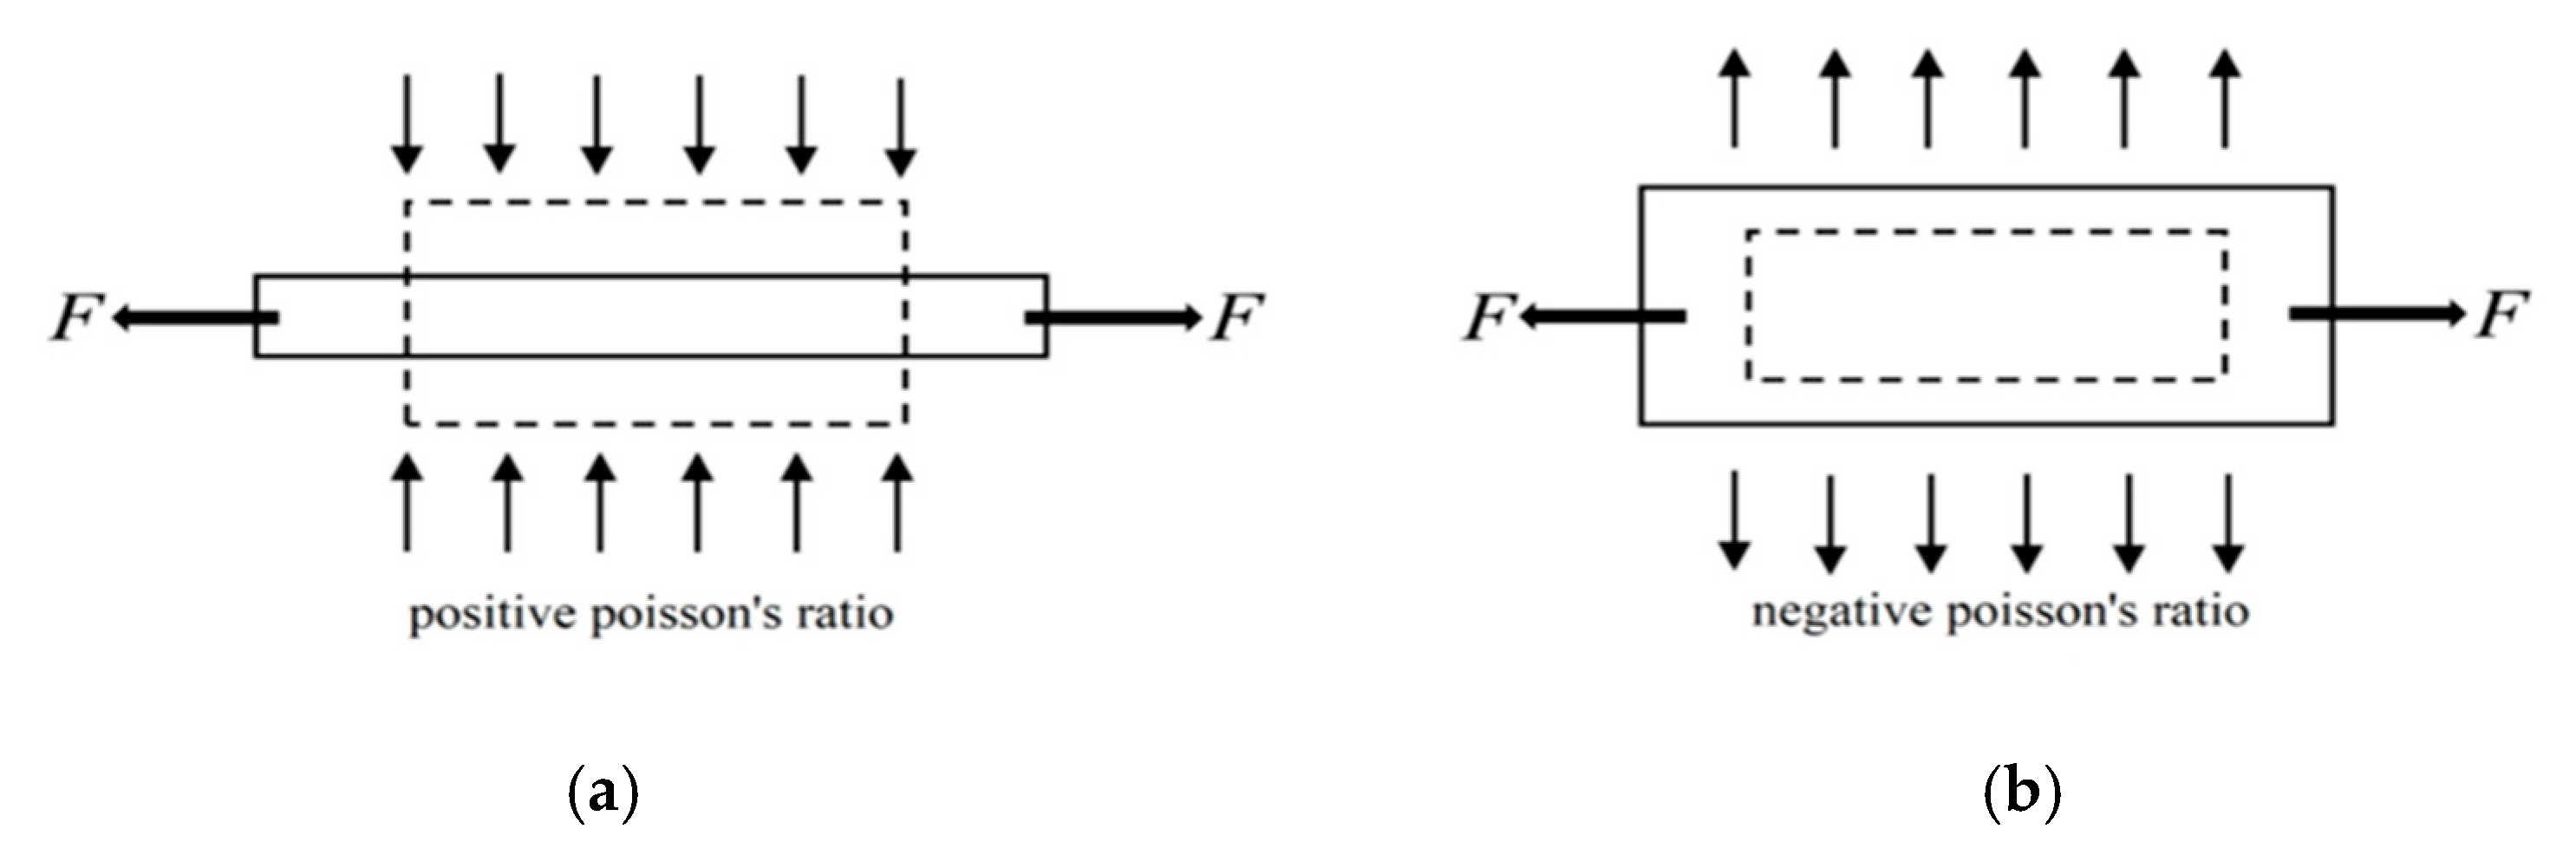
Article

The Negative Poisson’s Ratio Ship Base Design and Vibration Isolation Performance Analysis

1
Beijing Key Laboratory of Nonlinear Vibrations and Strength of Mechanical Structures, College of Mechanical Engineering, Beijing University of Technology, Beijing 100124, China
2
School of Mathematics and Statistics, Qingdao University, Qingdao 266071, China
*
Author to whom correspondence should be addressed.
Appl. Sci. 2021, 11(23), 11167; https://doi.org/10.3390/app112311167
Submission received: 19 October 2021 / Revised: 13 November 2021 / Accepted: 16 November 2021 / Published: 25 November 2021

Abstract

:
This paper mainly studies the vibration isolation of negative Poisson’s ratio structure in the honeycomb base of ships. Based on the structure of the negative Poisson’s ratio structure, different laying methods and different cell structure are used to construct the honeycomb base with the re-entrant hexagonal cell, the mathematical expression of Poisson’s ratio of a single re-entrant hexagonal cell structure is obtained through theoretical analysis. The negative Poisson ratio and relative density could be got by changing the angle and side thickness of the cell structure. Based on the different energy band of the re-entrant hexagonal cell structure, the different negative Poisson’s ratio re-entrant hexagonal honeycomb base was got, the energy band and the frequency response curve of the ship base are analyzed by COMSOL software. The energy band diagram and the frequency response of the structure are obtained to analyze the vibration isolation performance of the honeycomb base. By comparing the experimental results, the following conclusions can be gotten: (1) Compared with the traditional base, the negative Poisson’s ratio base has better vibration isolation effect on external excitation; (2) Different laying method and Poisson ratios can get different isolation effect. The combined base structure can provide better isolation effect to the external excitation in a larger frequency band; (3) By adding different mass blocks to the inner or peripheral angles of the basic re-entrant hexagonal cell, the vibration isolation performance of the structure can be changed to better.

1. The Introduction

With the development trend of industrialization, the vibration phenomenon of power equipment is inevitable, specially inside large mechanical mechanisms such as automobiles and ships. With the fluctuation of the main body, the vibration of equipment will lead to shortened service life and different degrees of wear and tear of power equipment. The techniques of vibration isolation, and absorption are applied to the vibration reduction design of structures. It is an effective way to reduce the vibration of hull and other structures by the design of foundation support. Liu et al. [1] used previous theories on the prediction of sound transmission loss for a double-panel structure lined with poroelastic materials to address the problem of a triple-panel structure, and selected appropriate configurations in which those with two air gaps in the structure exhibit the best overall performance over the entire frequency range. Zhou et al. [2] investigated sound transmission through double-walled cylindrical shell lined with poroelastic material in the core, The results show that if the frequency band over the ring frequency is of interest, an air gap, even if very thin, should exist between the two elastic shells for better sound insulation. Gohari et al. [3] presented an analytical model to embed porous materials in a finite cylindrical shell in order to obtain the sound transmission loss coefficient. Zarastvand et al. [4] proposed a strategy based on modeling poroelastic doubly curved composite shells on a Pasternak-type Elastic Foundation (PEF). Based on this research, it can be seen that honeycomb porous material has the characteristics of high porosity and low density, so it can meet the requirements of vibration absorption and light weight. Generally, traditional honeycomb material is positive Poisson’s ratio, it means that transverse size is reduced when material is under axial tensile, but the negative Poisson’s ratio materials is a under axial tension to expand its vertical axis of meta-materials [5]. Its mechanical performance mainly depends on its internal microstructure of the geometry, topology and spatial density decision [6,7,8].
Because of this property, negative Poisson’s ratio materials have attracted much attention. Compared with traditional honeycomb materials, negative Poisson’s ratio material has better energy absorption characteristics and lighter weight under the same volume. Therefore, negative Poisson’s ratio material has become a new material with more development potential. Lakes [9] pointed out that the negative Poisson’s ratio effect was actually independent of the size and scale of the material itself, so when the microstructure of the material was amplified and manufactured into a macrostructure the material still had negative Poisson’s ratio effect. More and more scholars have studied the analytical relationship between structural parameters and typical negative Poisson’s ratio materials. Among them, Gibson et al. [10] deduced the analytical expression of re-entrant hexagonal Poisson’s ratio. Zhang et al. [11] studied the mechanical properties of auxetic cellular material consisting of re-entrant hexagonal honeycombs. Grima et al. [12] gave the theoretical solution between star cell Poisson’s ratio and structural parameters. Due to its special mechanical properties, negative Poisson’s ratio meta-materials have the advantages of good energy absorption and lightweight [13,14,15,16], it has been used in the design and optimization of vibration isolation, explosion proof and impact resistance in aerospace, automotive industry and other fields [17,18,19,20,21]. Honig et al. [22,23] conducted a systematic theoretical and experimental investigation on the impact resistance of meta-material honeycomb. Pingington et al. [24] found that the main factors affecting the mechanical impedance of the base are the thickness and the amplitude of its resonance response. Wang and Stronge [25] used the micropole to study the dynamic deformation and performance of regular hexagonal honeycomb cell structure under vertical harmonic force excitation. Sanami et al. [26] studied the dynamic response of a chiral “arrow” negative Poisson’s ratio material under bending load. Banerjee et al. [27] used the equivalent continuum model to study the free vibration characteristics of honeycomb structures without excitation. Scarpa et al. [28] studied the vibration characteristics of hexagonal inner negative Poisson’s ratio honeycomb sandwich panels simply supported by four sides and analyzed the influence of geometric parameters of honeycomb cells on its natural frequency. Ingrola et al. [29] used 3D printing technology to analyze and compare the in-plane axial compressive performance, impact deformation and failure mode of conventional honeycomb sandwich panels with the negative Poisson’s ratio honeycomb sandwich panels and conventional-negative Poisson’s ratio honeycomb hybrid sandwich panels. Schultz et al. [30] studied the response of cellular geometric parameters to the energy absorption of honeycomb sandwich structure under high-speed in-plane impact load, and it showed that the energy absorption rate was the highest when the honeycomb configuration presented negative Poisson’s ratio. Duc et al. [31] used analytical solutions to study the dynamic response and vibration of a double-curved flat shell with negative Poisson’s ratio, and the honeycomb growed on an elastic foundation under explosion and damping loads. Albertini et al. [32] calculated the effective Poisson’s ratio for different geometries to characterize the symmetry, and used finite element method to discuss the effect of effective elastic mesh characteristics in different loading directions on compression energy dissipation. Qin et al. [33] proposes a topology optimization design method of metamaterials for improving the vibration reduction performance, and it showed that the novel designed meta-materials have at least 12% improvement in vibration reduction performance over the traditional honeycomb. Chang et al. [34] studied the propagation of waves in phononic crystals, it consisted of a negative Poisson’s ratio star-shaped honeycomb matrix. Jiang et al. [35] designed a three-dimensional (3D) star structure to construct meta-materials with both negative static and dynamic properties. The results showed that the 3D star structure formed a wide band gap at lower frequency and had a negative Poisson’s ratio. Ye et al. [36] developed a design framework, it integrated the topology optimization, parametric design and compression experiment for the GS mechanical meta-materials induced by the negative Poisson’s ratio (NPR) property. Chen et al. [37] investigated the vibration and damping properties of carbon fiber reinforced polymer (CFRP) 3D double-arrowhead (3D DAH) metamaterials, the negative Poisson’s ratio effect of CFRP 3D DAH meta-materials was studied analytically by energy method.
The literature reviews indicate that applying the negative Poisson’s ratio structure to the honeycomb structure is highly meaningful. Studying the vibration damping performance of the structure is very important to the vibration base designs and analysis. Few analyses can be found on the vibration isolation performance of different special-shaped negative Poisson’s ratio structures. In this paper, the vibration isolation performance of negative Poisson’s ratio re-entrant structure was analyzed respectively. The Poisson’s ratio calculation formula of negative Poisson’s ratio re-entrant structure is derived according to the dimension angle of the structure. The band gap diagram of negative Poisson’s ratio re-entrant structure was got, and the frequency response curve of the honeycomb structure was got, so the vibration isolation performance of the structure is analyzed. Based on the negative Poisson’s ratio re-entrant structure, circular mass blocks of different sizes were added to the different corners of the structure respectively to increase the band gap width, and then the frequency response curves of these deformed structures were analyzed. The vibration isolation performance of negative Poisson’s ratio honeycomb base was compared with that of traditional structure.

2. Theoretical Derivation and Energy Band Analysis of Mechanical Properties of the Cell

Negative Poisson’s ratio vibration isolation base is widely used in ships due to its special dilatancy characteristics. Figure 1 shows the negative Poisson’s ratio characteristics of structures with negative Poisson’s ratio under stress, and the corresponding characteristics of structures with positive Poisson’s ratio under stress.

2.1. Theoretical Derivation of Re-Entrant Hexagonal Cell

A simple schematic diagram of the honeycomb base is shown in Figure 2a, and its standard re-entrant hexagonal honeycomb cell is shown in Figure 2b, where h is the vertical side length of cell, l is the hypotenuse length of cell, and θ is the angle of cell ( θ < 0 ).
According to reference [38], Poisson’s ratio and relative density of the re-entrant element with negative Poisson’s ratio can be derived as follows. When the re-entrant hexagonal honeycomb configuration is loaded in X 1 or X 2 direction and deforms in a linear elastic manner, the dimension relation in Figure 2b can be obtained from the geometric relation:
X 1 = 2 l cos θ
X 2 = 2 h + 2 l sin θ
It is assumed that the configuration of re-entrant hexagonal honeycomb cell is rigid structure during the micro-deformation process, it means that, h and l are constant in the process of deformation, and its deformation only depends on the change of the cell angle θ . For this structure, Poisson’s ratio can be expressed as:
V ij = ( V ji ) 1 = d ε j d ε i · ·   i , j = 1 ,   2
where, the d ε included angle θ can be expressed as:
d ε i = 1 X i d X i d θ d θ
Substituting Poisson’s Ratio into the calculation formula, we can get:
v 21 = ( v 12 ) 1 = d ε 1 d ε 2 = d X 1 / d θ d X 2 / d θ X 2 X 1
From Equations (1) and (2), it can be known that:
d X 1 d θ = 2 l sin θ
d X 2 d θ = 2 l cos θ
Substituting it into Equation (5), we can get:
v 21 = ( v 12 ) 1 = ( h / l + sin θ ) sin θ cos 2 θ
According to the geometric relationship, the relative density of cell can be expressed as:
ρ * ρ s = ( 4 l + 2 h ) τ 4 l cos θ ( h + l sin θ ) = τ / l ( h / l + sin θ ) cos 2 θ

2.2. Energy Band Analysis of Re-Entrant Hexagonal Cell and Traditional Cell Structure

The energy band and the natural frequency analysis of a single re-entrant hexagonal cell is carried out with the help of phononic crystal knowledge. Firstly, the selection of the size of a single structure is summarized after reading many papers and do some research, the size of a single cell is determined, as shown in Figure 3.
Thevertical edge h = 10   cm and side thickness τ = 0 . 1   cm or τ = 0.2   cm , θ = 15 ° or θ = 30 ° are selected in the experiment, as shown in Figure 3 Single cell a   =   14   cm , b   =   10   cm . As is shown in formula, range from Equations (1)–(9), Poisson ratio is corresponding to different angles θ   =   15 ° and θ   =   30 ° are v   =   0 . 47 and v   =   1 . 11 respectively.
The meta-material vibration isolation base is made of high strength steel, its elastic modulus E   =   210   Gpa , and its Poisson’s ratio v   =   0.30 and density ρ   =   7800   kg / m 3 . The irreducible Brillouin region of the reduced Brillouin region of the cell can be regarded as a periodic structure. The natural frequencies of the irreducible Brillouin region of the cell can be analyzed by parameter scanning, and the band diagram can be obtained.
According to the band diagrams of cell structure from different angles, there is a band gap in the vertical direction of cell structure, that is, there is a vibration isolation effect in the vertical direction. The cell structure with different Poisson’s ratio has more obvious isolation effect at different frequencies. For example, from Figure 4, when side thickness τ   =   0.1 cm , we can see that when the Poisson’s ratio v   =   1 . 11 , there is an obvious band gap between cell structure and frequency range 300–600 Hz. 900–1400 Hz. 2600–2900 Hz. We can see that when the Poisson’s ratio v   =   0 . 47 , there is an obvious band gap between cell structure and frequency range 210–410 Hz. 790–1100 Hz. 1800–2200 Hz; From Figure 5, when the side thickness τ   =   0.2 cm , we can see that when the Poisson’s ratio v   =   0 . 47 there is an obvious band gap between cell structure and frequency range 510–1200 Hz. 1900–3000 Hz. 3600–4500 Hz. We can see that when the Poisson’s ratio v   =   1 . 11 , there is an obvious band gap between cell structure and frequency range 500–900 Hz. 1000–1300 Hz. 3600–4400 Hz.
The experimental results show that the re-entrant hexagonal structure does have the effect of vibration isolation, and the re-entrant hexagonal structure with different Poisson’s ratio and different side thickness has the different frequency band gap, it means that the cell structure with different Poisson’s ratio can isolate the excitation in different frequency bands.

2.3. Energy Band Analysis of Traditional Ship Honeycomb Base

It’s the same structure as a traditional pedestal, the meta-material vibration isolation base is made of high strength steel, elastic modulus   E   =   210   Gpa , Poisson’s ratio v   =   0.30 , and density ρ = 7800   kg / m 3 .
The irreducible Brillouin region of the reduced Brillouin region of the cell can be regarded as a periodic structure. The natural frequencies of the irreducible Brillouin region of the cell can be analyzed by parameter scanning, and the energy band diagram can be obtained.
As can be seen from Figure 6b, the traditional cell structure has no obvious vibration isolation band gap at different frequencies in the vertical direction. Because there is no band gap in the traditional solid base, so there is no vibration isolation effect.

3. Cell Base Structure and Frequency Response Analysis

Because the structure is anisotropic and there is no complete band gap in the horizontal direction, so only the vertical vibration isolation base is designed in the paper. Based on the energy band analysis of the cell structure of re-entrant hexagon and traditional hexagon, the vibration isolation effect of re-entrant hexagon is verified. Based on re-entrant hexagonal cell structure and traditional honeycomb cell structure, respectively, different honeycomb bases are constructed, and the frequency response analysis of the bases is done to further verify the vibration isolation effect of the bases.

3.1. Frequency Response Analysis of Traditional Vibration Isolation Base

Based on the traditional cellular structure of the honeycomb base, the long side is 14 cm and the short side is 10 cm. The structure is solid structure. The geometric diagram of the honeycomb base is given in the Figure 6c, and the vertical direction is laid with 6 layers.
The vertical coordinate of the frequency response curve graph represents the logarithm of the displacement ratio between the initial position and the position of the end point. The smaller the value is, the better the vibration isolation effect is. The larger the range is, the wider the vibration isolation bandwidth of the modified mechanism to external excitation is. As can be seen from Figure 6d, the traditional honeycomb base with solid steel structure does not have isolation effect on external excitation in any frequency band.

3.2. Frequency Response Analysis of Negative Poisson’s Ratio Honeycomb Base

Proportioning mass blocks will change the natural frequency of the structure and produce a special resonance, and this will open the band gap of the structure to change the vibration isolation performance of the structure. So based on the re-entrant hexagonal cell structure, the vertical side of the cell structure is a   =   14   cm , the hypotenuse side is b   =   10   cm , and the side thickness is τ =   0.1   cm and τ   =   0.2   cm , respectively, the cell structure with different Poisson’s ratio is used to design the honeycomb base. As shown in the following schematic diagram, the honeycomb base is designed to be laid in 6 layers in the vertical direction.
In the same way, the vertical coordinate of the frequency response curve graph represents the logarithm of the displacement ratio between the initial position and the position of the end point. The smaller the value is, the better the vibration isolation effect is. The larger the range is, the wider the vibration isolation bandwidth of the modified mechanism to external excitation is. From the frequency response curve of Figure 7, Figure 8 and Figure 9, we can see that honeycomb base with re-entrant hexagonal structure has better isolation effect on external excitation. For example, it can be seen from Figure 7 that honeycomb base with re-entrant hexagonal structure with Poisson’s ratio of v   =   0.47 and side thickness τ   =   0.1   cm has good isolation effect when the frequency is higher than 300 Hz and it has more effective isolation effect on frequency about 5000 Hz. From Figure 8, we can see that when the side thickness τ   =   0.2   cm with the same Poisson’s ratio, honeycomb base provides better isolation at higher frequencies above 8000 Hz. From Figure 9, we can see when different cell structure are used in honeycomb, the base has isolation effect in wider frequency, when the side thickness is τ   =   0.1   cm , it can be seen that the cellular base has frequency vibration isolation when the frequency is higher than 300 Hz, and in the much more higher frequency, the base has better vibration isolation than Figure 7 and Figure 8, and when the side thickness is τ   =   0.2   cm , there is significant vibration isolation when the frequency is higher than 8000 Hz, and better vibration isolation can be gotten when the frequency is lower, this is better than Figure 7 and Figure 8. It can be seen from Figure 7, Figure 8 and Figure 9 that when the re-entrant structure with different Poisson ratios is used for laying, it will have better vibration isolation effect at a wider frequency.

3.3. Frequency Response Analysis Based on Heteromorphic Negative Poisson’s Ratio Cell structure Base

Proportioning mass blocks will change the natural frequency of the structure and produce a special resonance, and this will open the band gap of the structure to change the vibration isolation performance of the structure. In order to have vibration isolation performance in multiple frequency bands, we can see that a circular mass block was added to the inner corner or the surrounding corner of the original cell structure in Figure 10. The energy band of the cell structure was analyzed by changing the radius size of the circular mass block, and then the frequency response analysis of the honeycomb base was carried out.
From Figure 11, Figure 12, Figure 13, Figure 14, Figure 15, Figure 16, Figure 17, Figure 18, Figure 19, Figure 20, Figure 21, Figure 22, Figure 23, Figure 24, Figure 25, Figure 26, Figure 27, Figure 28, Figure 29, Figure 30, Figure 31, Figure 32, Figure 33 and Figure 34, based on the structure of the special-shaped cell, different radius sizes of the mass blocks were adopted and the frequency response analysis of the honeycomb base was carried out.
When the sideside thickness of the structure is τ = 0.1   cm , from Figure 11, Figure 12, Figure 13, Figure 14 and Figure 15, it can be seen that, when the Poisson’s ratio of the structure is v = 0 . 47 , the value range of the band gap frequency of the structure shows an overall increasing trend with the increase of mass blocks in the inner and outer corner angles of the cell structure: according to the vertical coordinates of Figure 11d and Figure 12d, Figure 7c, Figure 8c and Figure 9c, the vibration isolation performance of the structure is almost the same as the structure that the Poisson’s ratio is v = 0 . 47 and the side thickness is τ = 0.1   cm . When the mass blocks added to the inner and outer angles are large, under the same Poisson ratio and side thickness, the vertical coordinates of Figure 13d, Figure 14d, Figure 15d and Figure 16d shows that the vibration isolation performance of the structure is better than that of the structures without mass blocks. When the Poisson’s ratio of structure is v = 1 . 11 , side thickness τ = 0.1   cm , from the Figure 17 to Figure 22 we can see that, when the inside and outside mass increases, the structure of the vibration isolation performance of the overall rise, especially when the quality of block size increases to a certain extent, such as Figure 21d and Figure 22d, vibration isolation performance of the structure is more prominent, moreover, the vibration isolation effect of the structure is particularly outstanding at the frequency of 6000 Hz–8000 Hz.
When the side thickness of the structure is τ   =   0.2   cm , it can be seen from Figure 23, Figure 24, Figure 25, Figure 26, Figure 27 and Figure 28 that when the Poisson’s ratio of the structure is v   =   0 . 47 , with the increase of internal and external angle blocks, the vibration isolation performance of the structure is almost the same as that shown in Figure 7d without adding mass blocks, and occasionally presents a downward trend. When the Poisson’s ratio of structure is v = 1 . 11 , it can be seen that from the Figure 29 to Figure 34, vibration isolation performance of the structure is almost unanimous, even in some size mass block will appear the situation of vibration isolation performance decline, but when quality block size is larger, as shown in Figure 31 and Figure 34, The structure will have better vibration isolation performance at more frequencies compared without the quality block structure is Figure 8d.
As can be seen from the overall comparison of Figure 11, Figure 12, Figure 13, Figure 14, Figure 15, Figure 16, Figure 17, Figure 18, Figure 19, Figure 20, Figure 21 and Figure 22 and Figure 23, Figure 24, Figure 25, Figure 26, Figure 27, Figure 28, Figure 29, Figure 30, Figure 31, Figure 32, Figure 33 and Figure 34, when the side thickness of the structure is τ   =   0.1   cm , the vibration isolation performance of the structure is better than that of the structure when the side thickness is τ   =   0.2   cm . By the overall comparison between the internal and external angles with mass blocks and those without mass blocks, that is, the overall comparison between Figure 11, Figure 12, Figure 13, Figure 14, Figure 15, Figure 16, Figure 17, Figure 18, Figure 19, Figure 20, Figure 21, Figure 22, Figure 23, Figure 24, Figure 25, Figure 26, Figure 27, Figure 28, Figure 29, Figure 30, Figure 31, Figure 32, Figure 33 and Figure 34 and Figure 7, Figure 8 and Figure 9, it can be concluded that the vibration isolation performance of the structure with mass blocks is generally better than that without mass blocks.
In conclusion, when the side thickness is τ   =   0.1   cm , the vibration isolation performance of the structure is much better. The inner mass block is bigger, the performance is better, but if the mass block is too big, the vibration isolation performance gets worse. Adding the mass block to the outer corner can make the vibration isolation frequency more wide. However, when the side thickness is τ   =   0.2   cm , the vibration isolation performance of the structure with mass blocks added to the inner and outer angles is weaker than that without mass blocks. So, it can be seen that the vibration isolation performance of the structure is greatly affected by the side thickness.

4. Conclusions

This paper explores the negative Poisson’s ratio of re-entrant hexagonal cells, and the main conclusions are as follows:
(1)
The Poisson’s ratio of re-entrant hexagon is changed by changing the re-entrant angle and the ratio of vertical and hypotenuse angles of re-entrant hexagon. Its natural frequency is analyzed, and the energy band analysis of re-entrant hexagon with different Poisson’s ratio is carried out. The research shows that: the re-entrant hexagonal cell structure has a good vibration isolation effect in the vertical direction to the vibration of the unique frequency, and the vibration isolation bandwidth frequency of cell structure with different Poisson ratio is different.
(2)
By analyzing the different Poisson’s ratio of re-entrant hexagon natural frequency vibration isolation performance of the cell structure, based on re-entrant hexagonal cell structure of cellular base, and different laying methods are used. Through the study, the structure of the honeycomb base has a good vibration isolation performance at a specific frequency, and it has a better vibration isolation performance when use the different Poisson’s ratio cell to lay the base.
(3)
By adding mass blocks to the inner or surrounding corners angles of the basic re-entrant hexagonal cell, the vibration isolation performance of the honeycomb base frequencies can be changed. When the circular mass blocks of different sizes are added to the inner corner, the vibration isolation effect of the honeycomb base is much better in the middle and high frequencies. Meanwhile, when the mass blocks are added to the surrounding corners, the vibration isolation performance of the honeycomb base is better in the high frequencies.
(4)
When the side thickness of the cell structure is τ   =   0.2   cm , adding mass block to the cell structure has little effect on the vibration isolation performance. When the cell structure side thickness is τ   =   0.1   cm , the vibration isolation performance of the abnormity concave structure honeycomb base is superior to the ordinary inner re-entrant structure of honeycomb base, and the vibration isolation performance of the re-entrant structure honeycomb base with side thickness τ   =   0.1   cm is better than that of the re-entrant structure honeycomb base with side thickness τ   =   0.2   cm when the side thickness on the whole.
(5)
The honeycomb base composed of re-entrant hexagons has a lighter mass, and the lightweight nature can effectively reduce the mass of the ship base, which can effectively reduce the load of the ship and reduce transportation costs.
According to the research and calculation results, considering the quality and vibration isolation performance of honeycomb base comprehensively, the re-entrant hexagonal honeycomb base has good vibration isolation performance and lower quality, and the manufacturing difficulty is relatively low, so it is more suitable for practical engineering application. Therefore, the base of the negative Poisson’s ratio base can make military ships and cargo ships effectively reduce the large power equipment on the ship or motor vibration, and the base only depend on its structure and material selection and design to meet the different frequency isolation, no additional installation vibration isolator.

Author Contributions

Writing—original draft, S.Z.; Writing—review & editing, K.P., J.D. and W.Z. All authors have read and agreed to the published version of the manuscript.

Funding

The authors gratefully acknowledge the support of National Natural Science Foundation of China (NNSFC) through Grant Nos. 11772166, 12172186, 11832002, and 11672188, and The APC was funded by 11772166, the Funding Project for Academic Human Resources Development in Institutions of Higher Learning under the Jurisdiction of Beijing Municipality (PHRIHLB).

Data Availability Statements

The data that support the findings of this study are available from the corresponding author upon reasonable request.

Conflicts of Interest

The authors declare that there is no conflict of interest regarding the publication of this paper.

References

  1. Liu, Y. Sound transmission through triple-panel structures lined with poroelastic materials. J. Sound Vib. 2015, 339, 376–395. [Google Scholar] [CrossRef] [Green Version]
  2. Zhou, J.; Bhaskar, A.; Zhang, X. Sound transmission through double cylindrical shells lined with porous material under turbulent boundary layer excitation. J. Sound Vib. 2015, 357, 253–268. [Google Scholar] [CrossRef]
  3. Gohari, H.D.; Zarastvand, M.R.; Talebitooti, R. Acoustic performance prediction of a multilayered finite cylinder equipped with porous foam media. J. Vib. Control. 2020, 26, 107754631989002. [Google Scholar]
  4. Zarastvand, M.R.; Asadijafari, M.H.; Talebitooti, R. Improvement of the low-frequency sound insulation of the poroelastic aerospace constructions considering Pasternak elastic foundation. Aerosp. Sci. Technol. 2021, 112, 106620. [Google Scholar] [CrossRef]
  5. Yang, W.; Li, Z.M.; Shi, W.; Xie, B.H.; Yang, M.B. On Auxetic Materials. J. Mater. Sci. 2004, 39, 3269–3279. [Google Scholar] [CrossRef]
  6. Bertoldi, K.; Reis, P.M.; Willshaw, S.; Mullin, T. Negative Poisson’s Ratio Behavior Induced by an Elastic Instability. Adv. Mater. 2010, 22, 361–366. [Google Scholar] [CrossRef] [Green Version]
  7. Florijn, B.; Coulais, C.; van Hecke, M. Programmable Mechanical Metamaterials. Phys. Rev. Lett. 2014, 113, 175503. [Google Scholar] [CrossRef] [Green Version]
  8. Mitschke, H.; Schury, F.; Mecke, K.; Stingl, M. Geometry: The Leading Parameter for the Poisson’s Ratio of Bending- dominated Cellular Solids. Int. J. Solids Struct. 2016, 100–101, 1–10. [Google Scholar] [CrossRef]
  9. Lakes, R. Foam Structures with a Negative Poisson’s Ratio. Science 1987, 235, 1038–1040. [Google Scholar] [CrossRef]
  10. Gibson, L.J.; Ashby, M.F. Cellular Solids: Structure and Properties; Pergamon Press: London, UK, 1988. [Google Scholar]
  11. Zhang, X.; Yang, D. Mechanical Properties of Auxetic Cellular Material Consisting of Re-Entrant Hexagonal Honeycombs. Materials 2016, 9, 900. [Google Scholar] [CrossRef] [Green Version]
  12. Grima, J.N.; Gatt, R.; Ellul, B.; Chetcuti, E. Auxetic Behaviour in Non-crystalline Materials Having Star or Triangular Shaped Perforations. J. Non-Cryst. Solids 2010, 356, 1980–1987. [Google Scholar] [CrossRef]
  13. Strek, T.; Jopek, H. Effective Mechanical Properties of Concentric Cylindrical Composites with Auxetic Phase. Phys. Status Solidi 2012, 249, 1359–1365. [Google Scholar] [CrossRef]
  14. Grujicic, M.; Galgalikar, R.; Snipes, J.S.; Yavari, R.; Ramaswami, S. Multi-physics Modeling of the Fabrication and Dynamic Performance of All-metal Auxetic-hexagonal Sandwich- structures. Mater. Des. 2013, 5, 113–130. [Google Scholar] [CrossRef]
  15. Strek, T.; Jopek, H.; Maruszewski, B.T.; Nienartowicz, M. Computational Analysis of Sandwich-structured Composites with an Auxetic Phase. Phys. Status Solidi 2014, 251, 354–366. [Google Scholar] [CrossRef]
  16. Kadic, M.; Bückmann, T.; Schittny, R.; Wegener, M. Metamaterials Beyond Electromagnetism. Rep. Prog. Phys. Phys. Soc. 2013, 76, 126–501. [Google Scholar] [CrossRef]
  17. Alderson, A.; Alderson, K.L. Auxetic Materials. Proc. Inst. Mech. Eng. Part G J. Aerosp. Eng. 2007, 221, 565–575. [Google Scholar] [CrossRef]
  18. Evans, K.E.; Alderson, K.L. Auxetic Materials: The Positive Side of Being Negative. Eng. Sci. Educ. J. 2002, 9, 148–154. [Google Scholar] [CrossRef]
  19. Heo, H.; Ju, J.; Kim, D.M. Compliant Cellular Structures: Application to a Passive Morphing Airfoil. Compos. Struct. 2013, 106, 560–569. [Google Scholar] [CrossRef]
  20. Jacobs, S.; Coconnier, C.; Dimaio, D.; Scarpa, F.; Toso, M.; Martinez, J. Deployable Auxetic Shape Memory Alloy Cellular Antenna Demonstrator: Design, Manufacturing and Modal Testing. Smart Mater. Struct. 2012, 21, 75013. [Google Scholar] [CrossRef]
  21. Ding, K.; Wang, Y.S.; Wei, Y.S. Influence of thrust bearing pedestal form on vibration and radiated noise of submarine. J. Ship Mech. 2013, 17, 306–312. [Google Scholar]
  22. Hönig, A.; Stronge, W.J. In-plane Dynamic Crushing of Honeycomb, Part I: Crush Band Initiation and Wave Trapping. Int. J. Mech. Sci. 2002, 44, 1665–1696. [Google Scholar] [CrossRef]
  23. Hönig, A.; Stronge, W.J. In-plane Dynamic Crushing of Honeycomb, Part II: Application to Impact. Int. J. Mech. Sci. 2002, 44, 1697–1714. [Google Scholar] [CrossRef]
  24. Pinnington, R.J.; White, R.G. Power flow through machine isolators to resonant and non-resonant beams. J. Sound Vib. 1981, 75, 179–197. [Google Scholar] [CrossRef]
  25. Wang, X.L.; Stronge, W.J. Micropolar theory for two-dimensional stresses in elastic honeycomb. Proc. R. Soc. A 1999, 455, 2091–2116. [Google Scholar] [CrossRef]
  26. Sanami, M.; Ravirala, N.; Alderson, K.; Chetcuti, E. Auxetic materials for sports applications. Procedia Eng. 2014, 72, 453–458. [Google Scholar] [CrossRef] [Green Version]
  27. Banerjee, S.; Bhaskar, A. Free vibration of cellular structures using continuum modes. J. Sound Vib. 2005, 287, 77–100. [Google Scholar] [CrossRef] [Green Version]
  28. Scarpa, F.; Tomlinson, G. Theoretical characteristics of the vibration of sandwich plates with in-plane negative Poisson’s ratio values. J. Sound Vib. 2000, 230, 45–67. [Google Scholar] [CrossRef]
  29. Ingrole, A.; Hao, A.; Liang, R. Design and modeling of auxetic and hybrid honeycomb structures for in-plane property enhancement. Mater. Des. 2016, 117, 72–83. [Google Scholar] [CrossRef]
  30. Schultz, J.; Griese, D.; Shankar, P.; Summers, J.D.; Ju, J.; Thompson, L. Optimization of honeycomb cellular meso-structures for high speed impact energy absorption. In Proceedings of the ASME Design Engineering Technical Conference, Washington, DC, USA, 28–31 August 2011. [Google Scholar]
  31. Duc, N.D.; Seung-Eock, K.; Cong, P.H.; Anh, N.T.; Khoa, N.D. Dynamic response and vibration of composite double curved shallow shells with negative Poisson’s ratio in auxetic honeycombs core layer on elastic foundations subjected to blast and damping loads. Int. J. Mech. Sci. 2017, 133, 504–512. [Google Scholar] [CrossRef]
  32. Albertini, F.; Dirrenberger, J.; Molotnikov, A.; Sollogoub, C. Computational Investigation of the Effective Mechanical Behavior for 3D Pre-Buckled Auxetic Lattices. J. Appl. Mech. 2019, 86, 1–15. [Google Scholar] [CrossRef] [Green Version]
  33. Qin, H.; Yang, D. Vibration reduction design method of metamaterials with negative Poisson’s ratio. J. Mater. Sci. 2019, 54, 14038–14054. [Google Scholar] [CrossRef]
  34. Chang, S.Y.; Chen, C.D.; Yeh, J.Y.; Chen, L.W. Elastic Wave Propagation of Two-Dimensional Metamaterials Composed of Auxetic Star-Shaped Honeycomb Structures. Crystals 2019, 9, 121. [Google Scholar] [CrossRef] [Green Version]
  35. Jiang, H.; Zhang, M.; Liu, Y.; Pei, D.; Chen, M.; Wang, Y. Band Gaps and Vibration Isolation of a Three-Dimensional Metamaterial with a Star Structure. Materials 2020, 13, 3812. [Google Scholar] [CrossRef] [PubMed]
  36. Ye, M.; Gao, L.; Li, H. A design framework for gradually stiffer mechanical metamaterial induced by negative Poisson’s ratio property. Mater. Des. 2020, 192, 108751. [Google Scholar] [CrossRef]
  37. Chen, Y.L.; Wang, D.W.; Ma, L. Vibration and damping performance of carbon fiber-reinforced polymer 3D double-arrow-head auxetic metamaterials. J. Mater. Sci. 2021, 56, 1–18. [Google Scholar] [CrossRef]
  38. Zhang, X.W. Research on Design Methods of Auxetic Cellular Structures for Vibration Reduction and Defensive Structures of Ships; Shanghai Jiao Tong University: Shanghai, China, 2017. [Google Scholar]
Figure 1. Deformation diagram of positive and negative Poisson’s ratio structure under lateral hand tension is given, (a) positive Poisson’s ratio structure, (b) negative Poisson’s ratio structure.
Applsci 11 11167 g001
Figure 2. The re-entrant hexagonal structure with negative Poisson’s ratio is given, (a) a simple schematic diagram of the honeycomb base is shown, (b) re-entrant hexagonal honeycomb cell.
Applsci 11 11167 g002
Figure 3. Schematic diagram of re-entrant hexagonal honeycomb cell is given.
Applsci 11 11167 g003
Figure 4. Tenth order natural frequency band diagram of a single cell structure is given, (a) the single cell’s side thickness: τ   =   0.1   cm , its angle θ   =   15 ° , thus, its Poisson’s ratio is deduced: v   =   0 . 47 ; (b) the single cell’s side thickness: τ   =   0.1   cm , its angle θ   =   30 ° , thus, its Poisson’s ratio is deduced: v   =   1 . 11 .
Applsci 11 11167 g004
Figure 5. Tenth order natural frequency band diagram of a single cell structure is given, (a) the single cell’s side thickness: τ   =   0.2   cm , its angle θ   =   15 ° , thus, its Poisson’s ratio is deduced: v   =   0.47 ; (b) the single cell’s side thickness: τ   =   0.2   cm , its angle θ   =   30 ° , thus, its Poisson’s ratio is deduced: v   =   1.11 .
Applsci 11 11167 g005aApplsci 11 11167 g005b
Figure 6. (a) Traditional cellular structure of honeycomb base is given; (b) Tenth order natural frequency band diagram of traditional cellular structure of honeycomb base is given; (c) the diagram honeycomb base of traditional cellular structure; (d) the frequency response curve of the honeycomb base.
Applsci 11 11167 g006aApplsci 11 11167 g006b
Figure 7. The base diagram of re-entrant structure is given, (a) the diagram of honeycomb base, the Poisson’s ratio of the re-entrant hexagonal elements that make up the honeycomb base is v   =   0 . 47 ; (b) a fixed displacement 1 m upper plane of the base; (c) the side thickness of the re-entrant hexagonal elements that make up the honeycomb base is τ   =   0.1   cm ; (d) the side thickness of the re-entrant hexagonal elements that make up the honeycomb base is τ   =   0.2   cm .
Applsci 11 11167 g007aApplsci 11 11167 g007b
Figure 8. (a) the diagram of honeycomb base, the Poisson’s ratio of the re-entrant hexagonal elements that make up the honeycomb base is v   =   1.11 ; (b) a fixed displacement 1 m upper plane of the base; (c) the side thickness of the re-entrant hexagonal elements that make up the honeycomb base is τ   =   0.1   cm ; (d) the side thickness of the re-entrant hexagonal elements that make up the honeycomb base is τ   =   0.2   cm .
Applsci 11 11167 g008aApplsci 11 11167 g008b
Figure 9. (a) the diagram of honeycomb base made up by different Poisson’s ratio of the re-entrant hexagonal elements, the Poisson’s ratio of its above three layers is: v   =   0.47 , the following three layers is v   =   1.11 ; (b) a fixed displacement 1 m upper plane of the base; (c) the side thickness of the re-entrant hexagonal elements that make up the honeycomb base is τ   =   0.1   cm ; (d) the side thickness of the re-entrant hexagonal elements that make up the honeycomb base is τ   =   0.2   cm .
Applsci 11 11167 g009aApplsci 11 11167 g009b
Figure 10. Heteromorphic negative Poisson’s ratio cell structure: (a) The inner Angle plus radius is r mass block; (b) The inner and outer Angle plus radius is r mass block.
Applsci 11 11167 g010aApplsci 11 11167 g010b
Figure 11. The diagram of the cell structure and the analysis curve is given, (a) the heteromorphic negative Poisson’s ratio cell structure added circular mass blocks to the inner circle radius: 0.1272 cm; (b) tenth order natural frequency band diagram of a single cell structure, side thickness: τ   =   0.1 cm , Possion’s ratio: v   =   0 . 47 . (c) a fixed displacement 1 m upper plane of the base. (d) frequency response curve of the honeycomb base.
Applsci 11 11167 g011aApplsci 11 11167 g011b
Figure 12. The diagram of the cell structure and the analysis curve is given, (a) the heteromorphic negative Poisson’s ratio cell structure added circular mass blocks to the inner circle radius: 0.1272 cm, around the corner circle radius: 0.15 cm; (b) tenth order natural frequency band diagram of a single cell structure, side thickness: τ   =   0.1   cm , Poisson’s ratio: v   =   0 . 47 . (c) a fixed displacement 1 m upper plane of the base. (d) frequency response curve of the honeycomb base.
Applsci 11 11167 g012aApplsci 11 11167 g012b
Figure 13. The diagram of the cell structure and the analysis curve is given, (a) the heteromorphic negative Poisson’s ratio cell structure added circular mass blocks to the inner circle radius: 1.25 cm; (b) tenth order natural frequency band diagram of a single cell structure, side thickness: τ   =   0.1   cm , Possion’s ratio: v   =   0 . 47 . (c) a fixed displacement 1 m upper plane of the base. (d) frequency response curve of the honeycomb base.
Applsci 11 11167 g013aApplsci 11 11167 g013b
Figure 14. The diagram of the cell structure and the analysis curve is given, (a) the heteromorphic negative Poisson’s ratio cell structure added circular mass blocks to the inner circle radius: 1.25 cm, around the corner circle radius: 1.25 cm; (b) tenth order natural frequency band diagram of a single cell structure, side thickness: τ   =   0.1   cm , Poisson’s ratio: v   =   0 . 47 . (c) a fixed displacement 1 m upper plane of the base. (d) frequency response curve of the honeycomb base.
Applsci 11 11167 g014aApplsci 11 11167 g014b
Figure 15. The diagram of the cell structure and the analysis curve is given, (a) the heteromorphic negative Poisson’s ratio cell structure added circular mass blocks to the inner circle radius: 2 cm; (b) tenth order natural frequency band diagram of a single cell structure, side thickness: τ   =   0.1   cm , Possion’s ratio: v   =   0 . 47 . (c) a fixed displacement 1 m upper plane of the base. (d) frequency response curve of the honeycomb base.
Applsci 11 11167 g015aApplsci 11 11167 g015b
Figure 16. The diagram of the cell structure and the analysis curve is given, (a) the heteromorphic negative Poisson’s ratio cell structure added circular mass blocks to the inner circle radius: 2 cm, around the corner circle radius: 2 cm; (b) tenth order natural frequency band diagram of a single cell structure, side thickness: τ   =   0.1   cm , Possion’s ratio: v   =   0 . 47 . (c) a fixed displacement 1 m upper plane of the base. (d) frequency response curve of the honeycomb base.
Applsci 11 11167 g016aApplsci 11 11167 g016b
Figure 17. The diagram of the cell structure and the analysis curve is given, (a) the heteromorphic negative Poisson’s ratio cell structure added circular mass blocks to the inner circle radius: 0.1528 cm; (b) tenth order natural frequency band diagram of a single cell structure, side thickness: τ   =   0.1   cm , Possion’s ratio: v   =   1 . 11 . (c) a fixed displacement 1 m upper plane of the base. (d) frequency response curve of the honeycomb base.
Applsci 11 11167 g017aApplsci 11 11167 g017b
Figure 18. The diagram of the cell structure and the analysis curve is given, (a) the heteromorphic negative Poisson’s ratio cell structure added circular mass blocks to the inner circle radius: 0.1528 cm, around the corner circle radius: 0.1528 cm; (b) tenth order natural frequency band diagram of a single cell structure, side thickness: τ   =   0.1   cm , Possion’s ratio: v   =   1 . 11 . (c) a fixed displacement 1 m upper plane of the base. (d) frequency response curve of the honeycomb base.
Applsci 11 11167 g018aApplsci 11 11167 g018b
Figure 19. The diagram of the cell structure and the analysis curve is given, (a) the heteromorphic negative Poisson’s ratio cell structure added circular mass blocks to the inner circle radius: 1 cm; (b) tenth order natural frequency band diagram of a single cell structure, side thickness: τ   =   0.1   cm , Possion’s ratio: v   =   1 . 11 . (c) a fixed displacement 1 m upper plane of the base. (d) frequency response curve of the honeycomb base.
Applsci 11 11167 g019aApplsci 11 11167 g019b
Figure 20. The diagram of the cell structure and the analysis curve is given, (a) the heteromorphic negative Poisson’s ratio cell structure added circular mass blocks to the inner circle radius: 1 cm, around the corner circle radius: 1 cm; (b) tenth order natural frequency band diagram of a single cell structure, side thickness: τ   =   0.1   cm , Possion’s ratio: v   =   1 . 11 . (c) a fixed displacement 1 m upper plane of the base. (d) frequency response curve of the honeycomb base.
Applsci 11 11167 g020aApplsci 11 11167 g020b
Figure 21. The diagram of the cell structure and the analysis curve is given, (a) the heteromorphic negative Poisson’s ratio cell structure added circular mass blocks to the inner circle radius: 1.75 cm; (b) tenth order natural frequency band diagram of a single cell structure, side thickness: τ   =   0.1   cm , Poisson’s ratio: v   =   1 . 11 . (c) a fixed displacement 1 m upper plane of the base. (d) frequency response curve of the honeycomb base.
Applsci 11 11167 g021aApplsci 11 11167 g021b
Figure 22. The diagram of the cell structure and the analysis curve is given, (a) the heteromorphic negative Poisson’s ratio cell structure added circular mass blocks to the inner circle radius: 1.75 cm, around the corner circle radius: 1.75 cm; (b) tenth order natural frequency band diagram of a single cell structure. (c) a fixed displacement 1 m upper plane of the base. (d) frequency response curve of the honeycomb base.
Applsci 11 11167 g022aApplsci 11 11167 g022b
Figure 23. The diagram of the cell structure and the analysis curve is given, (a) the heteromorphic negative Poisson’s ratio cell structure added circular mass blocks to the inner circle radius: 0.2543 cm; (b) tenth order natural frequency band diagram of a single cell structure, side thickness: τ   =   0.2 cm , Poisson’s ratio: v   =   0 . 47 . (c) a fixed displacement 1 m upper plane of the base. (d) frequency response curve of the honeycomb base.
Applsci 11 11167 g023aApplsci 11 11167 g023b
Figure 24. The diagram of the cell structure and the analysis curve is given, (a) the heteromorphic negative Poisson’s ratio cell structure added circular mass blocks to the inner circle radius: 0.2543 cm, around the corner circle radius: 0.5 cm; (b) tenth order natural frequency band diagram of a single cell structure, side thickness: τ   =   0.2   cm , Poisson’s ratio: v   =   0 . 47 . (c) a fixed displacement 1 m upper plane of the base. (d) frequency response curve of the honeycomb base.
Applsci 11 11167 g024aApplsci 11 11167 g024b
Figure 25. The diagram of the cell structure and the analysis curve is given, (a) the heteromorphic negative Poisson’s ratio cell structure added circular mass blocks to the inner circle radius: 1.25 cm; (b) tenth order natural frequency band diagram of a single cell structure, side thickness: τ   =   0.2   cm , Poisson’s ratio: v   =   0 . 47 . (c) a fixed displacement 1 m upper plane of the base. (d) frequency response curve of the honeycomb base.
Applsci 11 11167 g025aApplsci 11 11167 g025b
Figure 26. The diagram of the cell structure and the analysis curve is given, (a) the heteromorphic negative Poisson’s ratio cell structure added circular mass blocks to the inner circle radius: 1.25 cm; around the corner circle radius: 1.25 cm; (b) tenth order natural frequency band diagram of a single cell structure, side thickness: τ   =   0.2   cm , Poisson’s ratio: v   =   0 . 47 . (c) a fixed displacement 1 m upper plane of the base. (d) frequency response curve of the honeycomb base.
Applsci 11 11167 g026
Figure 27. The diagram of the cell structure and the analysis curve is given, (a) the heteromorphic negative Poisson’s ratio cell structure added circular mass blocks to the inner circle radius: 2 cm; (b) tenth order natural frequency band diagram of a single cell structure, side thickness: τ   =   0.2   cm , Poisson’s ratio: v   =   0 . 47 . (c) a fixed displacement 1 m upper plane of the base. (d) frequency response curve of the honeycomb base.
Applsci 11 11167 g027
Figure 28. The diagram of the cell structure and the analysis curve is given, (a) the heteromorphic negative Poisson’s ratio cell structure added circular mass blocks to the inner circle radius: 2 cm, around the corner circle radius: 2 cm; (b) tenth order natural frequency band diagram of a single cell structure, side thickness: τ   =   0.2   cm , Poisson’s ratio: v   =   0 . 47 . (c) a fixed displacement 1 m upper plane of the base. (d) frequency response curve of the honeycomb base.
Applsci 11 11167 g028aApplsci 11 11167 g028b
Figure 29. The diagram of the cell structure and the analysis curve is given, (a) the heteromorphic negative Poisson’s ratio cell structure added circular mass blocks to the inner circle radius: 0.3055 cm; (b) tenth order natural frequency band diagram of a single cell structure, side thickness: τ   =   0.2   cm , Poisson’s ratio: v   =   1 . 11 . (c) a fixed displacement 1 m upper plane of the base. (d) frequency response curve of the honeycomb base.
Applsci 11 11167 g029aApplsci 11 11167 g029b
Figure 30. The diagram of the cell structure and the analysis curve is given, (a) the heteromorphic negative Poisson’s ratio cell structure added circular mass blocks to the inner circle radius: 0.3055 cm, around the corner circle radius: 0.4 cm; (b) tenth order natural frequency band diagram of a single cell structure, side thickness: τ   =   0.2   cm , Poisson’s ratio: v   =   1 . 11 . (c) a fixed displacement 1 m upper plane of the base. (d) frequency response curve of the honeycomb base.
Applsci 11 11167 g030
Figure 31. The diagram of the cell structure and the analysis curve is given, (a) the heteromorphic negative Poisson’s ratio cell structure added circular mass blocks to the inner circle radius: 0.75 cm; (b) tenth order natural frequency band diagram of a single cell structure, side thickness: τ   =   0.2   cm , Poisson’s ratio: v   =   1 . 11 . (c) a fixed displacement 1 m upper plane of the base. (d) frequency response curve of the honeycomb base.
Applsci 11 11167 g031aApplsci 11 11167 g031b
Figure 32. The diagram of the cell structure and the analysis curve is given, (a) the heteromorphic negative Poisson’s ratio cell structure added circular mass blocks to the inner circle radius: 0.75 cm, around the corner circle radius: 0.75 cm; (b) tenth order natural frequency band diagram of a single cell structure, side thickness: τ   =   0.2   cm , Poisson’s ratio: v   =   1 . 11 . (c) a fixed displacement 1 m upper plane of the base. (d) frequency response curve of the honeycomb base.
Applsci 11 11167 g032aApplsci 11 11167 g032b
Figure 33. The diagram of the cell structure and the analysis curve is given, (a) the heteromorphic negative Poisson’s ratio cell structure added circular mass blocks to the inner circle radius: 1.5 cm; (b) tenth order natural frequency band diagram of a single cell structure, side thickness: τ   =   0.2   cm , Poisson’s ratio: v   =   1 . 11 . (c) a fixed displacement 1 m upper plane of the base. (d) frequency response curve of the honeycomb base.
Applsci 11 11167 g033aApplsci 11 11167 g033b
Figure 34. The diagram of the cell structure and the analysis curve is given, (a) the heteromorphic negative Poisson’s ratio cell structure added circular mass blocks to the inner circle radius: 1.5 cm; around the corner circle radius: 1.5 cm; (b) tenth order natural frequency band diagram of a single cell structure, side thickness: τ   =   0.2   cm , Poisson’s ratio: v   =   1 . 11 . (c) a fixed displacement 1 m upper plane of the base. (d) frequency response curve of the honeycomb base.
Applsci 11 11167 g034
Publisher’s Note: MDPI stays neutral with regard to jurisdictional claims in published maps and institutional affiliations.

