Abstract
Knowing the droplet-deformation conditions, the droplet-breakup conditions, and the drag force in the interaction between two droplets with a high Reynolds number is of importance for tracking droplet movement in the annular flow field of a gas well. The interactions between two droplets with a high Reynolds number in a tandem arrangement fixed in flowing gas was investigated. The volume of fluid (VOF) method was used to model the droplets’ surface structure. Two different body forces were exerted on both droplets to hold them suspended at a fixed location, which eliminated the effect of droplet acceleration or deceleration on the drag and decreased the amount of computation required. The exerted body forces were calculated using the Newton iteration procedure. The interactions between the two droplets were analyzed by comparison with the simulation results of a single isolated droplet. The effect of the separation distance on the drag force was investigated by changing the separation spacing. The simulation results showed that for droplets with a small separating space between them, the dynamics of the downstream droplet were influenced significantly by the upstream droplet. The drag coefficient of the downstream droplet decreased considerably to a small, even negative, value, especially for droplets with higher Weber numbers and smaller initial separating spaces between them, while the drag force of the upstream droplet was influenced only slightly. In addition, a formula for predicting the final drag coefficient of the downstream droplet was devised.
1. Introduction
Gas-well liquid loading is one of the most serious problems encountered in gas production engineering, which can reduce the gas production rate and eventually kill the gas well due to low pressure or energy. It occurs as a result of liquid accumulating at the bottomhole. The controlling factor to prevent liquid accumulating in a wellbore is the gas velocity in the tubing. It is believed that there is a critical gas velocity in gas wells, below which liquid loading occurs and a static liquid column develops. To keep a well producing without a liquid-loading problem, the velocity of the gas stream must be greater than the critical gas velocity.
The commonly used model for predicting the critical gas velocity is the entrained-droplet model proposed by Turner et al. (1969) [1]. According to the model assumptions, a droplet will not fall downward and liquid loading will not occur if the gas velocity is great enough to keep the droplet suspended or to carry it upward. Turner’s entrained-droplet model was derived from the force balance of suspending a maximally sized droplet in a gas stream, by assuming that the liquid droplet would be spherical and using a critical Weber number value of 30 to estimate the maximum droplet size.
For security considerations, they increased the critical gas rate by 20% to match the value measured in gas wells. Coleman et al. (1991) [2] found that the predicted critical gas rate without the increase could better match that of gas wells with a low pressure and a low liquid rate. Later, Nosseir et al. (1997) [3], Li et al. (2001) [4], Zhou et al. (2010) [5], and Wang et al. (2015) [6] considered the effect of the flow regime, droplet deformation, and droplet amount in the gas stream on the critical gas velocity, and presented various entrained-droplet models. The single-droplet models were proposed based on an isolated droplet, for which the influence of droplet interaction was not considered. For the gas wells with a higher liquid production rate, the number of droplets increases and the distance between the droplets decreases in the annular flow field of the gas wellbore. At such flow conditions, the accuracy of these entrained-droplet models based on single, isolated droplets decreases. Thus, it is necessary to accurately understand the interaction between droplets.
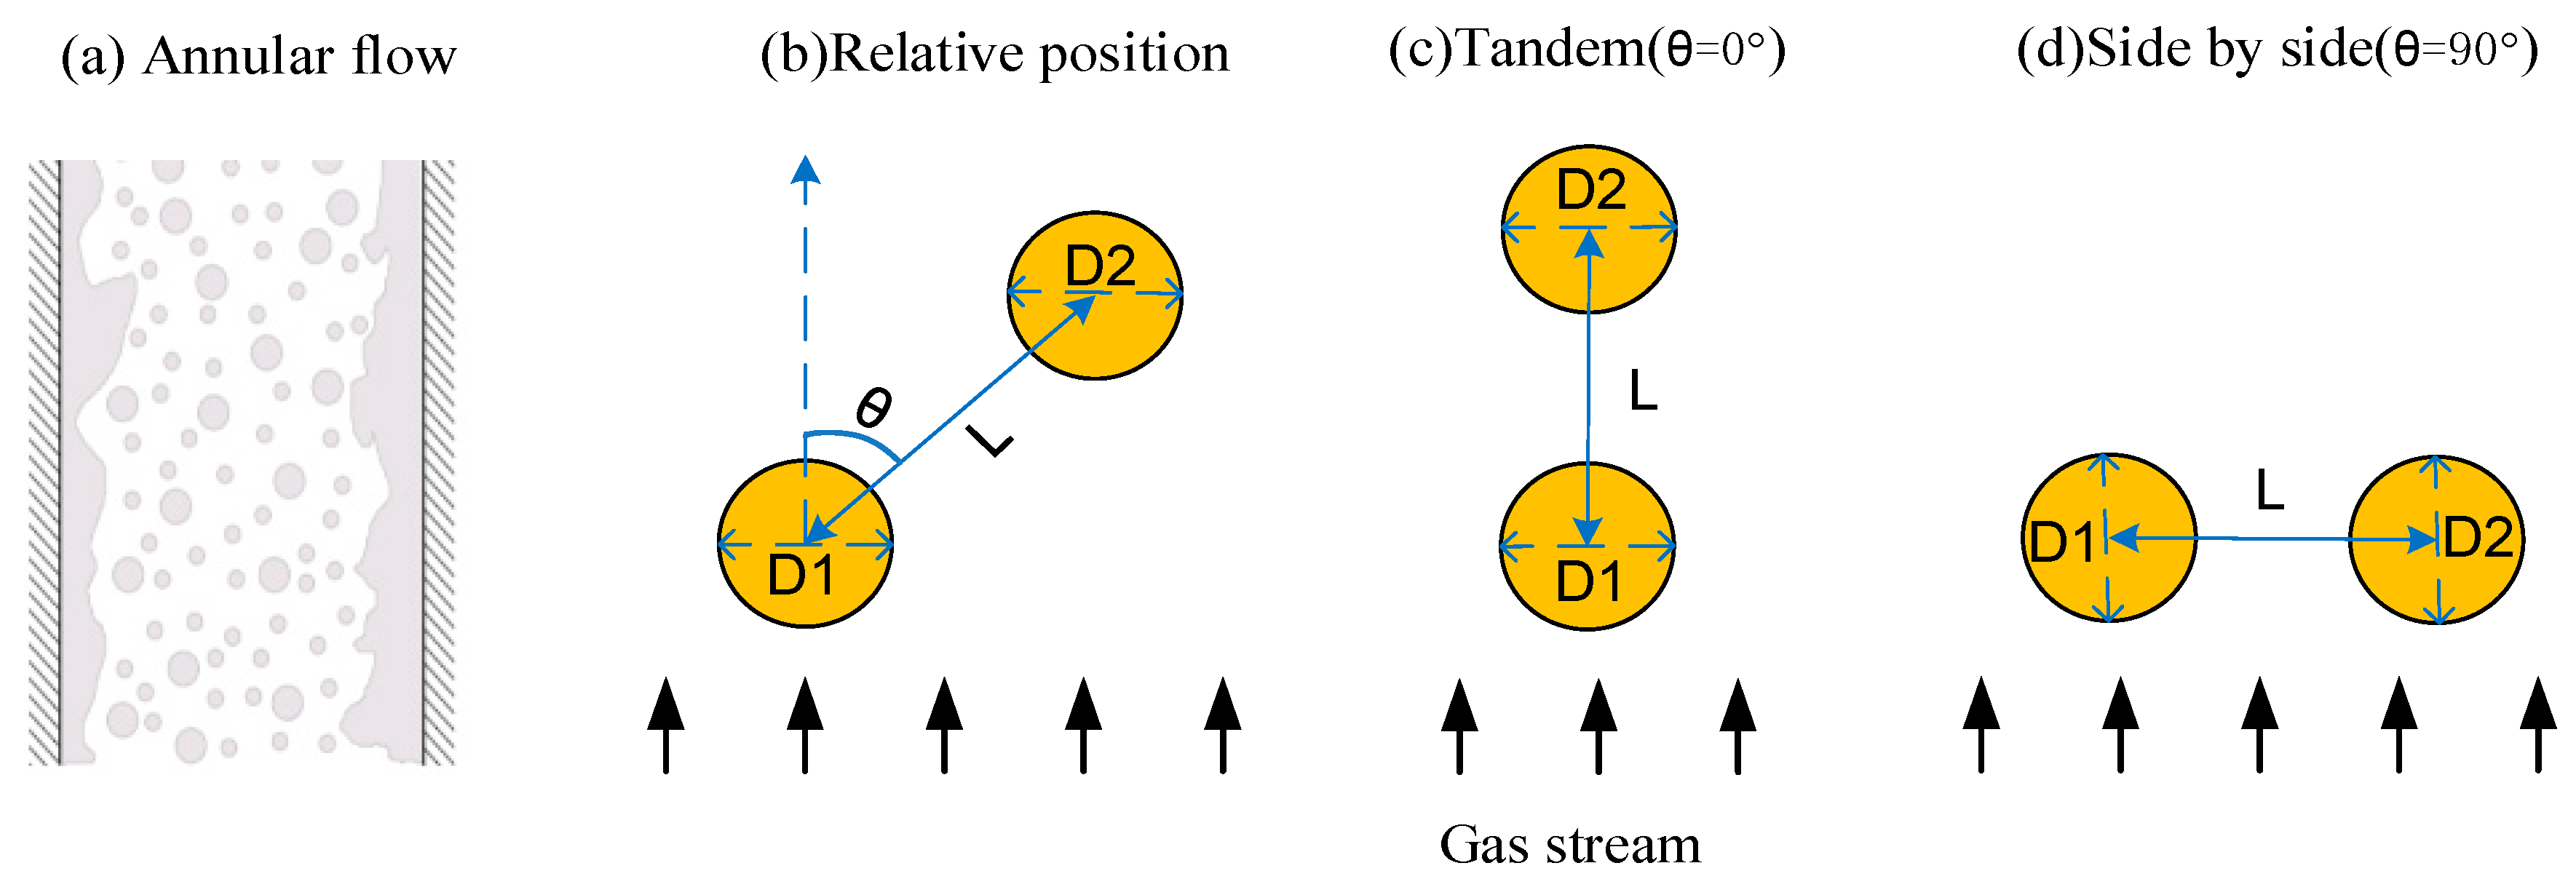
There exist numerous droplets in annular flow with different diameters and relative positions, as shown in Figure 1a. The relative positions of the droplets can be defined using separating space L and angle θ, as shown in Figure 1b, where θ is the angle between the gas stream and the line connecting the centers of two droplets. For tandem arrangements, θ = 90°, as shown in Figure 1c. For side-by-side arrangements, θ = 0°, as shown in Figure 1d.
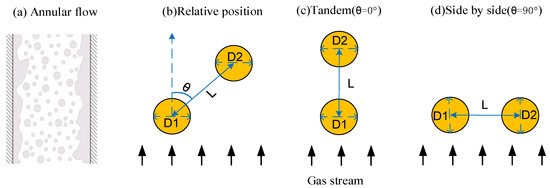
Figure 1.
Droplets in annular flow and their relative positions.
A review of the literature finds that the interaction between two rigid particles has acquired enough investigation, especially in the lower Reynolds number ranges (Kim et al., 1993 [7]; Tsuji et al., 2003 [8]; Zhu et al., 2003 [9]; Prahl et al., 2007 [10]; Yoon and Yang, 2007 [11]; Prahl et al., 2009 [12]; and Jadoon et al. 2010 [13]). Because of the internal circulation and transient effects caused by droplet deformation or breakup, the interaction between deformable droplets is much more complex in comparison with rigid particles (Kékesi et al., 2016 [14]; Kékesi et al., 2019 [15]; Wang et al., 2021 [16]).
For tandem arrangements, Raju and Sirignano (1990) [17] and Chiang and Sirignano (1993) [18] investigated the interaction between two vaporizing liquid-fuel droplets subject to uniform flows. Numerical simulations were carried out for the Reynolds numbers of Re = 50~200.
The previous studies of the interactions between two droplets in tandem were limited to Reynolds numbers less than 200 [17,18]. However, in a natural gas well with a high pressure, the Reynolds number of a droplet would increase to several thousand, but its dynamics are not known and have not been investigated.
Based on our previous study, the steady interaction between two droplets in tandem fixed in the gas flow of a gas well was studied by the volume of fluid method and direct numerical simulation. The effect of the initial spacing and Weber number on the drag coefficient and the deformation were investigated by comparison with the results of the single isolated droplet. Furthermore, a new formula for predicting the drag coefficient under droplet interaction was proposed.
2. Method
2.1. Governing Equations
For the conservation of mass and momentum, the governing equations for incompressible, viscous, and immiscible two-phase flows are described as follows [19,20,21]:
where the subscripts L and G represent liquid and gas phase, respectively. U is the velocity vector, in meters per second; p is the pressure, in pascals; t is the time, in seconds; ∇ is the gradient operator; ∇ is the divergence operator; fSur is the interface force caused by surface tension, in pascals per metre; ρ is the density, in kilograms per meter cubed; μ is the dynamic viscosity, in millipascal-seconds; FB is the body force, in pascals per meter; g is the acceleration of gravity, in meters per second squared.
The volume function of fluid (VOF) was used to simulate the structure of the gas–liquid interface in this paper. The volume fraction α marked the phases: αL = 0 indicated that no liquid existed in the cells; 0 < αL < 1 indicated that the cells were at the gas–liquid interface; αL = 1 indicated that no gas existed in the cells [22].
The mixture of physical properties in the girds were obtained by volume fraction weighted average:
The surface tension at the gas–liquid surface generated an additional pressure-gradient force, which was evaluated by the CSF model [23]:
The mean curvature of the free surface was determined by following equation:
2.2. Drag Force
The drag force exerted on the droplets was calculated by integrating over the droplet volume. In this study, the gas flowed from bottom to top (in the y direction) and the flow field around the droplet was symmetrical, so the direction of drag was set to be perpendicular. The y-direction drag is expressed by following equation [18]:
where Ω is the control volume; Γ is the surface of Ω; and nx, ny, and nz are the unit vectors normal to the surface. The symbols u, v, and w represent the velocity components in x, y, and z direction, respectively.
The equation was integrated on the surface of the droplet. The total drag coefficients for the front droplet and back droplets were computed from the body force as follows:
where FD is the total drag force. CD is the drag coefficient. The subscripts 1 and 2 represent the upstream droplet and downstream droplet and t represents computation time. Afront represents the front area based on the initial droplet diameter D.
2.3. Body Force
Two different body forces were exerted on both droplets to keep them from becoming fixed, in order to decrease the amount of calculation required. The body forces were calculated by Newton’s second law:
where mdrop is the weight of the droplet, adrop,t is the acceleration speed at the current time, vdrop,t and vdrop,t−Δt are the droplet centroid velocities at the present time and the previous computation time t − Δt, respectively.
Because the droplet centroid velocities were equal to zero at every step, vdrop,t−Δt is zero in Equation (10), and Equation (10) can be simplified as:
where ydrop,0 is the initial position of the droplet in the y direction and ydrop,t is the current centroid center of the droplet in the y direction at the current time.
FD was unknown, so ydrop,t was an implicit function of body force FB,t:
The body forces were calculated by the Newton iteration method as follows:
where ydrop,t,old is the previous solution for the droplet position under the corresponding body force FB,t,old; FB,t,new is the latest body force for the next iteration; and grad(ydrop,t) is the gradient of ydrop,t with the body force FB,t,old in the previous iteration.
Subsequently, the drag at the current time could be calculated from Equation (14):
Furthermore, the corresponding drag coefficient CD,t was calculated as follows:
A computer program was developed to solve these equations, based on our previous work.
2.4. Geometry Setup and Mesh
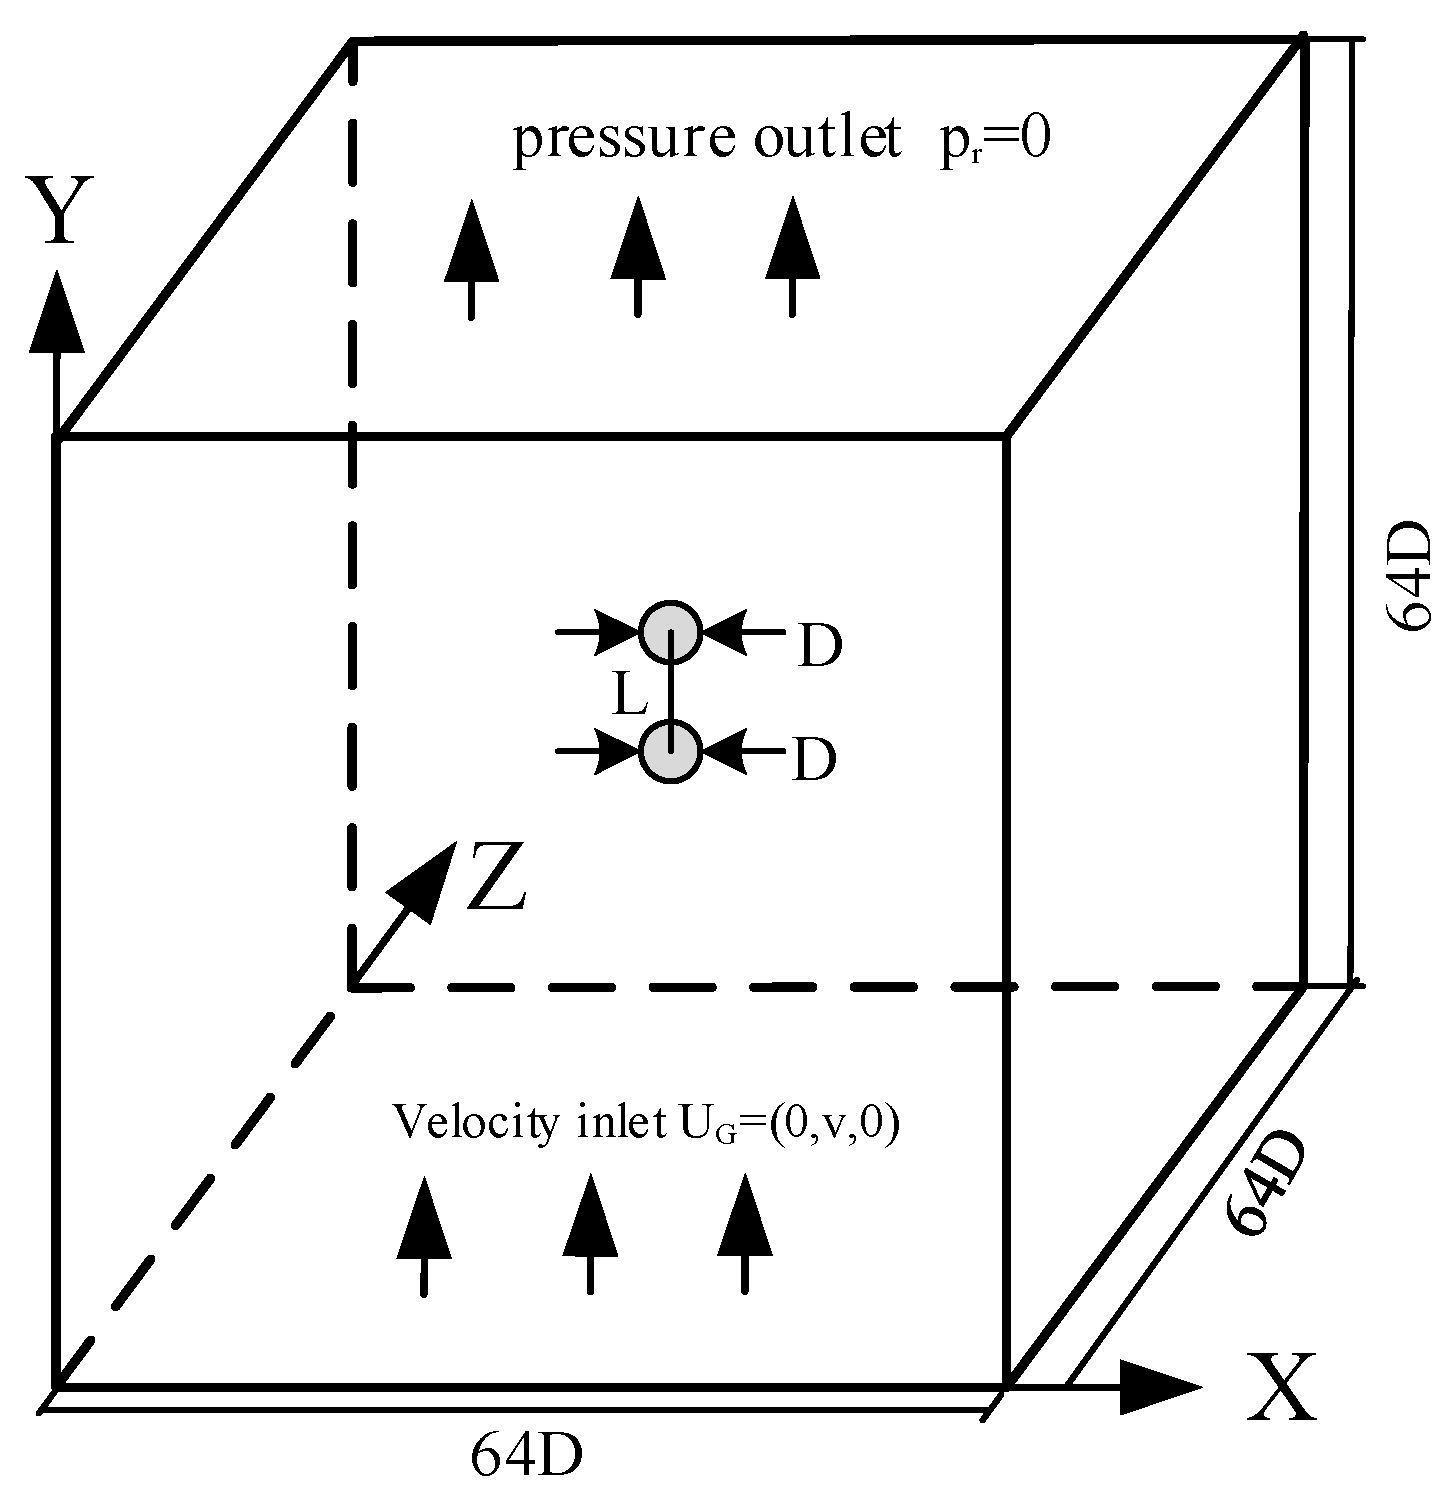
Two droplets were placed in a continuous uniform velocity field, and the computational domain was a cube with a side length of 64D, where D is the initial diameter of the droplet, as shown in Figure 2. The two droplets with the same initial diameter were located in the center of the computational domain with the separating space L between them. The two droplets were held at a fixed location by imposing different body forces on the droplets. At the initial time of calculation, the two droplets were spherical in shape, with the same diameter, D. The inlet was the velocity boundary, and the outlet was the pressure boundary.
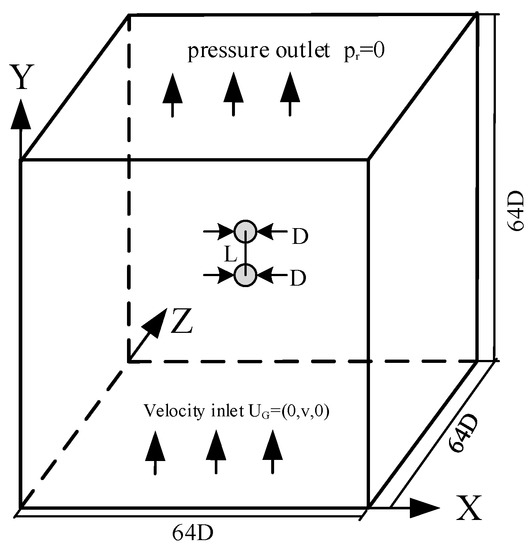
Figure 2.
Schematic diagram of the relative position of two droplets in tandem.
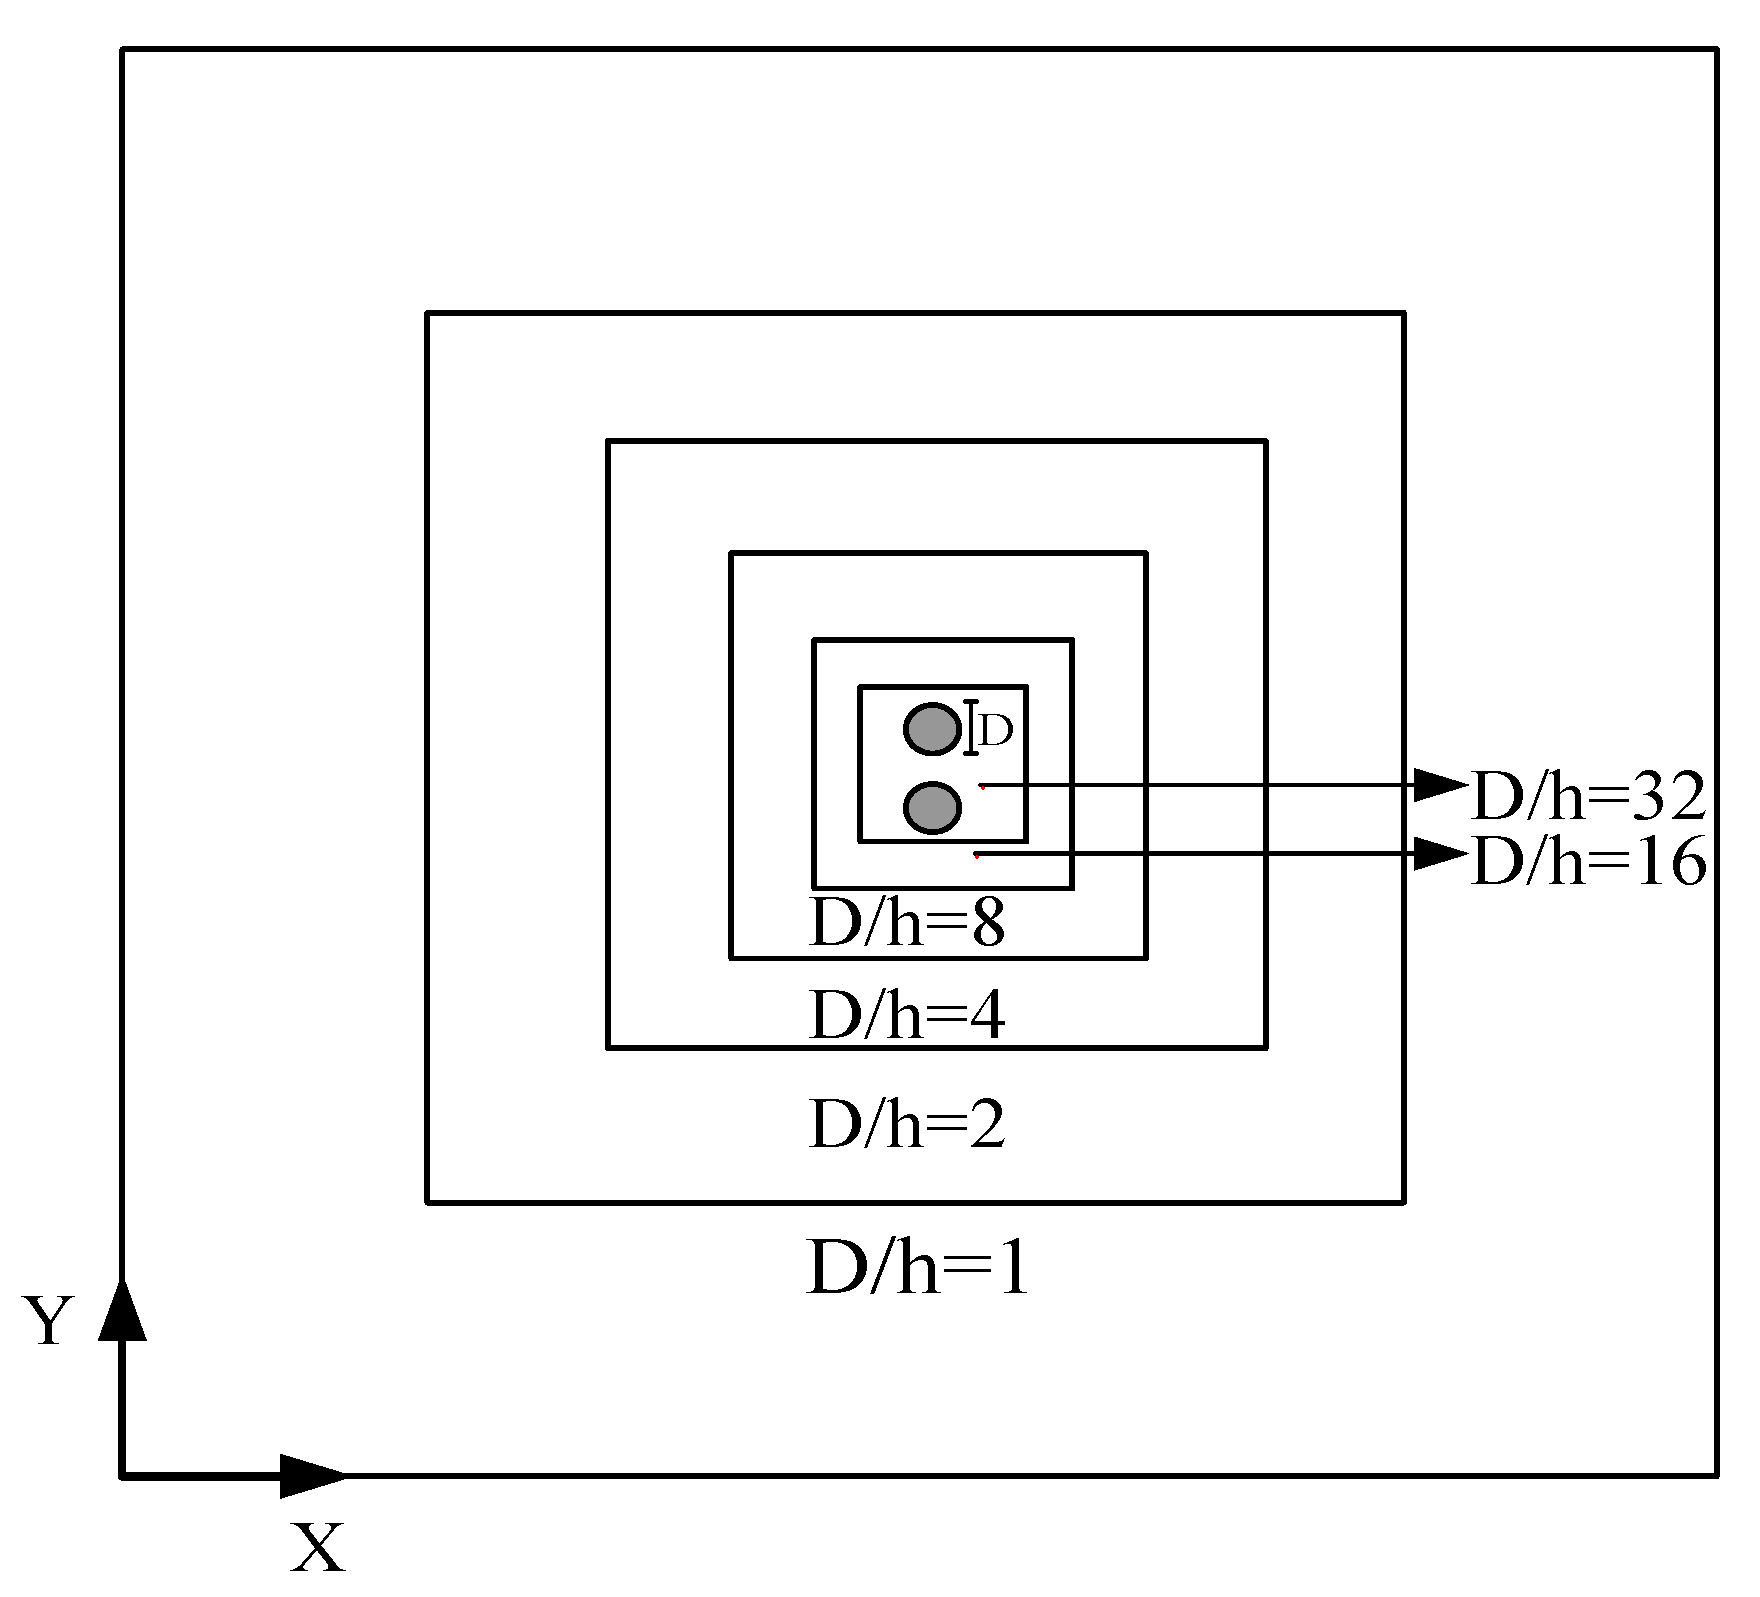
Based on our previous study [16] and the simulations conducted by Kékesi et al. [14,15] and Jiao et al. [10], a scheme of six levels was used to locally refine the computation region—the grid size of the inner computation region was halved when a new level was added. The maximum length of the grid was D and the minimum grid length was 1/32D, as shown in Figure 3. Four kinds of droplet separating space were simulated at this time: L/D = 1.5, 2, 3, and 4.

Figure 3.
Mesh refinement scheme.
3. Results and Discussion
3.1. Simulation Validation
In our previous study [16] we developed a simulator for a single isolated droplet. The simulation validation showed that the simulator had a good level of accuracy in predicting the droplet hydrodynamics, and the average errors of the drag coefficient and aspect ratio were only 9.98% and 6.67%, respectively. The present simulator was developed based on the previous simulator and implemented a similar numerical solution procedure. Thus, it was safe to conclude that the new simulator would perform well in modeling the interaction between two droplets.
3.2. Dynamics of a Single Isolated Droplet in Gas Flow Field of Gas Well
3.2.1. Physical Parameters
Assuming that a gas well had a flowing pressure of 4 MPa and a temperature of 353 K, its physical properties were calculated and set as follows. The gas–liquid interfacial tension was 0.05 N/m; the viscosity of the liquid and gas were 3.6 × 10⁻⁴ and 1.24 × 10⁻⁵ Pa.s, respectively; the liquid density was 972 kg/m3; and the gas density was 27.1 kg/m3. The droplet diameter was 4 mm; the gas velocities were 0.68, 1.36, 1.78, and 2.36 m/s, respectively; the corresponding Weber numbers were 1, 4, 6.8, and 12.1, respectively; and the corresponding Reynolds numbers were 594, 1171, 1556, and 2063, respectively.
3.2.2. Single Droplet Simulation Results
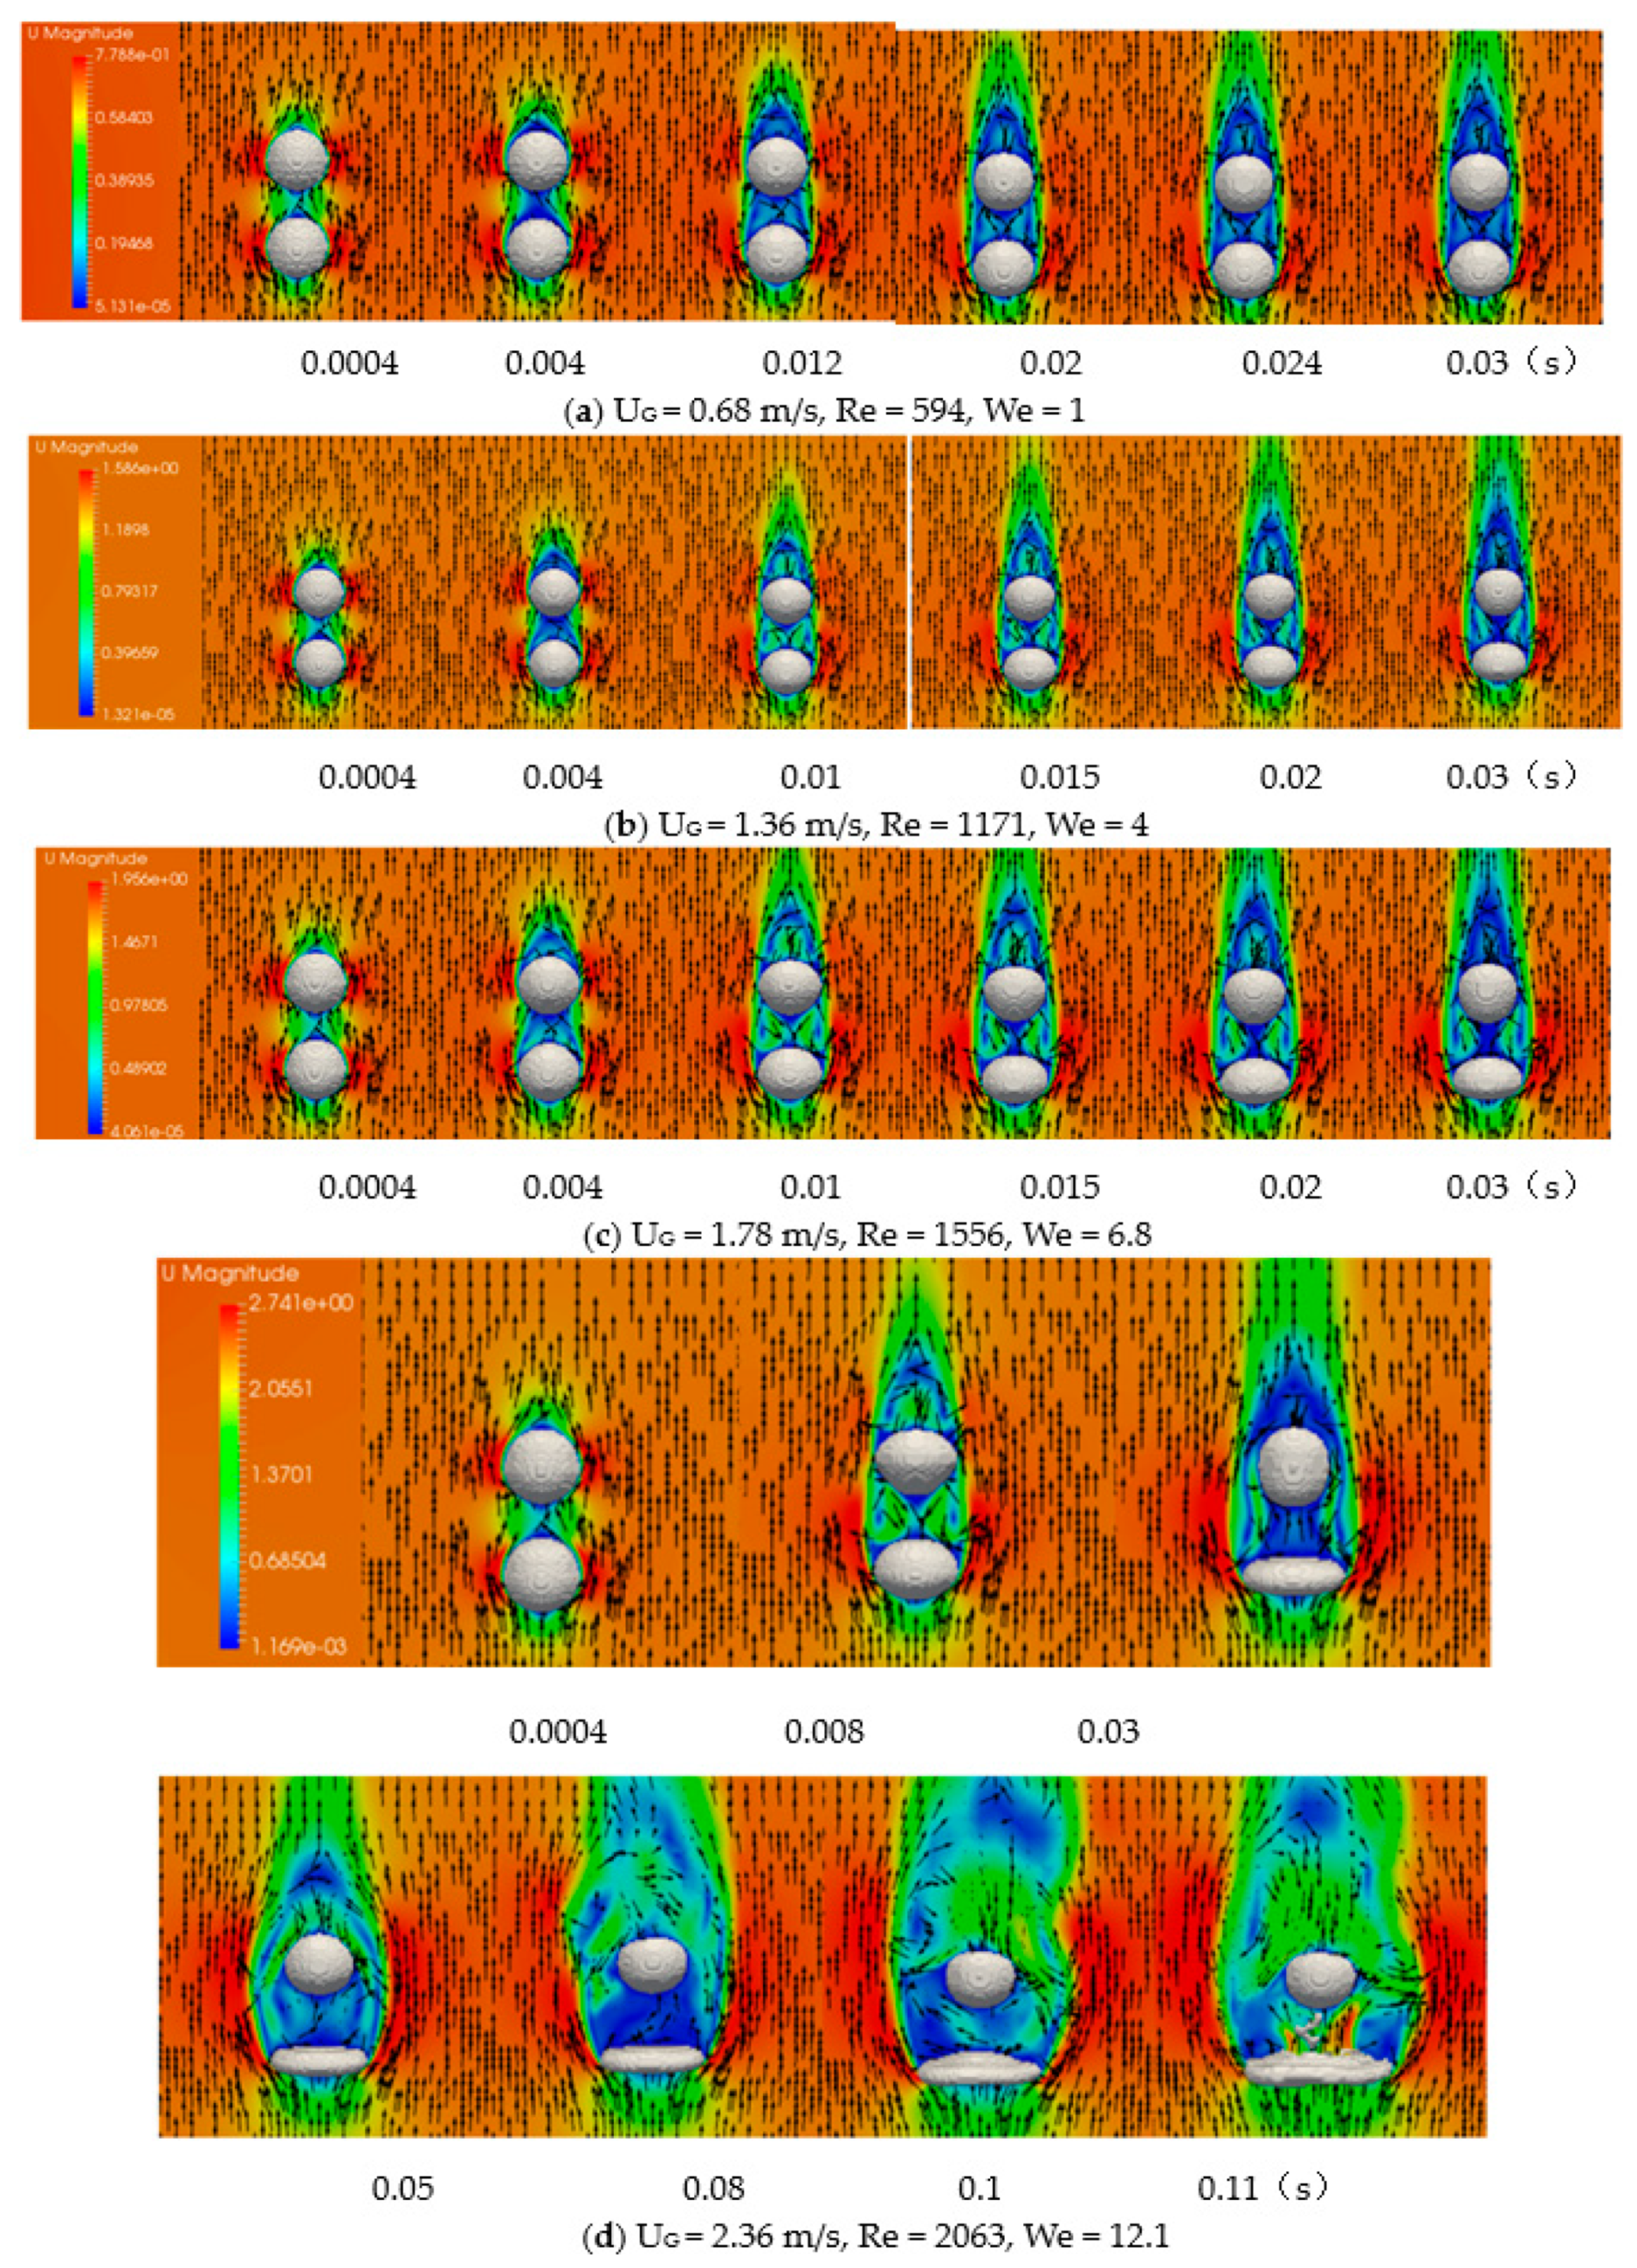
Figure 4 shows the droplet deformation process under different gas velocities. The other parameters remained unchanged during the simulation process and the Weber number of the droplet increased as the gas velocity was gradually increased.
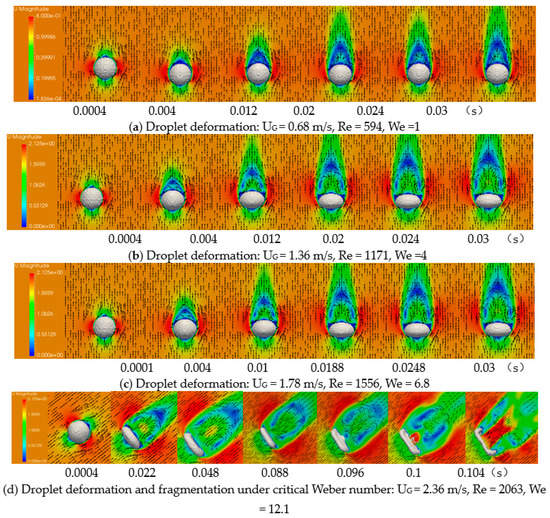
Figure 4.
The shape characteristics of a single droplet under different Weber numbers.
In Figure 4a, for the droplet with a Weber number of 1, a slight deformation can be observed. Furthermore, from Figure 4a–c, it can be seen that as the Weber number increased, the deformation degree and ellipsoid degree of the droplet increased, and the droplet gradually deformed into a flat body.
When the Weber number increased to 12.1, the flat body became a thin pancake, before gradually developing into a hollow-bag body and, finally, breaking up, as shown in Figure 4d. Thus, a critical Weber number of 12 for droplet breakup could be proposed.
3.3. Interactions between Two Droplets in Tandem
3.3.1. For a Separating Space of 1.5D
Figure 5 shows the simulation results for the two droplets in tandem with different Weber numbers and a separating spacing of 1.5D. It can be seen from Figure 5 that the deformation of the upstream droplet was similar to that of the single isolated droplet, but the deformation of the downstream droplet was obviously different from that of the single isolated droplet. Comparing Figure 5a–c, it can be found that the deformation degree of the upstream droplet increased with the Weber number. However, the downstream droplet deformed to a much lesser extent compared with the upstream droplet. The downstream droplet was gradually deform into a gyroscopic downward as the Weber number increased under the suction force of the low-pressure region behind the upstream droplet.
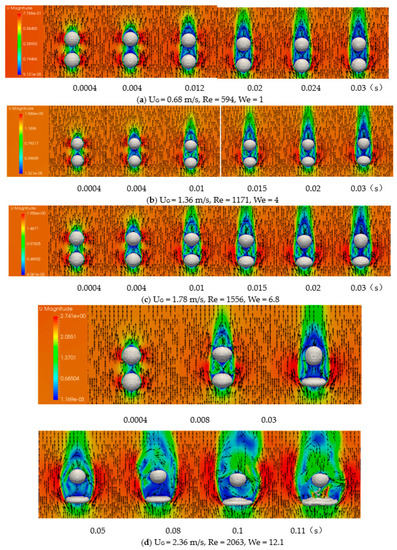
Figure 5.
Deformation and breakup of two droplets in tandem with different Weber numbers and a separating space between them of 1.5D.
Comparing Figure 4d with Figure 5d, we would conclude that the critical Weber number for the breakup of the upstream droplet is 12, which is consistent with that of the single isolated droplet. However, it would be concluded from Figure 5d that the downstream droplet could deform further and break up when the breakup of the upstream droplet had finished and the flowing gas could blow on it.
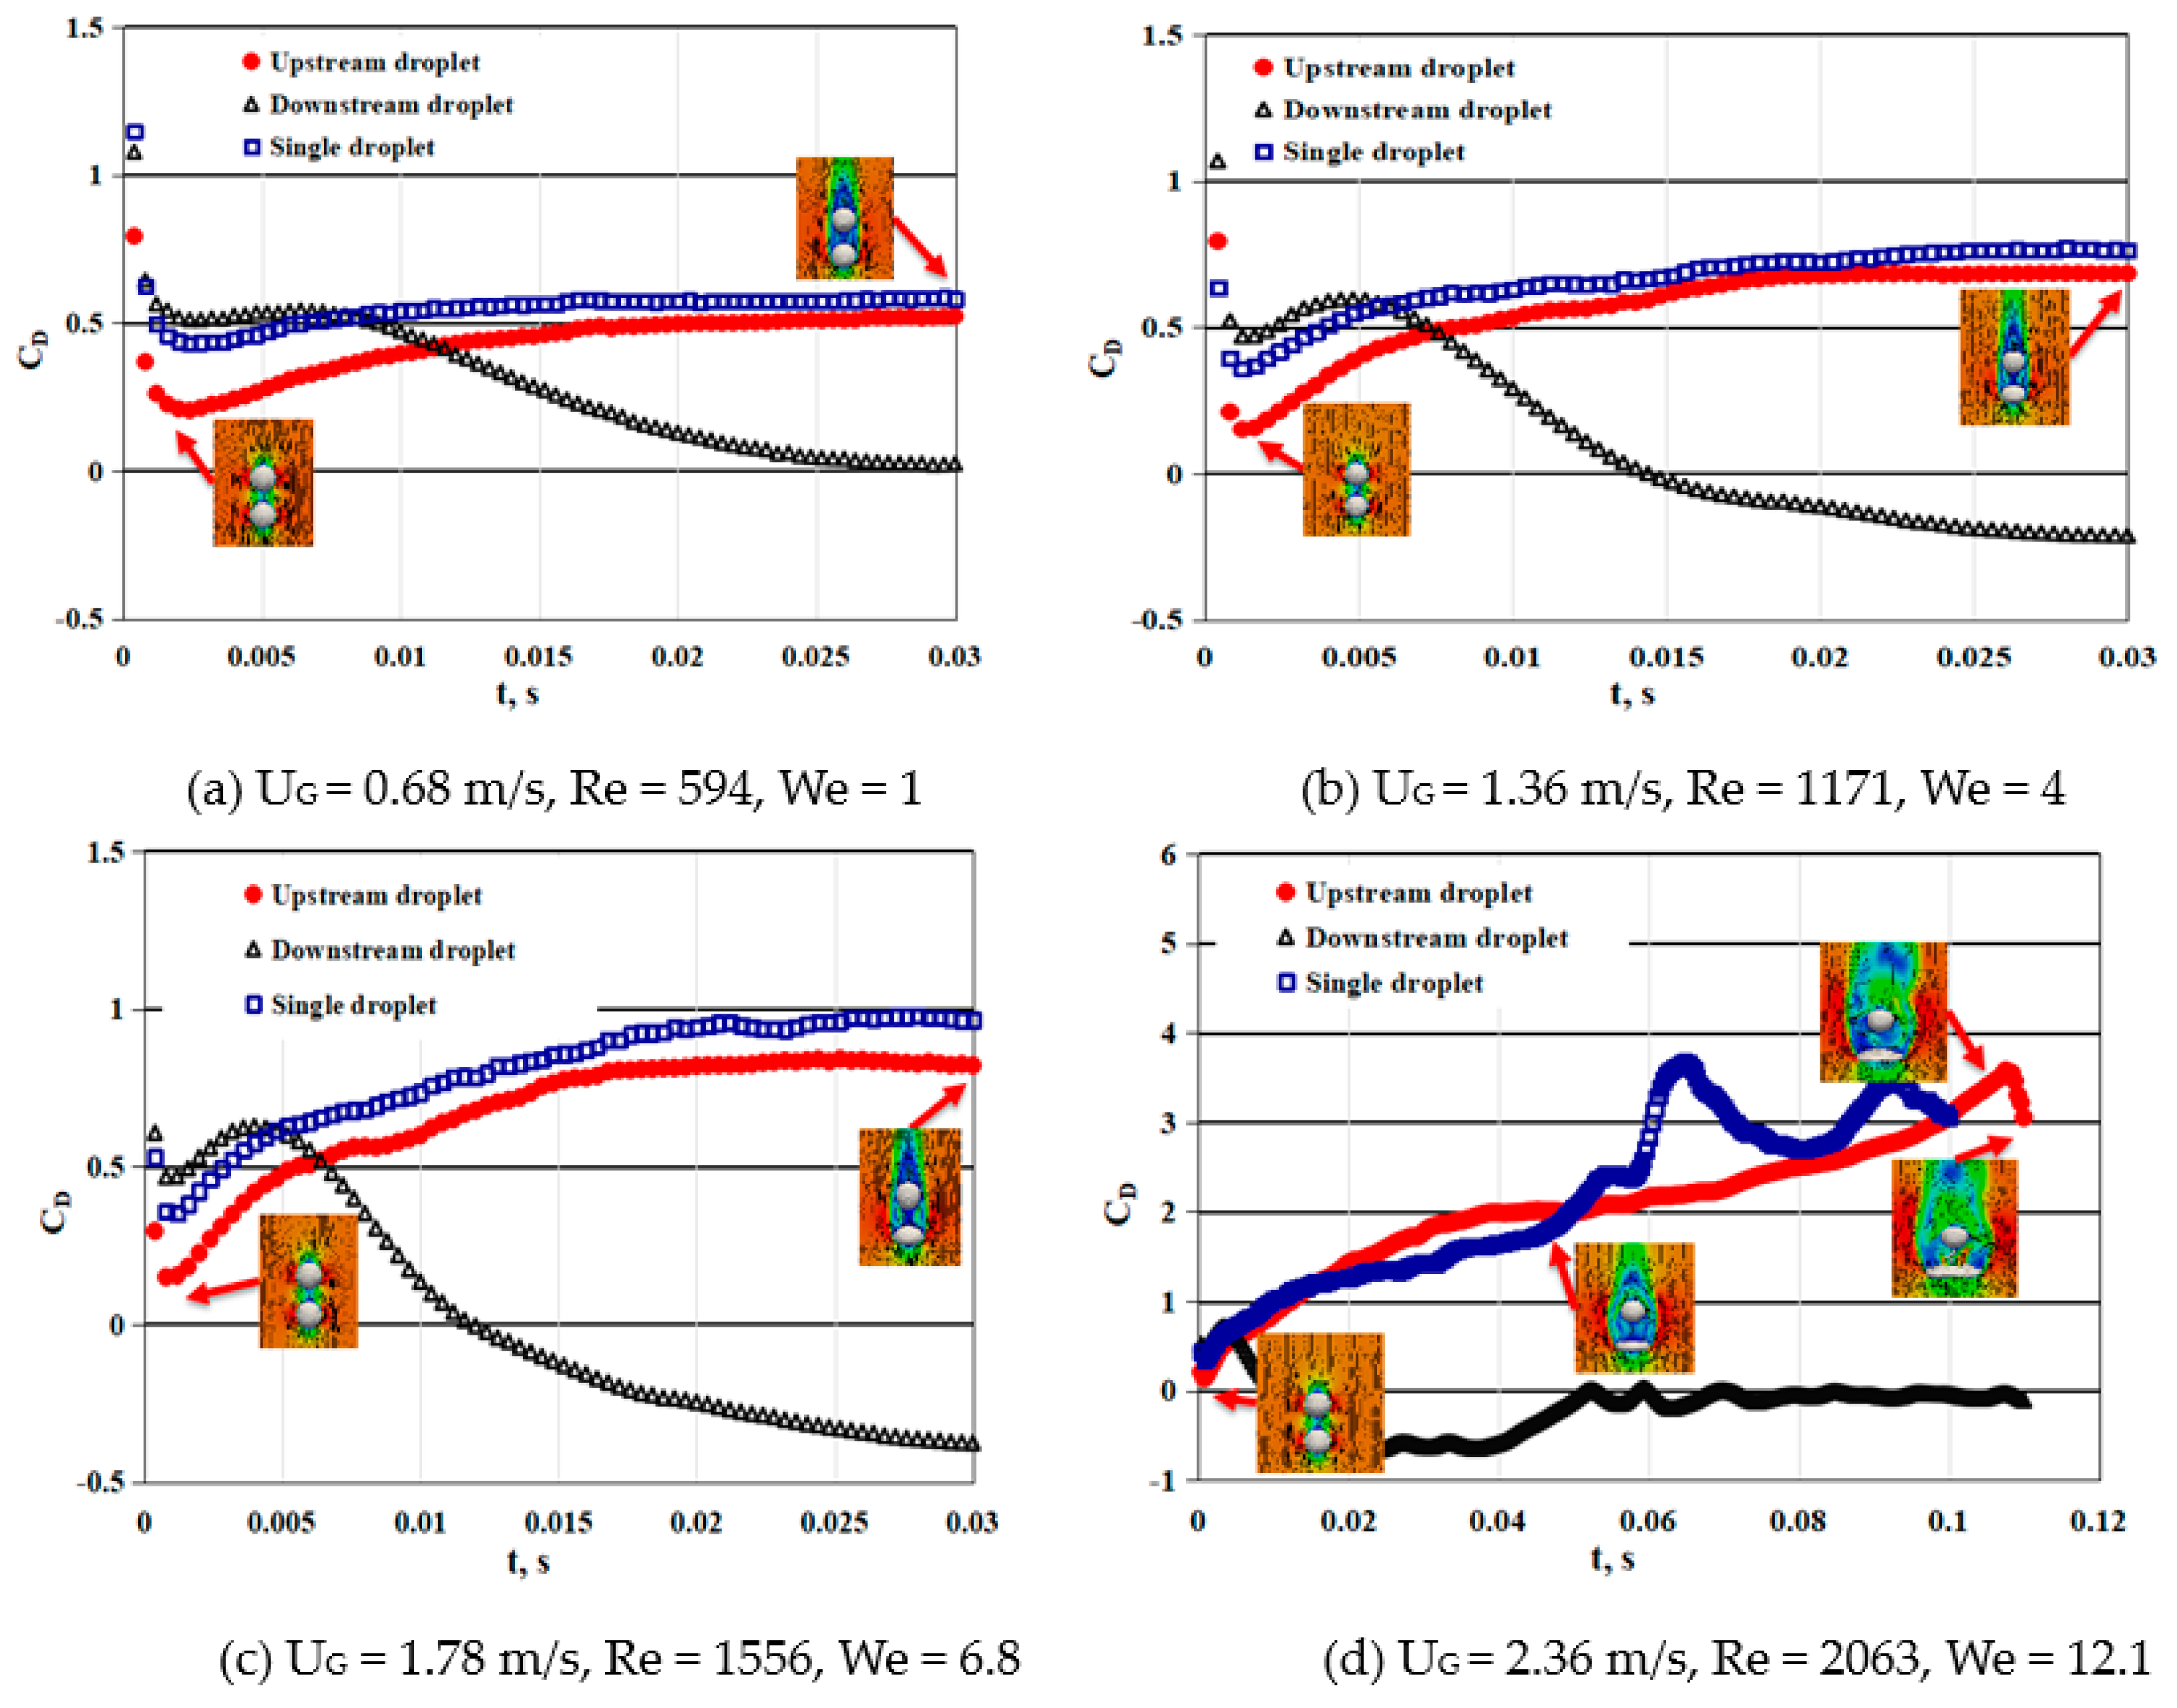
Figure 6 shows the drag coefficient of two droplets in tandem with a separating space between them of 1.5D. In order to analyze the influence of the droplet interaction on the drag coefficient, the drag coefficient of the single isolated droplet is also shown in Figure 6.
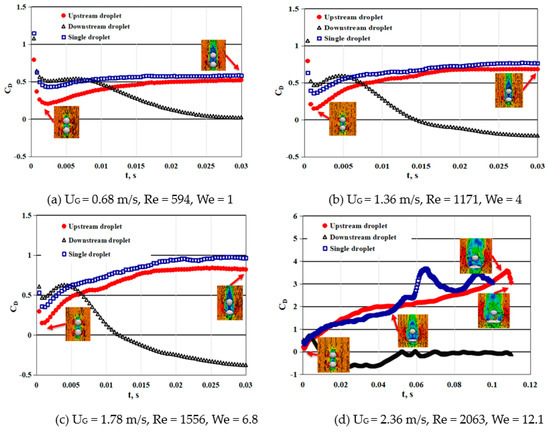
Figure 6.
The drag coefficient of two droplets in tandem with different Weber numbers and a separating space between them of 1.5D.
For the upstream droplet, it can be seen from Figure 6a–d that the variations of the drag coefficient over time were similar to those of the single droplet; the drag coefficients of the upstream droplet and the isolated droplet increased as the droplet deformed, and finally stopped at a constant value of 0.55, 0.75, 0.95, and 1.0 for the Weber numbers of 1, 4, 6.8, and 12.1, respectively. The final drag coefficient of the upstream droplet increased as the Weber number increased. At beginning, the drag coefficient of the upstream droplet was smaller than that of the isolated droplet, but the difference became smaller and smaller, before its deformation reached a steady condition.
However, for the downstream droplet, the drag coefficient was reduced sharply at beginning and then slowly decreased to a constant value of 0.05, −0.25, −0.35, and −0.42 for the Weber numbers of 1, 4, 6.8, and 12.1, respectively. The final drag coefficient of the downstream droplet decreased dramatically as the Weber number increased. The difference in the drag coefficient between the upstream and the single isolated droplets became larger. With the increase of the Weber number, the upstream droplet became an ellipsoid, or pancake, which sheltered the downstream droplet from direct contact with the flowing gas, and the wake effects behind the upstream droplet increased.
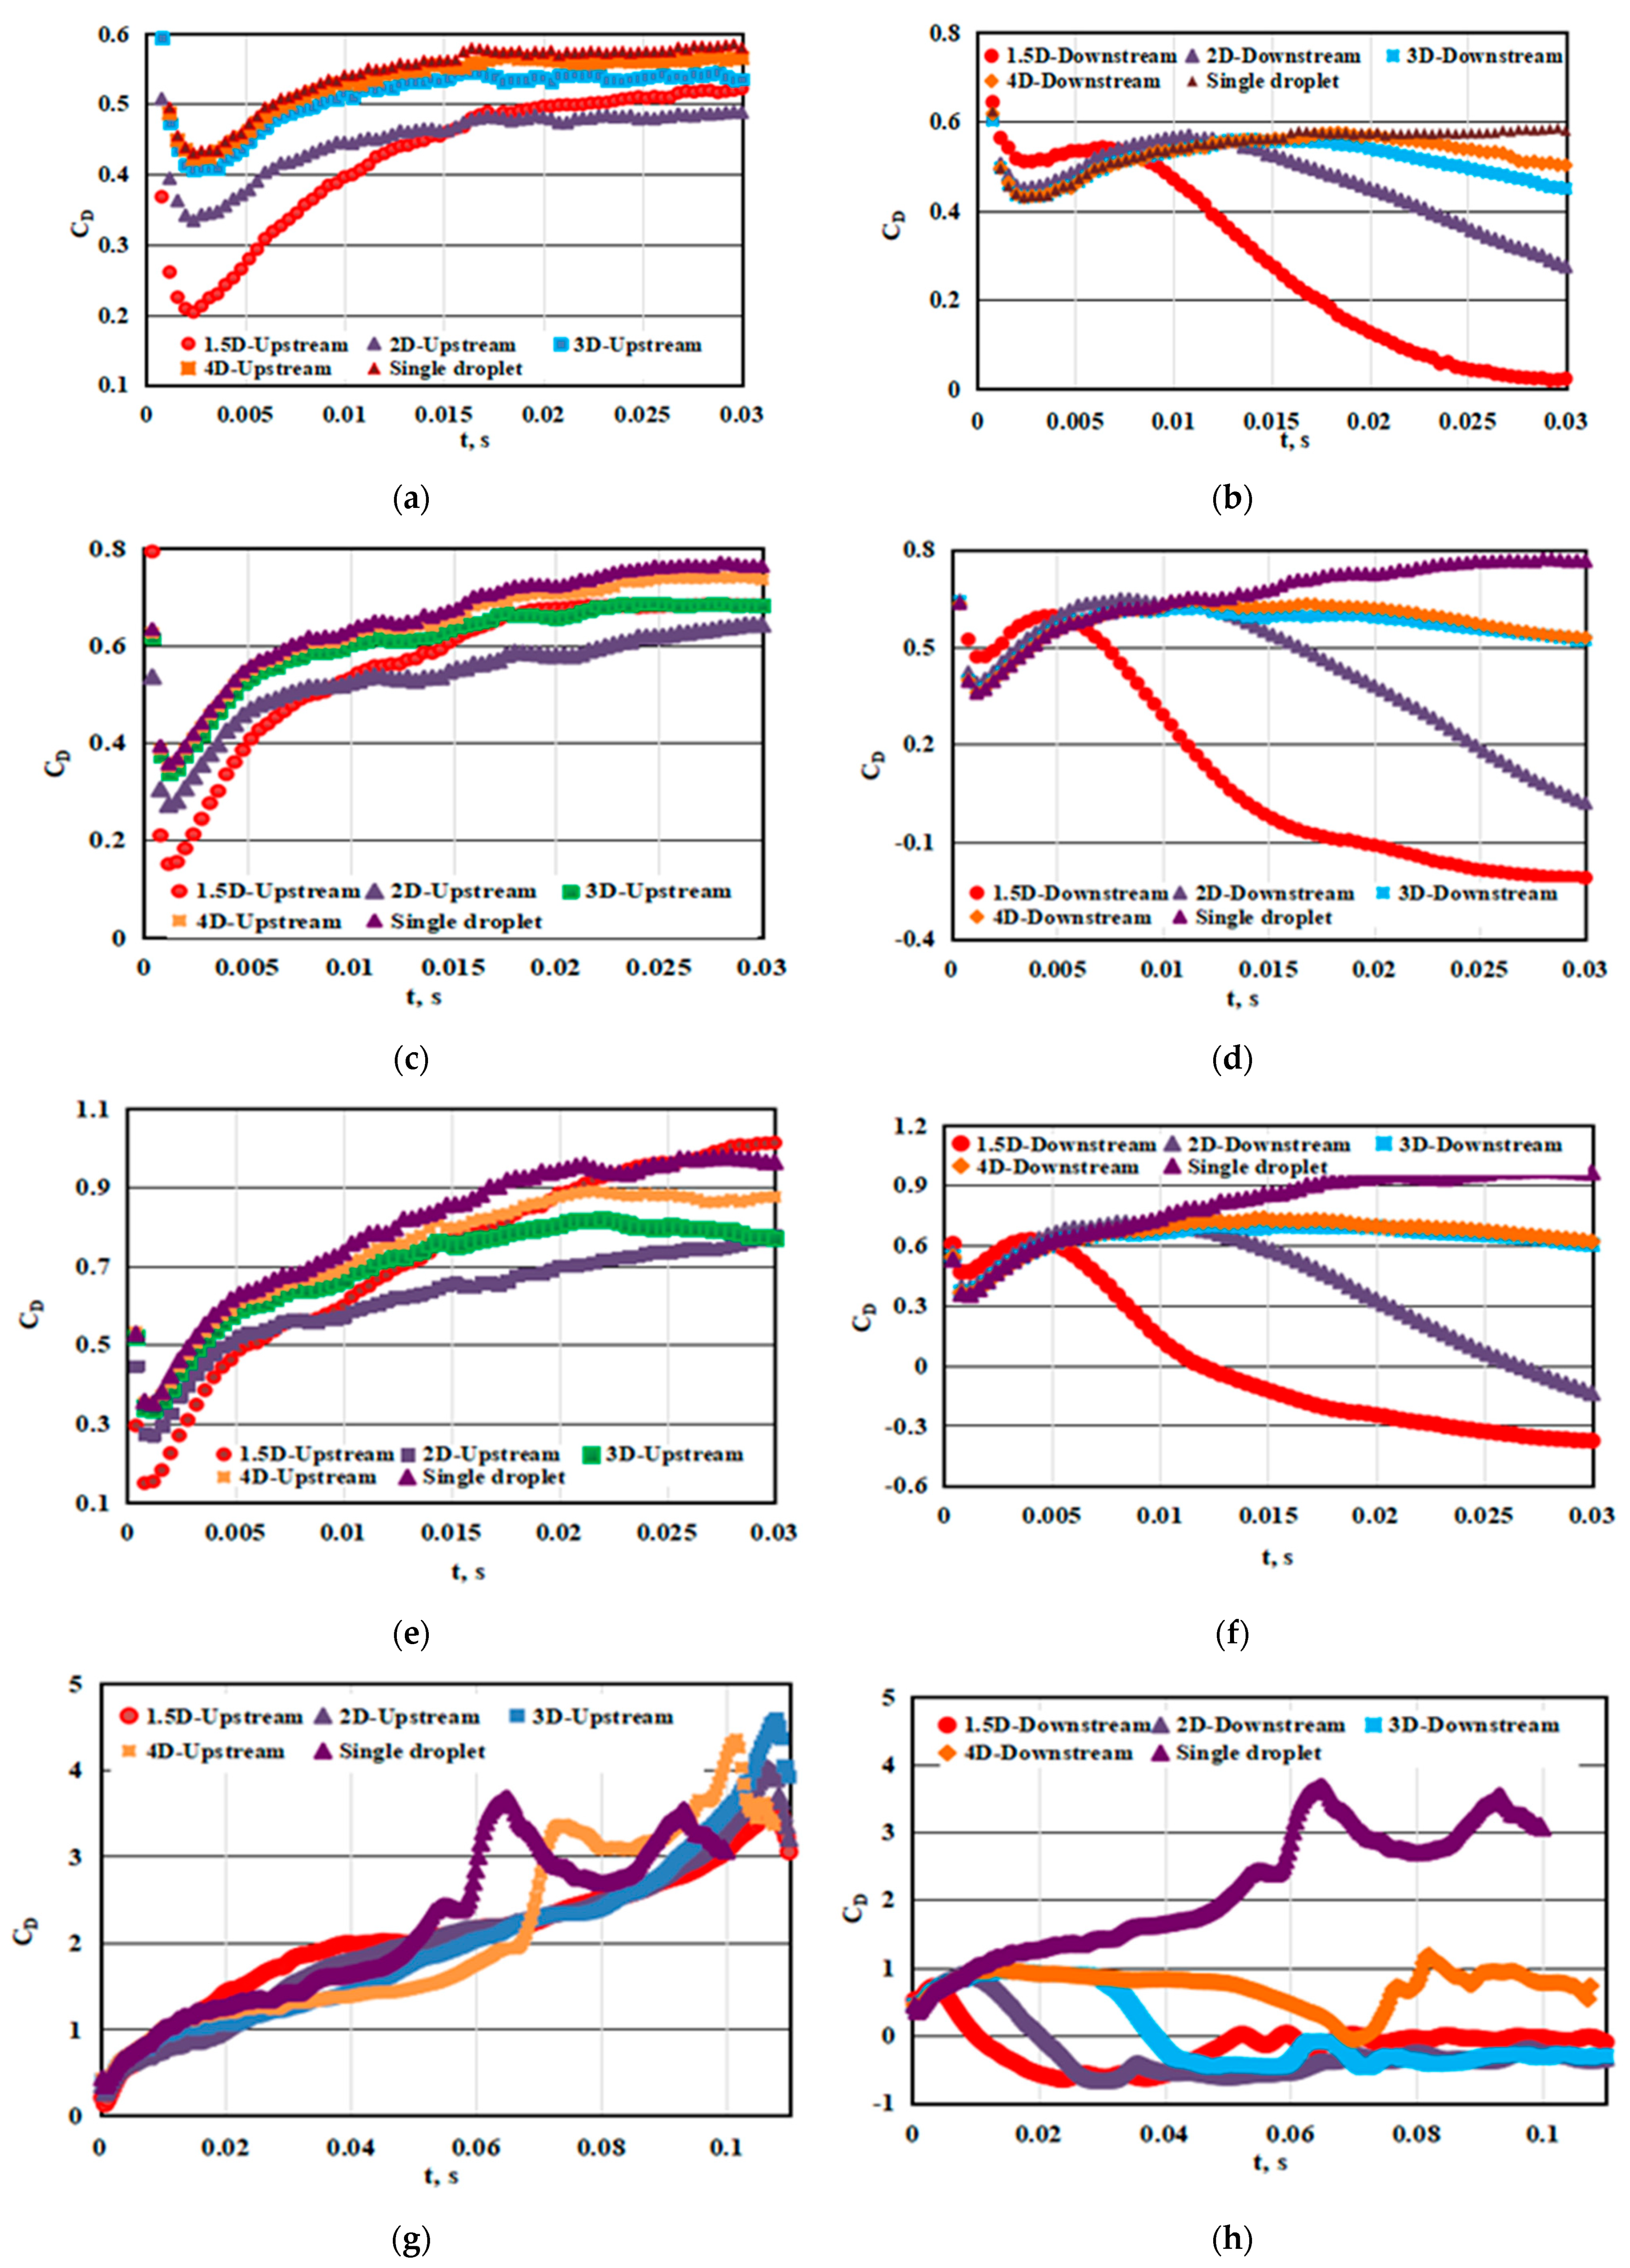
3.3.2. For Separating Spaces between Droplets of 2D, 3D, and 4D
In order to analyze the influence of the separating space on the interaction between the droplets, droplets separated by spaces of 2D, 3D, and 4D were simulated under gas velocities of 0.68, 1.36, 1.78, and 2.36 m/s, with corresponding Weber numbers of 1, 4, 6.8, and 12.1, respectively. Figure 7 shows the changes of the drag coefficient over time with different separating spaces between droplets. From the simulation results, we know that the drag coefficient of the downstream droplet increased as the space between the droplets increased, and the final drag coefficient increased up to zero. The difference in the drag coefficient between the downstream and the isolated droplets decreased with the increase in the space between the droplets. When the droplet spacing increased to 4D, the difference was reduced and could be ignored, indicating that the sheltering effect from the upstream droplet had gradually vanished.
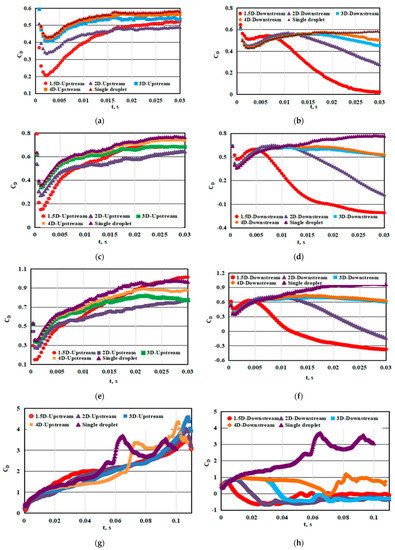
Figure 7.
Drag coefficients for different separating spaces between droplets and different Weber numbers. (a) Upstream droplet, UG = 0.68 m/s, Re = 594, We = 1. (b) Downstream droplet, UG = 0.68 m/s, Re = 594, We = 1. (c) Upstream droplet, UG = 1.36 m/s, Re = 1171, We = 4. (d) Downstream droplet, UG = 1.36 m/s, Re = 1171, We = 4. (e) Upstream droplet, UG = 1.78 m/s, Re = 1556, We = 6.8. (f) Downstream droplet, UG = 1.78 m/s, Re = 1556, We = 6.8. (g) Upstream droplet, UG = 2.36 m/s, Re = 2063, We = 12.1. (h) Downstream droplet, UG = 2.36 m/s, Re = 2063, We = 12.1.
Raju and Sirignano (1990) [17] and Chiang and Sirignano (1993) [18] examined the hydrodynamics of droplets arranged in tandem with Reynolds numbers smaller than 200. They found that the drag coefficients decreased with the Reynolds numbers and the droplet spacing. Separating Spaces of 6D was found to be a critical value to consider or not to consider the effect of the upstream droplet on the drag coefficient of the upstream droplet. When the droplet spacing increased to 6D, the drag coefficient of the downstream droplet was not affected by the upstream droplet anymore. However, in present study, such separating spaces was found to be 4D, which is smaller 6D.The discrepancy between the two values could be attributed to the effect of the Reynolds numbers. The Reynolds numbers in the present study were much larger than in previous studies, and the length of the wakes from the upstream droplet was gradually shortened, especially in the case of Re = 2063 and We = 12.1, where the gas stream around the droplet developed into a turbulent flow.
3.3.3. Correlation of Drag Coefficient of Downstream Droplet
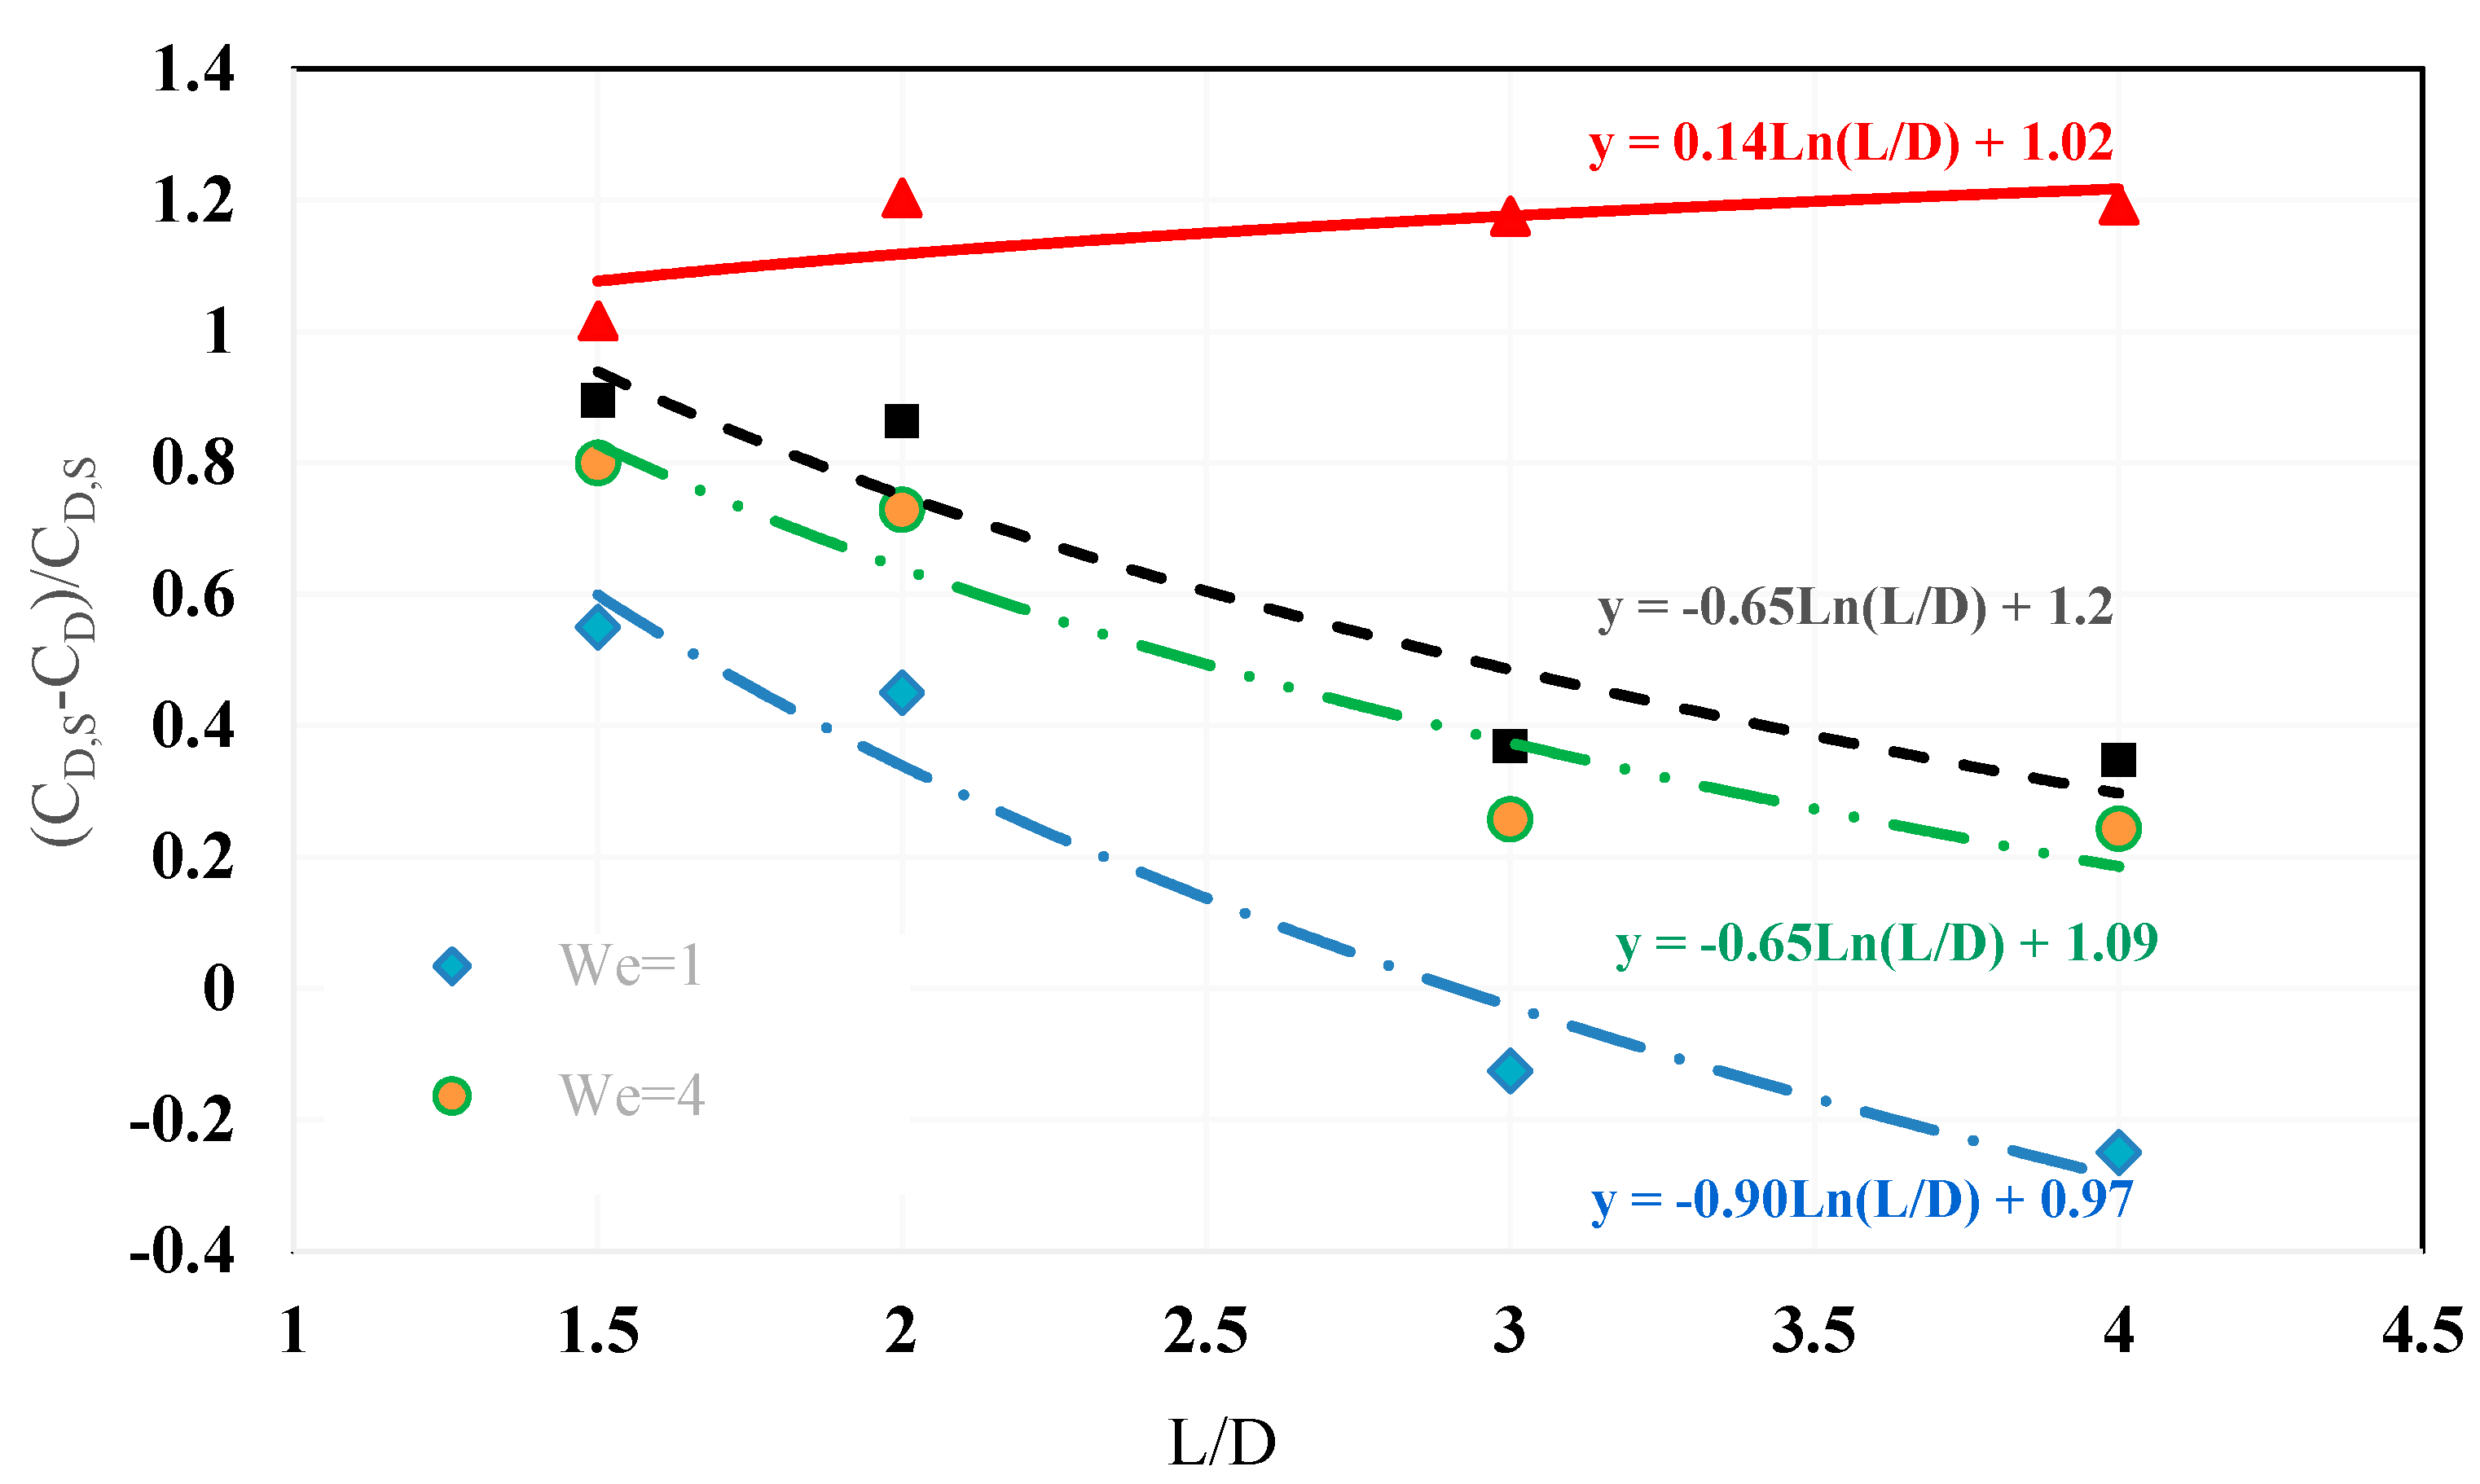
Figure 8 shows the deviation of the final drag coefficient between the downstream droplet and the single isolated droplet with different separating spaces and Weber numbers. It also shows that the deviation decreased with the separating space and the Weber number.
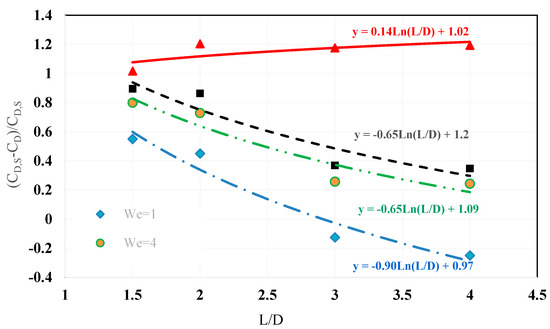
Figure 8.
The deviation of the final drag coefficient between the downstream droplet and the single isolated droplet.
Based on Figure 8, a formula for predicting the final drag coefficient of downstream droplets was constructed, as follows:
where CD is the final steady drag coefficient of the downstream droplet in steady conditions; CD,S is the final drag coefficient of the single isolated droplet in steady conditions; We is the droplets’ Weber number; L is the separating space, in millimeters; and D is the droplets’ initial diameter, in millimeters.
4. Conclusions
The interactions between two droplets with high Reynolds numbers in a tandem arrangement, fixed in a gas flow field of a gas well, was numerically investigated.
The interactions between the two droplets were analyzed by comparing them with the simulation results of a single isolated droplet at four initial Weber numbers of 1, 4, 6.8, and 12.1. It was demonstrated that the droplet became an ellipsoid, whose aspect ratio decreased as the Weber number rose, and that the critical Weber number for the breakup of the droplet was 12, which was consistent with that of the single isolated droplet. In addition, the drag coefficient of the upstream droplet was slightly smaller than that of the isolated droplet at the beginning of the droplet deformation, but the difference decreased and gradually disappeared.
However, the dynamics of the downstream droplet were influenced significantly by the upstream droplet for a separating space between the droplets of L < 4D, but the influence could be ignored for a separating space of L > 4D. Such critical separating spaces was smaller than the value found in previous studies with Reynolds numbers smaller than 200. The downstream droplet was deformed into a gyroscopic downward as the Weber number grew under the suction force from the low-pressure region behind the upstream droplet. The critical Weber number for the breakup of the downstream droplet was much greater than 12 if sheltering from the upstream droplet still existed. The drag coefficient of the downstream droplet decreased with the increase in the Weber number and the decrease in the separating space, reducing to zero or below zero.
Based on the results of the numerical simulation, a formula for predicting the final drag coefficient of the downstream droplet was devised.
Author Contributions
Conceptualization, Z.W. and T.S.; methodology, Z.W.; software, Z.W., Z.Y., and G.Z.; writing—review and editing, Z.W. and H.S.; investigation, T.S. and Z.Y. All authors have read and agreed to the published version of the manuscript.
Funding
This study is financially supported by the National Natural Science Foundation (No. 51974263).
Acknowledgments
This study is financially supported by the National Natural Science Foundation (No. 51974263).
Conflicts of Interest
The authors declare no conflict of interest.
References
- Turner, R.G.; Hubbard, M.G.; Dukler, A.E. Analysis and prediction of minimum flow rate for the continuous removal of liquids from gas wells. J. Pet. Technol. 1969, 21, 75–82. [Google Scholar] [CrossRef]
- Coleman, S.B.; Clay, H.B.; McCurdy, D.G. A new look at predicting gas-well load-up. J. Pet. Technol. 1991, 43, 329–333. [Google Scholar] [CrossRef]
- Nosseir, M.A.; Darwich, T.A.; Sayyouh, M.H. A new approach for accurate prediction of loading in gas wells under different flowing conditions. In Proceedings of the SPE Production Operation Symposium, Oklahoma City, OK, USA, 9–11 March 1997. [Google Scholar]
- Li, M.; Li, S.L.; Sun, L.T. New view on continuous-removal liquids from gas wells. SPE Permian Basin Oil Gas Recovery Conf. 2002, 17, 42–46. [Google Scholar] [CrossRef]
- Zhou, D.; Yuan, H.A. A new model for predicting gas-well liquid loading. SPE Prod. Oper. 2010, 25, 172–181. [Google Scholar] [CrossRef]
- Wang, Z.B.; Bai, H.F.; Zhu, S.Y.; Li, Y.C.; Zhong, H.Q. An entrained model for predicting minimum flow rate for the continuous removal of liquids from gas wells. SPE J. 2015, 22, 1135–1144. [Google Scholar] [CrossRef]
- Kim, I.; Elgobashi, S.; Sirignano, W. Three-dimensional flow over two spheres placed sidy by side. J. Fluid Mech. 1993, 246, 465–488. [Google Scholar] [CrossRef]
- Tusji, T.; Narutomi, R.; Yokomine, T.; Ebara, S.; Shimizu, A. Unsteady three-dimensional simulation of interactions between flow and two particles. Int. J. Multiph. Flow 2003, 29, 1431–1450. [Google Scholar]
- Zhu, C.; Lam, K.; Chu, H.H.; Tang, X.D.; Liu, G. Drag forces of interacting spheres in power-law fluids. Mech. Res. Commun. 2003, 30, 651–662. [Google Scholar]
- Prahl, L.; Hölzer, A.; Arlov, D.; Revstedt, J.; Sommerfeld, M.; Fuchs, L. On the interaction between two fixed spherical particles. Int. J. Multiph. Flow 2007, 33, 707–725. [Google Scholar] [CrossRef]
- Yoon, D.H.; Yang, K.S. Flow-induced forces on two nearby spheres. Phys. Fluids 2007, 19, 98–103. [Google Scholar] [CrossRef] [Green Version]
- Prahl, L.; Jadoon, A.; Revstedt, J. Interaction between two spheres placed in tandem arrangement in steady and pulsating flow. Int. J. Multiph. Flow 2009, 35, 963–969. [Google Scholar] [CrossRef]
- Jadoon, A.; Prahl, L.; Revstedt, J. Dynamic interaction of fixed dual spheres for several configurations and inflow conditions. Eur. J. Mech. B Fluids 2010, 29, 43–52. [Google Scholar] [CrossRef]
- Kékesi, T.; Amberg, G.; Prahl Wittberg, L. Drop deformation and breakup in flows with shear. Chem. Eng. Sci. 2016, 140, 319–329. [Google Scholar] [CrossRef]
- Kékesi, T.; Altimira, M.; Amberg, G.; Prahl Wittberg, L. Interaction between two deforming liquid drops in tandem and various off-axis arrangements subject to uniform flow. Int. J. Multiph. Flow 2019, 112, 193–218. [Google Scholar] [CrossRef]
- Wang, Z.B.; Yang, Z.W.; Guo, L.J.; Zhao, R.J. A volume of fluid simulation of the steady deformation and the drag of a single droplet in a flowing gas. J. Hydrodyn. 2021, 33, 334–346. [Google Scholar] [CrossRef]
- Raju, M.; Sirignano, W. Interaction between two vaporizing droplets in an intermediate Reynolds number flow. Phys. Fluids 1990, 2, 1780–1796. [Google Scholar] [CrossRef]
- Chiang, C.; Sirignano, W. Interacting, convecting, vaporizing fuel droplets with variable properties. Int. J. Heat Mass. Transfer. 1993, 36, 875–886. [Google Scholar] [CrossRef]
- Kim, I.; Elgobashi, S.; Sirignano, W. Three-dimensional flow computation for two interacting, moving droplets. In Proceedings of the AIAA 30th Aerospace Sciences Meeting, Reno, NV, USA, 6–9 January 1992. [Google Scholar]
- Chen, S.L.; Guo, L.J. Viscosity effect on regular bubble entrapment during drop impact in to a deep pool. Chem. Eng. Sci. 2014, 109, 1–16. [Google Scholar] [CrossRef]
- Zhang, L.X.; Zhou, Z.C.; Shao, X.M. Numerical investigation on the drag force of a single bubble and bubble swarm. J. Hydrodyn. 2020, 32, 1043–1049. [Google Scholar] [CrossRef]
- Weller, H.G. A New Approach to VOF-Based Interface Capturing Methods for Incompressible and Compressible Flow; OpenCFD Ltd.: London, UK, 2008. [Google Scholar]
- Jasak, H. Error Analysis and Estimation for the Finite Volume Method with Applications to Fluid Flows; Medicine: London, UK, 1996. [Google Scholar]

Publisher’s Note: MDPI stays neutral with regard to jurisdictional claims in published maps and institutional affiliations. |
© 2021 by the authors. Licensee MDPI, Basel, Switzerland. This article is an open access article distributed under the terms and conditions of the Creative Commons Attribution (CC BY) license (https://creativecommons.org/licenses/by/4.0/).