Article

Numerical Simulation of Dynamic Response and Evaluation of Flexural Damage of RC Columns under Horizontal Impact Load

1
School of Civil Engineering and Transportation, South China University of Technology, Guangzhou 510641, China
2
College of Architecture & Engineering, Guizhou Minzu University, Guiyang 550025, China
3
State Key Laboratory of Subtropical Building Science, South China University of Technology, Guangzhou 510641, China
4
Guangzhou Jishi Construction Group Co., Ltd., Guangzhou 510725, China
*
Author to whom correspondence should be addressed.
Appl. Sci. 2021, 11(23), 11223; https://doi.org/10.3390/app112311223
Submission received: 7 October 2021 / Revised: 15 November 2021 / Accepted: 23 November 2021 / Published: 26 November 2021

Abstract

:
By using the ABAQUS finite element (FE) model, which has been verified by experiments, the deformation and internal force changes of RC columns during the impact process are investigated, and a parametric analysis is conducted under different impact kinetic energies Ek. According to the development path of the bottom bending moment-column top displacement curve under impact, the member is in a slight damage state when the curve rebounds before reaching the peak and in a moderate or severe damage state when the curve exceeds the peak, in which case the specific damage state of the member needs to be determined by examining whether there is a secondary descending stage in the curve. Accordingly, a qualitative method for evaluating the bending failure of RC column members under impact is obtained. In addition, the damage state of RC columns under impact can also be quantitatively evaluated by the ratio of the equivalent static load Feq and the ultimate static load-bearing capacity Fsu.

1. Introduction

Currently, reinforced concrete (RC) members are widely employed in building construction and structures that are susceptible to ship and vehicle impacts, such as harbors and bridges. Compared to common static or quasi-static loads, such as constant and live loads, the instantaneous and intense nature of impact loads often results in a largely concentrated release of energy. The failure of RC columns as the main load-bearing members can cause a superstructure to progressively collapse with serious consequences. Therefore, conducting an in-depth study of the dynamic response of columns under impact loading has substantial practical and theoretical significance. In existing experimental studies, drop-weight impact tests are commonly conducted in order to investigate the impact resistance of RC beams [1,2,3], RC columns [4], and ultra-high performance fiber reinforced concrete (UHPFRC) columns [5]. Meanwhile, some scholars [6] have demonstrated that the proposed simplified method is well capable of predicting the impact response of RC columns via drop-hammer impact tests. In drop-weight impact tests, a drop hammer free falls from different heights, which produces impact loads that are applied laterally in the mid position of specimens with two ends which are fixed or simply supported.
However, the use of free-falling drop-weights to study the dynamic responses of vertical members can cause deviations in the structural response due to the self-weight of the members. To date, almost all tests on vertical RC members subjected to horizontal impact loads have focused on the dynamic responses of vertical members subjected to horizontal impact at the bottom of the member, which are vulnerable to vehicular collisions and shear failure of the members. Hao et al. carried out laboratory tests of circular RC piers [7] and CFRP strengthened RC pier [8] using a pendulum impact system. In the test, an added mass consisted of a concrete block, and steel plates were placed on the top of the specimens to model the actual axial loading from the superstructure. It can be observed from these impact tests that without the presence of gravitational acceleration, the impact force-time histories are significantly different from those of the drop-weight impact tests. Demartino et al. [9] conducted the experimental investigation on the behaviour of shear-deficient reinforced circular RC columns using a novel horizontal collision facility. With the boundary conditions of a cantilever and fixed simple support, a total of ten RC columns with two types of volumetric transverse reinforcement ratios were designed. The impact force position was 1/4 of the column height. The post-impact damage of all specimens exhibited brittle shear-type damage, which is characterised by one main diagonal crack starting from the impact point to the bottom of RC columns. Adachi et al. [10] conducted an experimental investigation on the buckling behavior of a column subjected to a transverse impact during static axial compression in relation to structural energy absorption. It was found that the critical condition of buckling generation was determined by the kinetic energy of the impactor, irrelevant to the impact force history. However, similar tests aimed at investigating the impact-resistance responses of wharves are rarely reported, in which the top position is often under the collisions of vessels during the docking. As an important means of studying the load-bearing performance of RC members, structural tests are not suitable on a large scale due to such disadvantages as high costs, long experimental periods, and limited resources. With the development of computer technology and numerical analysis methods, these problems can be solved by combining nonlinear finite element (FE) techniques to efficiently perform a parametric analysis. Szymczak-Graczyk et al. [11] used the FE software ABAQUS to establish the full 3D model and the simplified shell model of a filigree ceiling slab, respectively. Compared with the calculation results of the simplified model and 3D solid element model, the effectiveness of the simplified model was verified, which provides a method for quick and engineering calculations of composite plates with spatial trusses. Zeinoddini [12,13] analyzed the dynamic response of axially pre-loaded steel tubes subjected to low-speed lateral impact by an experiment and numerical simulation. The research showed that when the axial pressure was large, the steel pipe column underwent overall buckling failure, while when the axial pressure was small and the steel tube wall thickness was thin, the steel tube produced a local impact failure/damage zone. Al-Thairy et al. [14] analyzed axially compressed steel columns subjected to transverse impact by using the FE software ABAQUS and studied the effects of impact velocity and impact position on the dynamic characteristics and failure mode of steel tubes. It was found that when the applied axial pressure was greater than 25% of the design value, the formation position of a plastic hinge was almost independent of the impact position, and the plastic hinge was basically located in the middle of the span of the member. Therefore, in this study, the FE software ABAQUS, considering its high reliability and wide applicability for nonlinear dynamic problems [15], is selected to establish the numerical model of RC columns. The reliability of the FE model, considering the strain rate effect of the steel and concrete materials, was verified by comparing it with the experimental results in the literature [16], and then the deformation and internal force of column members under impact were studied. In existing studies, the impact mass m and velocity v0 as two factors are usually considered separately to investigate their influences on the dynamic response of members. The existence of different combinations of the two factors for the same impact kinetic energy increases the difficulty in evaluating the dynamic response of the structure. To date, the influences of different combinations of m and v0 under the same impact kinetic energy on the dynamic response of RC columns has still not been studied. Therefore, this study conducts a parametric analysis under different levels of impact kinetic energy Ek which includes multiple combinations of m and v0. The variation of the column dynamic response was analyzed to reveal the load-bearing mechanism of the RC column members under impact and to evaluate their damage qualitatively. In addition, by comparing the ratio of equivalent static load-bearing capacity and ultimate static load-bearing capacity with the actual damage state of specimens, the standard for quantitatively evaluating the damage state of RC columns under impact is obtained, which provides a reference for the failure evaluation of RC columns under impact.

2. FE Model Validation

2.1. Test Overview

The accuracy of the FE model is validated via static load and horizontal impact tests of RC columns in the literature [16]. The dimensions and reinforcement configuration of a generic column specimen are shown in Figure 1. The specimen consisted of a base (900 × 900 × 300 mm), a column cap (300 × 300 × 200 mm), and a 1150-mm-high square column with 3 different side lengths (w = 120/150/180 mm), which correspond to 3 different longitudinal bars (Φ8, Φ10 and Φ12, respectively) with yield strengths of 408.8 MPa, 424.6 MPa and 470.4 MPa, respectively, and ultimate strengths of 541.1 MPa, 642.3 MPa, and 685.7 MPa, respectively. Grade C55 concrete [17] was used to manufacture the specimen with an axial compression ratio of 0.1. A total of 3 150 mm cubes were cured under the same conditions and used in cubic compressive strength tests. The average values of the measured cubic compressive strength fcu is 60.39 MPa. The corresponding compressive strengths were computed as fc = 0.76fcu and the tensile strengths were determined by ft = 0.395 f c u 0.55   [17]. In addition, 4 vertical through holes, each with a diameter of 80 mm, were reserved in the base to attach the specimen to the support of the test machine. To apply axial compression through external prestressing, 2 PVC pipes, each with a diameter of 20 mm, were embedded in the base. Once the concrete was cast, reserved holes were formed to allow the passage of the prestressed rods.
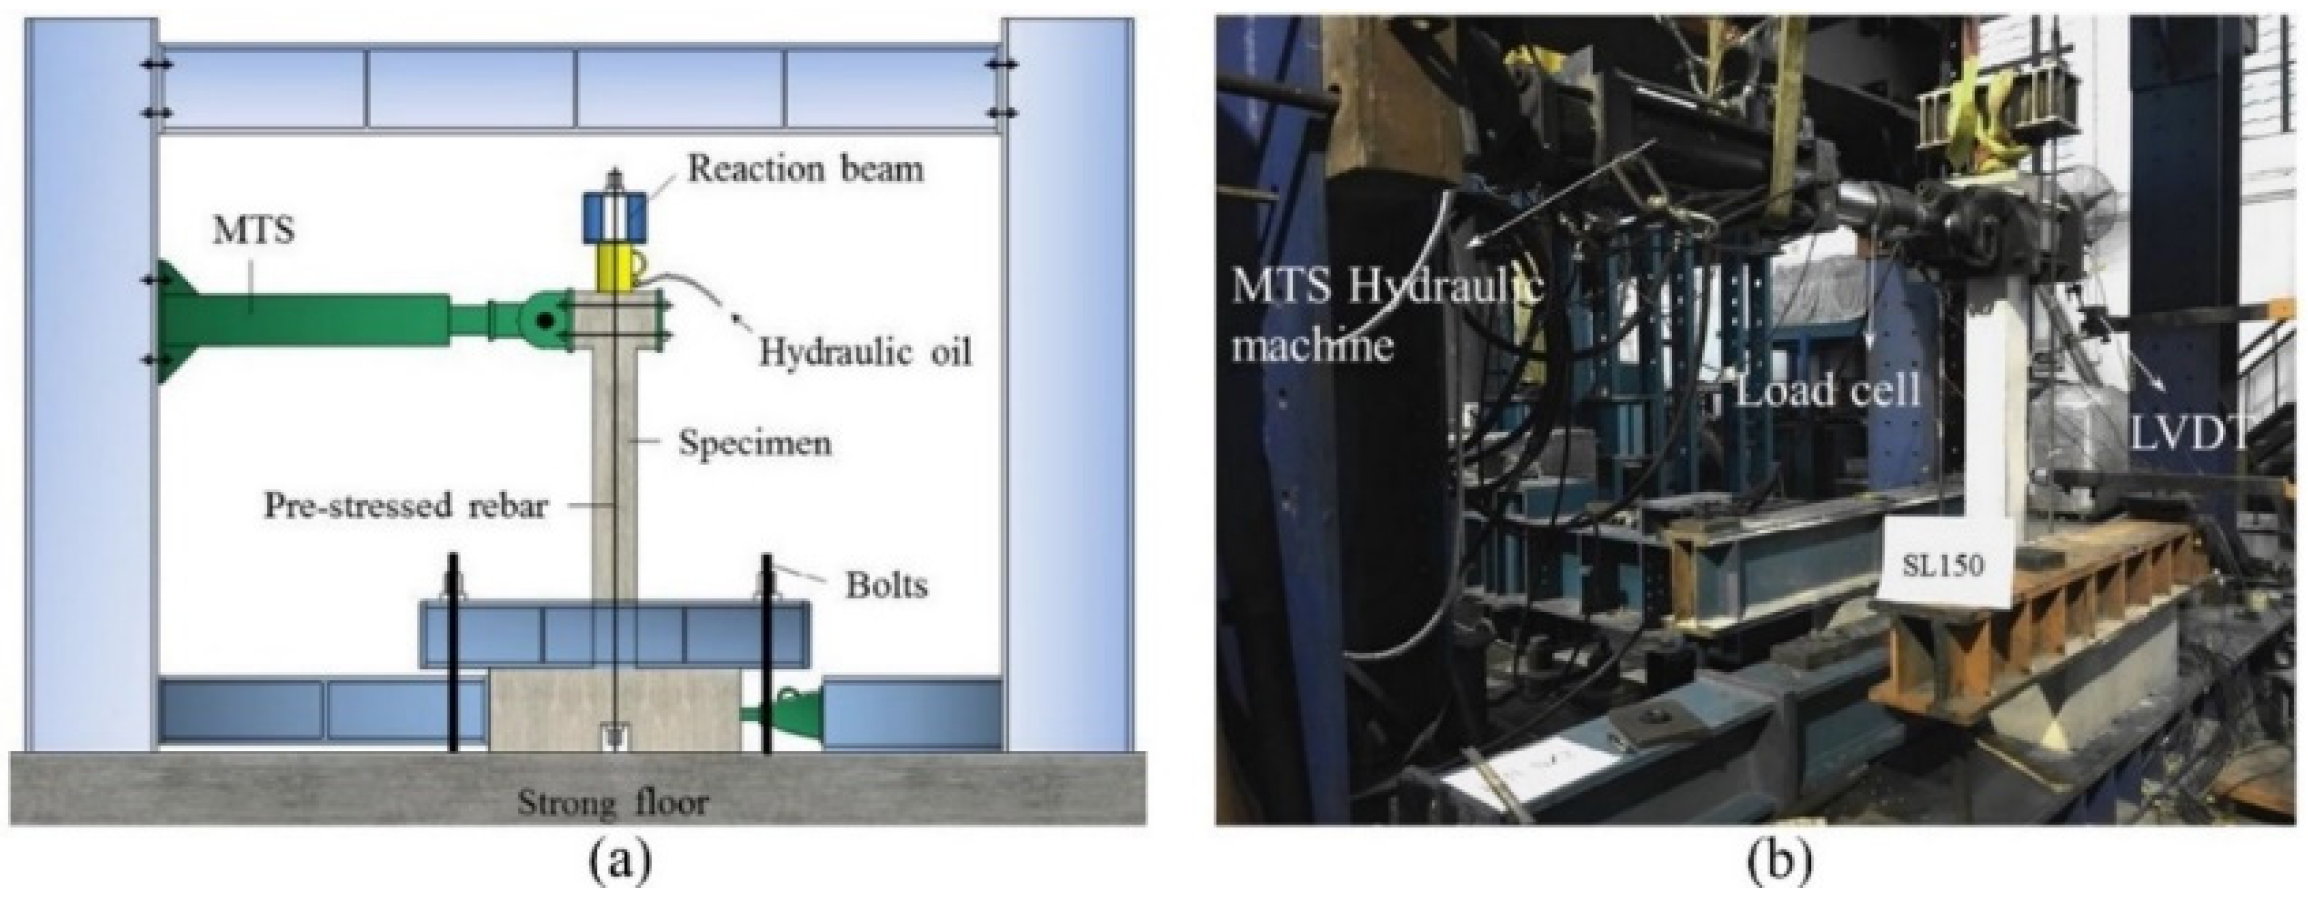
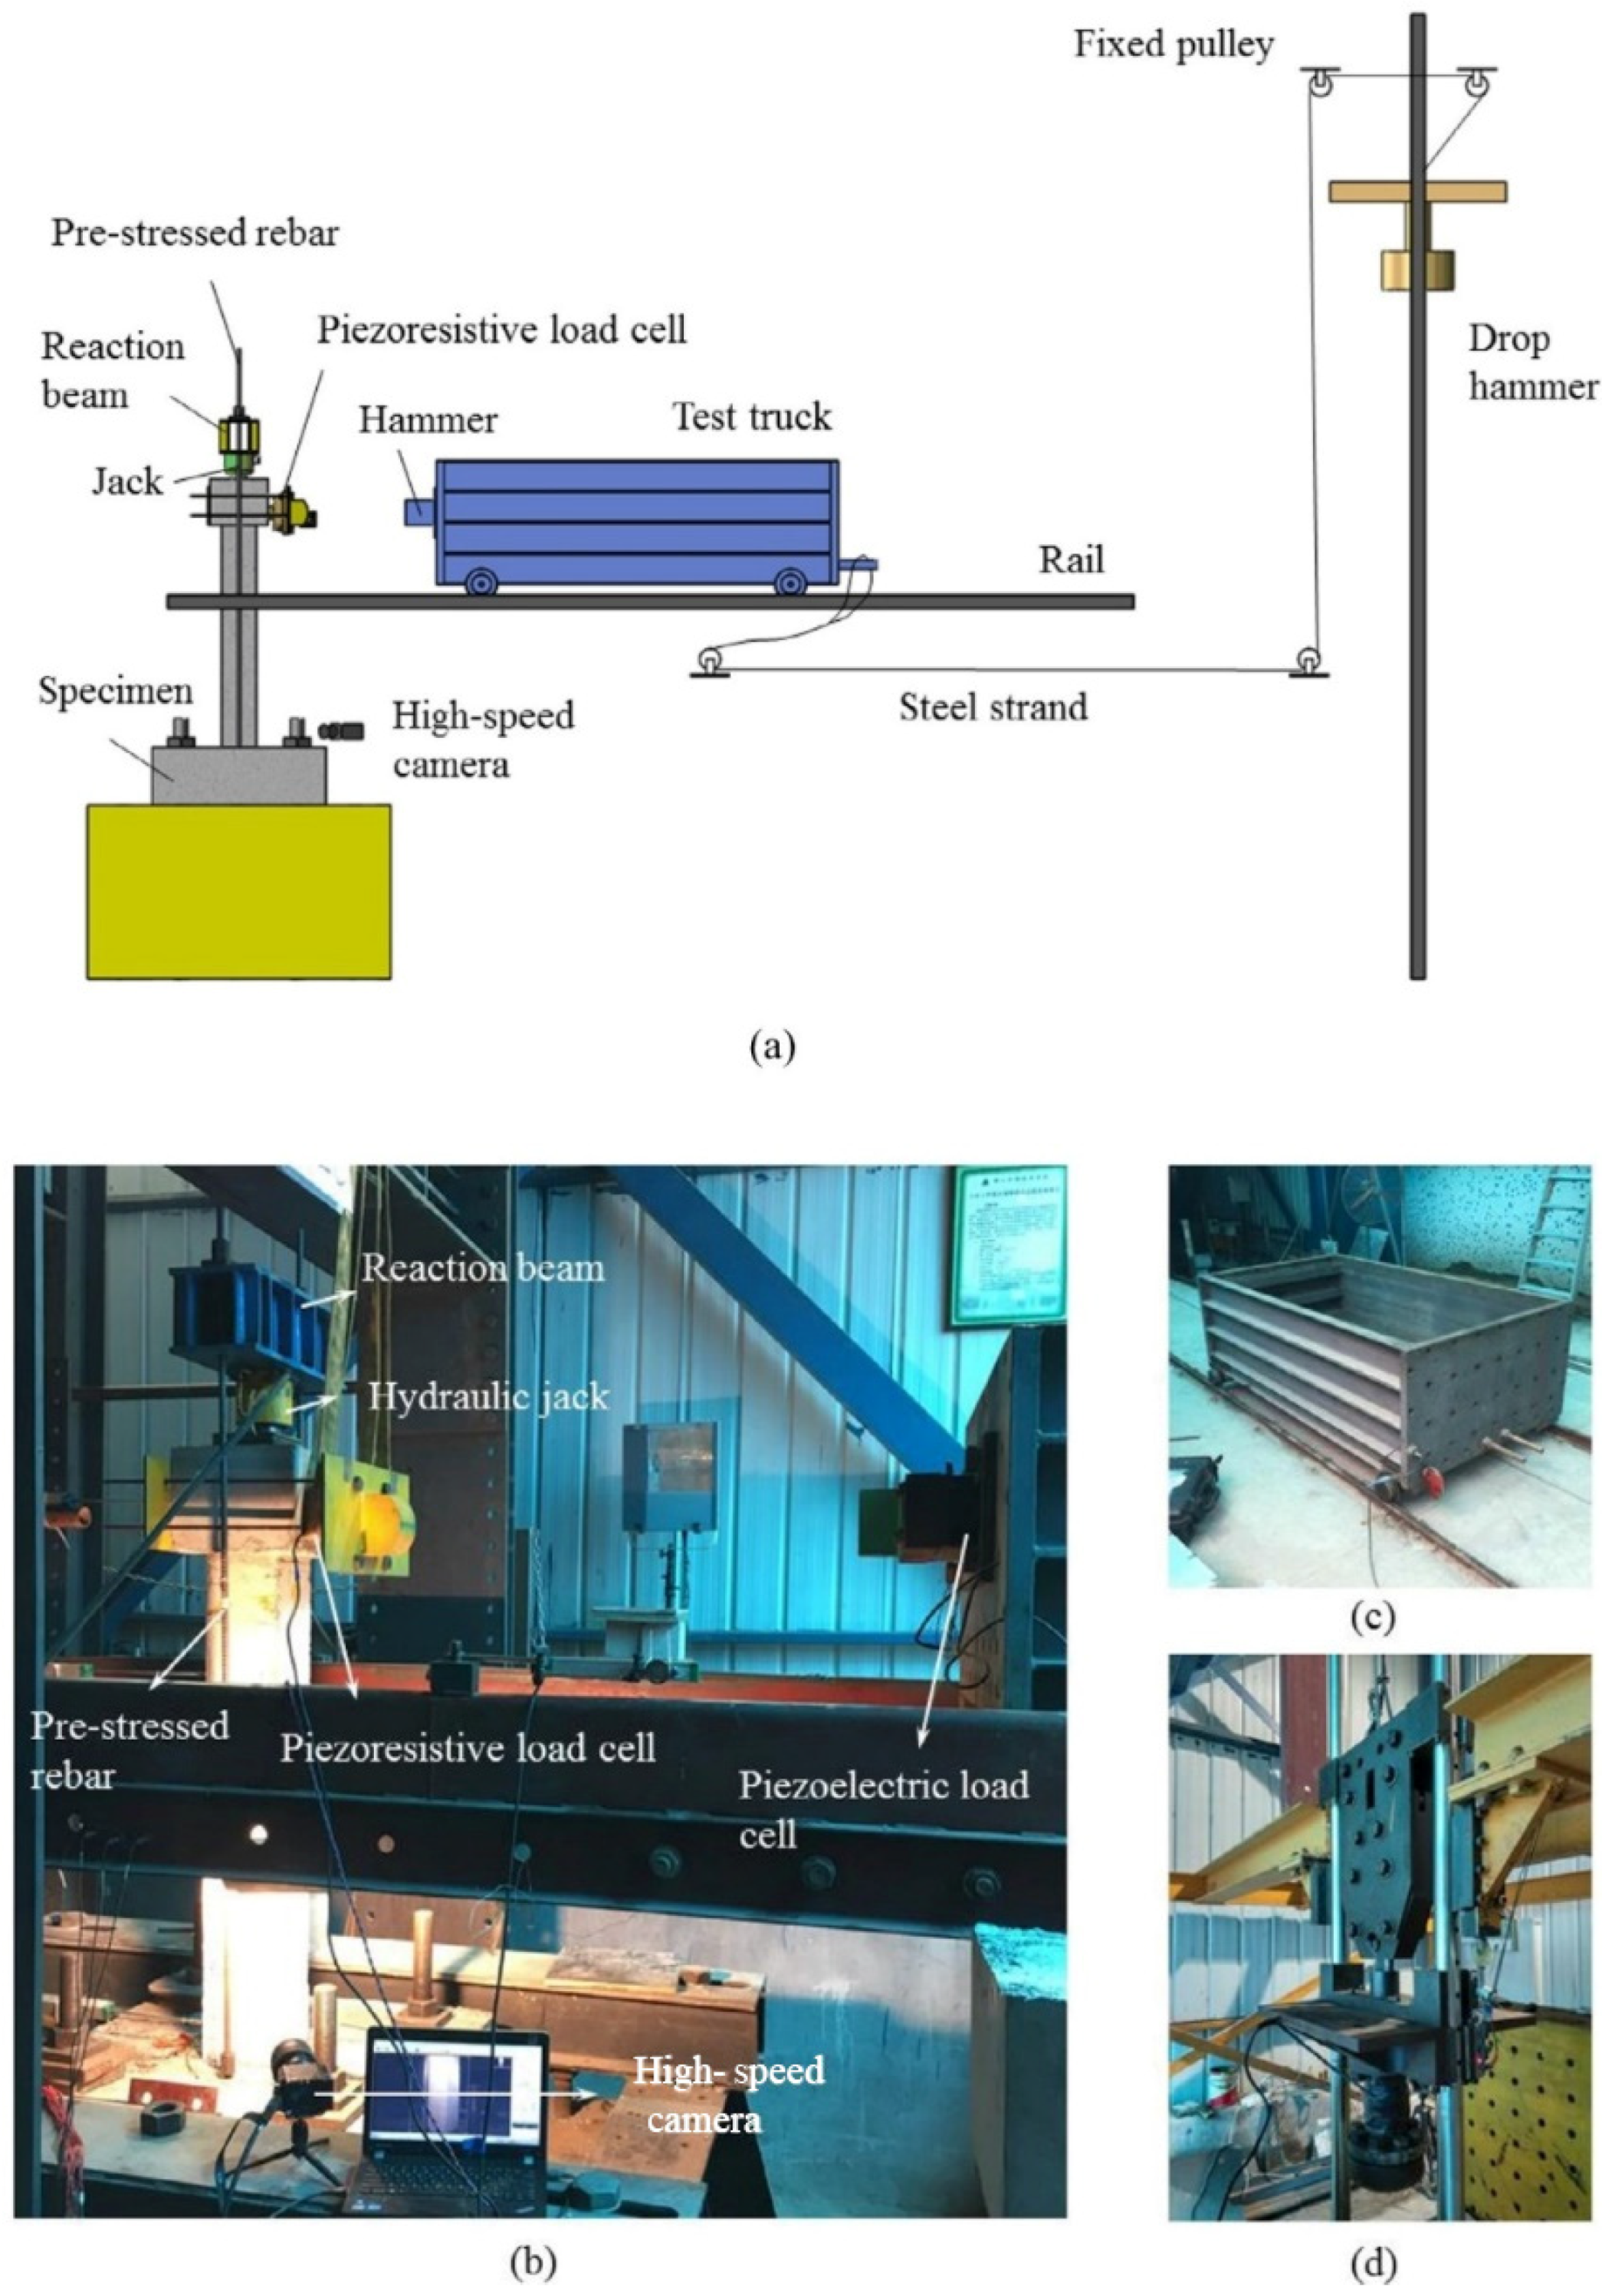
Figure 2 and Figure 3 show the setups for the static load test and the horizontal impact load test, respectively. Before the static load test, the base of the specimen was fixed to the rigid floor of the laboratory through two pressure beams and four ground anchor bolts, and the loading end of the MTS servo-hydraulic actuator was fixed to the column cap to apply a lateral pushing force to achieve a monotonic lateral static load. The impact test setup consisted of a drop hammer and a horizontal impact device. The test truck was connected to the drop hammer through steel strands and fixed pulleys and was then dragged by the falling hammer to impact the specimen. During the impact process, piezoelectric and piezoresistive load cells were installed at the front end of the test truck and the cap of the specimen, respectively, in order to synchronously record the impact force.
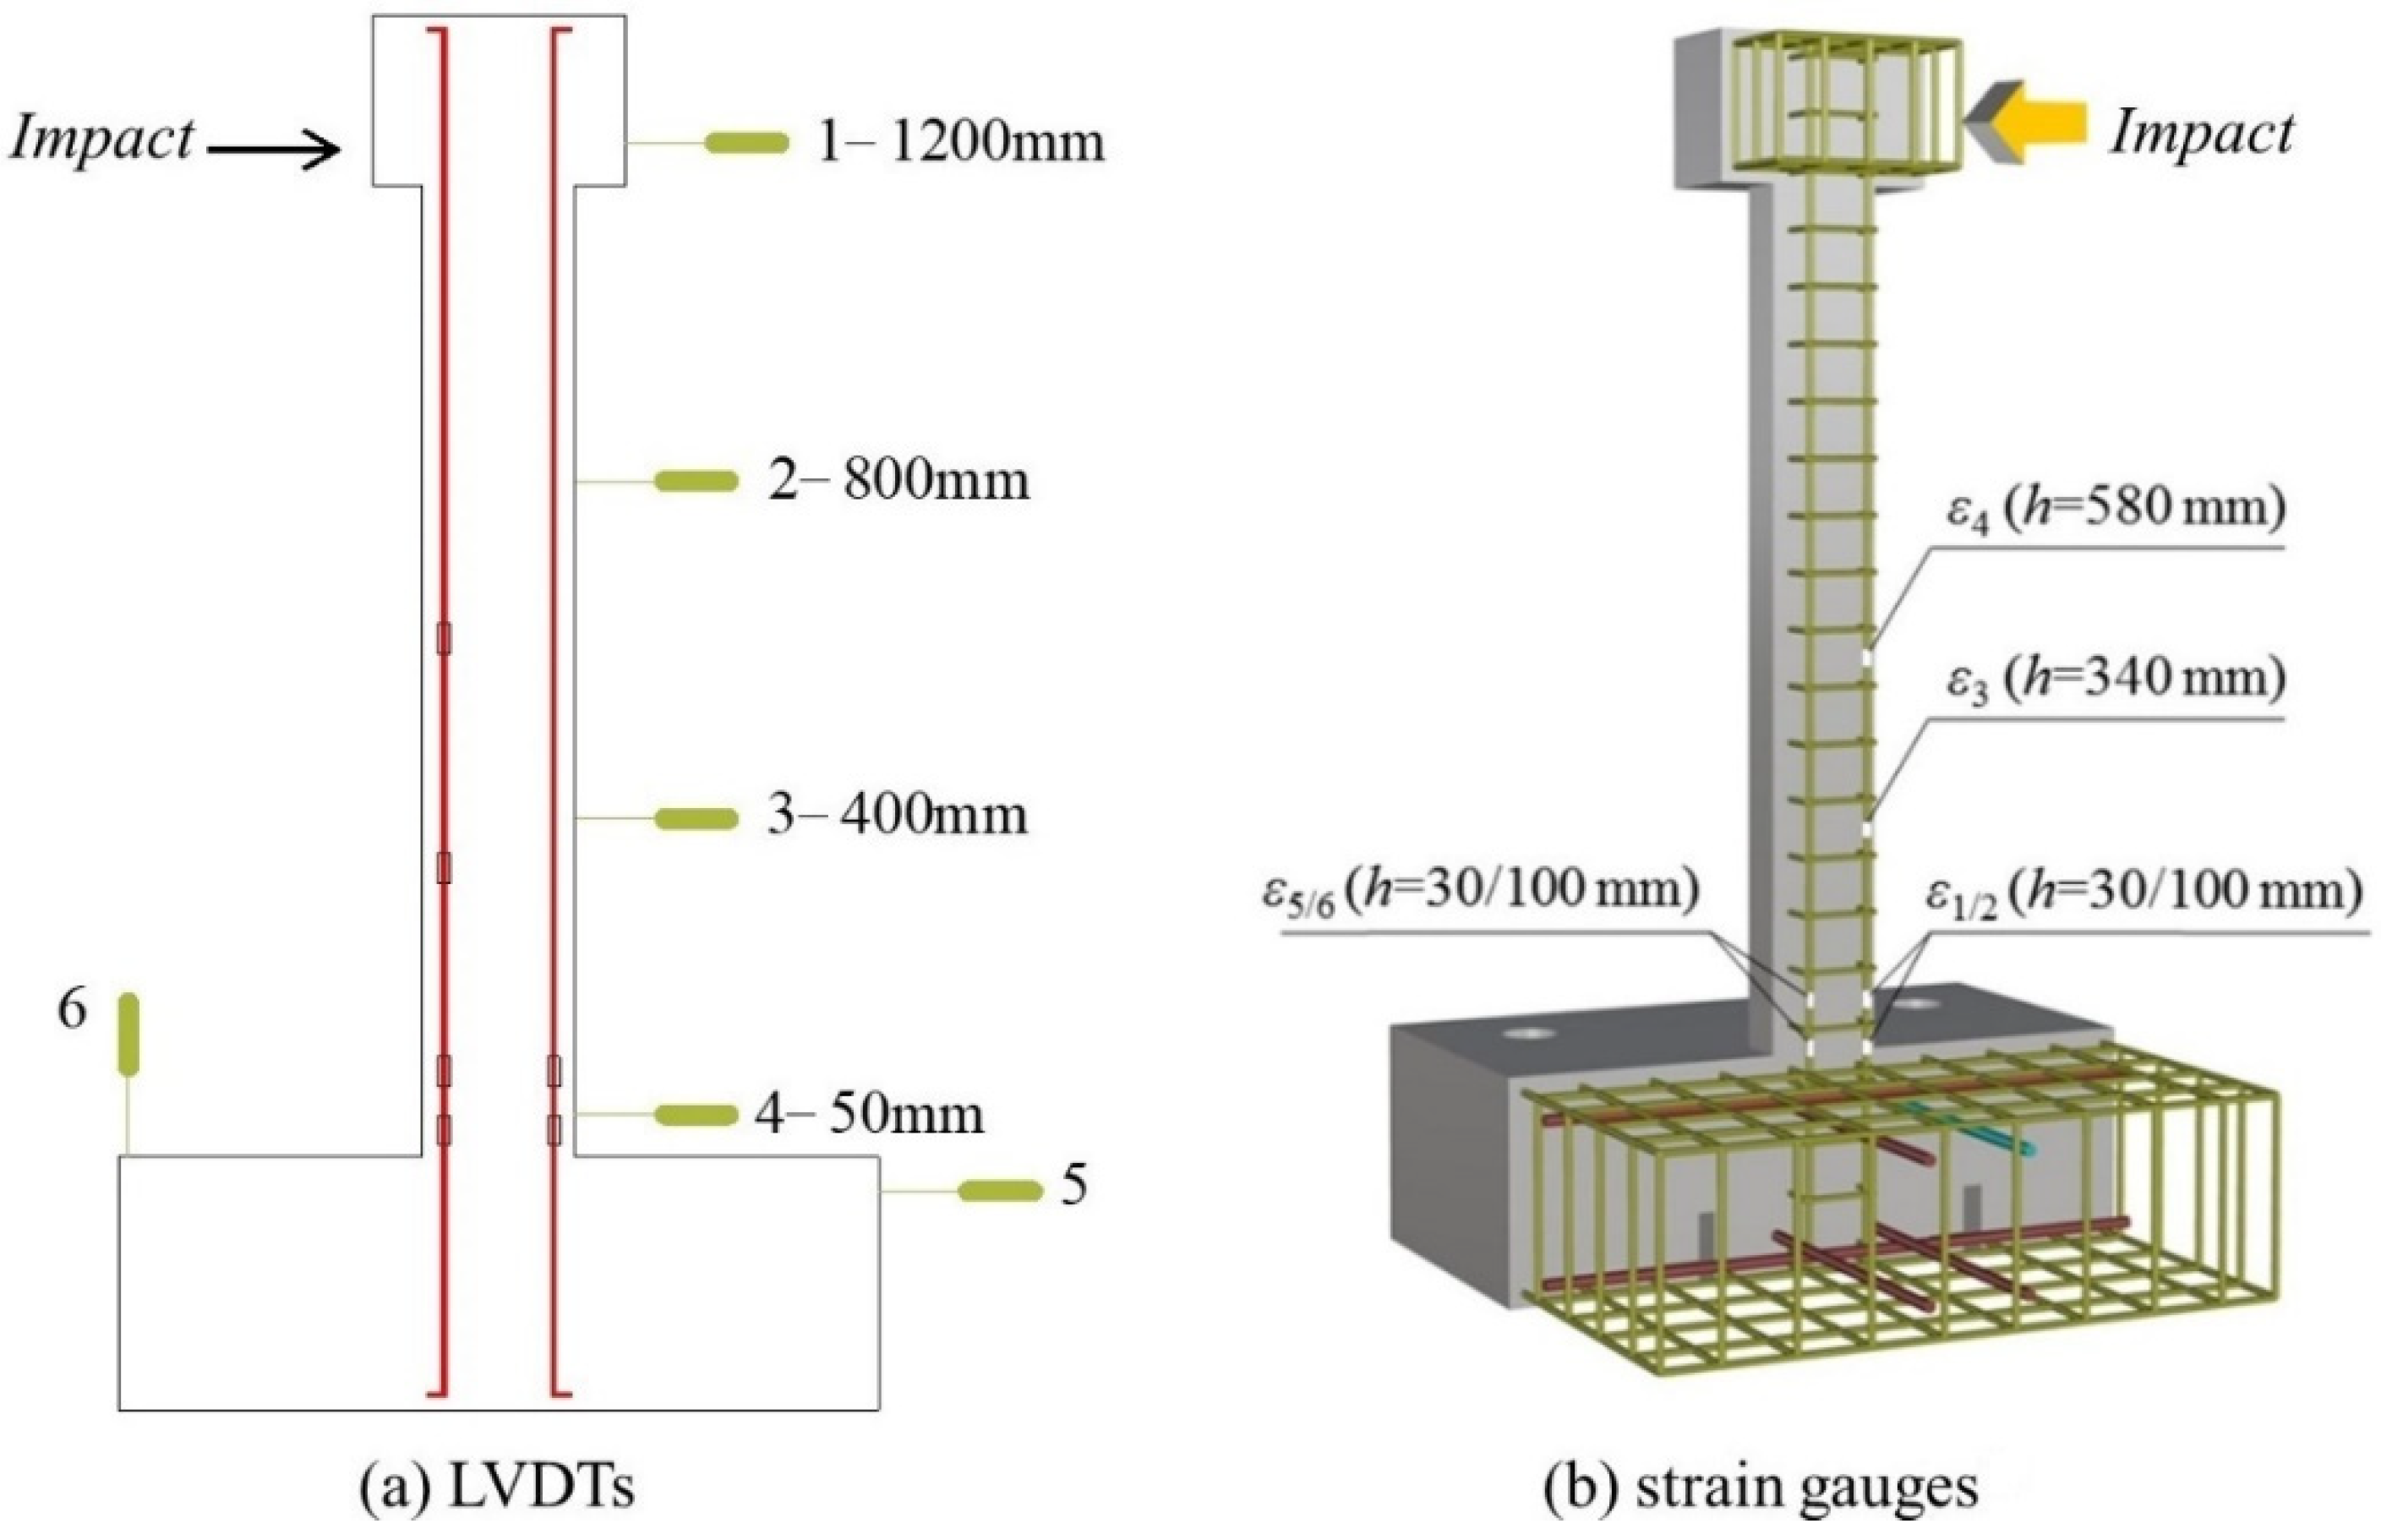
The measurement points for the displacement of the specimen were arranged as shown in Figure 4a. A total of 4 displacement meters were placed at a spacing of 400 mm on the back of the specimen. In addition, displacement meters #5 and #6 were attached at the edge of the base to monitor whether the base underwent relative translation and rotation during the test. The layout of the strain gauge measurement points for rebars is shown in Figure 4b, with strain gauges ε1-ε4 on the tensile longitudinal rebars and ε5 and ε6 on the compressive rebars. All strain gauges were placed in the area below mid-height, which was significantly stressed. To ensure strain data collection, six strain gauges were also placed on the longitudinal rebars at the symmetrical position on the other side.

2.2. Numerical Model

2.2.1. Geometric Model

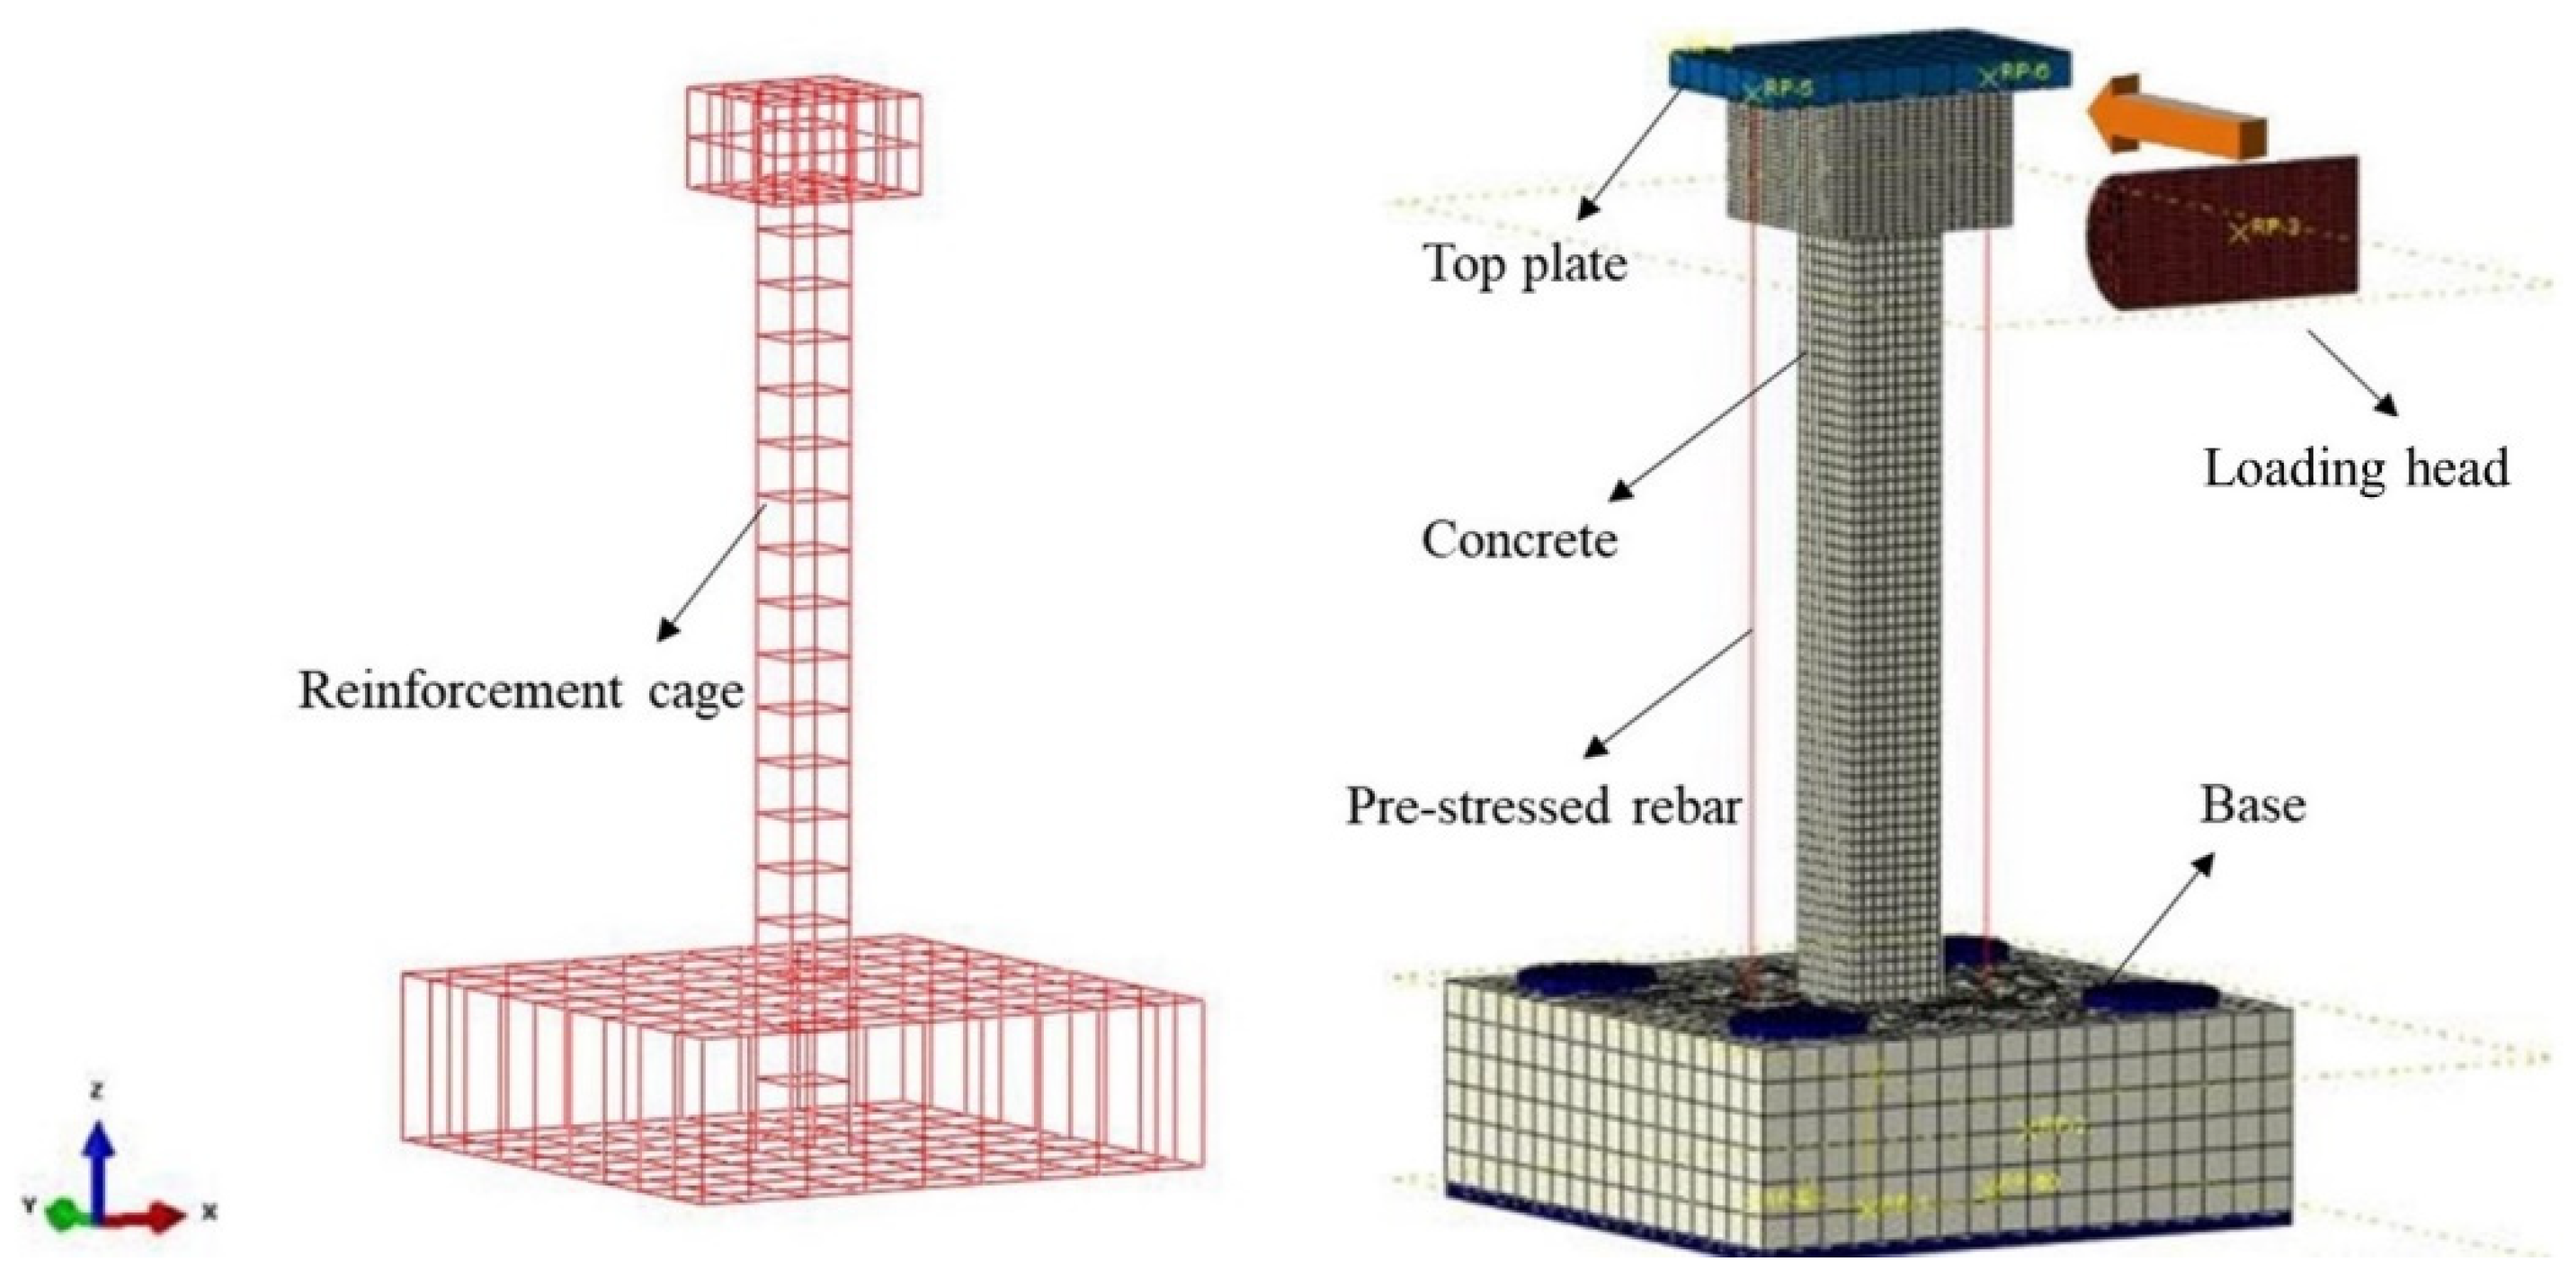
As shown in Figure 5, the RC column under horizontal impact loading is modeled using the FE software ABAQUS. The model consists of four parts, namely, concrete, rebar cage, loading head, and restraint devices (top steel plate, base, and prestressing bars). The concrete, impactor, and steel plate are modeled using three-dimensional eight-node reduced integration solid elements (C3D8R), and the rebars and prestressing bars are modeled using B31 beam elements. The steel plate is defined as a rigid body.
Since the impact truck has a larger stiffness and inertia than the specimen, the plastic deformation of the impact truck is much smaller, even under an impact with a large energy. To simplify the calculation, a semicylindrical steel block with a diameter of 200 mm and a height of 400 mm and with a simple geometry was used to replace the impact truck. The impact mass of the block was kept consistent with that of the impact truck by adjusting the density of the block.

2.2.2. Material Model

(1)
Concrete
The concrete material is simulated using the concrete damaged plasticity (CDP) model in the ABAQUS material library, in which the constitutive relation under the uniaxial state is set according to the Code for Design of Concrete Structure (GB50010-2010) [17], as seen in Table 1. Meanwhile, since the paper simulates the impact load, instead of the long-term static load, the influence of the concrete aging [18] was not considered.
To consider the enhancement effect of the strain rate on concrete material, the calculation equations of the dynamic compressive and tensile strengths suggested by the Comité Euro-International du Béton (CEB) [19] are utilized:
σ c ,   d / σ c ,   s = { ( ε ˙ / ε ˙ c ,   s ) 1.026 α γ ( ε ˙ / ε ˙ c ,   s ) 1 / 3 ε ˙ 30 / s ε ˙ > 30 / s
σ t ,   d / σ t ,   s = { ( ε ˙ / ε ˙ t ,   s ) 1.016 α λ ( ε ˙ / ε ˙ t ,   s ) 1 / 3 ε ˙ 30 / s ε ˙ > 30 / s
where ε ˙ is the strain rate; σc,d and σt,d are the dynamic compressive strength and dynamic tensile strength, respectively; and σc,s and σt,s are the compressive and tensile strengths under quasi-static conditions corresponding to the reference strain rates ε ˙ c , s = 3.0 × 10 5 / s and ε ˙ t , s = 3.0 × 10 6 / s , respectively. Under compressive conditions, lgγ = 6.156α − 0.492 and α = 1/(5 + 0.9fcu), in which fcu is the compressive strength of the cube test block, while under tensile conditions, lgλ = 7δ − 0.5 and δ = 1/(10 + 0.6ftu), in which ftu is the tensile strength of the cube test block.
(2)
Rebar
The constitutive relation of rebar is simulated using a bilinear elasto-plastic model with kinematic hardening, in which the yield strength and tensile strength are obtained according to the measured values in the tensile test of the material properties, and specific parameters are set as shown in Table 2.
Previous studies have shown that the yield strength of steel shows a significant strain rate effect under impact [20,21]. In this simulation analysis, the influence of the strain rate is considered using the classical Cowper–Symonds model [22], as seen in Formula (3):
σ y = [ 1 + ( ε ˙ C ) 1 / p ] ( σ 0 + β E p ε eff p )
where σ0 is the yield strength of rebar under quasi-static loading; ε ˙ is the strain rate; C and p are the strain rate-related parameters in the Cowper–Symonds model, with their values set to 40 s−1 and 5 [23], respectively; β is the strain hardening parameter, which takes the values of 0 and 1 to represent kinematic hardening and isotropic hardening, respectively. Since the rebars in this paper are simulated using a bilinear plastic kinematic hardening model, β is taken as 0. Therefore, the model can be further simplified into the following form:
σ y = σ 0 [ 1 + ( ε ˙ C ) 1 / p ]

2.2.3. Application of the Axial Compression

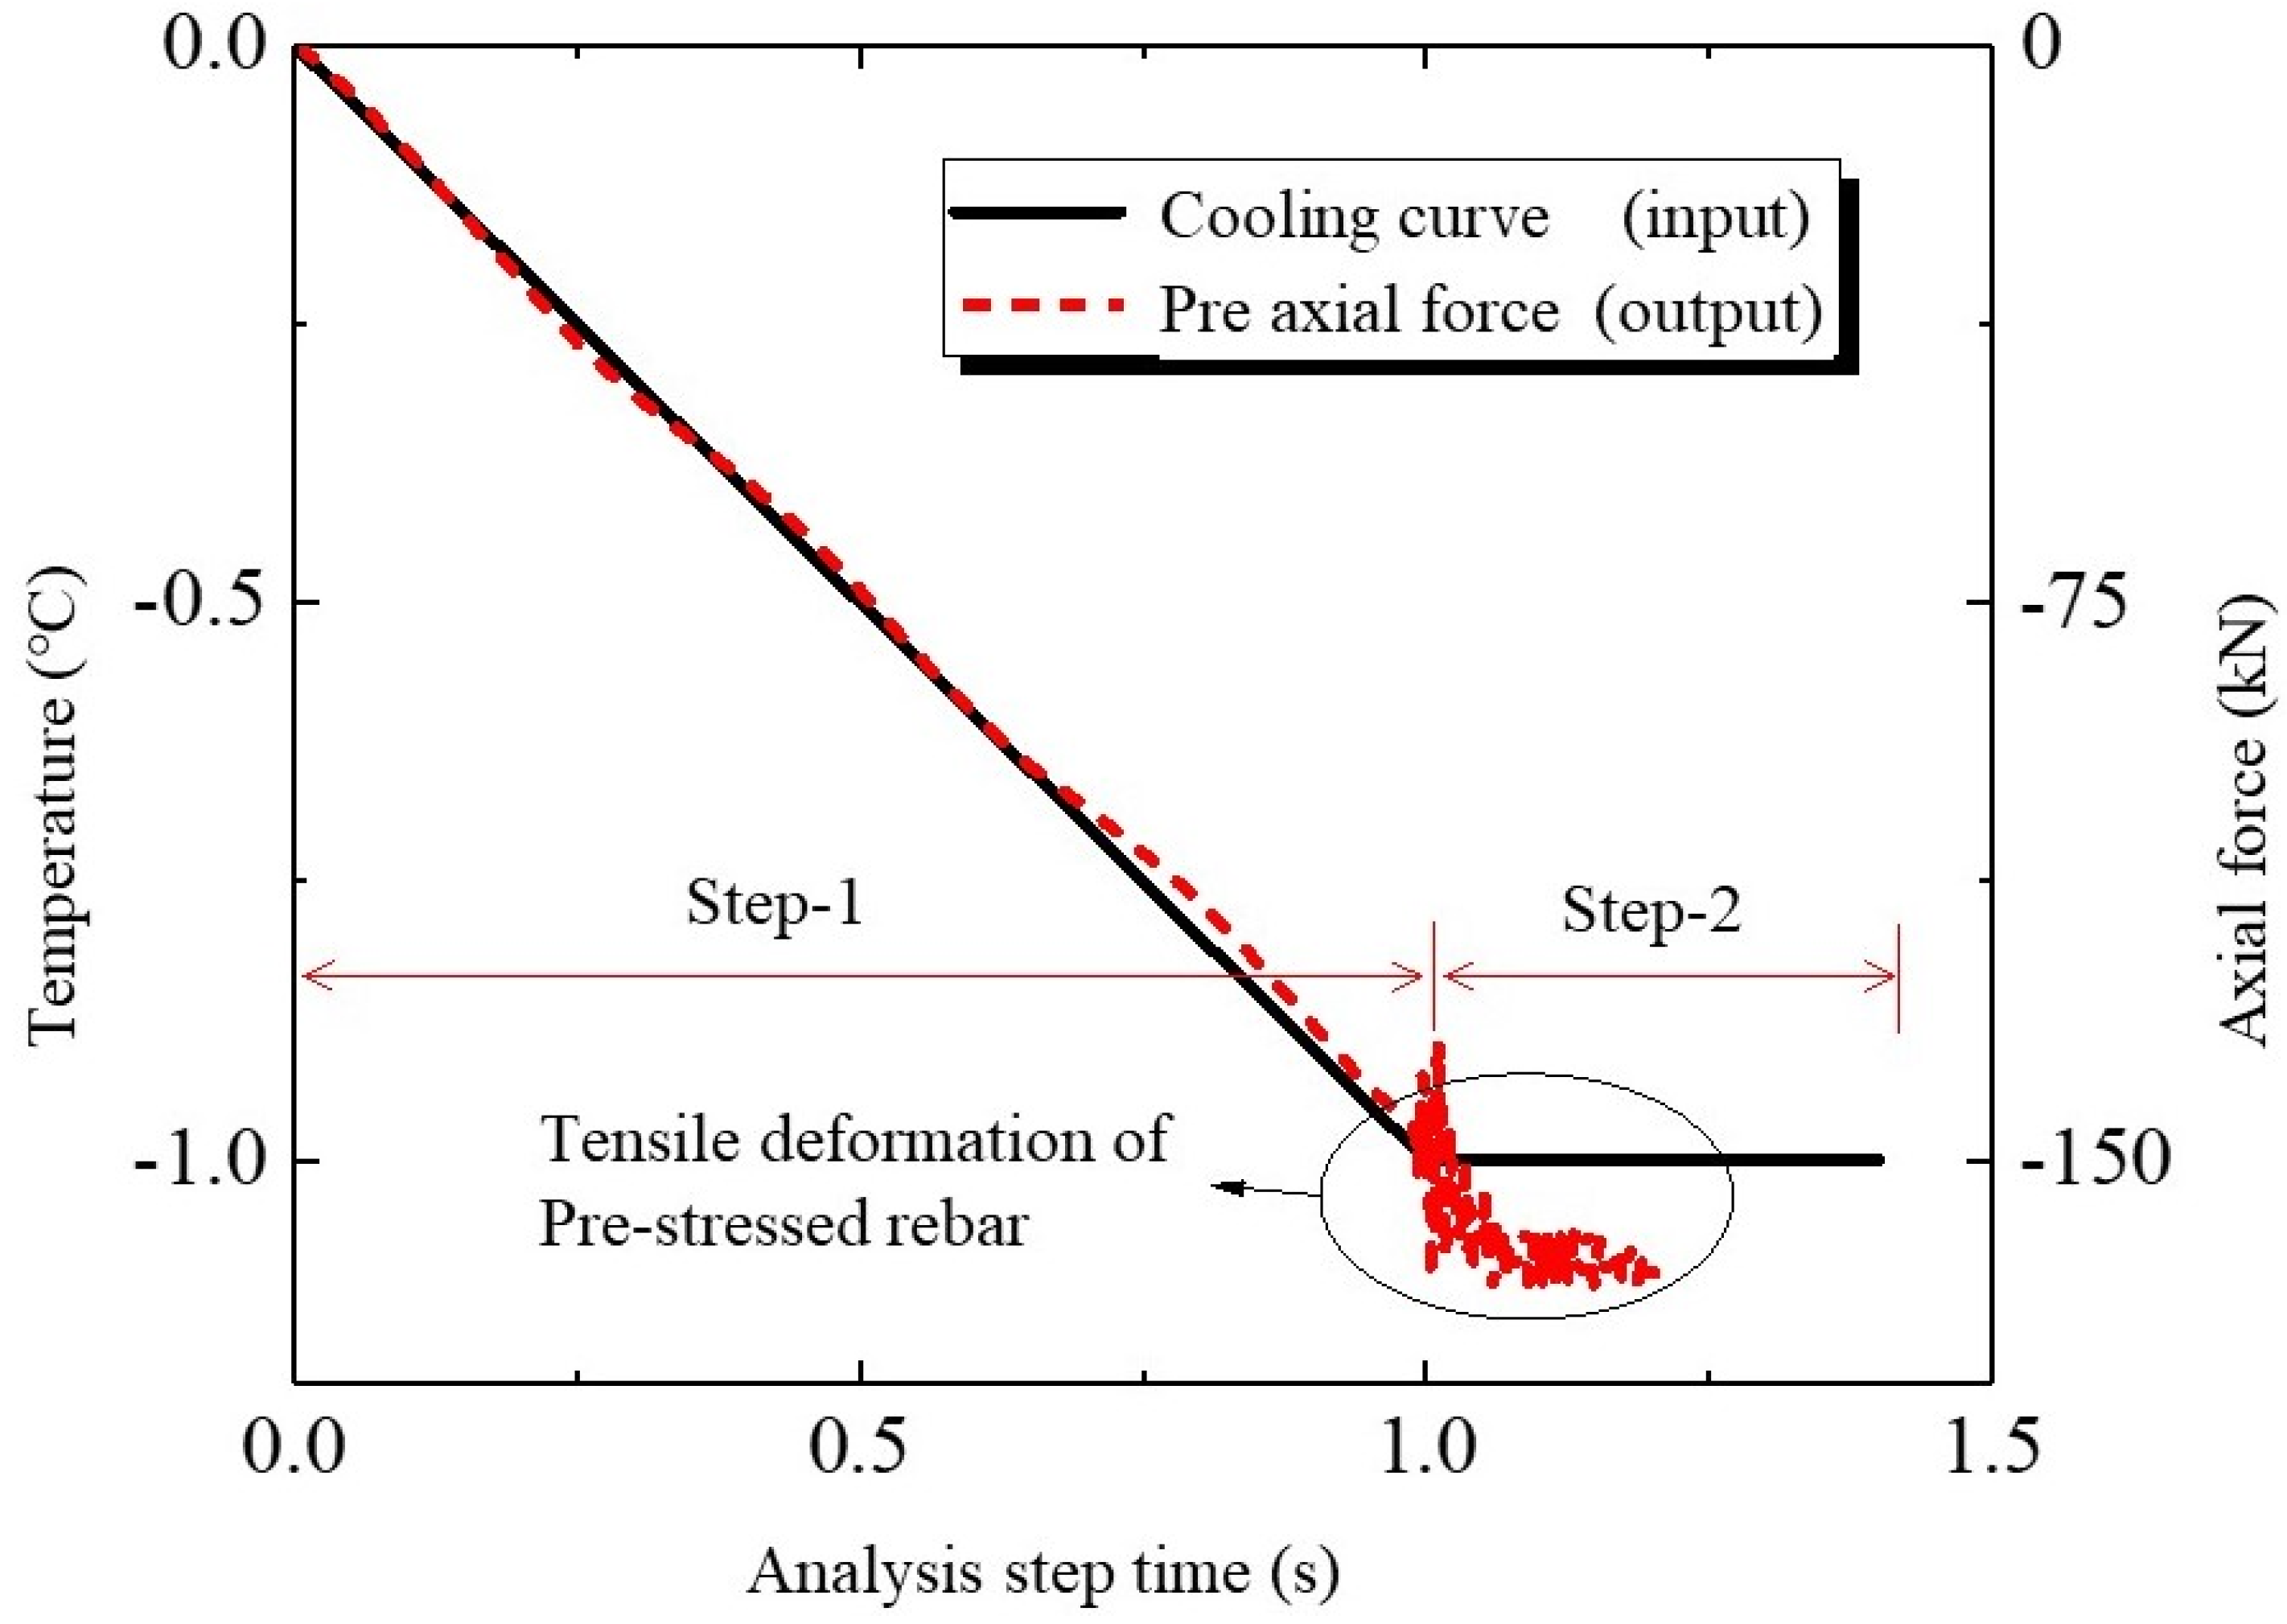
In this study, the shrinkage stress of the prestressing bars is obtained by the cooling method, which drags the steel backing plate downward to press the specimen in order to simulate the device that applies axial compression in the impact test (see Figure 3b in the paper). To implement this method, the linear expansion coefficient α in the material properties of the prestressing bars is defined first, and then the initial and target temperature fields (0 and −1 °C, respectively) are defined in the initial step and in analysis Step 1, respectively. Taking the DZ150 series specimens with an axial compression ratio of 0.1 as an example, the linear expansion coefficient α is specifically calculated as follows:
α = N 0 2 E A · Δ t = 150 kN 2 × 210 GPa × ( π × 7.5 × 7.5 mm 2 ) × 1 = 0.002
where N0/2 is the tensile force of a single prestressing bar, E is the modulus of elasticity, Δt is the temperature difference, and A is the cross-sectional area of the prestressing bar.
As shown in Figure 6, in Step 1, after the prestressing bars shrink according to the preset cooling curve, the axial compression on the specimen gradually increases and precisely reaches the target axial compressive load at the end of Step 1. In analysis Step 2, because the amplitude curve as the input is not smooth but has an inflection point, the axial force loading oscillates with a small amplitude. After that, the prestressing bars bend and elongate with the deformation of the specimen, so the axial compression increases slightly compared to the initial value.

2.2.4. Contact and Boundary Conditions

To simulate the fixed boundary conditions at the bottom of the column in the actual test, the base in Figure 5 is defined as a rigid body, with its six degrees of freedom (DOFs) completely constrained (Ux = URx = 0, Uy = URy = 0, Uz = URz = 0); the impactor is fixed at five DOFs (URy = 0, Ux = URx = 0, Uz = URz = 0) and allowed to move only in the direction of DOF Uy. In the predefined field, the impactor is given an initial velocity in the Uy direction, with the velocity property defined as “Translational Only”, which means that the impactor can only move along a straight line at a constant velocity. The top steel plate is also defined as a rigid body, but its DOFs are not constrained.
A surface-to-surface contact is established between the steel backing plate and the top surface of the column cap of the specimen. The contact surface has a property of a “hard” contact in its normal direction, which only transfers the force in the normal direction of the contact surface and allows for the separation of the steel backing plate element from the concrete element; the contact force is zero when separation occurs.
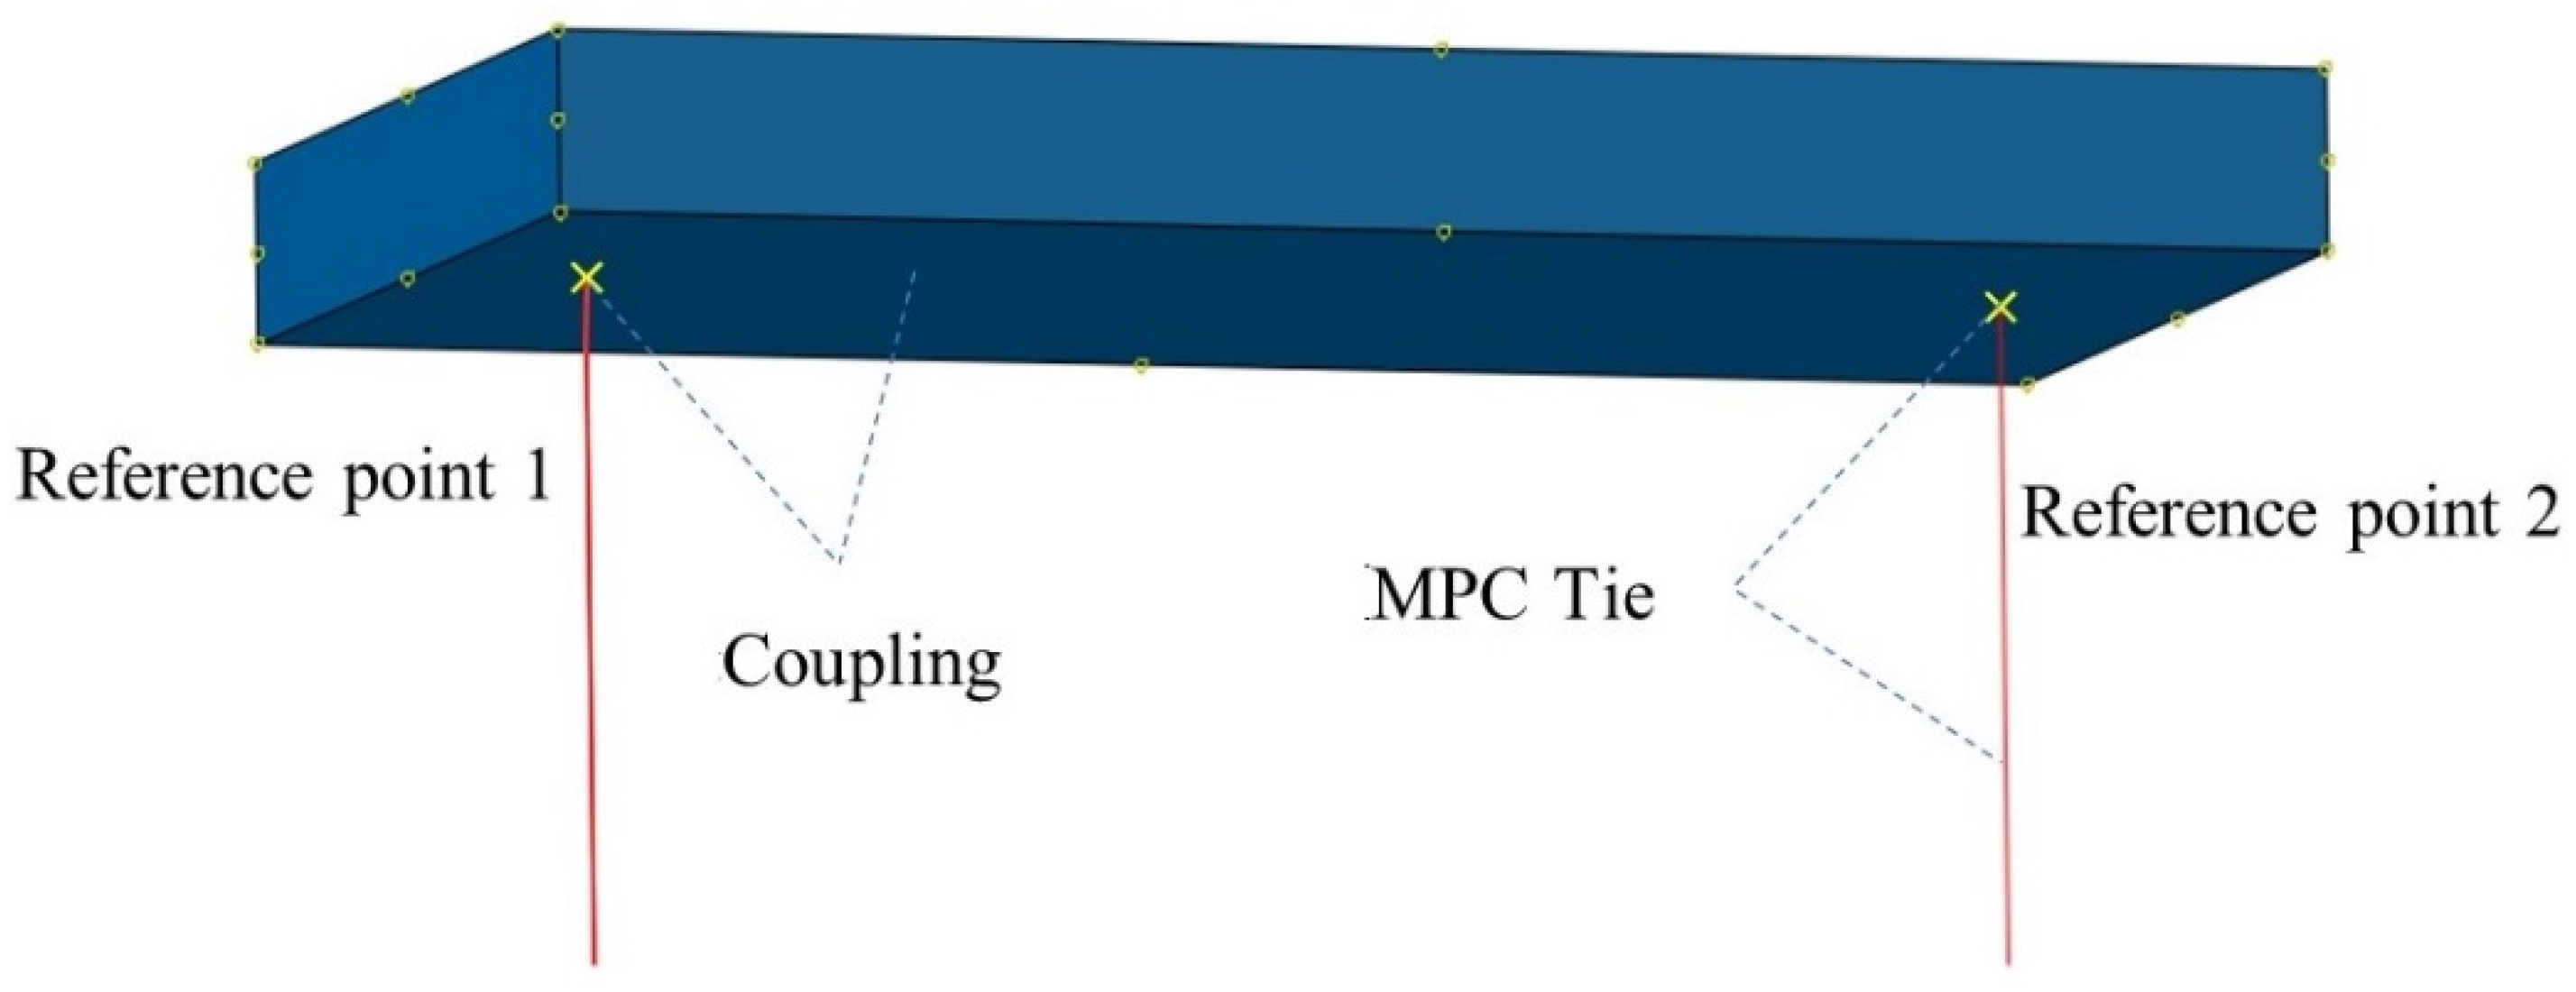
The nodes are connected for the axial force application device composed of the top plate, the prestressing bars, and the base, as shown in Figure 7. Taking the method of connection between the top plate and the prestressing bars as an example, a reference point is established at each of the two connections, the top plate and the reference point are constrained by point-surface coupling, and the reference point and the top point of the prestressing bar are constrained by a point-point MPC tie. The same nodal connection method is adopted between the lower prestressing bars and the base.
The initial position of the loading head method under a static load is different from those under impact. Under a static load, the initial gap between the loading head and the concrete surface is set to 0. After the prestress is applied by the cooling method in Step 1 (with an analysis time of 1 s), a linearly varying horizontal displacement is applied to the loading head only when Step 2 starts, and the other five DOFs (i.e., except the horizontal DOF) are constrained. In comparison, under a horizontal impact, since the initial velocity needs to be predefined in the “Predefined field” in the initial step “Initial”, the initial gap between the loading head and the concrete surface is set to s = v0t (where v0 is the impact velocity of the loading head and t is the time of Step 1, i.e., 1 s). When Step 1 starts, the prestressing bars cool down and contract according to the cooling curve, while the loading head moves horizontally at an initial velocity v0 with the same boundary constraints as those under a static load. When the analysis step time reaches 1 s, the calculation in Step 1 is ended, and at this time, the application of the axial force has been completed and the loading head moves exactly to the surface of the column cap of the specimen, enabling the two to contact and impact one another as soon as Step 2 starts.

2.2.5. Analysis Method

The calculation of the model is performed in ABAQUS using the central difference method. The resultant forces on the nodes (i.e., the difference between the external force vector P and the internal force vector I of elements) are the product of the mass matrix M and the acceleration vector of nodes u ¨ :
M u ¨ = P I
The acceleration at time is t is
u ¨ | ( t ) = ( M ) 1 · ( P I ) | ( t )
Assuming that the acceleration is constant, the velocity at the midpoint of the current increment step is determined by
u ˙ | ( t + Δ t 2 ) = u ˙ | ( t Δ t 2 ) + ( Δ t | ( t + Δ t ) + Δ t | ( t ) ) 2 u ¨ | ( t )
The displacement at the end of the incremental step is obtained as
u | ( t + Δ t ) ) = u | ( t ) + Δ t | ( t + Δ t ) × u ˙ | ( t + Δ t 2 )
The advantage of the explicit integration method is that the state at the end of the incremental step depends only on the displacement, velocity, and acceleration at the beginning of the incremental step. As a result, simultaneous equations do not need to be solved, so the computational cost of each incremental step is low. In this paper, the calculation method of automatic stable time step increment of ABAQUS/explicit module was used for analysis and calculation. According to the ABAQUS/explicit user document, the calculation of the stability time step is related to the element length, the elastic modulus and the density.

2.2.6. Mesh Size Sensitivity

Taking the specimen with section size of 150 mm as an example, three different mesh sizes (40 mm, 25 mm and 10 mm) were adopted. With the increase of the number of mesh elements, the calculation cost of the model increased significantly (Table 3), but the difference in the structural response was not obvious. Therefore, in order to ensure the calculation accuracy of the model and effectively improve the calculation efficiency, 25 mm mesh was used for the geometric models of concrete and reinforcement.

2.3. Comparison of the Simulation and Test Results under Static Load

Figure 8 compares the FE results (the equivalent plastic strain contour map of concrete) and the final experimental failure modes of the RC columns with three different cross-sections [16]. At the peak bearing capacity, each specimen finally undergoes flexure failure, which is mainly characterized by yielding of the longitudinal tensile rebars and concrete damage concentrated at the bottom of the column, forming a plastic hinge, which shows agreement with the test results.
Figure 9 compares the load-column top displacement curves obtained from the test [16] and numerical simulations. The experimental and simulated initial stiffnesses are essentially the same, and the errors of the peak bearing capacities of the three sets of specimens are between −11.43% and 6.35%, indicating the reliability of the bearing capacity by numerical simulation. Additionally, during the test, with the full development of flexural cracks in the concrete in the tension zone, the longitudinal rebars yielded, the concrete cover in the compression zone spalled, and all specimens eventually exhibited yielding of the tensile rebars and flexural crushing of concrete in the compression zone. However, according to the FE simulation results, there is no crushing or spallation of concrete, and the simulated damage state of the concrete differs from the failure of the actual specimens. In addition, the number of tested specimens was limited, resulting in the dispersion of the experimental data. Therefore, the experimental and simulated load-displacement curves differ to some extent. Nevertheless, the load-displacement curves and the maximum bearing capacities of the specimens obtained from the numerical simulation are in overall good agreement with the test results.

2.4. Comparison of the Simulation and Test Results under a Horizontal Impact

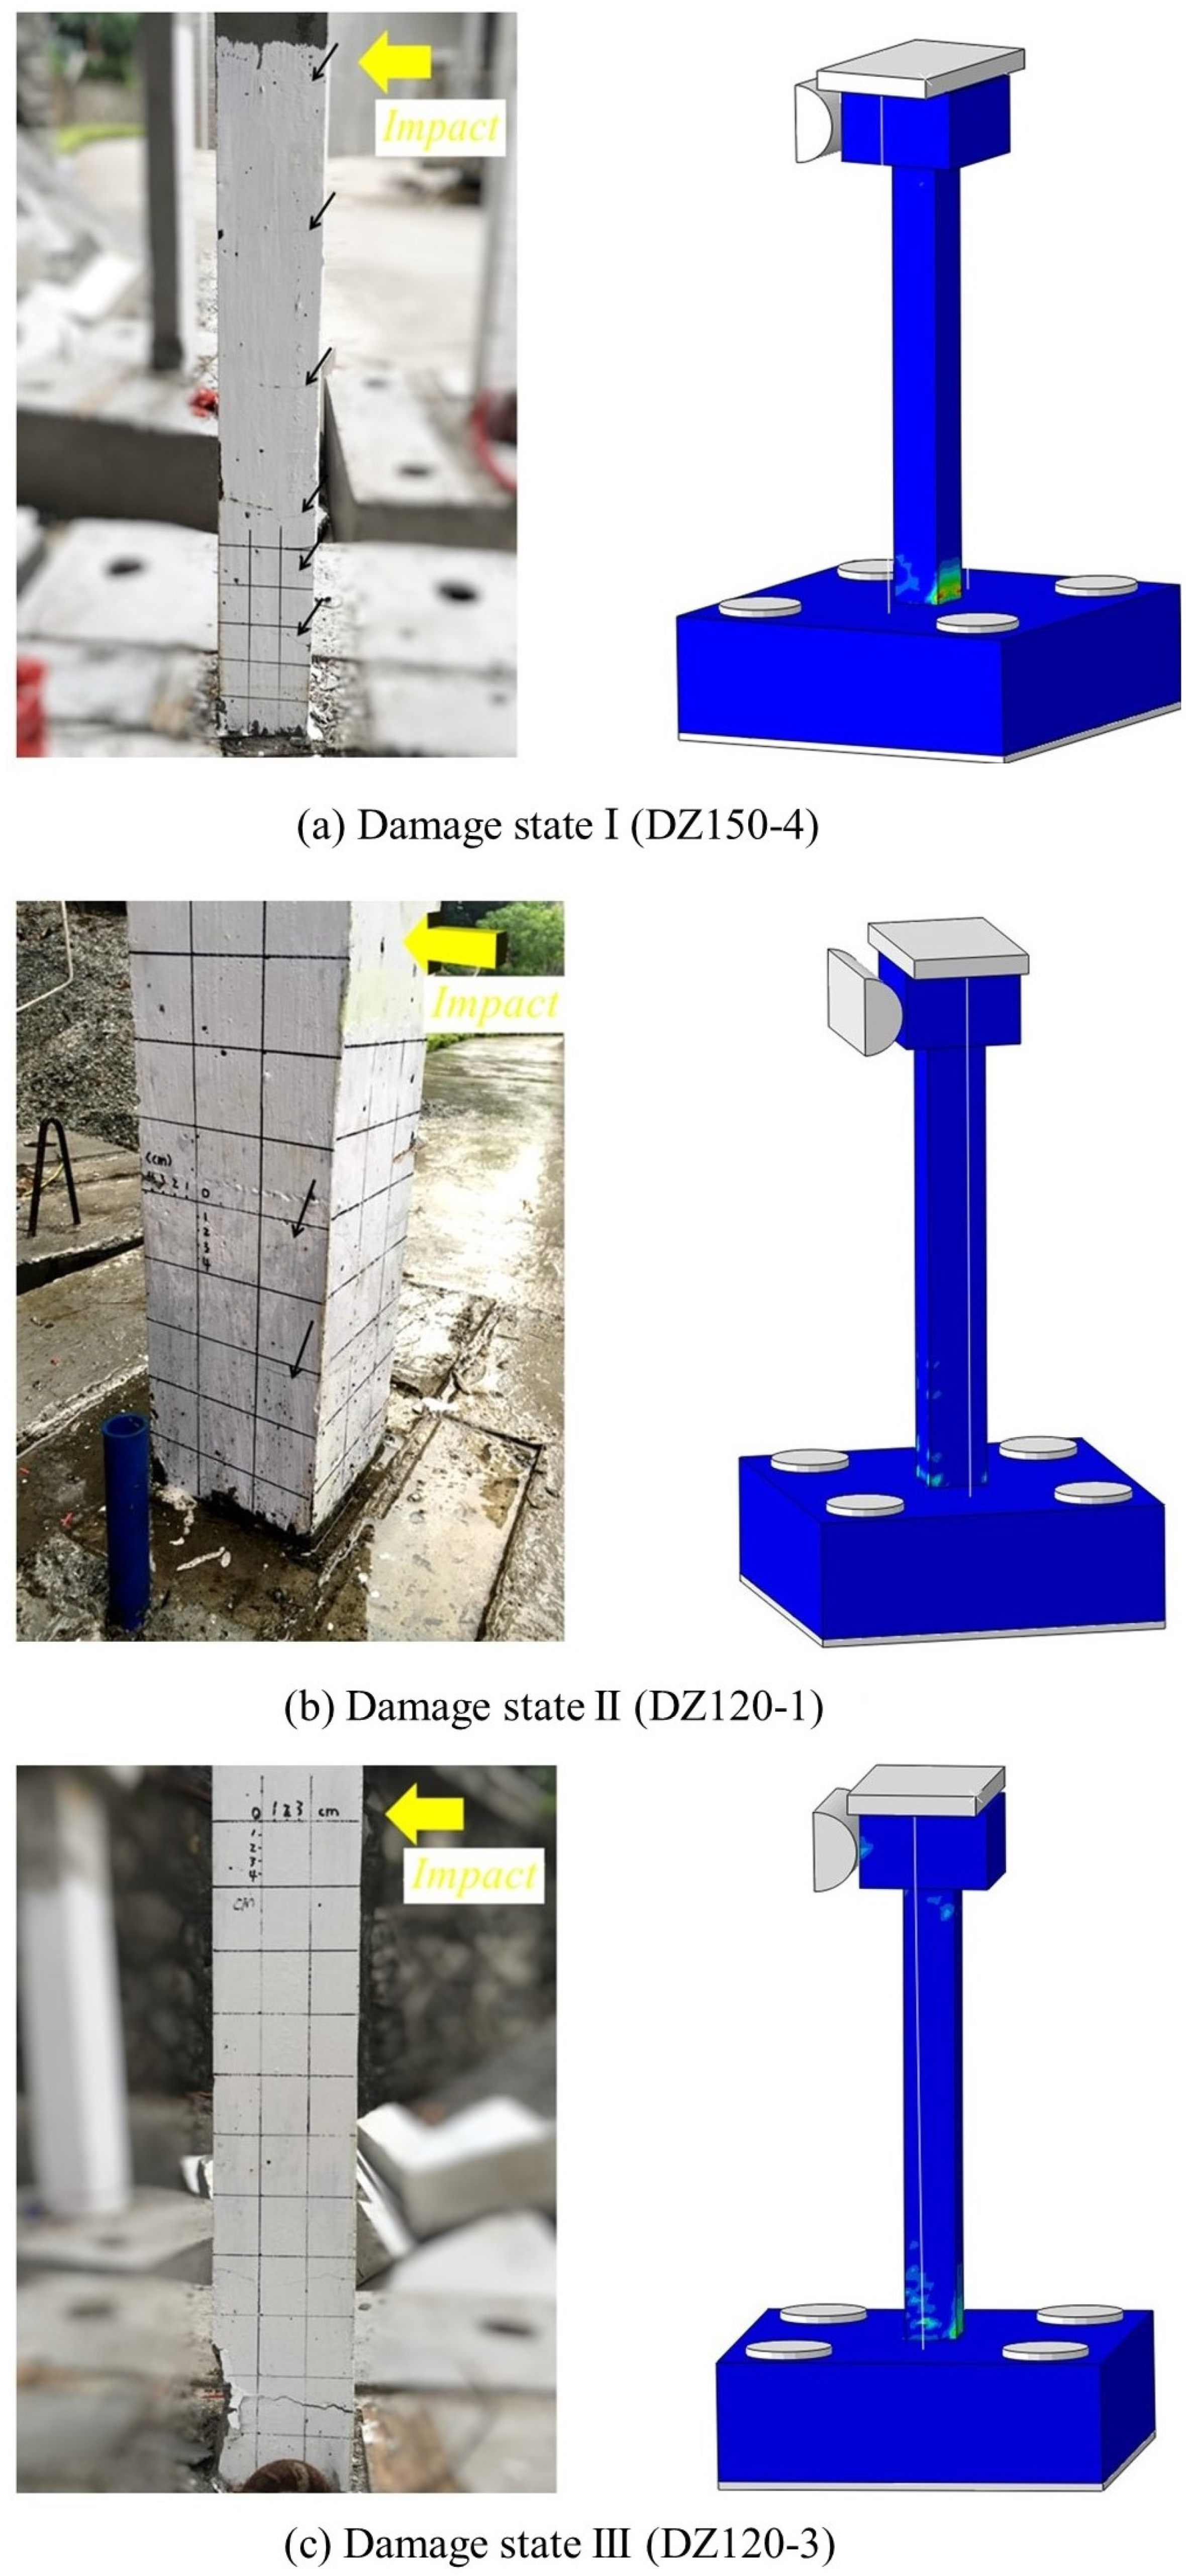
Figure 10 compares the FE results (the equivalent plastic strain contour map of concrete) and the experimental damage states of each specimen [16]. The FE results show agreement with the three experimentally observed damage states, including (I) a slight damage state (in which only fine cracks were observed on the concrete surface, and all longitudinal rebars were still in the elastic state), (II) a moderate damage state (in which the concrete cracked and the tensile longitudinal rebars yielded), and (III) a complete damage state (in which the specimen underwent flexural failure of the normal cross-section; wide flexural cracks were clearly observed in the bottom area; the tensile longitudinal rebars had yielded; and the concrete cover in the compression zone was crushed).
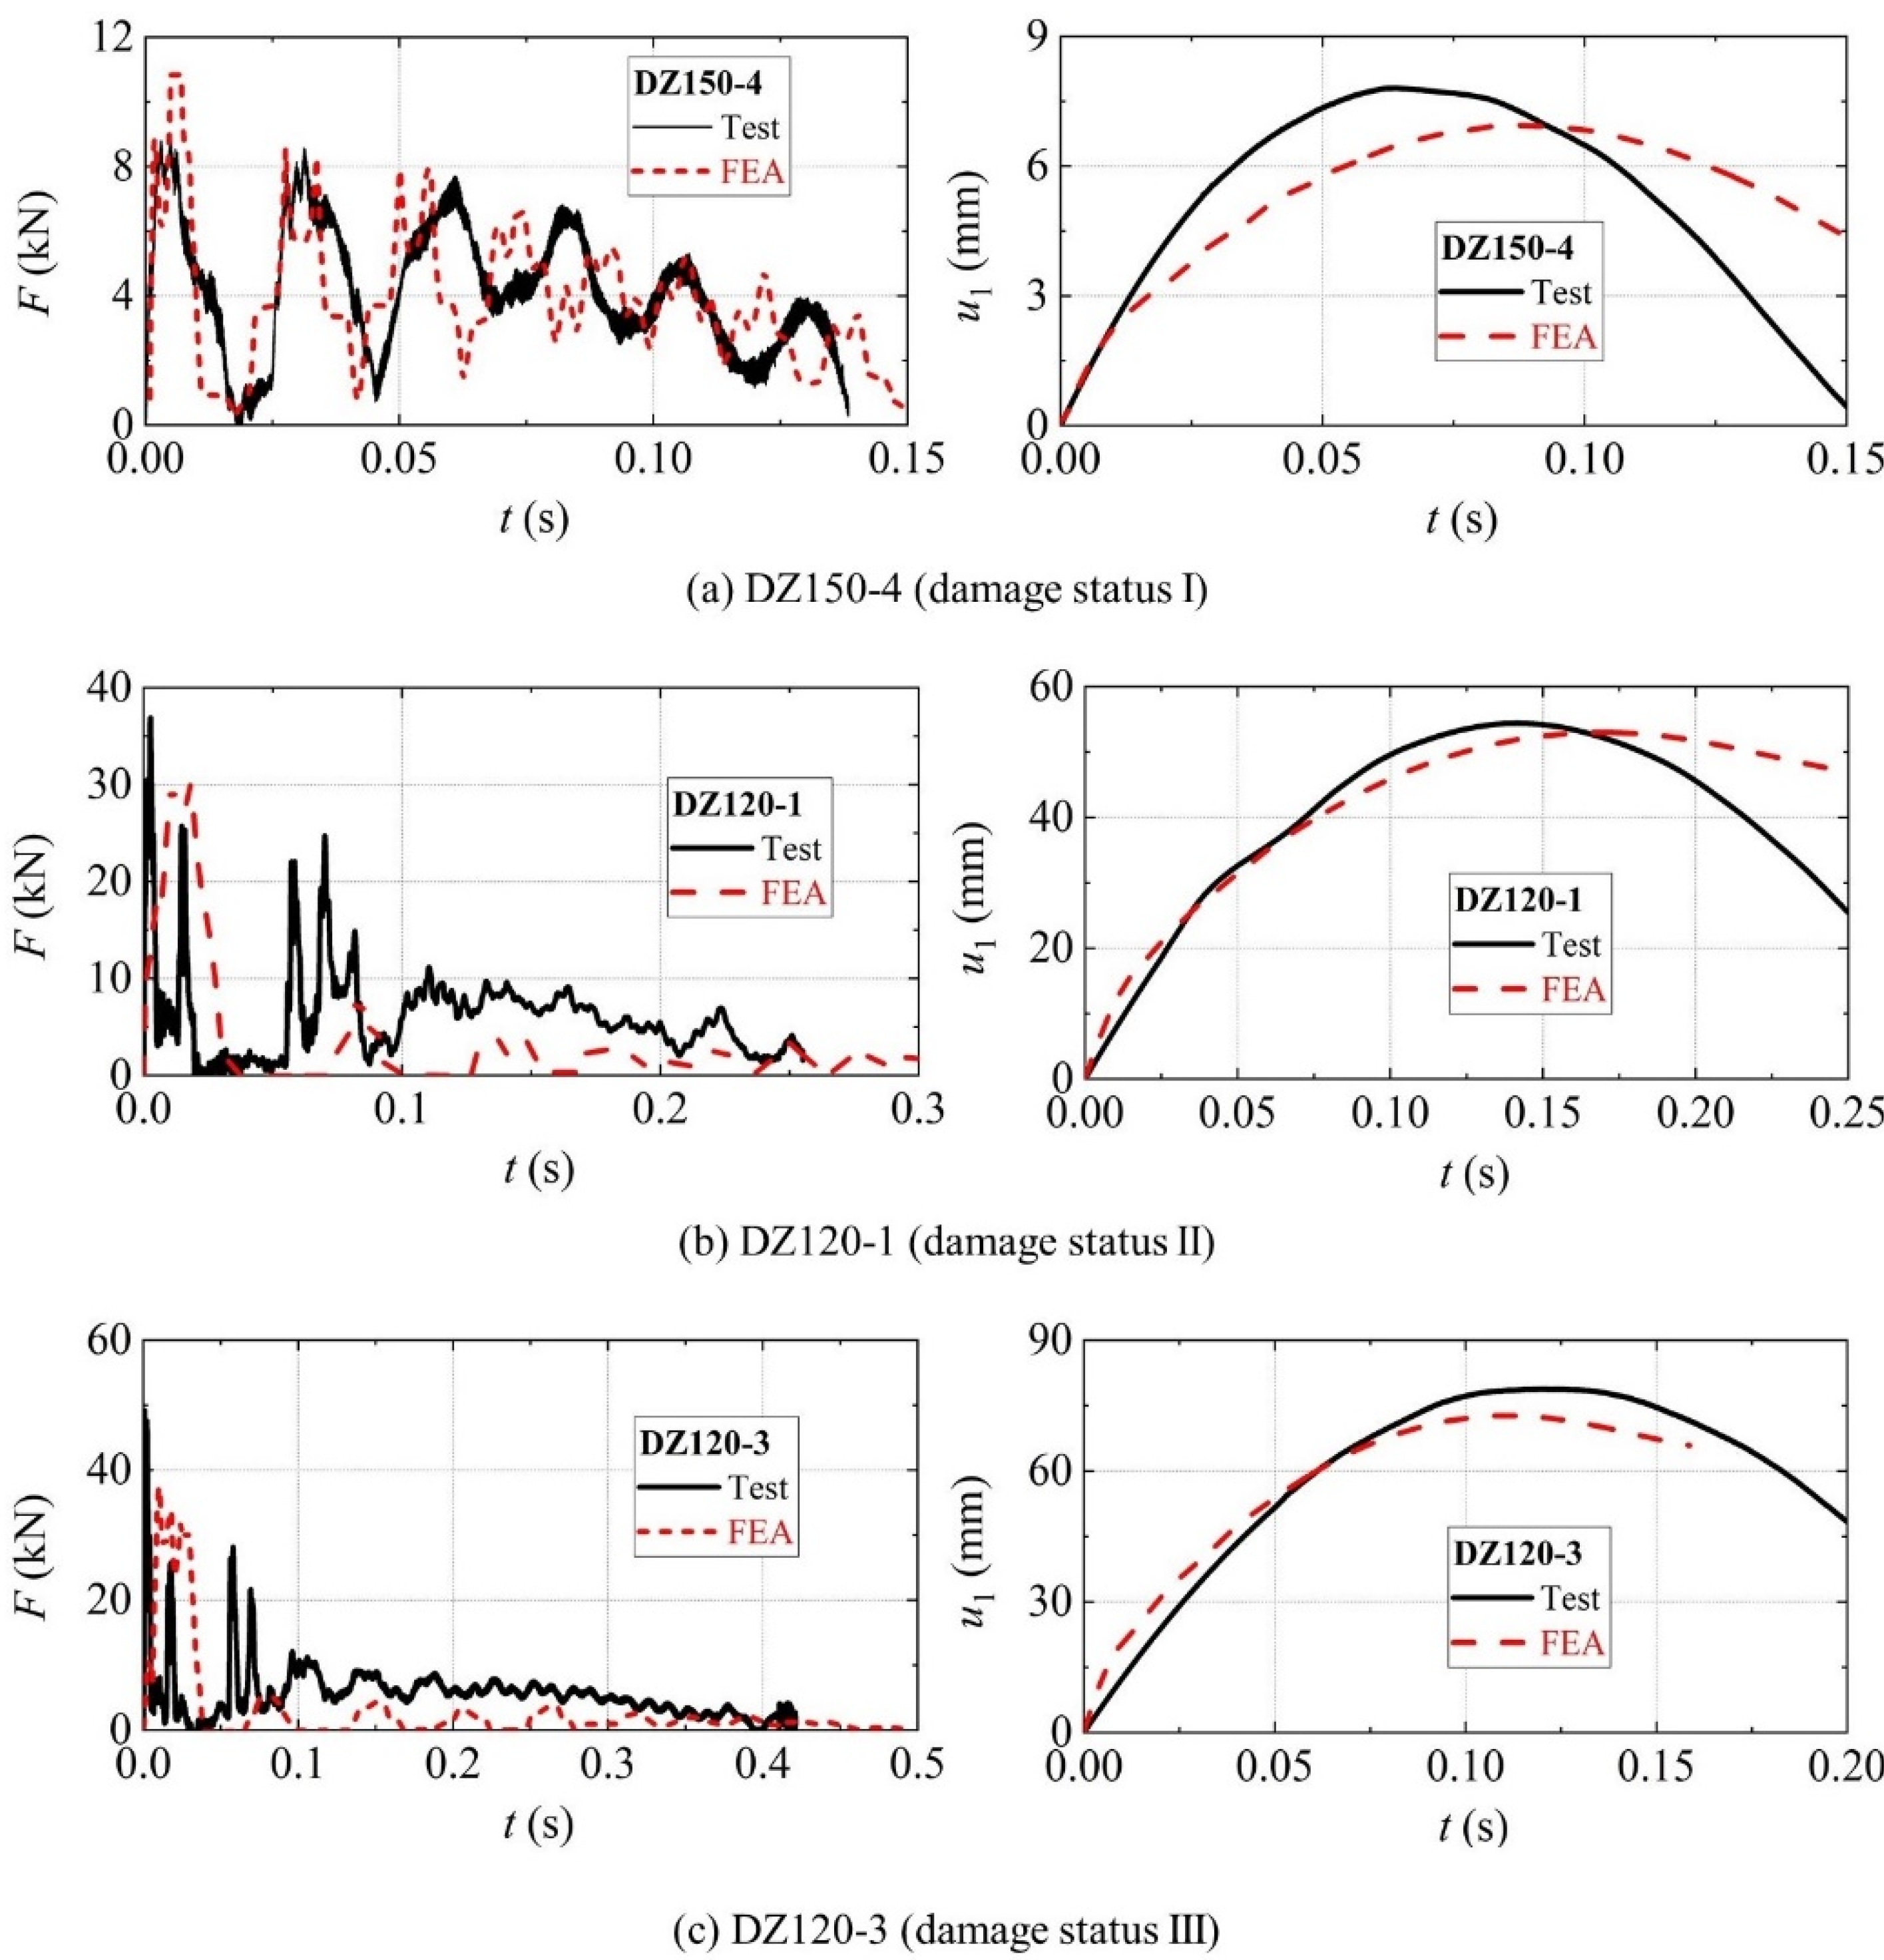
Figure 11 shows the experimental [16] and numerical simulation results of the impact force/column top displacement time history curves of the specimens in three different damage states under a horizontal impact. The experimental and simulated force time history curves generally agree well with a similar peak impact force and impact duration. The main error is that the plateau impact forces of some specimens (e.g., DZ120-1 and DZ120-3) from the numerical simulation are smaller than those from the test, the reason for which is explained as follows. Due to the presence of damping in the test, it took a relatively long time for the test truck and the specimen to exchange their velocities when they impacted for the first time. In comparison, the damping effect is not considered in the numerical model. As a result, after the impactor contacted the specimen, the specimen instantaneously acquires a higher velocity than the impactor and moves forward and even separates from the impactor. At this time, the impact force rapidly reaches its peak and then quickly drops to zero. Subsequently, the instantaneous kinetic energy acquired by the specimen is partially converted into internal energy, causing the velocity of the specimen to decrease, and the impactor thus catches up with the specimen and another impact occurs. Therefore, within 0–10 ms, the impact force time history curve obtained from numerical simulation has multiple single peaks, which dissipate the initial kinetic energy of the impactor, resulting in a slight deviation in the plateau value of the stable stage of the impact force time history curve obtained from the numerical simulation.
The column top displacement time history curves obtained from the numerical simulation and the test are consistent, with the error of the maximum displacement at the impact point ranging from 2.56% to 11.03% for the 3 sets of specimens. All the specimens have small errors, with the exception of specimen DZ150-4, which has an error greater than 10% in its simulated peak displacement relative to the experimental value. A possible reason for this relatively large error is that due to the dispersion, the dynamic strengths adopted in the FE simulation considering the strain rate effect possibly differ from the actual strengths, resulting in a slightly larger error than that of the other two specimens. It is worth mentioning that the residual deformation of the specimens obtained from the numerical simulation is larger because, to save on computation time, the termination time for the FE analysis is set short. As a result, the calculation is terminated before the prestressing bars pull the specimen back. Therefore, the deformation recovered in the numerical simulation is essentially caused by the elastic recovery ability of the specimen itself, while there is little rebound effect due to the contraction and stretching of the prestressing bars.
Figure 12 shows the experimental [16] and numerical simulation results of the impact force-column top displacement time history curves of the specimens in three different damage states under a horizontal impact. It can be seen that the trend of the load-displacement curves of the test and FEA are generally in good agreement. For the specimen DZ150-4 with a small impact energy, the test and FEA show that the specimen rebounds to the initial position after a small deformation. For the specimen DZ120-3 with large impact energy, both show that when it enters the subsequent impact stage through the “separation valley”, the component has obviously lost the load-bearing capacity, and its resistance level has dropped to near zero.

3. Load-Bearing Analysis of Columns under Impact Load

Three specimens, i.e., DZ150-4 (slightly damaged), DZ150-2 (moderately damaged) and DZ150-7 (completely damaged), which had the same cross-sectional dimension but were in different damages states, are selected from the literature 10 for an in-depth comparative analysis of the changes in cross-section shear and bending moments under static load and impact, respectively.

3.1. Cross-Sectional Shear V

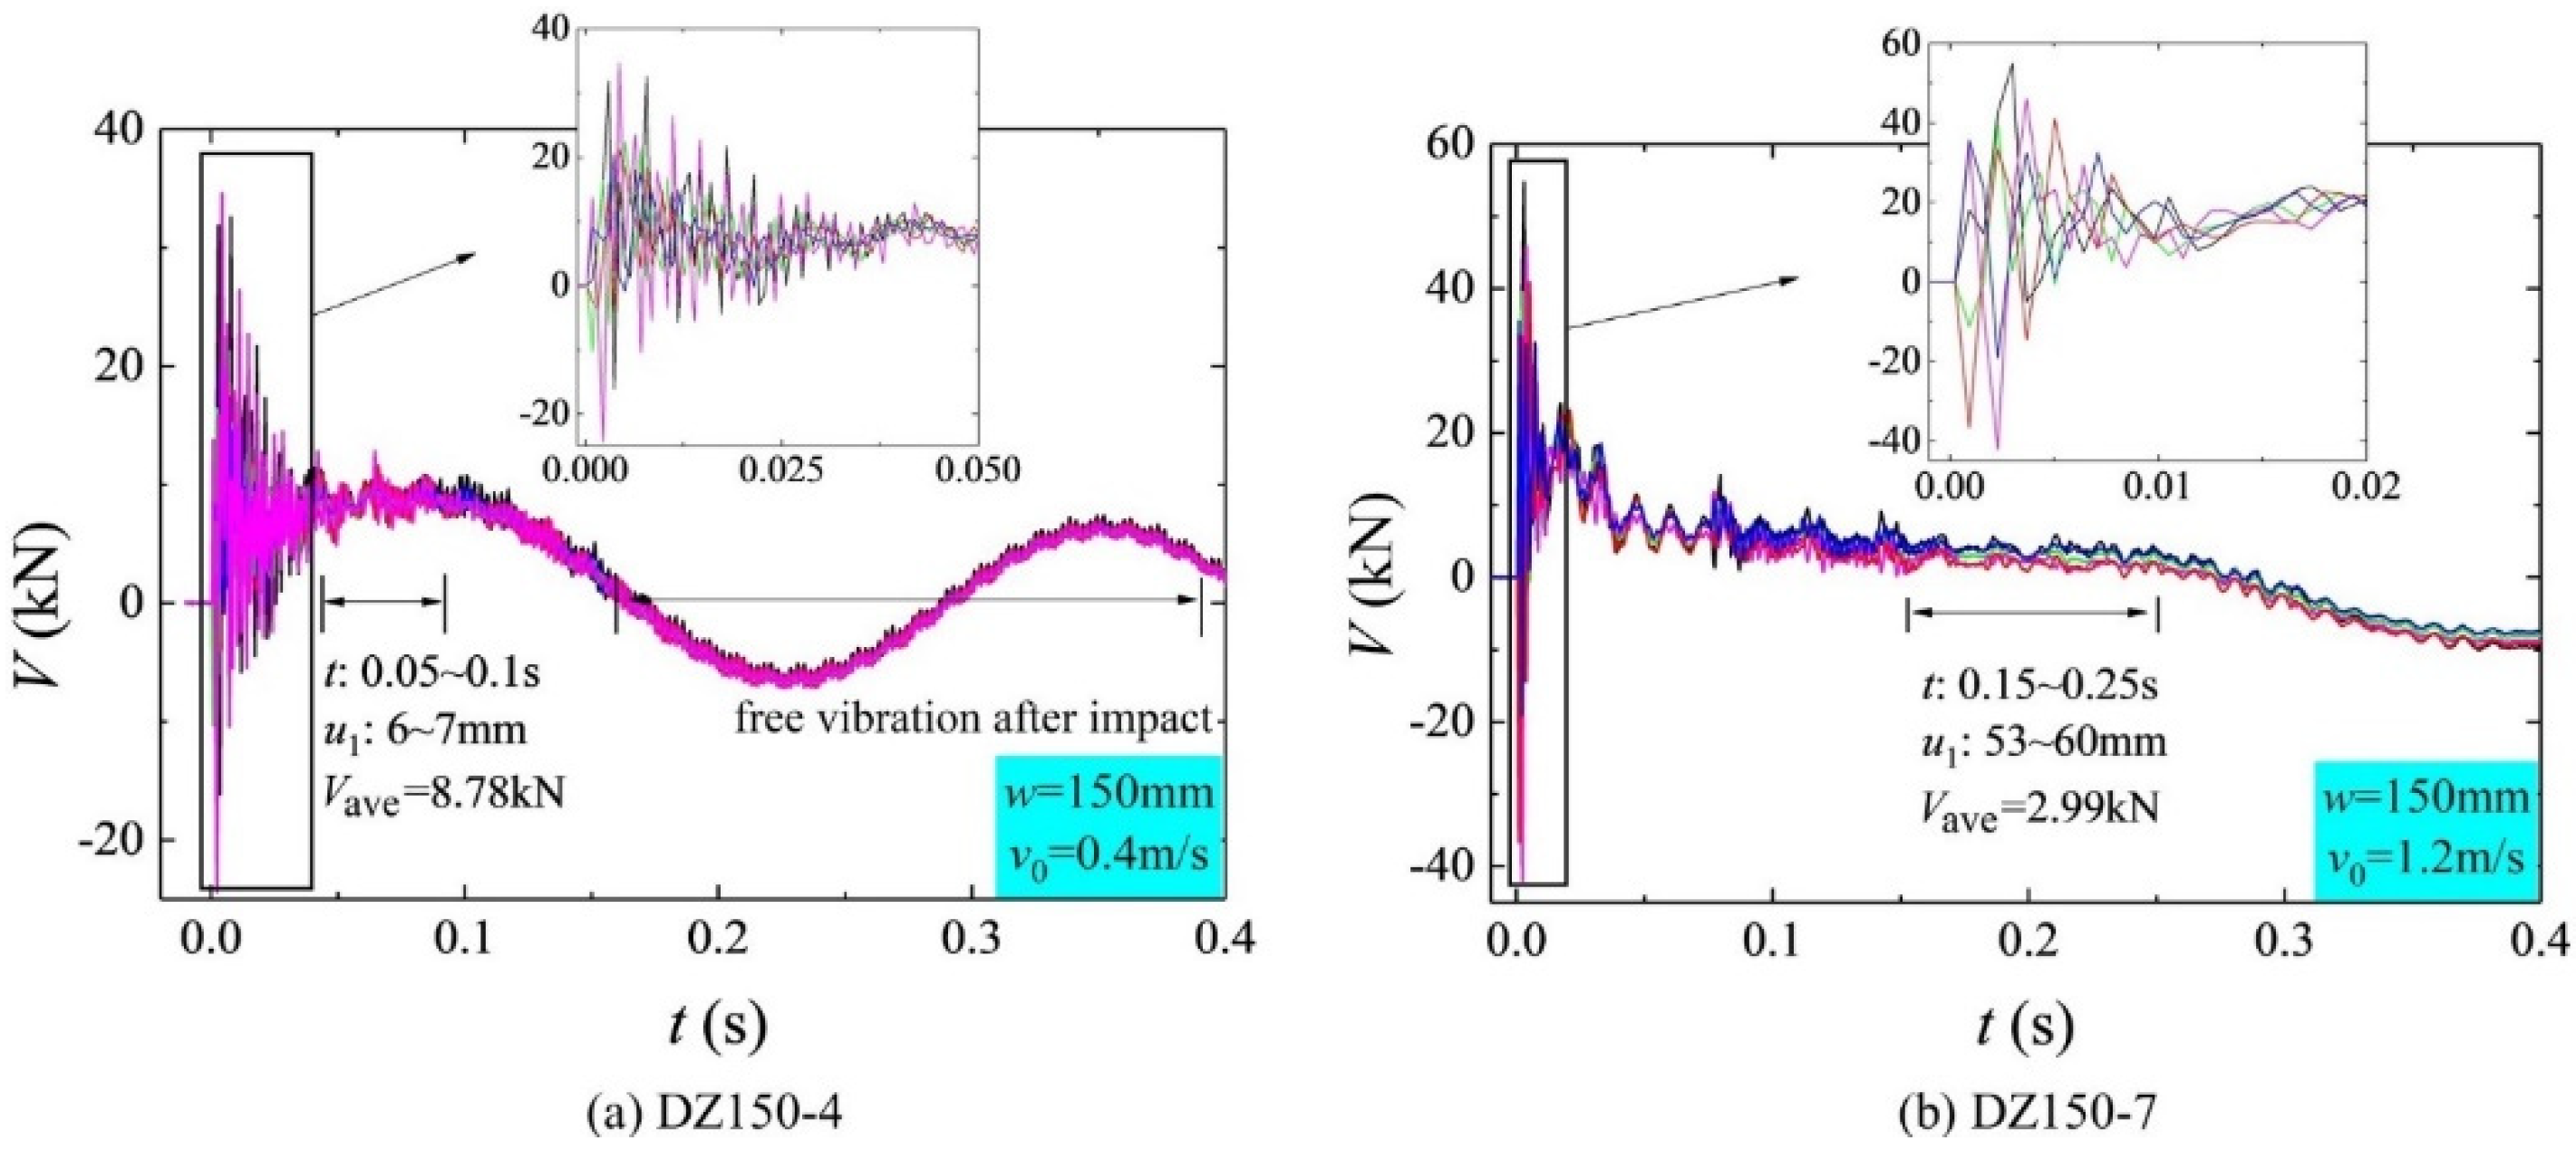
As shown in Figure 13, five cross-sections are extracted at equal intervals along the height of the column, and the variation curves of the cross-sectional shear with impact time and displacement are analyzed.
Under impact, at the instant of initial contact between the impactor and the specimen (the impact time t = 0 to 4.1 ms), due to the influence of the inertial effect [23], the sectional shear force fluctuates violently along the height direction, and a large shear force appears in both the positive and negative directions (Figure 12a), which is due to the inertial force being generated at the moment when the column is impacted. According to the balance of the horizontal force, the impact force can be obtained by adding up the inertial force and the sectional shear force, and the inertia force will change dramatically or even greater than the impact force in the impact process, which will make the sectional shear force fluctuate or even change directions. When t is 0.82 ms, the cross-sectional shear near the column cap reaches 54.02 kN. With the impact time increasing to 2.4 ms and 4.1 ms, the direction of the cross-sectional shear changes from positive to negative, and the peak absolute value of that is 34.35 kN and 57.4 kN, respectively. Under the same displacement condition, the cross-sectional shear caused by the inertia effect in this stage is far more than that under static load, and the ratio is more than 10 times greater than the shear level of 14.47 kN under the limit state of the static load (Figure 10b). According to the method for calculating the shear strength of the inclined section provided in GB50010-2010 “Code for Design of Concrete Structures” [17], the shear capacity of the inclined section of this column specimen is calculated to be 152 kN. In comparison, although the cross-sectional shear of the specimen at the instant of impact was greater than that under a static load, it did not exceed the cross-sectional shear capacity. Therefore, no obvious shear cracks were observed in the upper part of the column after the horizontal impact test. In contrast, for the RC beams with shear-to-span ratios of 6–10 subjected to drop-weight impacts in the literature [24,25], because the cross-sectional shear at the impact instant exceeded its shear capacity, a shear cone was formed at the mid-span impact point at the instant of initial impact (2 ms), which caused the final shear failure.
After the impact time reached 12.3 ms, the shear time-history curves of the five cross-sections coincided, and the variation in the cross-sectional shear along the height of the specimen gradually became consistent (Figure 13a).
After the initial impact stage, the specimen entered the stable deformation stage, during which the specimen moved “together with” the impactor. As the impact force gradually decreased, the cross-sectional shear decreased significantly. A comparison of Figure 13a,b reveals that at the same displacement level (the displacement atop column u1 ranged from 28 to 35 mm), the cross-sectional shear under impact stabilized at a level of 6.28 kN, while the shear under static load gradually decreased from 9.3 kN to 5.6 kN, which was not a significant difference. In the subsequent process, as the impactor gradually separated from the specimen, the cross-sectional shear slowly decreased to zero and the impact vibration process ended.
To investigate the effect of the impact velocity on the variation in cross-sectional shear, Figure 14a,b shows the time-history curves of the shear of the five cross-sections of specimens DZ150-4 and DZ150-7 with v0 = 0.4 m/s and v0 = 1.2 m/s, respectively, which are compared with those of specimen DZ150-2 with v0 = 0.8 m/s in Figure 10a. It is determined that after entering the stable deformation stage, the effect of the increase in velocity on the shear response was mainly reflected as follows: (1) the impact duration substantially increased and (2) the shear at the plateau stage decreased. When v0 was 0.4 m/s, the cross-sectional shear was approximately V = 8.78 kN. As v0 increased to 0.8 m/s and 1.2 m/s, the plateau value decreased to 6.28 kN and 2.99 kN, respectively, mainly because the 3 specimens had produced a large deformation after the shear responses of those entering the platform stage. In the plateau stage of shear, the displacements u1 corresponding to the three specimens with velocities varying from small to large ranged from 6–7, 28–35, and 53–60 mm. Combined with Figure 13b, it is seen that these three deformation stages under static load exactly represented different performance levels and that the internal shears at the same displacement level under the two different loading conditions only slightly differed.
In summary, under the same displacement condition, the cross-sectional shear at the instant of impact is substantially greater (more than 10 times) than that under a static load. With the gradual weakening of the external impact, the cross-sectional shears generated by the two types of loads (impact and static load) at the same displacement level do not differ significantly.

3.2. Cross-Sectional Bending Moment M

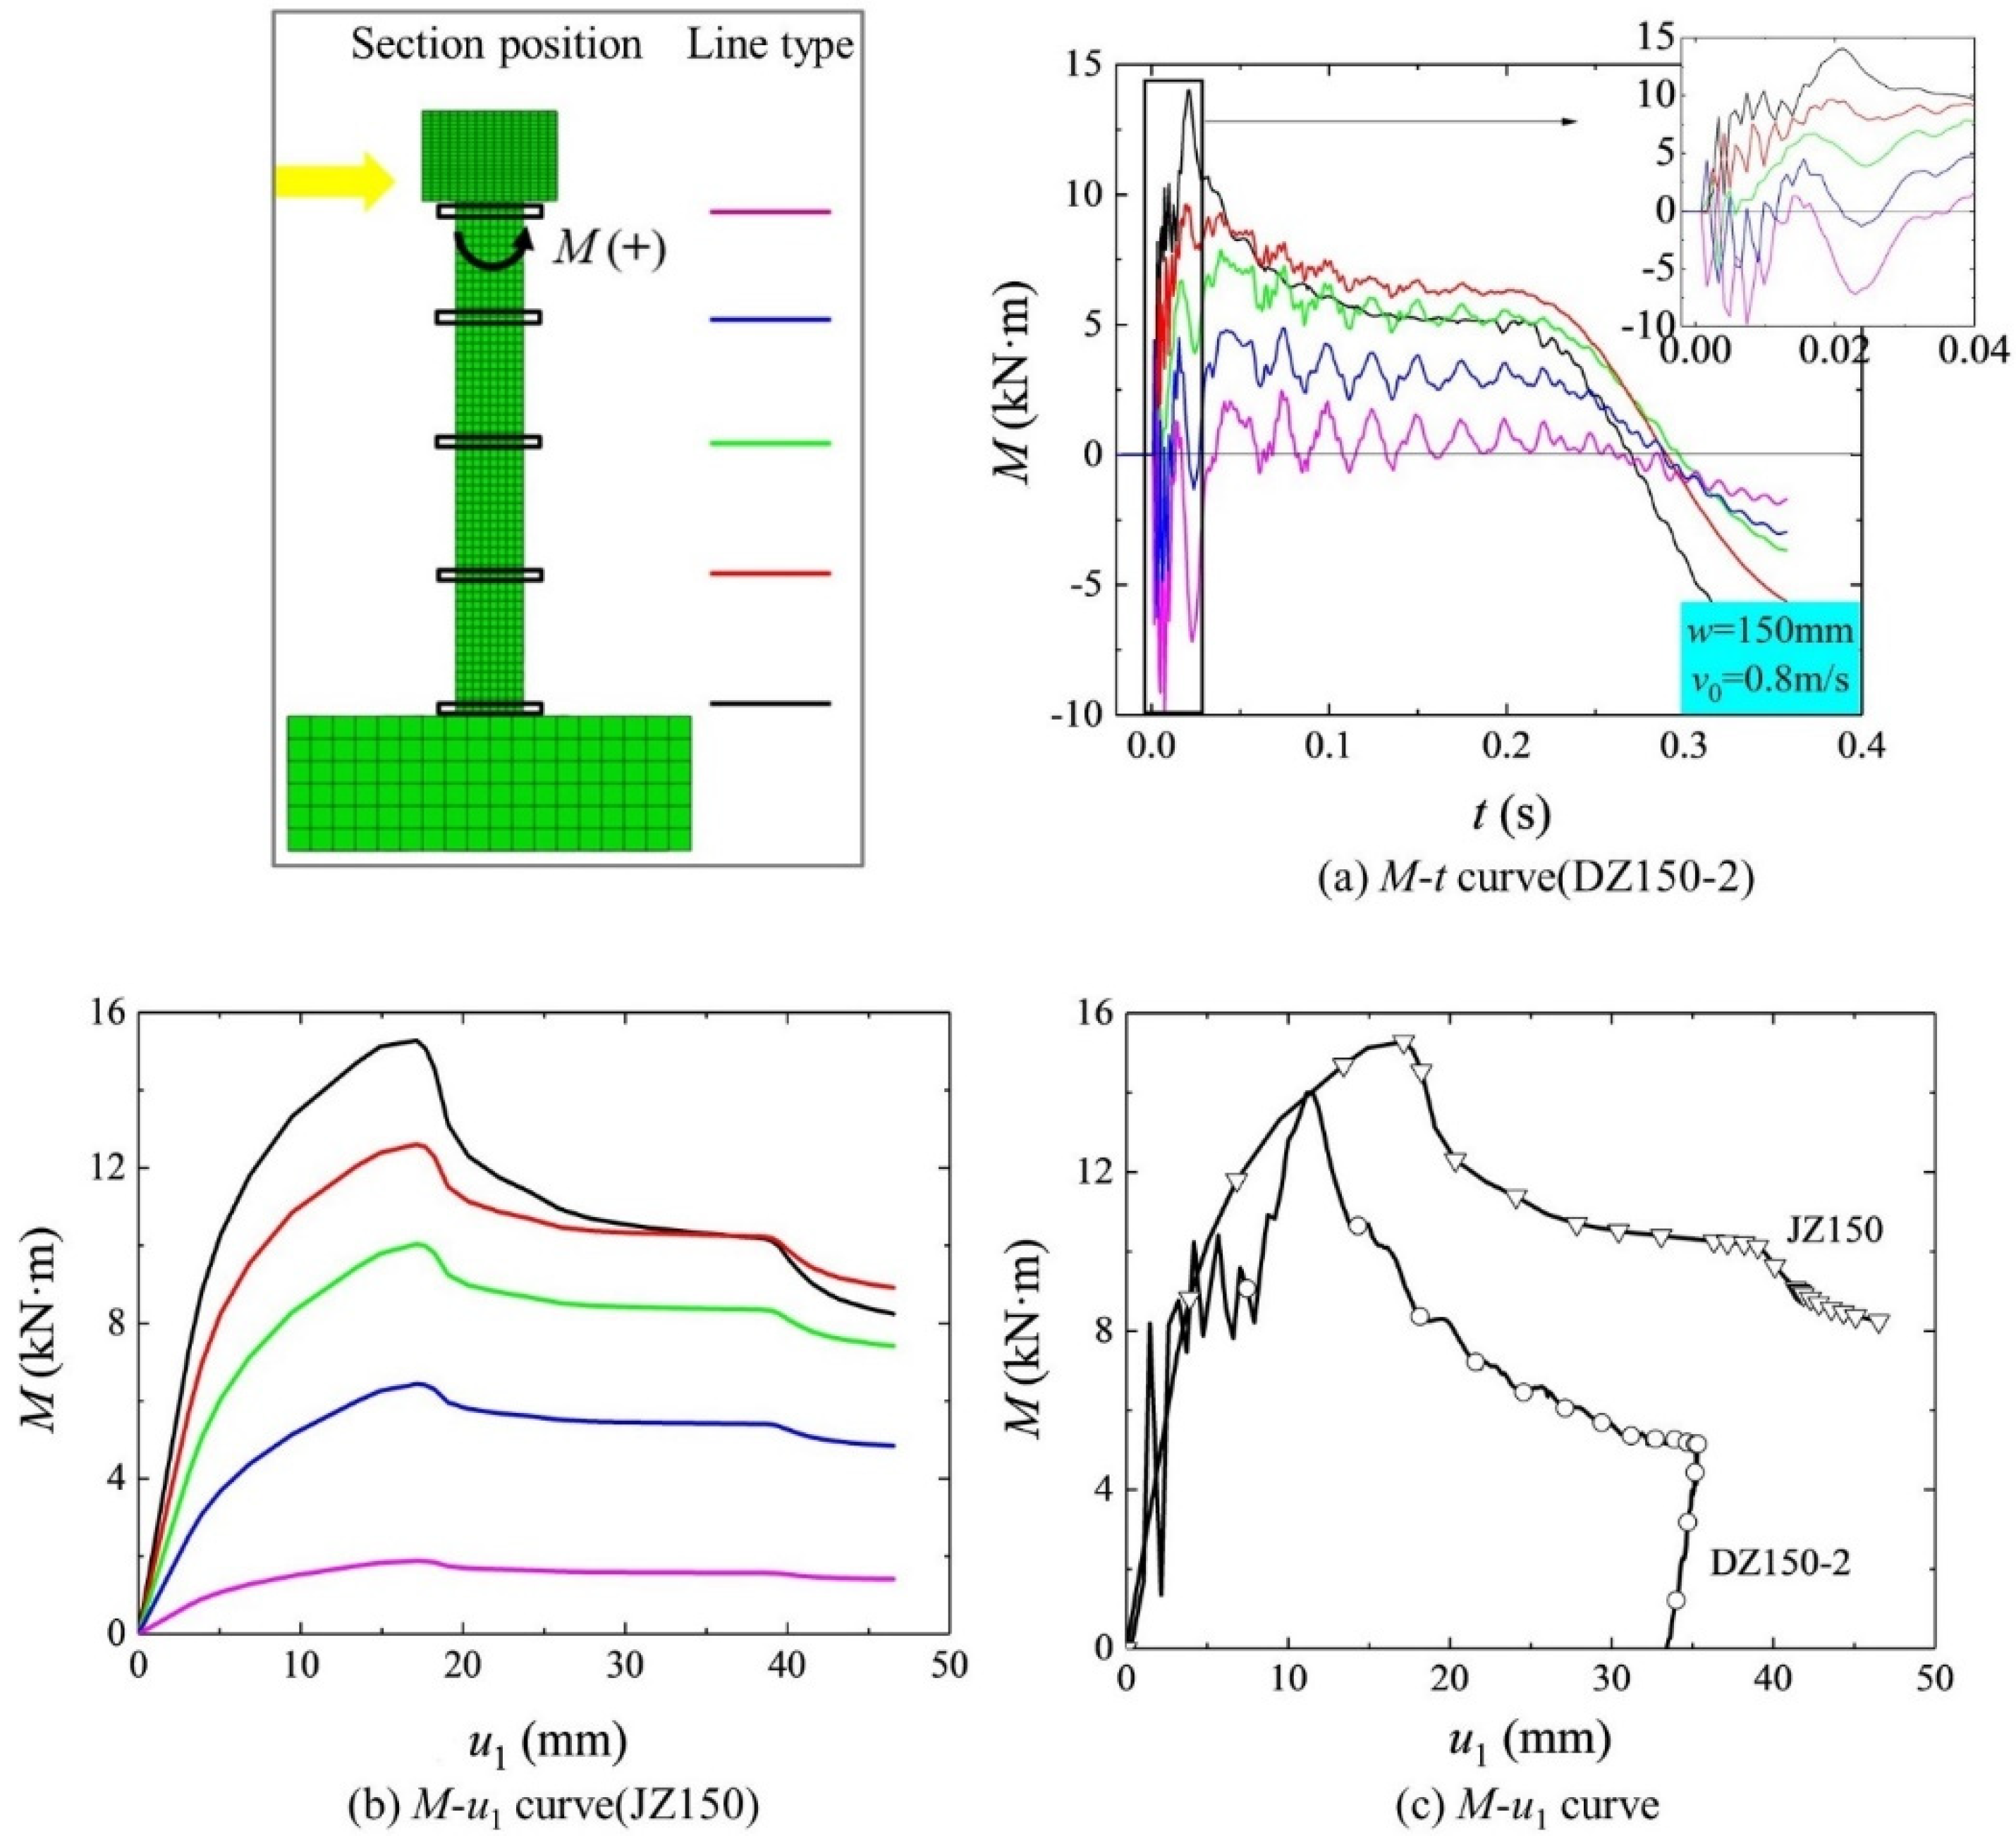
Five cross-sections are extracted at equal intervals along the height of the column, and the variation curves of the cross-sectional bending moment with the impact time and displacement are analyzed (Figure 15).
As shown in Figure 15a, under a horizontal impact, the cross-sectional bending moment oscillated in the range of t = 0–12 ms at the instant of impact, and the maximum value of the negative bending moment (−9.8 kN·m) occurred at the cross-section near the column cap, while the bending moment along the height alternated between the positive and negative directions, which was mainly caused by the inertia effect [23]. At an impact time of 21 ms, the bending moments of the 5 cross-sections almost simultaneously reached the extreme value points (Figure 15a), and the bending moment of the bottom section reached the time when it was closest to the static load bending moment in the entire impact process. In the subsequent process, with a gradual weakening of the external impact and inertia effect, the absolute values of the bending moments of the five cross-sections gradually decreased and began to experience a stable plateau development stage. At this time, the cross-sectional bending moment near the column cap stabilized and fluctuated at a low level (1.5 kN·m), which was comparable to that under static loading (Figure 15b). Since the bottom position served as the main cross-section of the specimen to bear the bending moment, Figure 15c compares the bottom bending moment vs. the displacement curves under impact and static loads. In general, the bottom bending moments generated by the two load types under the same displacement condition varied in nearly the same manner. After the column had experienced an uncracked concrete stage and entered a concrete cracking stage, the bottom bending moment of the column under impact load gradually developed to its peak (13.99 kN·m), which was slightly smaller than the peak bending moment under a static load (15.28 kN·m).
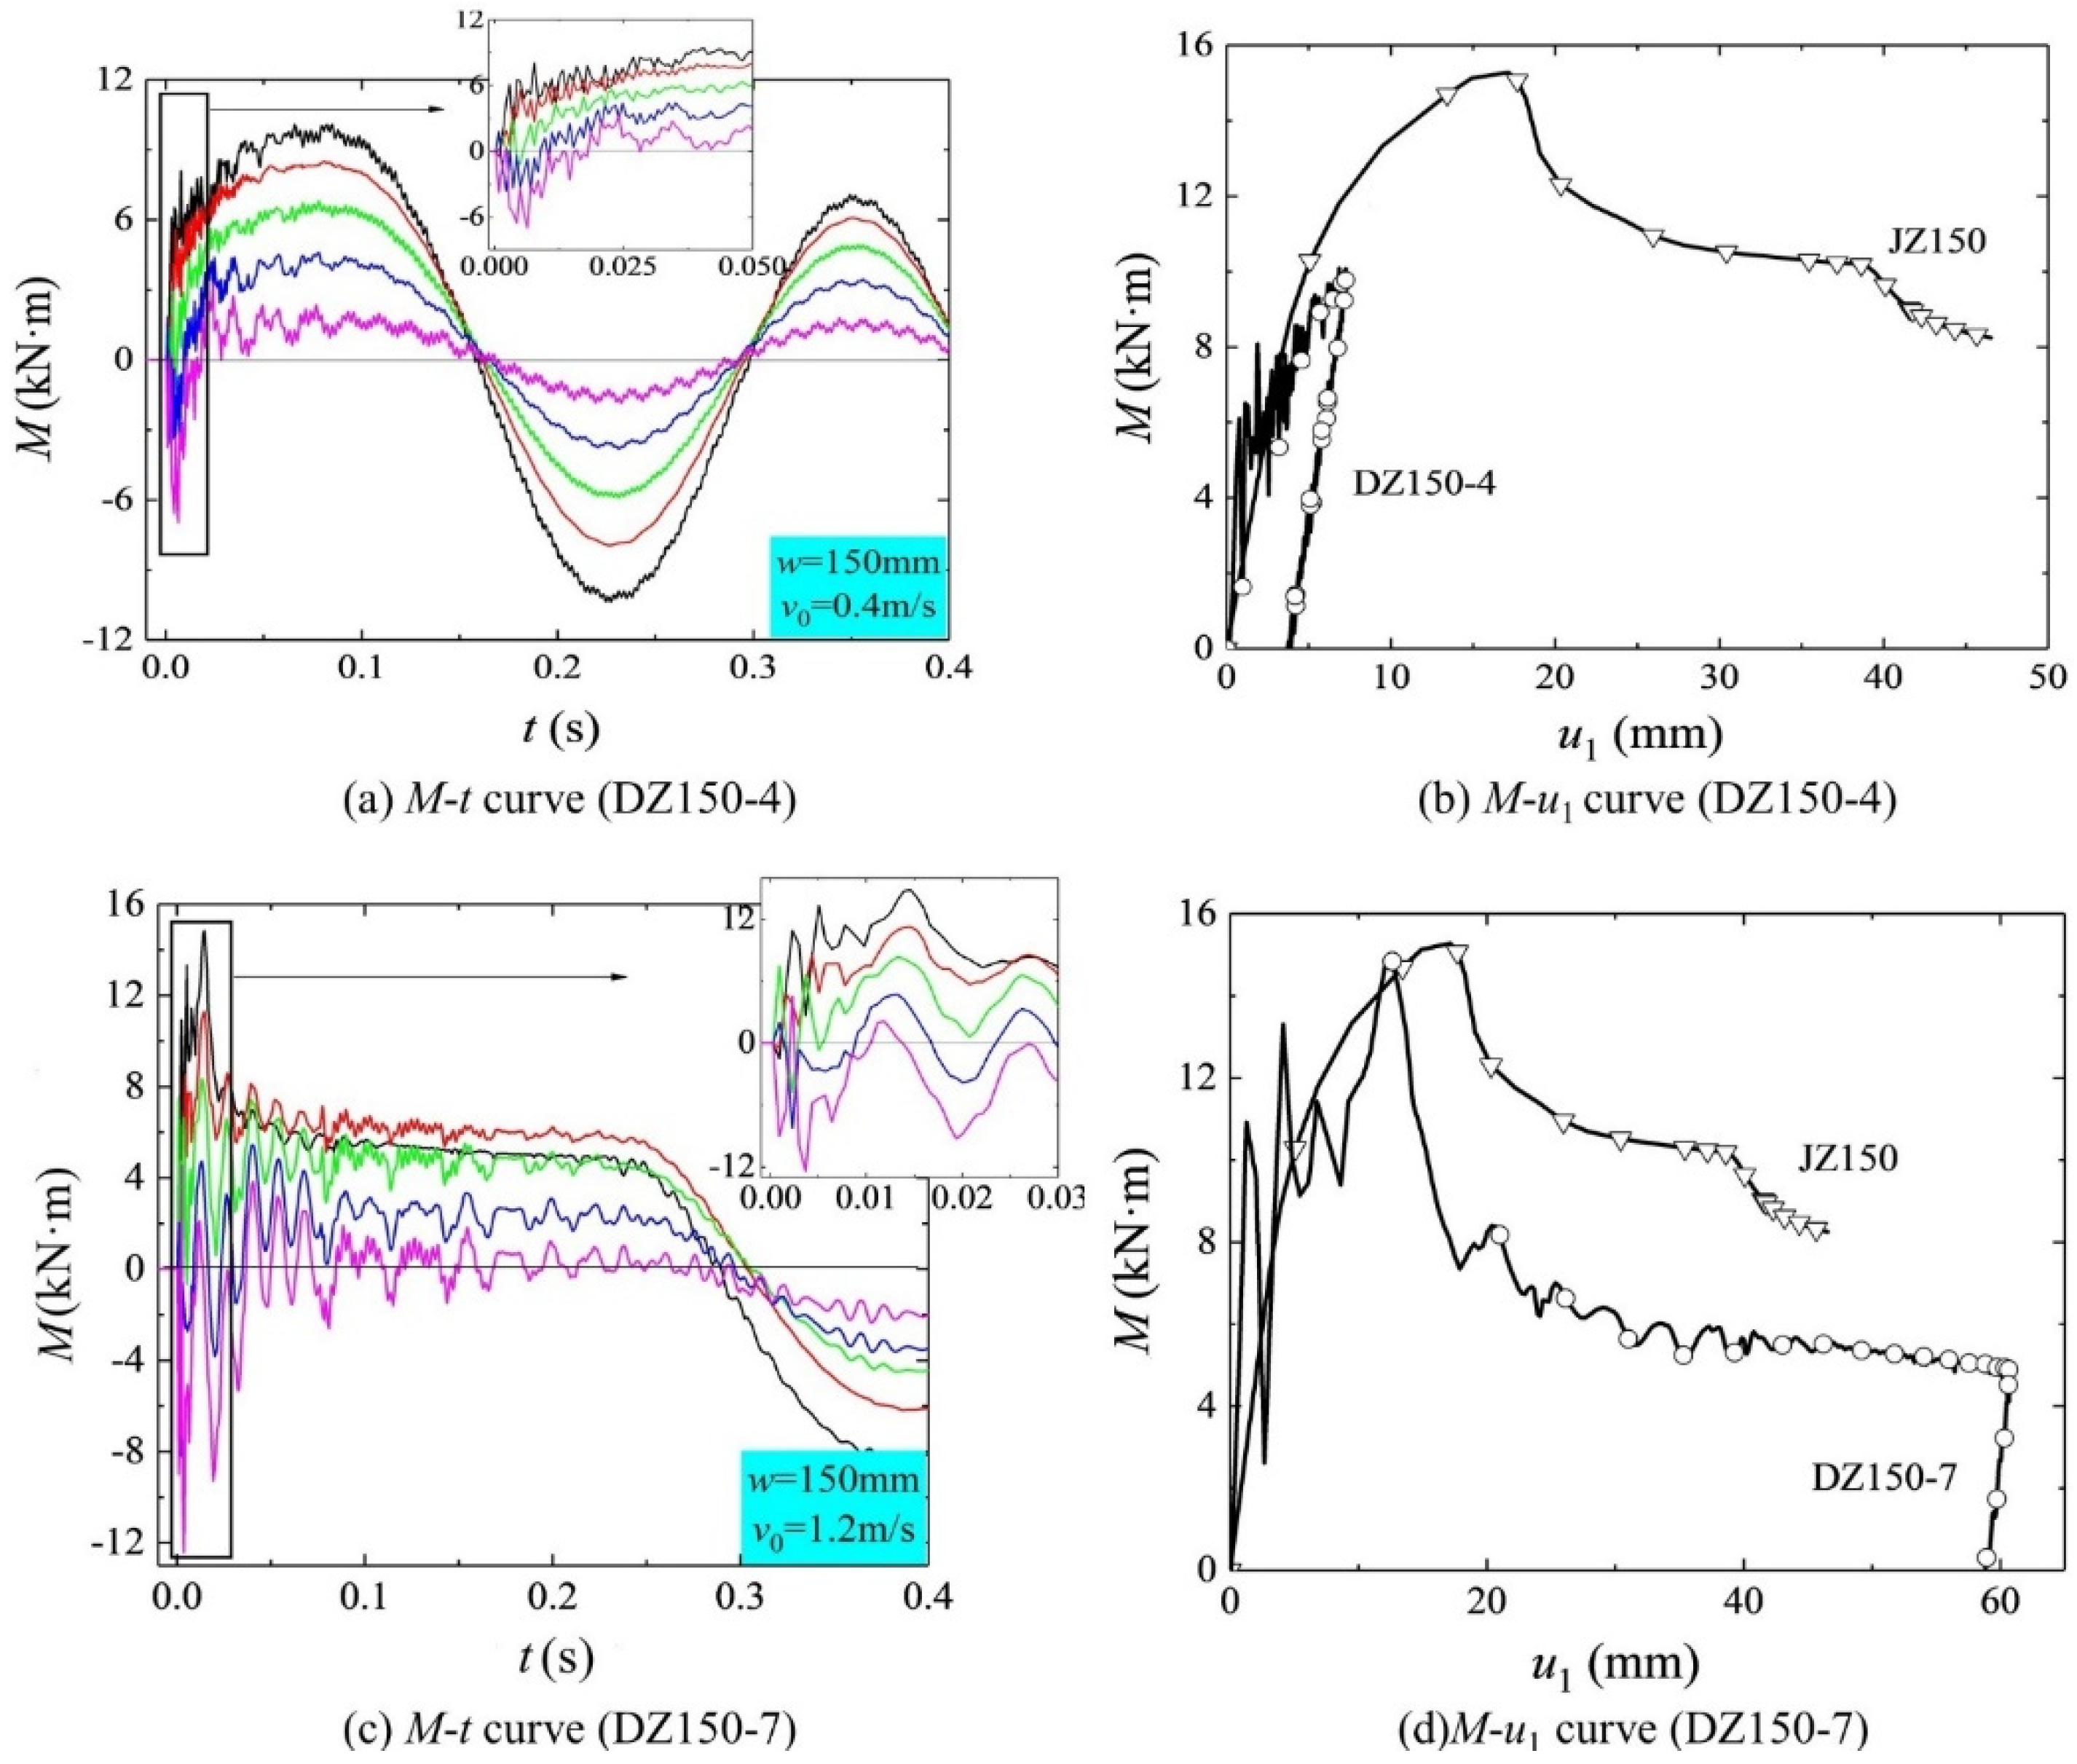
To investigate the effect of the impact velocity on the variation in the cross-sectional bending moment, Figure 16a,c shows the time-history curves of the bending moments of the 5 cross-sections of specimens DZ150-4 and DZ150-7, with v0 = 0.4 m/s and v0 = 1.2 m/s, respectively, which are compared with those of specimen DZ150-2 with v0 = 0.8 m/s in Figure 15a. The effect of the increase in velocity on the bending moment response at the instant of impact was mainly reflected in the increase in the positive and negative bending moment values. When v0 was 0.4, 0.8, and 1.2 m/s, the peak negative bending moments were −6.99, −9.8, and −12.4 kN·m, respectively. In general, although the development of the bending moment at this stage fluctuated, it increased overall. Furthermore, the magnitudes of the bending moments of the five cross-sections under different impact velocities retained the same order, and the bending moments of the two cross-sections at the lower part of the column always maintained a positive direction.
In the subsequent impact process, due to the low impact velocity on specimen DZ150-4 (only tensile cracks were observed on the surface of the specimen, and the longitudinal rebars did not yield, thus belonging to damage state I), the cross-sectional bending moment rebounded and decreased after reaching a maximum value of 9.74 kN·m. For the severely damaged specimen DZ150-7, the bending moment experienced a gradual descending stage. It is worth noting that Figure 15c also shows that the M-t curve of the bottom cross-section has a secondary decrease, which refers to the phenomenon where the M-t curve drops from the peak bending moment to a plateau stage with a high bending moment and then drops again to a second plateau stage with a low bending moment.
Figure 16b,d compare the changes in the bending moments of the bottom cross-section under static loading and dynamic loading, respectively. For specimen DZ150-4 in damage state I, the change in the bending moment under impact followed the curve under static load and rebounded and decreased before reaching the yield point under static load, indicating that it was still in the elastic stage. For specimen DZ150-2 in damage state II, the peak bending moment only exceeded the yield point, as shown in Figure 15c. Figure 16d shows that during the impact process, the peak bending moment of specimen DZ150-7 in damage state III reached the ultimate bending moment under static loading.Therefore, the bottom bending moment can be employed as an indicator to compare the responses of a structure under impact loads and static loads, respectively, in order to effectively evaluate the damage state of a specimen.
In summary, due to the existence of the inertia effect, the cross-sectional bending moment oscillates, the maximum value of the negative bending moment appears at the cross-section near the column cap, and the bending moment along the height alternately changes in the positive and negative directions. For the bottom cross-section subjected to the maximum bending moment, the bottom bending moments generated by the two types of loads under the same displacement condition change almost identically.

4. Effect of Different Combinations of m and v0 on the Dynamic Response of the Column with the Same Ek

In existing studies, m and v0 as two factors are usually considered separately to investigate their influences on the dynamic response of members. The existence of different combinations of the two factors for the same Ek increases the difficulty in evaluating the dynamic response of the structure. To date, the influences of different combinations of m and v0 under the same Ek on the dynamic response of RC columns has still not been studied. Therefore, this study conducts a parametric analysis under different levels of Ek which includes multiple combinations of m and v0. In the analysis, different combinations of m and v0 at different levels of impact kinetic energy Ek are applied to analyze the dynamic responses of RC column members under impact using the abovementioned FE model of RC columns and considering the material strain rate effect. The specimens in the literature [16], which had a cross-sectional side length of 150 mm, an axial compression ratio of 0.1, and a reinforcement ratio of 2.7%, were employed as basic calculation models. A total of 4 sets of impact kinetic energy Ek were designed, where each set of models contained 10 numerical examples with different values of m (ranging from 0.2 to 40 t) and v0. The models are named in the format of “DZ150-Ek-impact mass”, and the specific parameter information is listed in Table 4.
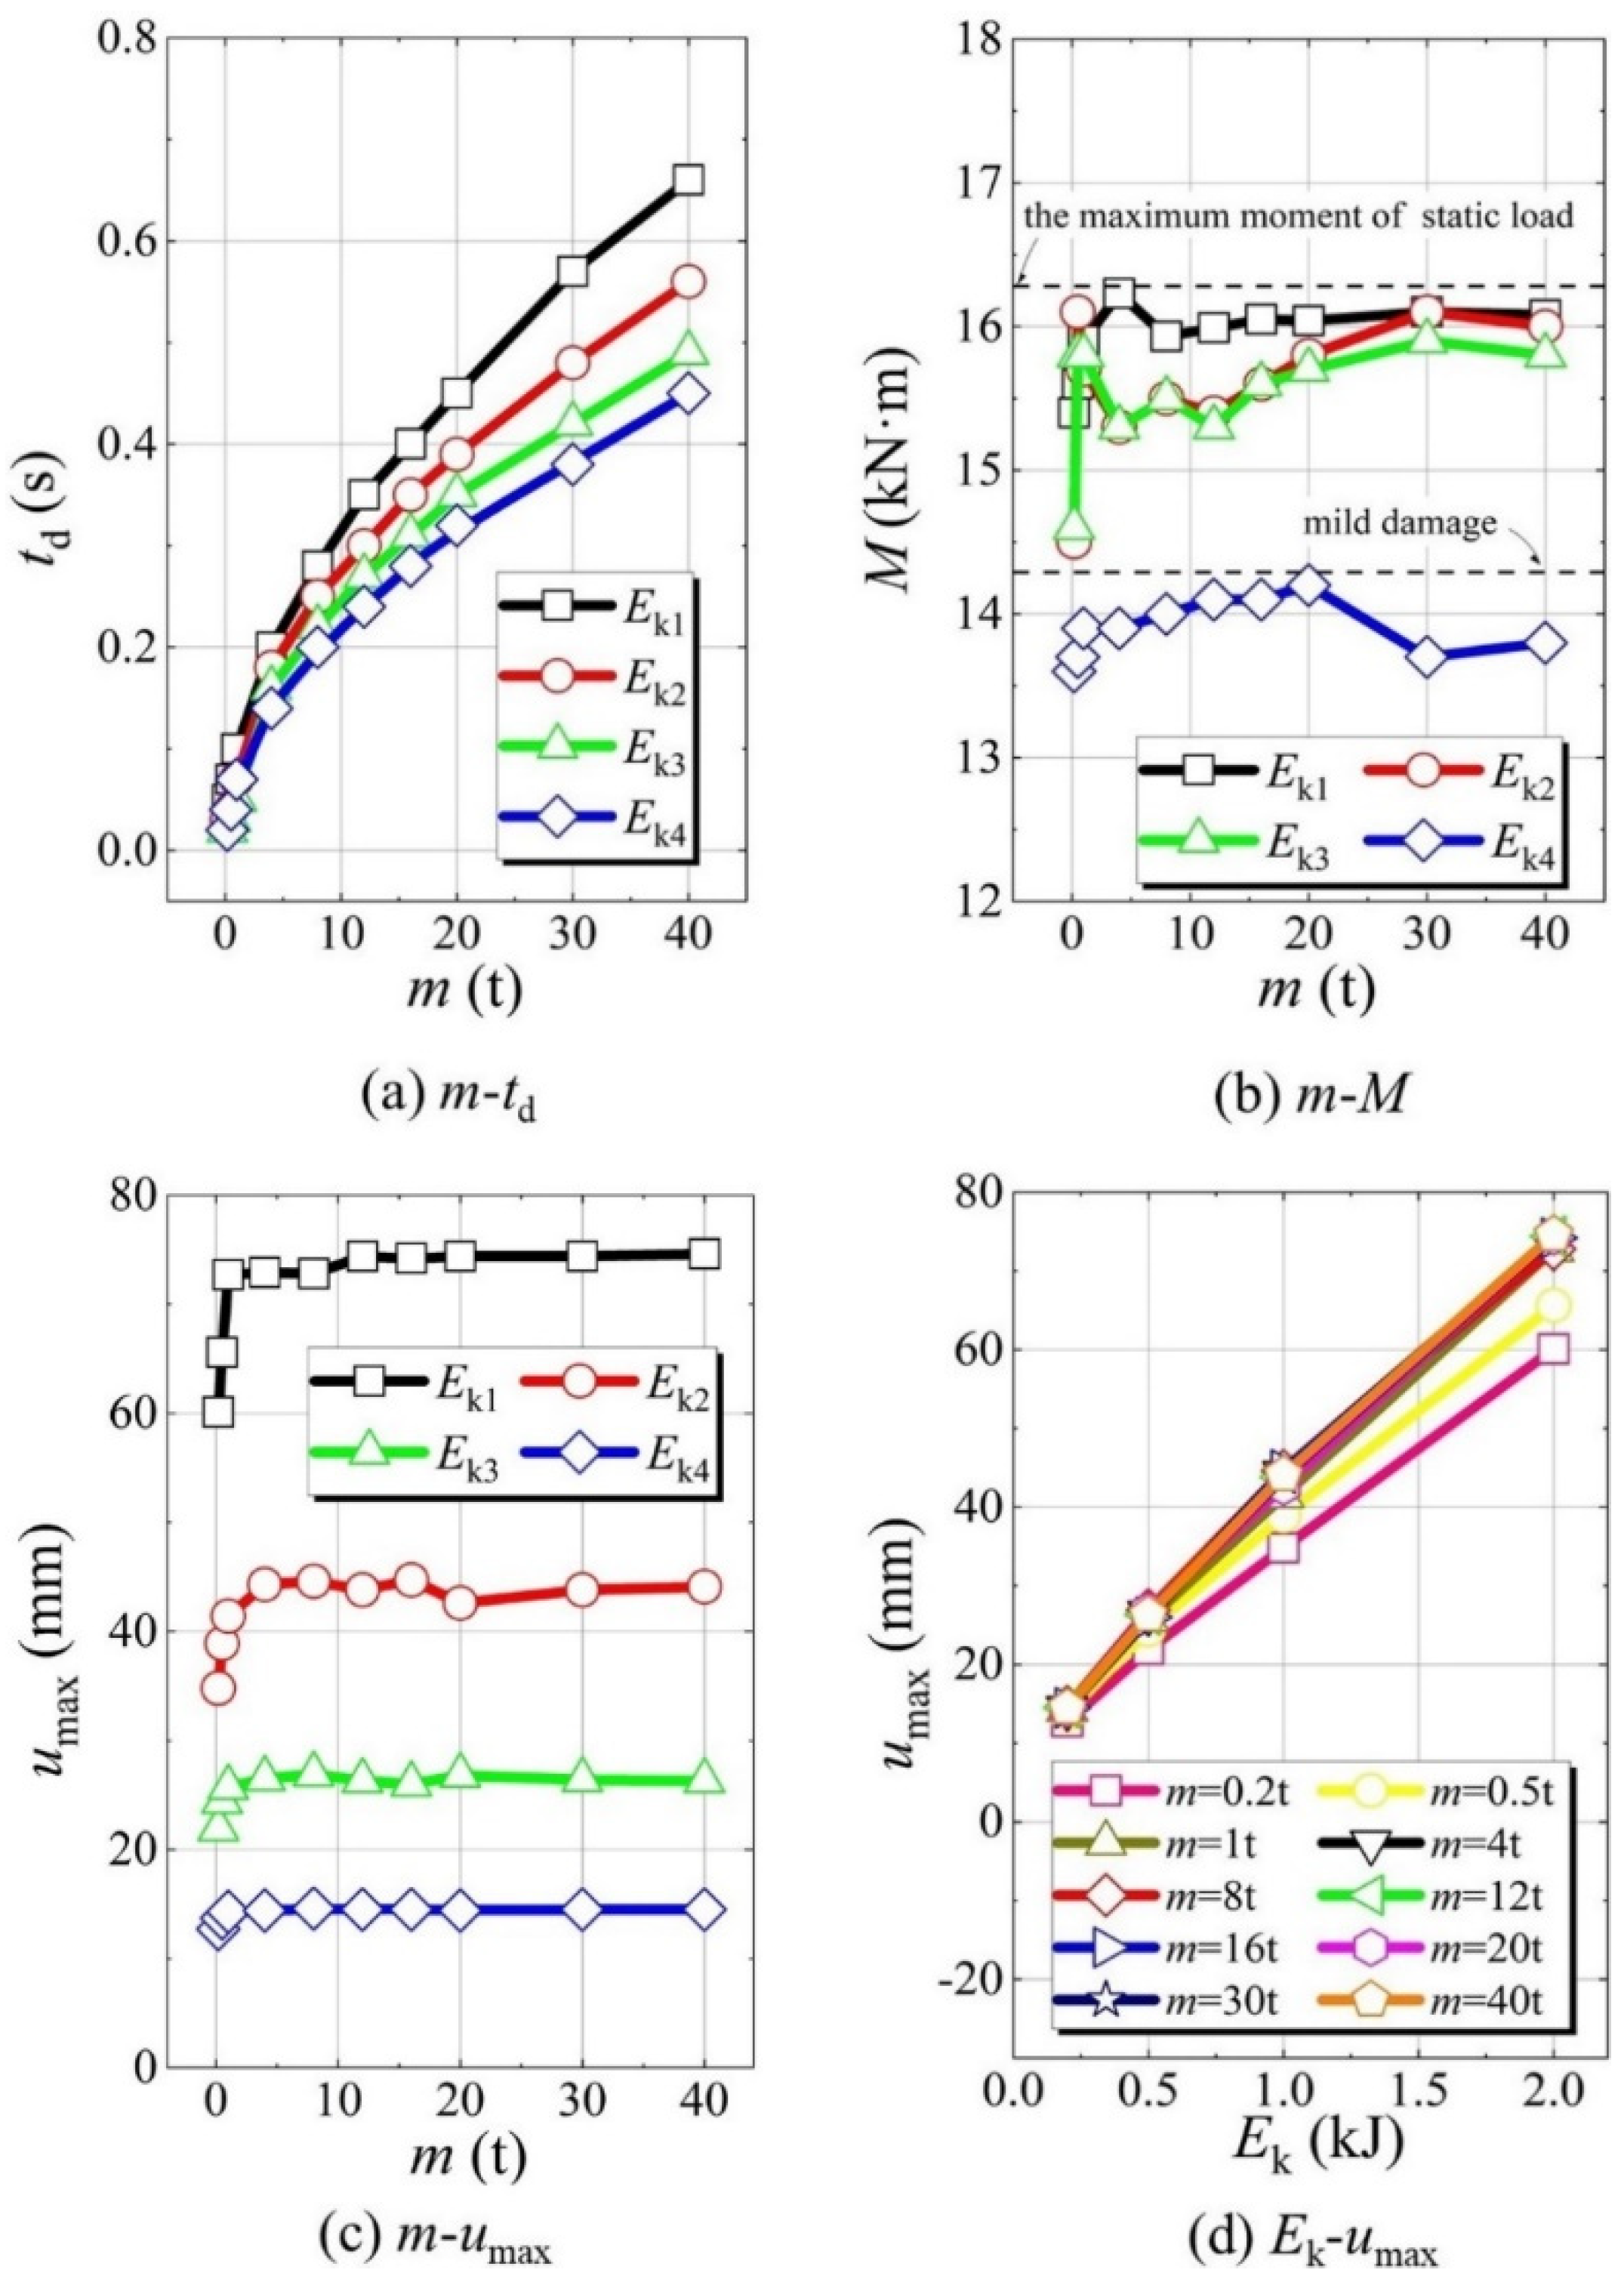
Figure 17a–c summarizes the variation patterns of the impact duration td, maximum bottom bending moment Mmax, and maximum displacement umax with an increase in m for the same Ek. Clearly, td increases as m increases, mainly because the decrease in the impact velocity v0 significantly reduces the deformation rate of the specimen. Under the impact of 4 different initial kinetic energies (0.2, 0.5, 1 and 2 kJ), as m increases from 0.2 t to 40 t, td increases from 0.05 s, 0.03 s, 0.02 s, and 0.02 s to 0.66 s, 0.56 s, 0.49 s, and 0.45 s, respectively. Figure 17b shows that at impact energy Ek4, the plastic hinge is still not formed at the bottom of the specimen, the overall damage is very slight, and the bending moment values for different combinations of m and v0 are quite different from the ultimate bending moment of the cross-section. Under Ek2 and Ek3, the bending moment values are still small when m is 0.2 t, and as m subsequently changes, the bending moment increases to a certain level and then remains constant. At a large impact kinetic energy Ek1, the bending moment completely reaches the same level as that under static loading (16.41 kN·m, obtained by the FE calculation).
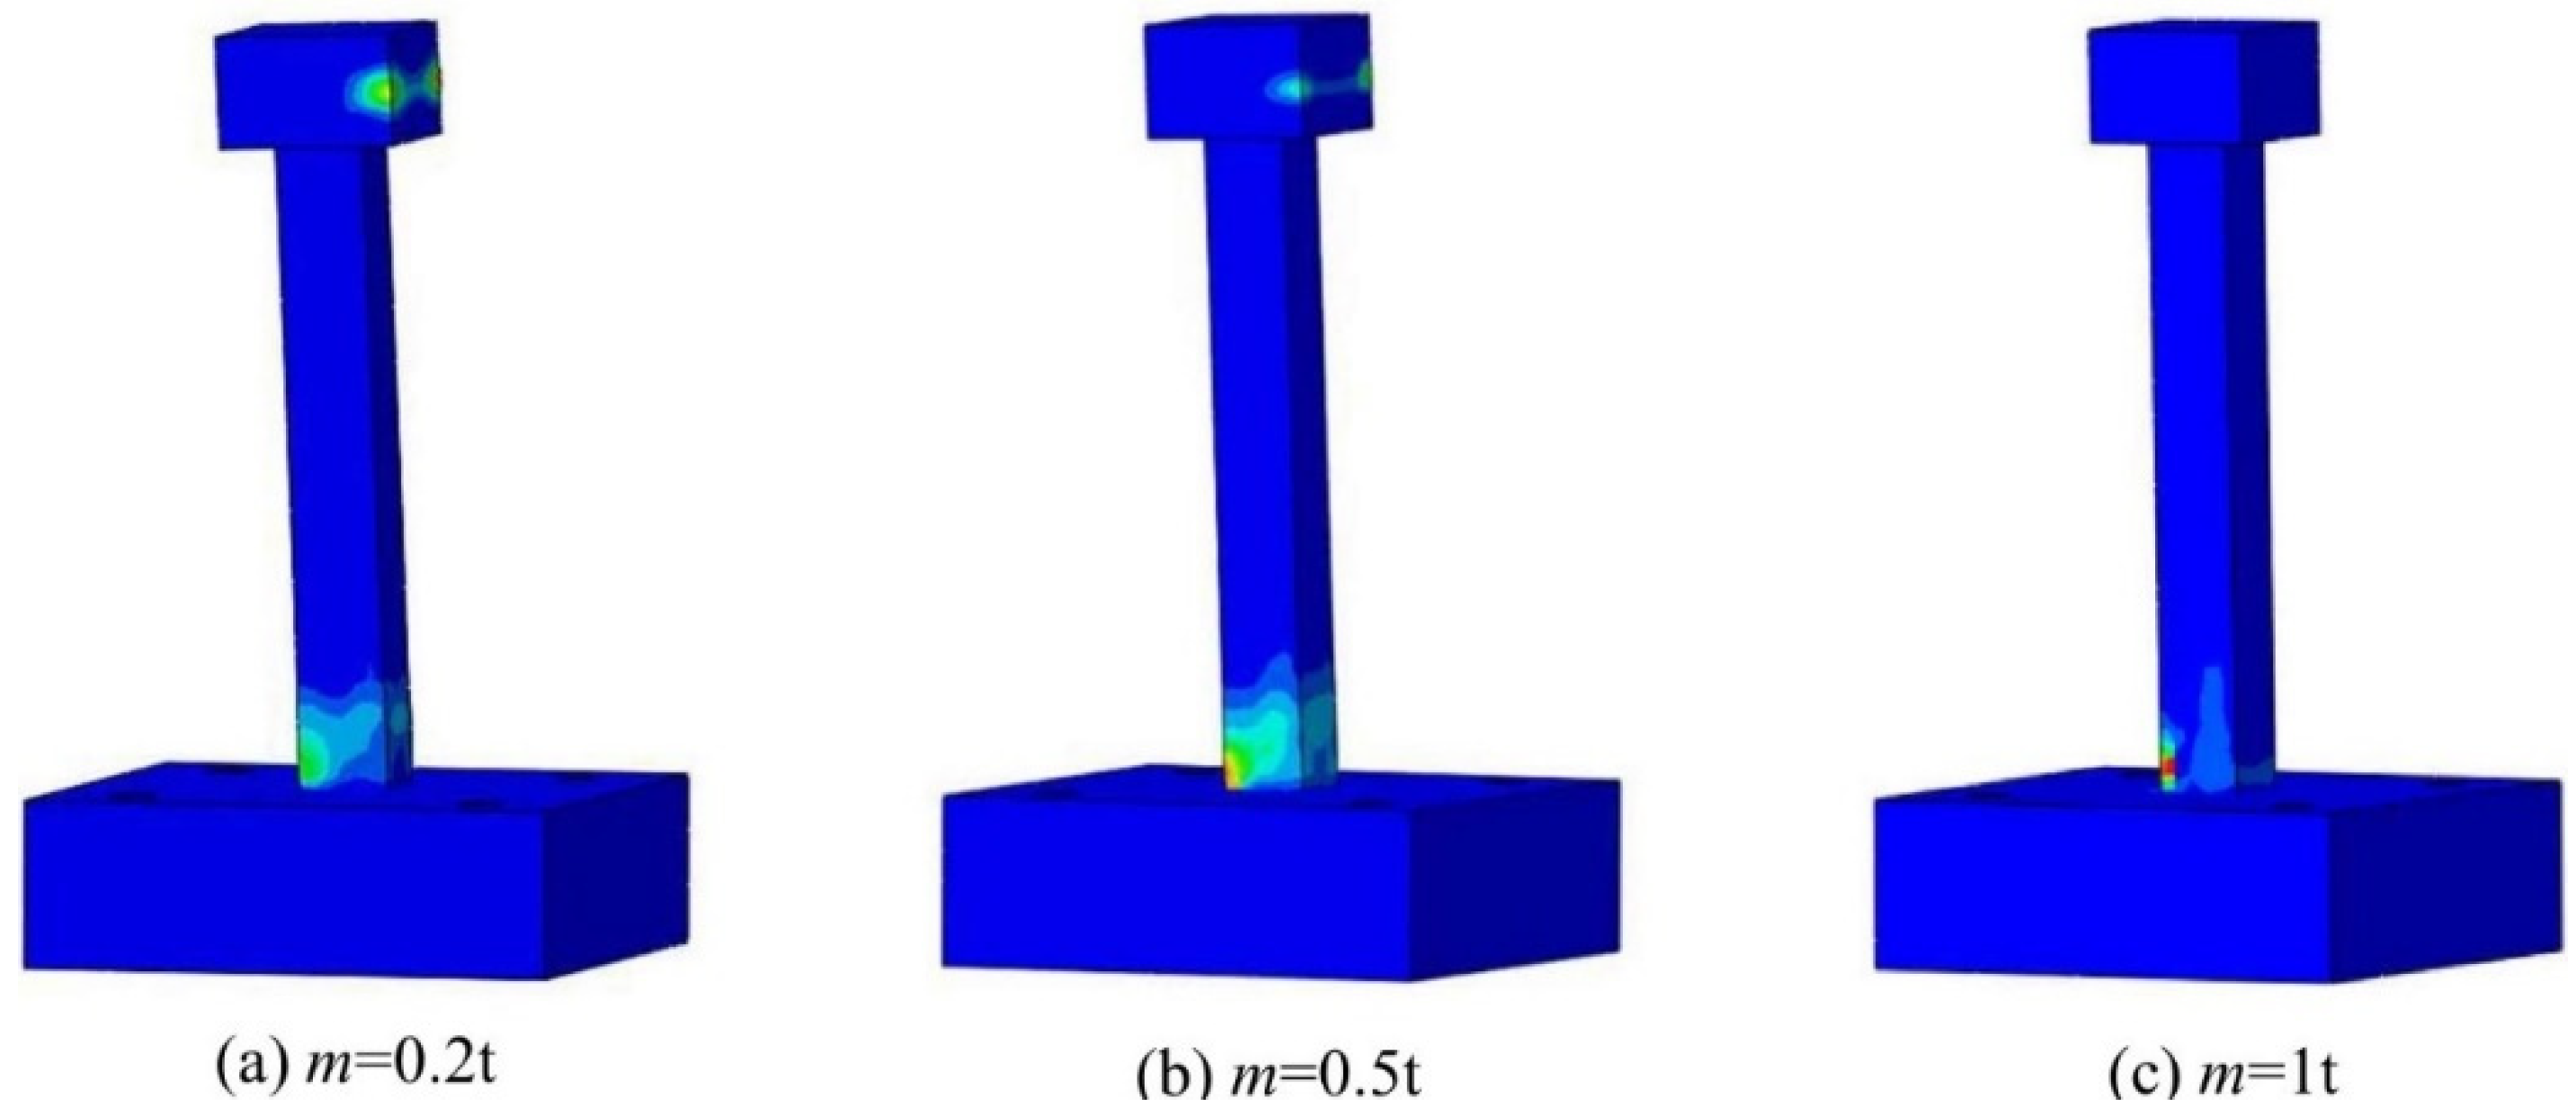
Similarly, as seen in Figure 17c,d, umax increases with an increase in m when it is small (i.e., 0.2 to 1 t), while the maximum displacement reached by the specimen is similar to the subsequent changes in m (1 to 40 t). For the responses of the specimen with the same m values and different Ek values, umax increases linearly with an increasing Ek, and the change slopes of the Ek-umax curves with different impact masses are similar, except for slightly small change slopes with small m values. At the same Ek, the overall maximum displacement of the column is slightly small when m is small and v0 is large. The reason can be derived from analyzing the concrete damage in Figure 18. Under the impact with a small m and large v0, the specimen is severely damaged locally at the impact point. When m increases to 1 t, the minimum concrete damage occurs at the impact point, and the external impact energy is mostly dissipated by the overall deformation.
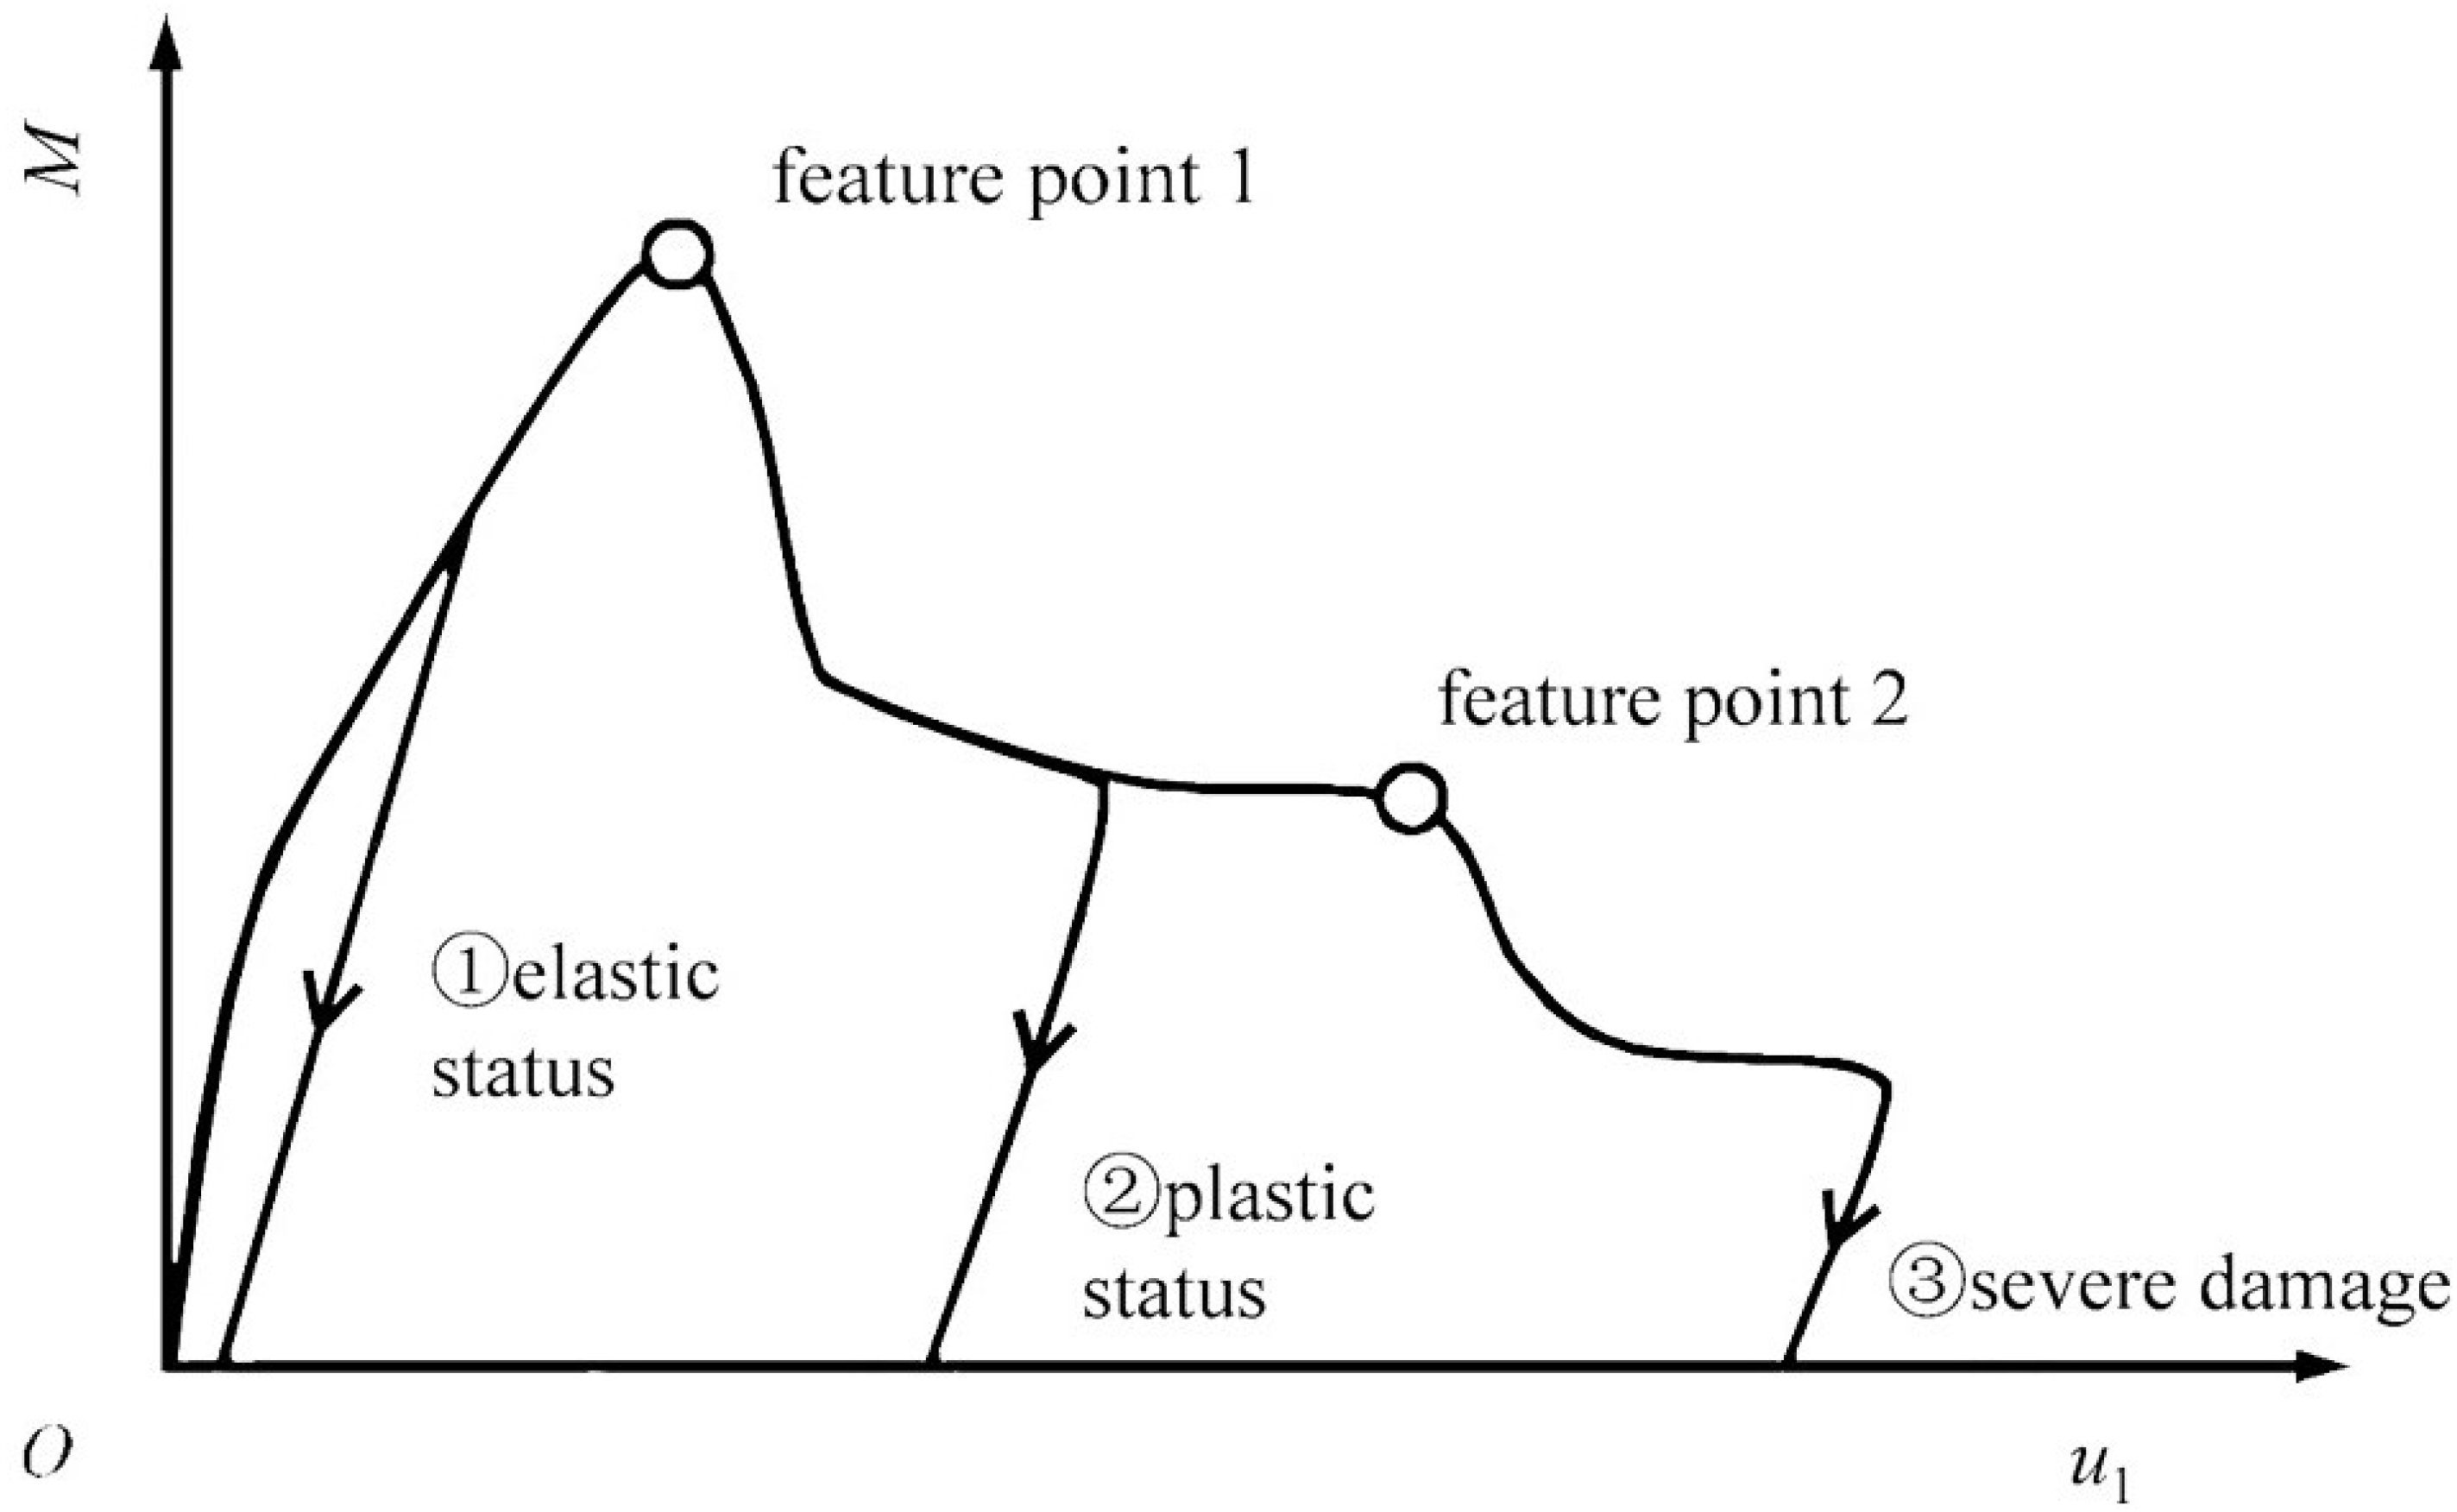
Figure 19 shows the variation curve of the bottom bending moment M with u1. A comparison of the M-u1 curves with different Ek values indicates that the specimen does not enter the plastic hinge deformation stage under the minimum impact kinetic energy Ek4 and is still in the small damage stage, and the M-u1 curve rebounds before reaching the peak. Under Ek3, the specimen has just passed through the elastic stage and enters the plastic deformation stage characterized by the yielding of longitudinal rebars, and a plastic hinge has been formed at the bottom cross-section of the column, indicating that the damage to the specimen is more severe than that under Ek4. There is no significant difference between the maximum bending moments reached under the four different Ek levels. The main difference is that under the small impact kinetic energy Ek4, the specimens have little subsequent deformation after reaching the maximum bending moment and then rebound immediately, while under the large Ek1, the bottom of the column experiences a long period of stable development after entering the plastic hinge deformation stage. It is worth noting that under the impact of Ek1, the M-u1 curves with different m values differ at the end part. The curves show a secondary decrease caused by the non-rebound process when they develop stably to a large displacement, because the concrete in the compression zone of the specimen has been damaged very severely and the flexural strength of the plastic hinge cannot be maintained. As shown in Figure 16b, for the slightly damaged specimens, the maximum bending moment has not reached the ultimate flexural capacity of the bottom cross-section, and hence, the plastic hinge does not occur in the specimens. For specimens with moderate or severe damage, the bending moment reached the maximum flexural capacity. Therefore, to evaluate the moderate or severe damage to specimens subjected to horizontal impact, use of the maximum bending moment alone can only determine whether a plastic hinge is formed; it cannot reflect the degree of damage in the subsequent deformation. In this case, the two types of damage states need to be judged by examining whether there is a secondary descending stage in the M-u1 curve.
In summary, the development trend of the M-u1 curve is similar under the same Ek and different combinations of m and v0. On the other hand, as is known from the internal force analysis in the previous subsection, the M-u1 curve under static and dynamic loads shows a consistent development path. Therefore, the performance level of the column in the impact process can effectively be evaluated by the development path of the M-u1 curve. As shown in Figure 20, when the bottom cross-sectional bending moment of the column has not yet reached the ultimate value, that is, before the characteristic point 1 is reached, the specimen is in the elastic state (stage 1), and the damage is relatively slight; when the ultimate bending moment is reached, the plastic hinge appears in the specimen, which enters the plastic damage state (stage 2); finally, when the deformation of the specimen is too large and exceeds characteristic point 2, the bending moment shows a second drop, which indicates that the specimen has been damaged very severely (stage 3).

5. Damage State Evaluation of RC Columns

In the previous subsection, the damage state of RC columns after impact is evaluated qualitatively. Due to the lack of quantitative standards, it is not convenient for engineering applications. In this section, a quantitative evaluation standard for the damage state of components after impact will be given.
In 2010, Tachibana et al. [26] found a good linear relationship among impact energy Ek, maximum displacement umax and static ultimate load-bearing capacity Fsu through the drop-weight experimental results of 21 RC beams with final bending failure, and summarized the following formula:
F su = 0 . 522 E k u max
Since then, international drop-weight impact test research teams, such as Kishi [27,28], Fujikake and Li Bing [25,29], have verified its reliability through experiments or a large number of collected data on RC beam drop-weight experiments and obtained satisfactory results.
In the above study, the ultimate flexural failure of RC beams, as shown in Figure 21a, is actually characterized by the formation of a plastic hinge at the mid-span impact position, and its failure mechanism is similar to that of RC columns in this study, as shown in Figure 21b.
In the actual project, due to the energy absorption of the anti-collision device, only part of impact kinetic energy is converted into the deformation energy Eab of the RC column. Therefore, the impact energy of the structure can be better reflected by using Eab. The calculation of Eab is shown in Figure 22.
According to the above method, based on the impact simulation of RC column specimens under impact in ref. [30] by ABAQUS, EAB and umax of the specimen are obtained, and the equivalent static load Feq (calculated by Formula (11)) is defined and compared with its maximum static load-bearing capacity Fsu (calculated by finite element in Point 2.3). All calculation results are listed in Table 5.
F e q = E a b u max
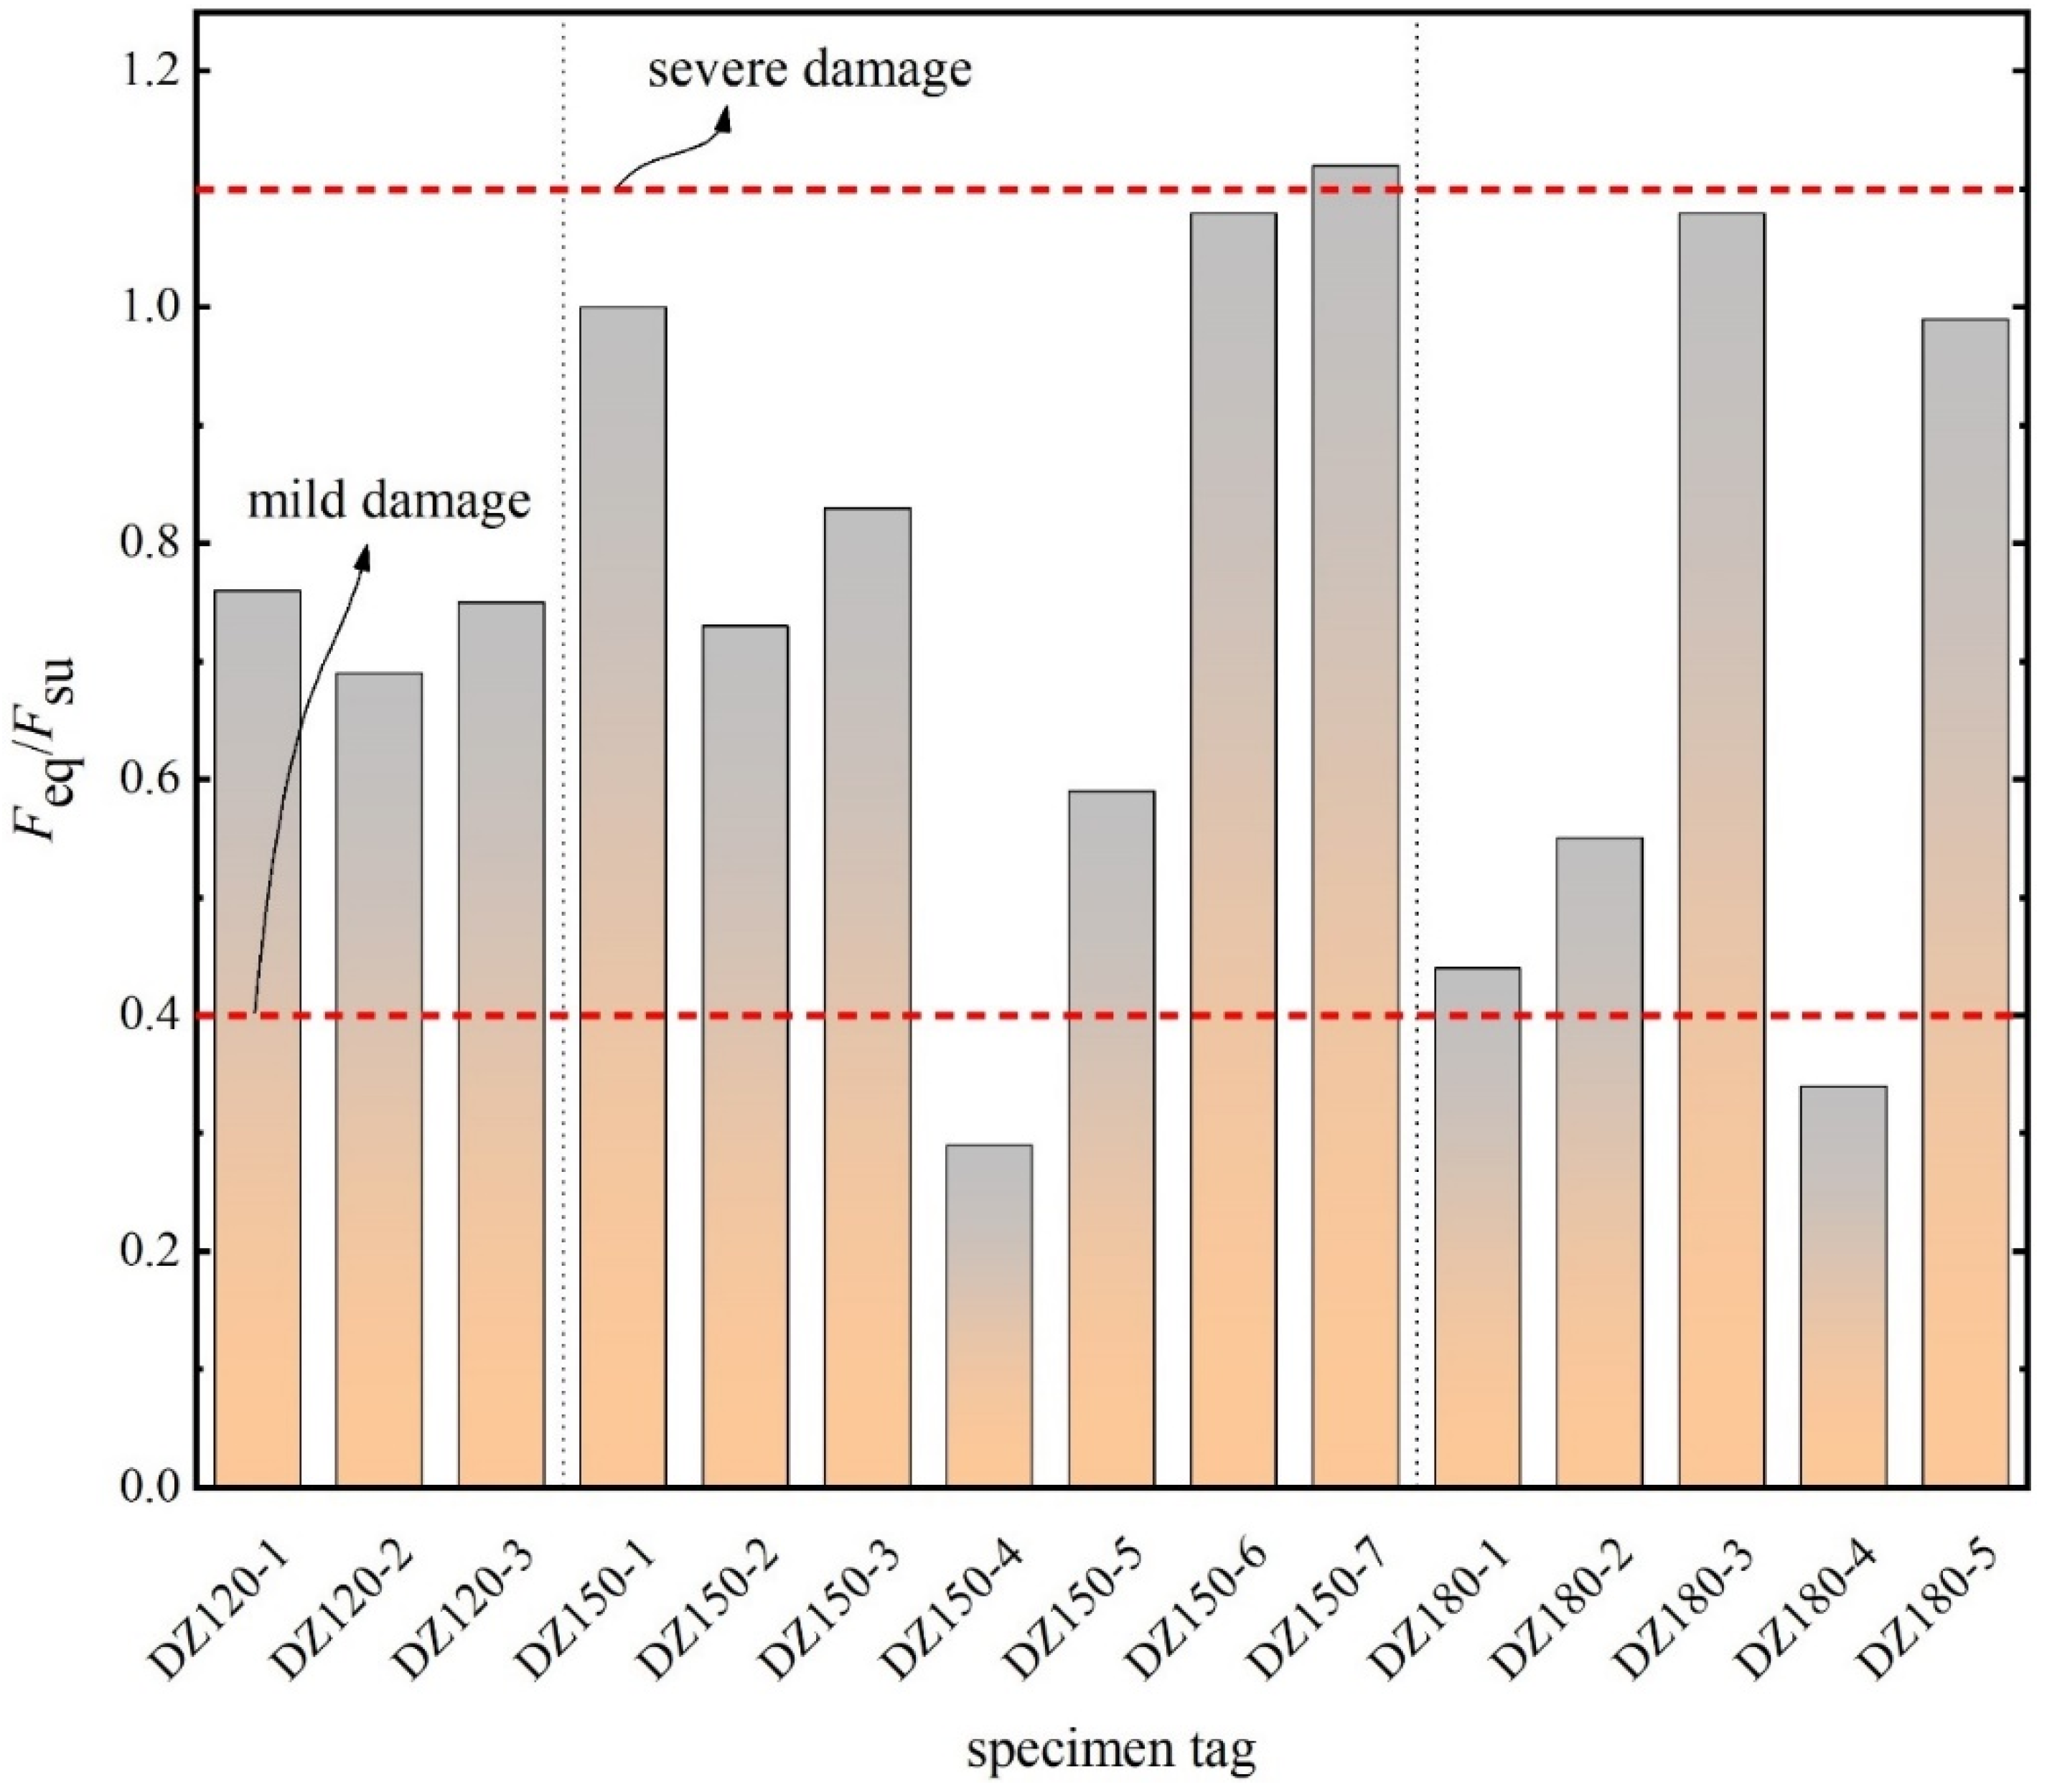
Figure 23 shows the Feq/Fsu ratio of all specimens. It can be found that for specimens DZ150-4 and DZ180-3 with small impact speed, the damage after horizontal impact is very slight, which means that the whole specimen does not enter the plastic stage, and the ratio Feq/Fsu is basically below 0.4. For the specimen DZ150-7 with high impact speed, the damage is more serious after horizontal impact, and the ratio Feq/Fsu exceeds 1.1. In general, except that the ratio Feq/Fsu (=0.75) of specimen DZ120-3 does not agree well with the experimental damage state (complete failure), the other specimens are in good agreement. Therefore, 0.4 and 1.1, two specific values of Feq/Fsu, were taken as the critical values to divide the states of slight damage, the plastic stage and failure.

6. Conclusions

(1) When the impact kinetic energy Ek is the same, m is small and v0 is large, the specimen will suffer from severe local damage at the impact position, resulting in a slightly smaller overall maximum displacement. When m is increased to 1 t, the overall deformation of the column is basically not affected by the combination of m and v0; the displacement increases almost linearly with increases in Ek.
(2) A single indicator (bottom bending moment) or double indicators (bottom bending moment and column top displacement) can be utilized to evaluate the damage to structural members after an impact. When a single indicator is employed, the peak bending moment under an impact is compared with the yield bending moment and the ultimate bending moment under static load to effectively evaluate the damage state of the specimen. When double indicators are applied, since the M-u1 curve is not affected by inertial effect and it shows a consistent development path under static and dynamic loads, it is divided into three performance stages (the elastic state, the plastic damage state and severe damage state), where the damage state of the column can be evaluated according to the development path of the M-u1 curve. In addition, the damage state of an RC column under impact can also be quantitatively evaluated by the ratio of the equivalent static load Feq to the static ultimate load-bearing capacity Fsu.

Author Contributions

Conceptualization, B.H.; methodology, B.H.; software, J.Y.; validation, J.Y., J.C.; formal analysis, B.H.; investigation, B.H.; resources, J.C.; data curation, J.Y.; writing—original draft preparation, B.H.; writing—review and editing, J.C.; visualization, B.H.; supervision, J.C.; project administration, J.C.; funding acquisition, J.C. All authors have read and agreed to the published version of the manuscript.

Funding

This research was funded by the National Natural Science Foundation of China, grant number 51578246.

Institutional Review Board Statement

Not applicable.

Informed Consent Statement

Not applicable.

Data Availability Statement

Data is contained within the article.

Acknowledgments

We appreciate the linguistic assistance provided by American Journal Experts during the preparation of this manuscript.

Conflicts of Interest

The authors declare no conflict of interest.

References

  1. Kishi, N.; Sato, M.; Mikama, H.; Matsuoka, K.I. Impact behavior of full-scale of RC beams. In Proceedings of the 6th ASEC, Taipei, Taiwan, 16 February 1998; pp. 973–978. [Google Scholar]
  2. Saatci, S.; Vecchio, F.J. Effects of shear mechanisms on impact behavior of reinforced concrete beams. ACI Struct. J. 2009, 106, 78–86. [Google Scholar]
  3. Xu, B.; Zeng, X. Experimental study on reinforcement concrete beams under impact loadings. China Civil. Eng. J. 2014, 47, 41–51. (In Chinese) [Google Scholar]
  4. Liu, B.; Fan, W.; Guo, W.; Chen, B.; Liu, R. Experimental investigation and improved FE modeling of axially-loaded circular RC column under lateral impact loading. Eng. Struct. 2017, 152, 619–642. [Google Scholar] [CrossRef]
  5. Fan, W.; Shen, D.; Yang, T.; Shao, X. Experimental and numerical study on low-velocity lateral impact behaviors of RC, UHPFRC and UHPFRC-strengthened columns. Eng. Struct. 2019, 191, 509–525. [Google Scholar] [CrossRef]
  6. Liu, B.; Fan, W.; Huang, X.; Shao, X.; Kang, L. A simplified method to predict damage of axially-Loaded circular RC Columns under Lateral Impact Loading. Int. J. Concr. Struct. M 2020, 14, 1–24. [Google Scholar] [CrossRef]
  7. Sha, Y.; Hao, H. Laboratory tests and numerical simulations of barge impact on circular reinforced concrete piers. Eng. Struct. 2013, 46, 593–605. [Google Scholar] [CrossRef]
  8. Sha, Y.; Hao, H. Laboratory tests and numerical simulations of CFRP Strengthened RC pier subjected to barge impact load. Inter. J. Struct. Stab. Dyn. 2015, 15, 1–33. [Google Scholar] [CrossRef]
  9. Demartino, C.; Wu, J.G.; Xiao, Y. Response of shear-deficient reinforced circular RC columns under lateral impact loading. Inter. J. Impact Eng. 2017, 109, 196–213. [Google Scholar] [CrossRef]
  10. Adachi, T.; Tanaka, T.; Sastranegara, A.; Yamaji, A.; Kim, S.-K.; Yang, I.-Y. Effect of transverse impact on buckling behavior of a column under static axial compressive force. Inter. J. Impact Eng. 2004, 30, 465–475. [Google Scholar] [CrossRef]
  11. Staszak, N.; Garbowski, T.; Szymczak-Graczyk, A. Solid Truss to Shell Numerical Homogenization of Prefabricated Composite Slabs. Materials 2021, 14, 4120. [Google Scholar] [CrossRef] [PubMed]
  12. Zeinoddini, M.; Parke, G.A.R.; Harding, J.E. Axially pre-loaded steel tubes subjected to lateral impacts: An experimental study. Int. J. Impact Eng. 2002, 27, 669–690. [Google Scholar] [CrossRef]
  13. Zeinoddini, M.; Harding, J.E.; Parke, G.A.R. Axially pre-loaded steel tubes subjected to lateral impacts (a numerical simulation). Int. J. Impact Eng. 2008, 35, 1267–1279. [Google Scholar] [CrossRef]
  14. Al-Thairy, H.; Wang, Y.C. A numerical study of the behaviour and failure modes of axially compressed steel columns subjected to transverse impact. Int. J. Impact Eng. 2011, 38, 732–744. [Google Scholar] [CrossRef] [Green Version]
  15. Liu, J.F.; Chen, W.S.; Hao, H.; Wang, Z. Numerical study of low-speed impact response of sandwich panel with tube filled honeycomb core. Compos. Struct. 2019, 220, 736–748. [Google Scholar] [CrossRef]
  16. Ye, J.-B.; Cai, J.; Chen, Q.-J.; Liu, X.; Tang, X.-L.; Zuo, Z.-L. Experimental Investigation of slender RC columns under horizontal static and impact loads. Structures 2020, 24, 499–513. [Google Scholar] [CrossRef]
  17. Code for Design of Concrete Structure (GB50010-2010); Architecture Industry Press: Beijing, China, 2010. (In Chinese)
  18. Szymczak-Graczyk, A.; Ksit, B.; Laks, I. Operational problems in structural nodes of reinforced concrete constructions. IOP Conference Series. Mater. Sci. Eng. 2019, 603, 032096. [Google Scholar] [CrossRef]
  19. CEB. Concrete Structures under Impact and Impulsive Loading; Committee Euro-International du Beton: Lausanne, Switzerland, 1998. [Google Scholar]
  20. Malvar, L.J.; Crawford, J.E. Dynamic Increase Factors for Steel Reinforcing Bar. In Proceedings of the 28th DDESB Seminar, Orlando, FL, USA, 18 August 1998. [Google Scholar]
  21. Malvar, L.J.; Ross, C.A. A review of strain rate effects for concrete in tensions. ACI Mater. J. 1998, 95, 735–739. [Google Scholar]
  22. Cowper, G.R.; Symonds, P.S. Strain-Hardening and Strain-Rate Effects in the Impact Loading of Cantilever Beams; Report; Brown University: Providence, RI, USA, 1957. [Google Scholar]
  23. Guo, J.L.; Cai, J.; Chen, W.S. Inertial effect on RC beam subjected to impact loads. Int. J. Struct. Stab. Dy. 2017, 17, 1750053. [Google Scholar] [CrossRef]
  24. Zhao, D.B.; Yi, W.J.; Kunnath, S.K. Shear mechanism in reinforced concrete beams under impact loading. J. Struct. Eng. 2017, 143, 04107089. [Google Scholar] [CrossRef]
  25. Fujikake, K.; Li, B.; Soeun, S. Impact response of reinforced concrete beam and its analytical evaluation. J. Struct. Eng. 2009, 135, 938–950. [Google Scholar] [CrossRef]
  26. Tachibana, S.; Masuya, H.; Nakamura, S. Performance based design of reinforced concrete beams under impact. Nat. Hazards Earth Syst. Sci. 2010, 10, 1069–1078. [Google Scholar] [CrossRef] [Green Version]
  27. Kishi, N.; Mikami, H.; Matsuoka, K.G.; Ando, T. Impact behavior of shear-failure-type RC beams without shear rebar. Inter. J. Impact Eng. 2002, 27, 955–968. [Google Scholar] [CrossRef]
  28. Kishi, N.; Mikami, H. Empirical formulas for designing reinforced concrete beams under impact loading. ACI Struct. J. 2012, 109, 509–519. [Google Scholar]
  29. Adhikary, S.D.; Li, B.; Fujikake, K. State-of the art review on low-velocity impact response of reinforced concrete beams. Mag. Concr. Res. 2015, 68, 701–723. [Google Scholar] [CrossRef]
  30. Cai, J.; Ye, J.-B.; Chen, Q.-J.; Liu, X.; Wang, Y. Dynamic behaviour of axially-loaded RC columns under horizontal impact loading. Eng. Struct. 2018, 168, 684–697. [Google Scholar] [CrossRef]
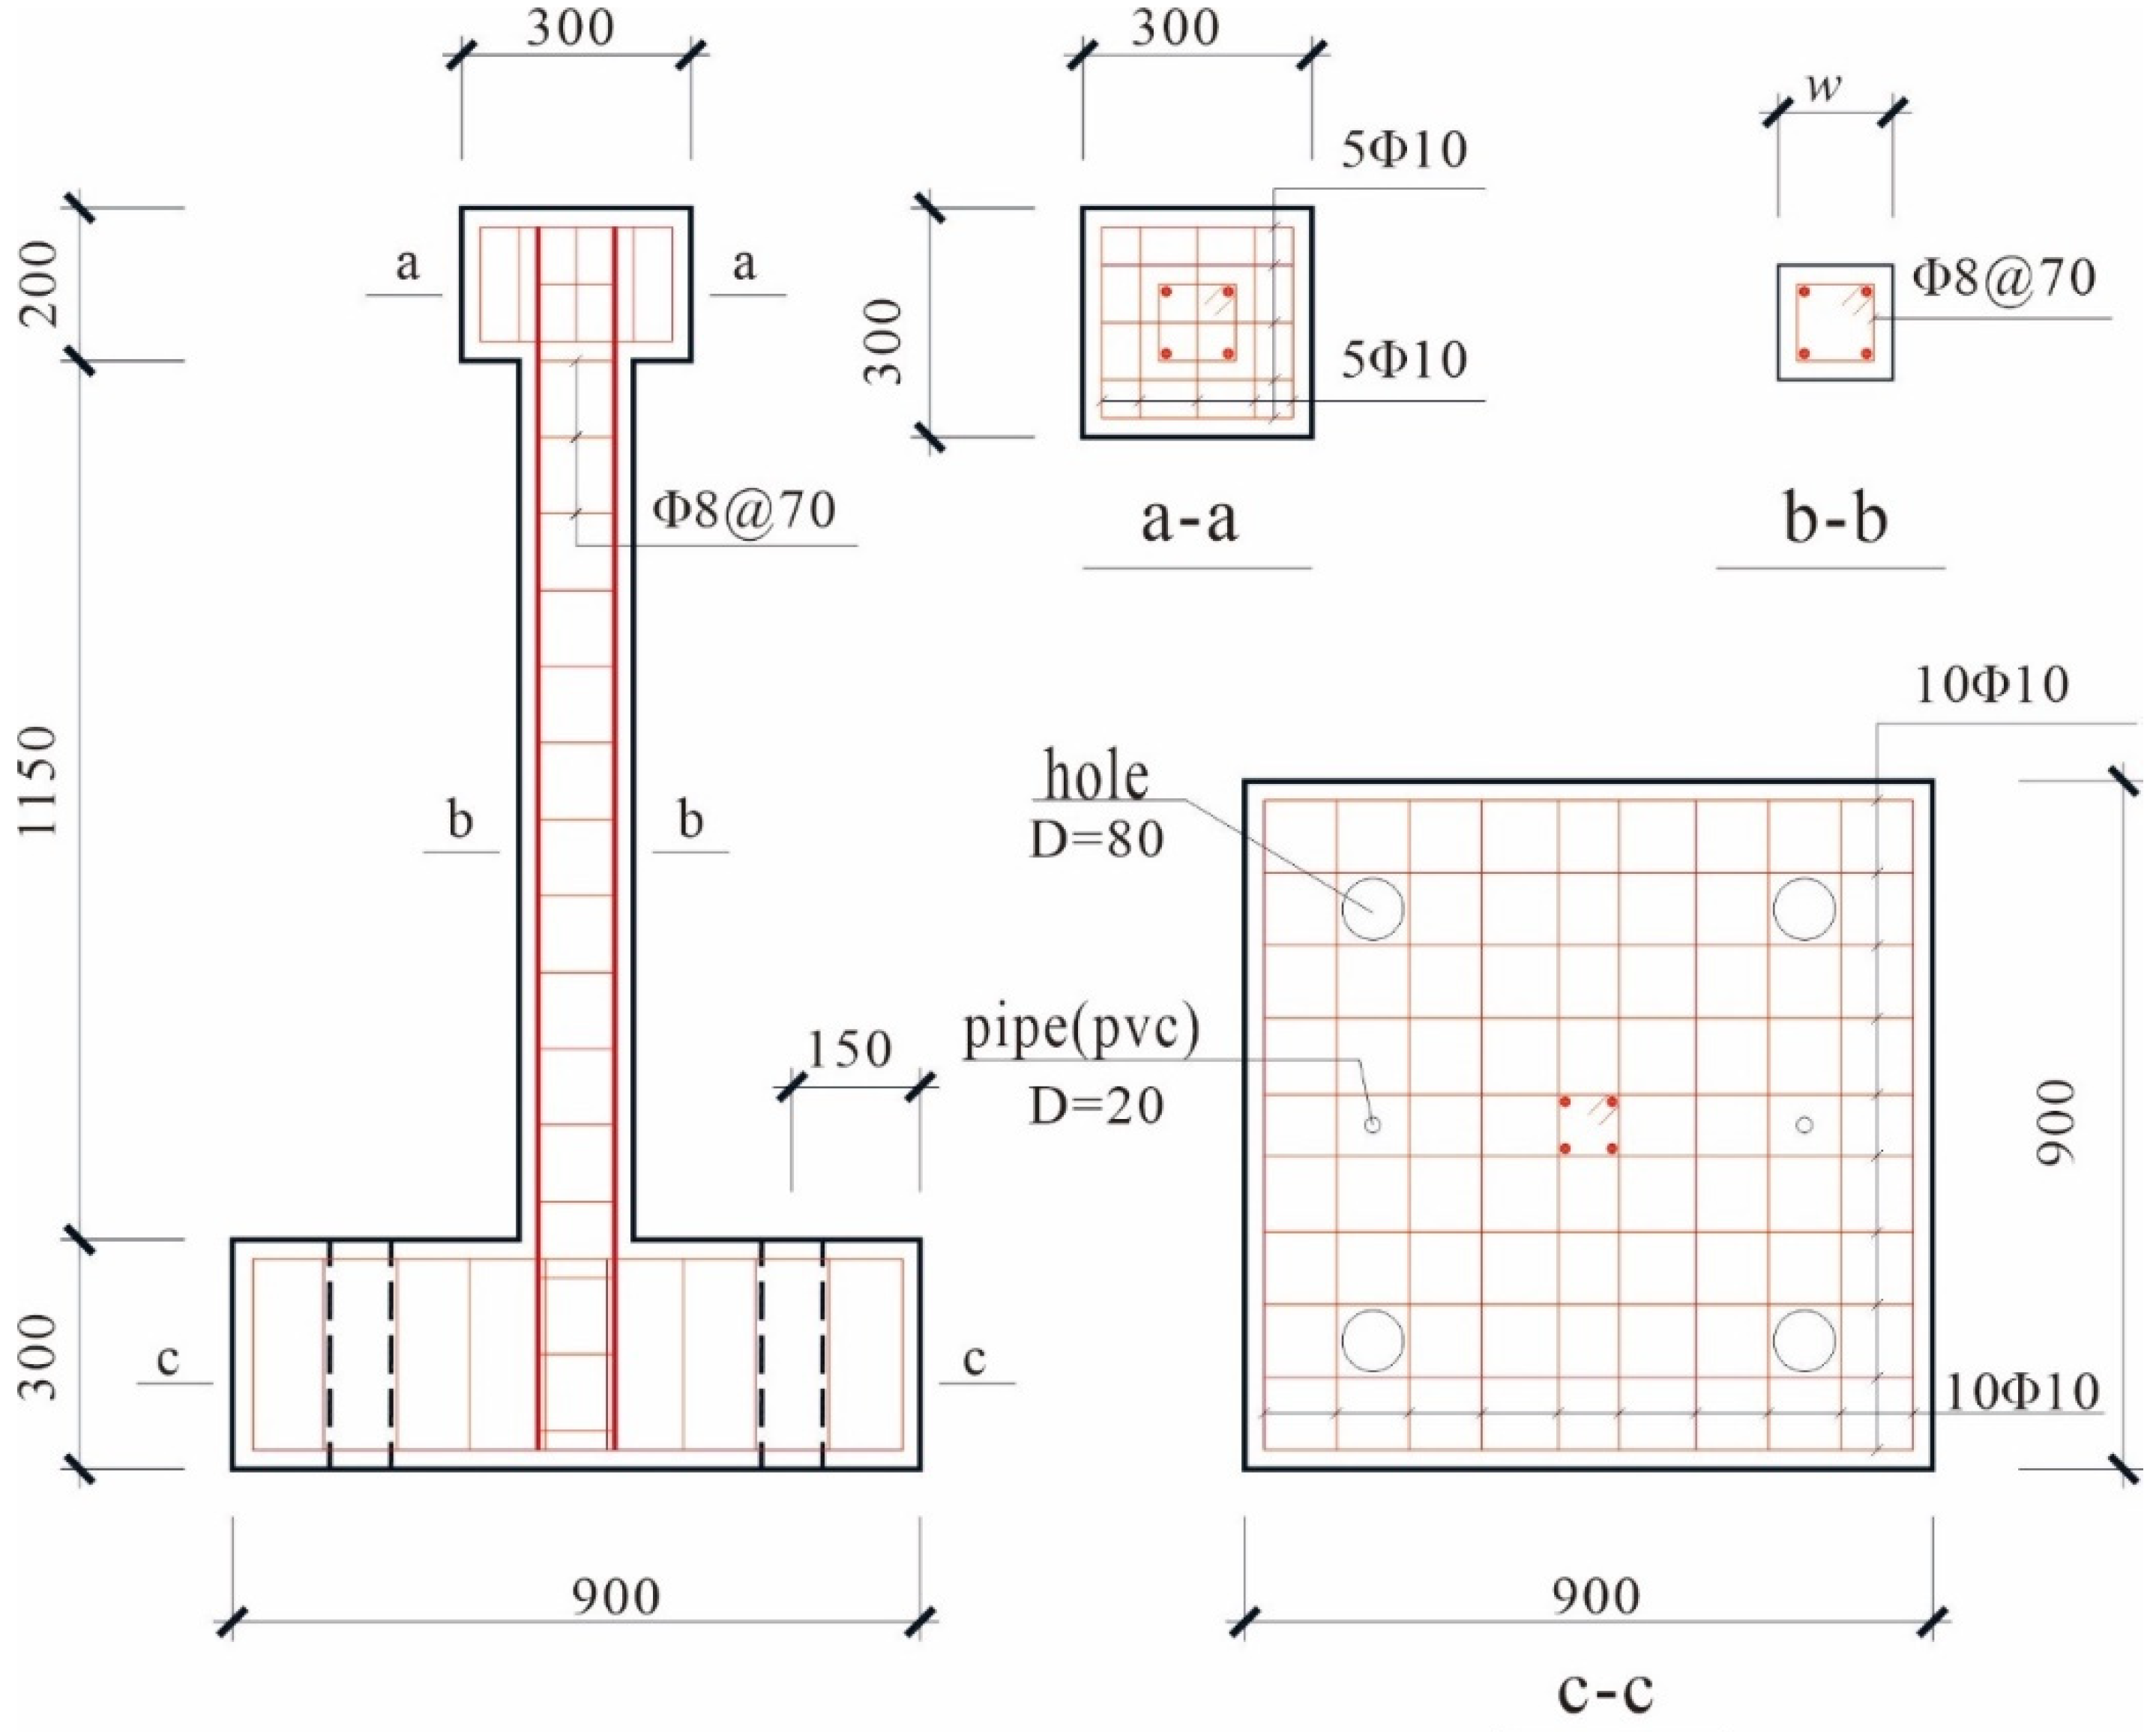
Figure 1. Specimen dimensions and reinforcement.
Applsci 11 11223 g001
Figure 2. Static testing setup: (a) sketch of test system; (b) photo of the loading program.
Applsci 11 11223 g002
Figure 3. Impacting testing setup: (a) sketch of the impact testing system; (b) components of the horizontal impact facility; (c) photo of the test truck; (d) photo of the drop-weight impact facility.
Applsci 11 11223 g003
Figure 4. Layout of measuring points.
Applsci 11 11223 g004
Figure 5. FEM of RC column.
Applsci 11 11223 g005
Figure 6. Applied prestress by cooling method.
Applsci 11 11223 g006
Figure 7. Connection method between the top plate and prestressing bars.
Applsci 11 11223 g007
Figure 8. Comparison of the damage status under static load (experimental versus numerical).
Applsci 11 11223 g008
Figure 9. Comparison of the load-displacement curve under static load (experimental versus numerical).
Applsci 11 11223 g009
Figure 10. Comparison of the damage status under impact load (experimental versus numerical).
Applsci 11 11223 g010
Figure 11. Comparison of the impact force and displacement time history (experimental versus numerical).
Applsci 11 11223 g011
Figure 12. Comparison of load-displacement curves under impact loads (experimental versus numerical).
Applsci 11 11223 g012
Figure 13. Change in the cross-sectional shear during static and impact loading.
Applsci 11 11223 g013
Figure 14. V-t curve under impact load (influence of velocity).
Applsci 11 11223 g014
Figure 15. Change in the cross-sectional bending moment during static and impact loading.
Applsci 11 11223 g015
Figure 16. Variation of the section’s bending moment during static load and different impact velocity.
Applsci 11 11223 g016
Figure 17. Influence law of the impact energy on each response index.
Applsci 11 11223 g017
Figure 18. Damage of the column under Ek1 (peeq contour).
Applsci 11 11223 g018
Figure 19. M-u1 curve under different kinetic energies Ek.
Applsci 11 11223 g019
Figure 20. Schematic diagram of the M-u1 curve under an impact load.
Applsci 11 11223 g020
Figure 21. Failure diagram of reinforced concrete members under load.
Applsci 11 11223 g021
Figure 22. Calculation diagram of deformation energy under impact.
Applsci 11 11223 g022
Figure 23. Feq/Fsu ratio of all specimens.
Applsci 11 11223 g023
Table 1. Setting the concrete material parameters.
vρ/(kg·m−3)Ea/GPaeαfKεμψ/(°)
0.2250036.20.11.160.66670.0000138
Note: v is Poisson’s ratio; ρ is the density; Ea is the elastic modulus; e is the flow potential eccentricity; αf is the ratio of the biaxial ultimate compressive strength to the uniaxial ultimate compressive strength; Kε is the ratio of the second invariant of stress on tensile meridian to that on compressive meridian; μ is the viscosity coefficient; and ψ is the dilation angle.
Table 2. Rebar material parameters.
ρ/(t/mm3)E/MPavεufy/(MPa)fu/(MPa)
Φ8Φ10Φ12Φ8Φ10Φ12
7.8 × 10−92.1 × 1050.30.2408.8424.6470.4541.1642.3685.7
Note: ρ is the density; E is the elastic modulus; v is Poisson’s ratio; εu is the ultimate strain; fy and fu are the yield strength and ultimate strength, respectively.
Table 3. Number of meshes and calculation time under different mesh sizes.
Mesh size40 mm25 mm10 mm
Number of concrete714016,52060,765
Number of reinforcement184821363328
Calculation time3 h 57 min7 h 15 minError report after 39 h 11 min (excessive mesh deformation)
Table 4. Calculation model parameters and results under the same initial kinetic energy Ek.
Ek (kJ)Specimen Numberm (t)v0 (m/s)td (s)umax (mm)Mmax (kN·m)
2DZ150-Ek1-0.20.24.470.0560.115.4
DZ150-Ek1-0.50.52.830.0765.615.6
DZ150-Ek1-112.000.172.715.9
DZ150-Ek1-441.000.272.916.23
DZ150-Ek1-880.710.2872.815.93
DZ150-Ek1-12120.580.3574.415.99
DZ150-Ek1-16160.500.474.216.05
DZ150-Ek1-20200.450.4574.416.04
DZ150-Ek1-30300.360.5774.416.1
DZ150-Ek1-40400.320.6674.616.08
1DZ150-Ek2-0.20.23.160.0334.814.5
DZ150-Ek2-0.50.52.000.0438.916.1
DZ150-Ek2-111.410.0741.415.7
DZ150-Ek2-440.710.1844.315.3
DZ150-Ek2-880.500.2544.615.5
DZ150-Ek2-12120.410.343.815.4
DZ150-Ek2-16160.350.3544.715.6
DZ150-Ek2-20200.320.3942.615.8
DZ150-Ek2-30300.260.4843.816.1
DZ150-Ek2-40400.220.5644.116.0
0.5DZ150-Ek3-0.20.22.240.0221.914.6
DZ150-Ek3-0.50.51.410.0324.415.8
DZ150-Ek3-111.000.0525.715.8
DZ150-Ek3-440.500.1626.515.3
DZ150-Ek3-880.350.2226.915.5
DZ150-Ek3-12120.290.2726.315.3
DZ150-Ek3-16160.250.3126.015.6
DZ150-Ek3-20200.220.3526.815.7
DZ150-Ek3-30300.180.4226.415.9
DZ150-Ek3-40400.160.4926.315.8
0.2DZ150-Ek4-0.20.21.410.0212.713.6
DZ150-Ek4-0.50.50.890.0413.713.7
DZ150-Ek4-110.630.0714.313.9
DZ150-Ek4-440.320.1414.413.9
DZ150-Ek4-880.220.214.614.0
DZ150-Ek4-12120.180.2414.514.1
DZ150-Ek4-16160.160.2814.514.1
DZ150-Ek4-20200.140.3214.414.2
DZ150-Ek4-30300.120.3814.513.7
DZ150-Ek4-40400.100.4514.513.8
Table 5. Comparison of equivalent static load-bearing capacity calculated by Formula (11) and ultimate load-bearing capacity.
Specimen TypeSpecimen Tagm (t)v0 (m/s)Eab (kJ)umax (mm)Feq/Fsu
w = 120 mmDZ120-11.20.8020.38352.980.76
DZ120-21.50.7940.46369.750.69
DZ120-31.80.8690.52072.660.75
w = 150 mmDZ150-11.21.0830.75344.901.00
DZ150-21.50.7670.43035.310.73
DZ150-31.80.8910.70550.410.83
DZ150-41.50.3290.0346.940.29
DZ150-50.5920.20820.860.59
DZ150-60.9350.86647.801.08
DZ150-71.1911.13860.621.12
w = 180 mmDZ180-11.20.7910.15813.420.44
DZ180-21.50.7430.25717.610.55
DZ180-31.80.9070.90731.121.08
DZ180-41.50.5030.0829.110.34
DZ180-51.2911.23046.040.99
Publisher’s Note: MDPI stays neutral with regard to jurisdictional claims in published maps and institutional affiliations.