Article

Experimental Study on the Temporal and Morphological Characteristics of Dynamic Tensile Fractures in Igneous Rocks

1
State Key Laboratory of Explosion Science and Technology, Beijing Institute of Technology, Beijing 100081, China
2
China Safety Technology Research Academy of Ordnance Industry, Beijing 100053, China
*
Author to whom correspondence should be addressed.
Appl. Sci. 2021, 11(23), 11230; https://doi.org/10.3390/app112311230
Submission received: 4 November 2021 / Revised: 21 November 2021 / Accepted: 23 November 2021 / Published: 26 November 2021

Abstract

:
In order to investigate the temporal and morphological characteristics of dynamic tensile fractures, experiments on Brazilian specimens machined from igneous rocks (Breccia and Andesite) are carried out with the split Hopkinson pressure bar (SHPB). Detailed observation of the fracture processes of the Brazilian specimens is captured by high-speed camera at a frame rate of 100,000 frames per second. The rate-dependent effect of the dynamic tensile strength of the two igneous rocks is fitted and predicted by the incubation time criterion. Digital image correlation (DIC) is used to calculate the full-field tensile strain distributions on the specimen surface during the loading stage preceding fracture, and this hysteresis of dynamic fracture relative to stress level is interpreted by introducing the concept of incubation time. After the main crack appears, image processing technology is exploited to extract the pixel information of cracks in the high-speed images. Then, FracPaQ quantifies the morphology of the fragmentized process by filling the binarization of cracks with fracture traces. After coordination of the statistical information from these fracture traces, the rose diagram representing their angles and length weights can visually represent the fragmentized characteristics of the Brazilian specimen. Specifically, length-angle distributions of fracture traces at various moments are consistent with the Gaussian function, and the curve fitting parameters reflect differences in the fracture behaviors between the two igneous rocks. In conclusion, the dynamic fracture characteristics of two igneous rocks in dynamic splitting processes are quantified statistically, which can provide references for relevant research.

1. Introduction

As a common geological material, rocks are a feature of many engineering applications such as mining science, underground construction, tunnel excavation, military bunkers, etc. In these geological engineering works, rocks are often subjected to dynamic loads over a wide range of strain rates. Sources of dynamic loads include seismic and earthquake, impact and penetration, explosion and blasting [1]. Therefore, it is significant to study the dynamic fracture characteristics of rock materials. The dynamic properties of materials are often determined by split Hopkinson pressure bar (SHPB), which can provide a constant strain rate in the range of 101–104 s−1 [2]. Xia and Yao [3] detailed the development history and principles of the SHPB system. Based on the one-dimensional stress wave theory, the stress–strain curve can be calculated through the strain signals measured by strain gauges on the incident and transmitted bars. Because of the difficulty of the direct test [4], most scholars use indirect testing to determine the tensile strength of rock. As an indirect method, the Brazilian test has been widely used in the laboratory to measure the tensile strength of brittle materials with an apparently low ratio of tensile-to-compressive strengths. Zhao and Li [5] investigated the dynamic tensile properties of granite with the Brazilian test, and this approach has been referenced by many relevant researchers. Wong et al. [2] compared the tensile strength and fracturing of Carrara marble under quasi-static and dynamic Brazilian tests. The influence of different loading conditions on the initiation, enlargement, and coalescence of cracks was observed [6]. Zhu et al. [7] used the SHPB system with Brazilian specimens to determine the indirect tensile strength of rock under an intermediate strain rate ranging from 5.2 to 12.9 s−1. Zhou et al. [8] investigated the dynamic tensile characteristics of rock under highly confining stresses through the Brazilian test with a dynamic and static coupled loading SHPB system. In their report, the tensile strength of the granite decreased with the static pre-stress increases. Heard et al. [9] elaborated the dynamic tensile experimental techniques for rock. Three kinds of specimen or fixture configurations for the Brazilian test were presented and compared. The most obvious difference among them was the fracture pattern. For easy preparation of specimens (except flattened Brazilian), a pair of curved anvils between the bar ends and a specimen can prevent the damage or failure caused by local stress concentration when the specimen is directly loaded by bars. Regarding the effects of anvils in dynamic Brazilian tests, Dai et al. [10] discussed its necessity. Two sets of measured tensile strengths of Laurentian granite from the SHPB system with and without curved anvils at the contact end showed a consistency in dynamic tensile strength. The above research indicated the feasibility of using the Brazilian test on an SHPB when determining the dynamic tensile strength of rock materials. In this paper, suggestions from the ISRM test method regarding Brazilian tests on an SHPB system were followed [11].
Generally, the stress level within the material at the fracture moment is defined as the strength, and the rate-dependent effect of the dynamic strength is the research concern. The experimental results of the SHPB are usually presented as the ratio of a measured dynamic strength to a quasi-static strength, i.e., dynamic increase factor (DIF) or normalized dynamic strength. The DIF is usually fitted to be a function of strain rate in logarithm space [1]. Although this approach can simply and intuitively describe the rate-dependent effect of dynamic strength, it ignores the time effect in the dynamic response process. Qian et al. [12] emphasized that the deformation and fracturing processes require time to be mobilized, to develop, and to complete, and the fracture strength depends on strain rates. Kalthoff [13], Homma [14], and Shockey [15] proposed and explored the physical parameters related to the time effect in the dynamic fracture process of brittle materials, called incubation time. Based on the concept of incubation time, Petrov et al. [11,16] proposed the structure–time fracture criterion. The dynamic strength of rock and concrete-like brittle materials was studied against this criterion and its simplified form. In Bragov’s research [17], a unified interpretation of sensitivity to strain or stress rate of the mechanical properties of fiber-reinforced concrete was presented. The dynamic compressive strength, split tensile strength, and dynamic toughness of the concrete can be predicted by the incubation time criterion. Similarly, the incubation time criterion has been applied to analysis of the dynamic strength characteristics of rock materials. The incubation time was considered to be an important temporal property that affected the dynamic strength of rock when comparing the experimental results of different types of rocks [18]. Then, in the experiments on rock specimens, different saturations and temperatures demonstrated the influence of physical condition changes on incubation time [19,20,21].
The measured temporal waveforms of strain on incident and transmitted bars in the SHPB system are the basic experimental data. When strain gauges are mounted on the specimen, deformation history at a given location can be captured. As a standard measurement technique, strain gauges can only measure the average strain in a limited region. A non-contact full-field measurement method such as digital image correlation (DIC) based on image processing has been used for determining rock deformation [22]. With the development of the high-speed camera, the strain field in the dynamic response processes of rocks can be calculated by DIC [6,23,24]. The DIC technique in conjunction with the high-speed camera and strain gauges were simultaneously used to determine the deformation of specimens in dynamic notched semi-circular bending (NSCB) and Brazilian tests. Comparison of the determination of strain gauges and the DIC indicated that the DIC technique provided reliable results. Fourmeau et al. [25] captured the deformation preceding the dynamic fracture of Brazilian test on Kuru granite rock by combining the high-speed camera with DIC. Gao et al. [26] obtained the crack-tip position and dynamic stress intensity factors from DIC analysis of dynamic NSCB tests on Laurentian granite. In contrast to NSCB and Brazilian tests, dynamic compression tests observe a cylindrical surface of rock specimen with a high-speed camera. The comparison of the resulting strain fields from the 2D- and 3D-DIC techniques in the same experiment indicated that 3D-DIC technology obtained more accurate data of strain fields on the arc surface of specimen [27]. Wave propagation, dispersion, and radial inertial effects on specimens during the dynamic compression process were found by the DIC technique. A detailed description of high-speed cameras and the DIC technique for geomaterials provides a specific reference of the relevance [28].
In the description of the dynamic fracture behaviors of rock materials, a single indicator of strength is not satisfactory. The morphological characteristics of crack initiation, propagation, penetration, and formation are equally important. In the dynamic Brazilian testing, the DIC technique can be used to analyze the full-field strain distribution on the surface of the rock specimen based on the high-speed images at the crack initiation stage. When the central main crack is formed, the secondary crack will accompany it at the contact end. The cracks’ interaction forms the fragmentation of the rock specimen, which is clearly recorded by high-speed camera. As a widely acknowledged dynamic fracture pattern, the fracture morphology of Brazilian specimens is often characterized simply and qualitatively as central cracking. FracPaQ [29], a MATLAB-based open source code, can been used to further quantify this process. In FracPaQ, the Hough transform method [30,31] is used to find co-line patterns of pixels in the image and produce fracture traces. Subsequently, the distribution characteristics such as orientations, lengths, intensity, density, and connectivity of the fracture can be analyzed statistically.
In this paper, two kinds of igneous rocks were collected from the same volcanic vein. Their dynamic fracture behaviors in Brazilian tests under SHPB loading were determined and investigated. Specifically, the temporal waveform signals collected by the dynamic strain gauges were analyzed, and the dynamic tensile strengths under different impact loadings were fitted and predicted by the incubation time criterion. A high-speed camera combined with the DIC technique was used to investigate strain fields on the observed surface of specimens at the initial crack stage. In combination with the incubation time, the temporal hysteresis of tensile fracture relative to the stress level was revealed. Finally, the fragmentized processes of rock specimens were quantified by fracture traces with FracPaQ. The morphological characteristics of cracks, including spatial distribution, orientations, lengths, and density, were investigated and accounted for.

2. Experimental System and Principle

The SHPB system applied in this experiment was located at the China University of Mining and Technology, Beijing, China. The specimens of two igneous rocks, Breccia and Andesite, had the same dimensions, i.e., a cylinder with a 50 mm diameter and 25 mm height. According to the ISRM [11,32] recommendation for indirect tensile strength tests with the Brazilian method configuration, the cylindrical surfaces and end faces should be precisely machined to ensure non-parallel orientation of the ends within an accuracy of ±0.05 mm and perpendicular to the longitudinal axis within ±0.25°. In the dynamic splitting tests, 10 Brazilian specimens were prepared from the Breccia and Andesite. In addition, there were no visible pre-existing cracks on the specimen surfaces. The anisotropy for rock tensile strength drastically diminishes with an increased loading rate [33]. Therefore, in the present study, the samples were considered to be isotropic and homogeneous rock without discontinuities.

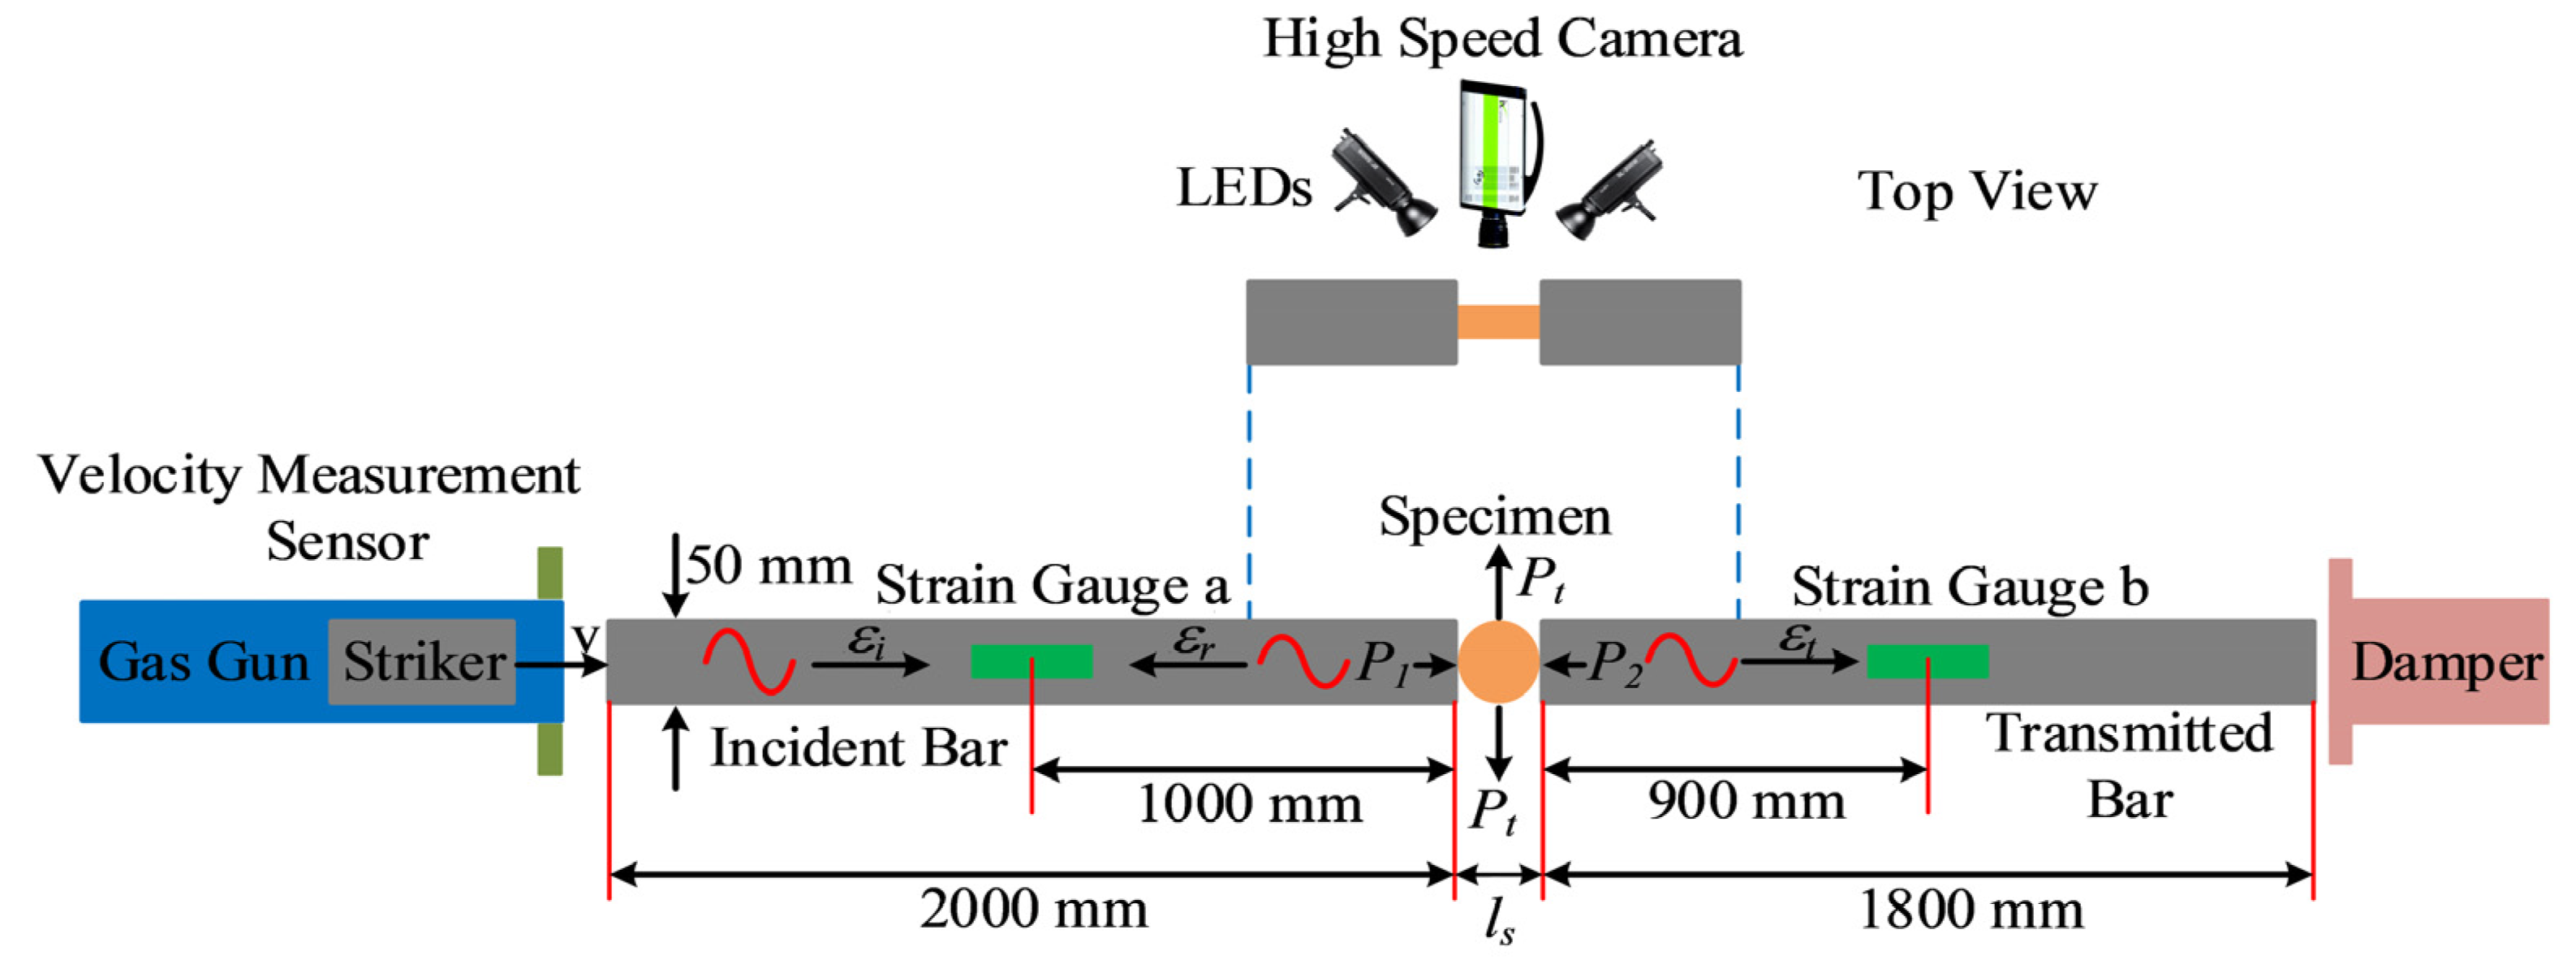
2.1. Experimental System

The experimental system was mainly composed of the SHPB bars (Luoyang Liwei Technology CO., Ltd., Luoyang, Henan, China), control system (Luoyang Liwei Technology CO., Ltd., Luoyang, Henan, China), data acquisition system (Jiangsu Donghua Testing Technology Ltd., Jingjiang, Jiangsu, China), and high-speed photography system (IX-Cameras Inc., Rochford, Essex, UK), as shown in Figure 1. The bars were made from steel with a 206 GPa Young’s modulus and 5160 m/s elastic wave velocity. The length and diameter of the striker bar, the incident bar, and the transmission bar were 400 mm × 50 mm, 2000 mm × 50 mm, and 1800 mm × 50 mm, respectively. At the other end of the transmission bar, a damper was arranged to absorb the transmitted wave. The dynamic resistance strain gauges (DC-97A), which were connected to an oscilloscope, were mounted at midpoints of the incident and transmission bars. The deformation signals were stored by the stress pulse recorder. For capturing the images of fracture process, the high-speed camera (i-speed 716, IX-Cameras Inc., Rochford, Essex, UK) was arranged in the direction perpendicular to the circular section of rock specimen. Two sets of lights (LEDs) were used as illuminations for the camera, providing continuous light output of 200 W power. Under this configuration, images were captured at a frame rate of up to 100,000 fps (frames per second) with a resolution of 672 × 216 pixels [28]. In order to avoid damage to the equipment by the ejection of rock fragments, the specimen was placed in a recycling box with a shooting window, and a polymethyl methacrylate (PMMA) shield was placed between the camera and specimen for protection.

2.2. Principles of the Dynamic Brazilian Test under SHPB Loading

As illustrated in Figure 2, the striker bar is driven up to a velocity (V) by a gas gun with compressed nitrogen gas. The striker bar then impacts on the incident bar, generating a compressive wave (traveling to the right) in the incident bar and another compressive wave (traveling to the left), with the same stress magnitude, in the strike bar. The free surface (left end) of the striker bar reflects the compressive wave as a tensile wave, which leads to a release wave in the incident bar. When the incident wave reaches the interface between the rock specimen and the incident bar, a part of the wave is reflected back as the reflected wave. The incident and reflected waves are recorded by the strain gauge (Gauge a) on the incident bar, and the corresponding strain histories are denoted εi(t) and εr(t), respectively. The remaining wave passes through the specimen and transmits into the transmission bar. The strain gauge (Gauge b) records the strain history, εt(t), of the transmitted wave.
From the one-dimensional stress wave theory [34], the forces P1(t), P2(t) at the contact points of the specimen can be expressed as:
P 1 ( t ) = E A [ ε i ( t ) + ε r ( t ) ] ,
P 2 ( t ) = E A ε t ( t )
where E and A are the Young’s modulus and the cross-sectional area of the bars, respectively. When the stress equilibrium, ε i ( t ) + ε r ( t ) = ε t ( t ) , in specimens is achieved, the equation, P 1 ( t ) = P 2 ( t ) , will be satisfied. The indirect tensile stress in the specimen is expressed as:
σ t ( t ) = 2 P t ( t ) π D B
where D and B are the diameter and thickness of Brazilian specimen, respectively, and the force is calculated by the equation, P t ( t ) = [ P 1 ( t ) + P 2 ( t ) ] / 2 [23].

3. Incubation Time Criterion

When the effects of the stress or strain rate on the dynamic strength of brittle materials are investigated, the strength is usually defined as the transient stress at fracture moment, which is extended from quasi-static to dynamic cases. Then, the relationship between dynamic strength and stress or stain rate is empirically modeled [35]. Although this approach is concise and intuitive, the phenomenological law obtained by the simple fitting of experimental data lacks relevant physical meaning. The structure–temporal criterion reflects the fracture mechanism by operating with spatial and temporal scales [36].
1 τ t τ t 1 d x d x σ ( x , t ) d x d t σ 0 .
Equation (4) can be used to determine a macroscopic prefabricated crack growing in brittle material at a point x at time t under dynamic loading. Where τ is the incubation time for a specific material, it is the characteristic constant response to the load on the time scale, and d is the other material constant reflecting the sensitive size of the fracture process zone, which characterizes the fracture on the spatial scale. The integrand σ (x′, t′) is the continuous stress field, and σ is the corresponding quasi-static strength of materials. Intact rock specimens used in laboratory tests generally have dimensions that range from millimeters to several centimeters, and the assumption of uniformity must be satisfied. These naturally correspond to the operations of the structure–temporal criterion on the spatial scale [18]. Thus, Equation (4) can be simplified and rewritten as:
1 τ t τ t σ ( t ) d t σ 0 .
Equation (5) is recalled as the incubation time criterion. As the criterion reveals, the fracture is considered as a time-dependent process. The upper limit of integration (t) is the formed moment of fracture, and the integral boundary implies an incubation period preceding the fracture-induced macrostructural transformation. Microscopic scanning of the dynamic fracture surfaces of brittle materials reveals that the fracture surface becomes rougher with the increasing loading rate and is accompanied by additional microcracks that are not parallel to the main fracture surface [37]. Dalmas et al. [37] suggested that this is a result of the additional microdefects in the vicinity of the crack tip being excited by the stress field with high rates that extend and interact with the main crack. This microscopic incubation process preceding the macroscopic fracture can be synthetically considered as a characteristic time associated with microcracking relaxations. The temporal hysteresis between dynamic fracture and stress level is reflected in the approach of Equation (5).
If the rate dependence of rock dynamic strength under SHPB loading is studied by Equation (5), we can assume that the stress increases in the rock at a constant rate before fracture occurs [17,20]. That is described mathematically as:
σ ( t ) = σ ˙ t H ( t )
where σ ˙ is the stress rate, and H(t) is the Heaviside step function. Substituting Equation (6) into the incubation time criterion (Equation (5)), the transient stress at fracture is obtained:
σ * = σ ( t * ) = { σ 0 + σ ˙ τ / 2 ( t * τ ) 2 σ ˙ σ 0 τ ( t * τ ) .
Obviously, for the low loading rate, the quasi-static strength satisfies the state of t* ≥ τ in Equation (7). Especially under the quasi-static loads, σ ˙ 0 , the transient stress at the fracture is equal to the quasi-static strength. On the other hand, the transient stress at the fracture with the high loading rate satisfies the condition of t* < τ, which indicates that the dynamic strength enhancement of the materials is influenced by the stress rate, quasi-static strength, and incubation time.

4. Results and Analysis

The experimental data of the SHPB were processed and summarized, and the reliability of the data was verified by the three-wave method and the stress equilibrium factor. Then, the stress rate correlation of the dynamic tensile strength of the two igneous rocks was fitted and predicted by the incubation time criterion. The full-field strain in the main crack initiation stage was calculated by the DIC technique. At last, the fragmentized process of a typical specimen was analyzed quantitatively. The main crack opening velocity was obtained by binary image. FracPaQ generated and fulfilled fracture traces into cracks based on binarization of high-speed images. The rose diagram drawn according to fracture trace statistics reproduced the fragmentized characteristics of the Brazilian specimens. Further analysis showed that the length distribution of the fracture traces in orientation conformed to the Gaussian function.

4.1. Experimental Data

Dynamic responses of the Breccia and Andesite to impact loads recorded by the SHPB system are shown in Figure 3 and Figure 4, respectively. Among them, (a) is the raw signal recorded by the incident and transmission bars. Raw electric potential signals contain considerable noise. After removing the high-frequency noise by FFT filter with 0.02 Hz cutoff frequency, the available electric potential-time curves were obtained. Figure 3b and Figure 4b respectively show the raw and filtered signals of Breccia at 4.86 m/s striking velocity and Andesite at 4.88 m/s striking velocity. The rock specimen in the state of stress equilibrium before fracture occurs was a basic assumption of the SHPB experiment. Figure 3c and Figure 4c confirm the stress equilibrium by the three-wave equilibrium theory, i.e., In. + Re. = Tr. The forces acting on the contact ends between rock specimen and bars, including both the incident and transmitted bars, were calculated by Equations (1) and (2) in Section 2.2. To further validate the stress equilibrium, the curve of stress equilibrium factor, η = 2 ( P 1 P 2 ) / ( P 1 + P 2 ) [38], against time was used to reflect the loading state of the rock specimen in the process of resisting impact load. As shown in Figure 3d, the stress equilibrium factor at 4.86 m/s striking velocity was still approximately zero until reaching the extreme values of P1 and P2 at 92 μs, then the Breccia specimen fracture caused a fluctuation of the curve. Similar phenomena also occurred in the Andesite specimen at 4.88 m/s striking velocity, but the Andesite specimen lost its stress equilibrium at 225 μs, which was almost 79 μs after the extreme values of P1 and P2. Although the igneous rock specimens lost their stress equilibrium at different times of the P1 and P2 curves, Breccia at the time of extreme value and Andesite after the time of extreme value, they all satisfied the prerequisite of the SHPB experiment. Therefore, the reliability of the experimental results was verifiable. The tensile stress at the center of the disc was calculated by Equation (3), as shown in Figure 3e and Figure 4e. A constant loading rate was obtained by linearly approximating the rising stage of the temporal tensile stress waveform. As shown in Figure 3e, the dynamic tensile strength of the Breccia was 7.856 MPa, corresponding to a fracture time of 85.8 μs at a loading rate of 134.6 GPa·s−1. The dynamic strength of the Andesite was 24.64 MPa, corresponding to a time of 145 μs at a loading rate of 278.5 GPa·s−1, as shown in Figure 4e.

4.2. Rate-Dependent Effect of Dynamic Tensile Strength

The rate-dependent effect of dynamic tensile strength of the Breccia and Andesite was fitted and predicted by the incubation time criterion mentioned in Section 3. The scatters in Figure 5 are the dynamic tensile strengths determined by the dynamic Brazilian tests, also including the quasi-static strength of Breccia (σ0 = 4.05 MPa) and Andesite (σ0 = 8.13 MPa). Among them, the stress rate of the Breccia specimens was distributed in the range of 108.8~161.6 GPa·s−1, and that of the Andesite specimens was distributed in the range of 242.6~292.9 GPa·s−1. Fitting Equation (7) to the experimental data using the least squares method, we obtained the incubation times of Breccia and Andesite, which were 61.5 and 124.3 μs, respectively. The predictions of the dynamic tensile strengths of the two igneous rocks under different stress rates are shown as the continuous lines in Figure 5. Their variations indicated that the tensile strength enhancement induced by stress rate was determined by quasi-static strength and incubation time.

4.3. Full-Field Strain Measurement of Typical Specimens by DIC

The digital image correlation (DIC) technique is a non-contact measurement method for deformation. Full-field strains from the DIC analysis are based on the matching of pixel subsets in images, which can reveal the deformation evolution and the progressive fracture process of specimen. In the experiments with rock, this technique combined with a high-speed camera was applied for strain measurements under impact and explosion loads [23]. In this experiment, a high-speed camera (i-speed 716, IX-Cameras Inc.) was used to capture rock dynamic fracture processes in dynamic Brazilian tests with an image resolution of 672 × 216 pixels and a frame rate of 100,000 fps, corresponding to a time interval of 10 μs. The first frame captured by the high-speed camera was chosen as the reference image for DIC analysis, and the frame without obvious stress fluctuation in the calculation results was defined as 0 μs. Figure 6 and Figure 7 show the vertical strain fields distributed on the observed surface of the Breccia and Andesite specimens, respectively. Figure 6 shows the evolution process of the vertical stress field of the Breccia specimen at 4.86 m/s striking velocity, which is the typical result mentioned in Figure 3. An obvious strain concentration area appeared after the incident wave was reached, as shown in Figure 6b,c. As the loading continued, the main cracks initiated in the center of the specimen then extended to the contact points, as shown in Figure 6d–f. Figure 7 shows the similar vertical stress field evolution process of the Andesite specimen, which displayed the typical results at 4.88 m/s striking velocity mentioned in Figure 4. The difference between the typical results of the two igneous rocks was the initiation time of the main crack. As shown in Figure 6 and Figure 7, the times of observable main crack initiation in the Brazilian specimens were 100 µs for Breccia and 230 µs for Andesite. These were approximated with the times at which the specimens lost dynamic equilibrium, 92 µs for Breccia and 225 µs for Andesite, as shown in Figure 3d and Figure 4d. Where the main failure processes of the Brazilian specimens were concerned [23], the results of the DIC were presented from 80 and 210 µs, respectively, as shown in Figure 6 and Figure 7. In a word, the results of the DIC technique reproduced the strain field evolution on the surface of the Brazilian specimens under SHPB loading.

4.4. Characterizing the Fragmentized Process of Typical Specimens

With the opening of the main crack on the surface of the specimen, secondary cracks dominated by shear stress gradually occurred at the contact points between the specimen and elastic bars. Figure 8 shows the process of main crack opening and secondary crack initiation and propagation in the typical experimental results for the Breccia and Andesite specimens. The high-speed images were binarized to obtain the pixel information of the cracks. Then, the width of the main crack at different moments was measured by pixel information, as shown in Figure 8. According to the widths of the main crack at different moments, the average opening velocities of the main crack in 250 μs shown in Figure 8 were 12.85 m/s for the Breccia specimens at 4.86 m/s striking velocity and 20.94 m/s for the Andesite specimens at 4.88 m/s striking velocity.
According to the pixel information of the binary image, FracPaQ used the Hough transform method to find co-linear patterns of pixels in the image and produced fracture traces. The fracture trace is a line segment whose endpoints are distributed along the crack contour. In other words, the cracking morphology in the binary image was fulfilled with fracture traces. We affected the numbers and lengths of fracture traces by adjusting the values of the Hough peaks and the Hough threshold. Figure 9 and Figure 10 are the analysis results of binary images of the cracks in Figure 8 by FracPaQ with the number of the Hough peaks setting at 3000 and the Hough threshold setting at 0.1. In the figures, a Cartesian coordinate system is established with the contact end between the incident bar and the specimen as the origin, the bar direction as the X-axis, and the Y-axis (north direction) perpendicular to the bar direction.
Therefore, we made a quantitative characterization of the cracking morphology with the statistical length and orientation information of the fracture traces. We defined a ratio of the length of one fracture trace to the sum of all the fracture trace lengths at the current moment as the normalized length. The distribution of the normalized lengths of the fracture traces along the Y-axis deflection angle (the north is 0) was statistically analyzed and was plotted as the rose diagram shown in Figure 11. The Y-axis deflection angle was counted from both clockwise (0~180°) and counter clockwise (180°~360°) directions; thus, these rose diagrams are centrally symmetric. In the early stage of the fragmentized processes (150 μs in Figure 11a and 280 μs in Figure 11b), the normalized length of the fracture traces corresponding to the main crack in the horizontal direction (Y-axis deflection angles are 90° and 270°) is dominant. With the main crack opening width increasing and secondary cracks expanding, the fracture traces in the vertical direction gradually increased. At the same time, the normalized lengths with the Y-axis deflection angle at 0° and 180° gradually increased. Thus, the capability of FracPaQ to characterize the fragmentized processes was validated.
In order to further characterize the dynamic fracture of the Brazilian specimens, the length distribution of the fracture traces in the Y-axis deflection angle (clockwise, 0~180°) of the two typical experimental results was plotted, as shown in Figure 12. Distribution features of scatter plots are close to the Gaussian function, which can be written as:
y = y 0 + A e ( x x c ) 2 2 w 2
where y0 is offset from X-axis, xc is the center of symmetry, w is width, A is amplitude.
Then, the length-orientation scatter data of Breccia and Andesite at typical moments were fitted by Equation (8), and the fitted parameters are shown in Table 1. The results showing the fracture characteristics of the Brazilian specimens in fragmentized processes were in accordance with the Gaussian function. In Figure 12, the Y-axis is the fracture traces length, and the X-axis is the clockwise deflection angle of the fracture traces from 0° to 180°. Therefore, y0 in Equation (8) can be defined as the statistical crack width, and the maximum value of Equation (8) can be defined as the statistical crack length. In summary, the main crack expanding in the center of the Brazilian specimens that is generally accepted can be characterized by fitting the length-orientation of fracture trace using the Gaussian function.

5. Discussion

Temporal and morphological characteristics are important indicators for revealing dynamic fractures, but their quantitative description is still challenging. In this paper, the incubation time criterion was proposed to present the time-dependence of dynamic fracture. Based on the experimental data, the incubation times of Breccia and Andesite specimens were fitted as 61.5 and 124.3 μs, respectively, by Equation (7). However, in the experiments on the two igneous rocks with approximate striking velocity, the high-speed images presented the observable macroscopic cracks at 100 and 230 μs, respectively. This discrepancy can be explained on the basis of the physical meaning of the incubation time. Specifically, the incubation time is a fundamental material property associated with the dynamics of the microcracking relaxation processes, which is independent of the loading conditions, whereas the cracking times recorded in the high speed images were the particular times under the specific loading conditions. Obviously, the microscopic preparation time for a particular dynamic fracture is affected by both the loading conditions and the material properties. The experiments of Zhang et al. [39] showed that the fracture moment of rocks occurred earlier with the loading rate increase. Therefore, the incubation time was suggested as an indicator of the temporal characteristic of the dynamic fracture.
Central cracking is widely acknowledged as a fracture pattern for the Brazilian test [3,40], and this fracture pattern is dominated by the loading conditions and geometry of the specimen. However, only a qualitative description of the fracture pattern as central cracking is unsatisfactory. The differences in the morphological characteristics of the fragmentized process resulting from different rock types after the central cracking need further attention. FracPaQ statistically describes the morphological characteristics of fractures by generating and fulfilling fracture traces according to crack binarization. The statistics of fracture trace lengths and angles are consistent with a Gaussian distribution, and the fitted parameters in the Gaussian function can visualize the morphological characteristics of the fragmentized process of the Brazilian test for different rocks. For example, y0 at 0° or 180° reflects the opening width of the dynamic cracks, and A + y0 at 90° reflects the penetration of the dynamic crack. The fitted results of the two igneous rocks shown in Figure 12 indicated the difference tensile fracture responses to the approximate striking velocities. After the observable cracks appeared, the larger y0 of Andesite compared to Breccia presented a larger opening width of the main crack, which was consistent with that illustrated in Figure 8. Furthermore, the larger A + y0 of Andesite reflected the faster penetration of cracks, which implied a more significant brittleness than Breccia. In conclusion, the morphological characteristics of dynamic tensile fracture in the Brazilian tests were statistically and quantitatively described by FracPaQ and Gaussian function.

6. Conclusions

Dynamic Brazilian tests were carried out on two igneous rocks at different loading rates with the SHPB system. The incubation times of the two igneous rocks were fitted based on the experimental data. According to the images captured by the high-speed camera, the fragmentized characteristics of the typical results were analyzed. The present study yielded following conclusions:
1. Based on the experiments with SHPB, the incubation times of the two igneous rocks were fitted. Their incubation times were 61.5 and 124.3 μs, respectively. The variation of dynamic tensile strengths with stress rates was predicted by the incubation time criterion.
2. The full-field strains on the observed surface of the Brazilian specimens preceding fracture were calculated by the DIC technique. The strain concentrations of the Brazilian specimens before they lost the stress equilibrium and at the main crack initiation were revealed through the DIC calculations. The temporal hysteresis of fracture relative to the stress level was discussed in combination with the concept of incubation time.
3. Using image processing technology, the crack information of typical specimens of Breccia and Andesite in the fragmenting process was extracted. According to the binarization, the main crack opening velocities were estimated as 12.85 m/s for Breccia at 4.86 m/s striking velocity and 20.94 m/s for Andesite at 4.88 m/s striking velocity.
4. Through FracPaQ, the pixel information of cracks was transformed into the coordinates of fracture traces. The rose diagram was proposed to show the relationship of the angle and the normalized length of fracture traces in fragmentized processes of Brazilian specimens.
5. Length distributions in the angle of fracture traces were statistically analyzed. The results showed that the central cracking of the Brazilian specimens was described quantitatively by the Gaussian function.

Author Contributions

Conceptualization, L.-Y.C. and J.Y.; methodology, X.X.; software, Q.Y.; validation, L.-Y.C., J.Y. and Q.Y.; formal analysis, X.X.; investigation, X.X.; resources, J.Y. and Q.Y.; data curation, X.X. and L.-Y.C.; writing—original draft preparation, X.X.; writing—review and editing, X.X. and L.-Y.C.; visualization, X.X.; supervision, L.-Y.C. and Q.Y.; project administration, J.Y.; funding acquisition, J.Y. All authors have read and agreed to the published version of the manuscript.

Funding

This research was funded by National Natural Science Foundation of China, grant numbers 12002047 and 51774043.

Institutional Review Board Statement

Not applicable.

Informed Consent Statement

Not applicable.

Data Availability Statement

Not applicable.

Acknowledgments

We are grateful to Zong-Xian Zhang from the University of Oulu. His suggestions for this paper, including identification of the topic, the description of the incubation time criterion, the summary of the conclusion, and the enhancement of the language, are very helpful to us.

Conflicts of Interest

The authors declare no conflict of interest.

References

  1. Zhang, Q.B.; Zhao, J. A review of dynamic experimental techniques and mechanical behaviour of rock materials. Rock Mech. Rock Eng. 2014, 47, 1411–1478. [Google Scholar] [CrossRef] [Green Version]
  2. Wong, L.N.Y.; Zou, C.; Cheng, Y. Fracturing and failure behavior of carrara marble in quasistatic and dynamic brazilian disc tests. Rock Mech. Rock Eng. 2014, 47, 1117–1133. [Google Scholar] [CrossRef]
  3. Xia, K.; Yao, W. Dynamic rock tests using split Hopkinson (Kolsky) bar system—A review. J. Rock Mech. Geotech. Eng. 2015, 7, 27–59. [Google Scholar] [CrossRef] [Green Version]
  4. Wang, Q.Z.; Li, W.; Song, X.L. A Method for Testing Dynamic Tensile Strength and Elastic Modulus of Rock Materials Using SHPB. Pure Appl. Geophys. 2006, 163, 1091–1100. [Google Scholar] [CrossRef]
  5. Zhao, J.; Li, H.B. Experimental determination of dynamic tensile properties of a granite. Int. J. Rock Mech. Min. Sci. 2000, 37, 861–866. [Google Scholar] [CrossRef]
  6. Li, D.; Li, B.; Han, Z.; Zhu, Q. Evaluation on Rock Tensile Failure of the Brazilian Discs under Different Loading Configurations by Digital Image Correlation. Appl. Sci. 2020, 10, 5513. [Google Scholar] [CrossRef]
  7. Zhu, W.C.; Niu, L.L.; Li, S.H.; Xu, Z.H. Dynamic Brazilian Test of Rock Under Intermediate Strain Rate: Pendulum Hammer-Driven SHPB Test and Numerical Simulation. Rock Mech. Rock Eng. 2015, 48, 1867–1881. [Google Scholar] [CrossRef]
  8. Zhou, Z.; Li, X.; Zou, Y.; Jiang, Y.; Li, G. Dynamic Brazilian tests of granite under coupled static and dynamic loads. Rock Mech. Rock Eng. 2014, 47, 495–505. [Google Scholar] [CrossRef]
  9. Heard, W.; Song, B.; Williams, B.; Martin, B.; Sparks, P.; Nie, X. Dynamic Tensile Experimental Techniques for Geomaterials: A Comprehensive Review. J. Dyn. Behav. Mater. 2018, 4, 74–94. [Google Scholar] [CrossRef]
  10. Dai, F.; Huang, S.; Xia, K.; Tan, Z. Some fundamental issues in dynamic compression and tension tests of rocks using split Hopkinson pressure bar. Rock Mech. Rock Eng. 2010, 43, 657–666. [Google Scholar] [CrossRef]
  11. Zhou, Y.X.; Xia, K.; Li, X.B.; Li, H.B.; Ma, G.W.; Zhao, J.; Zhou, Z.L.; Dai, F. Suggested methods for determining the dynamic strength parameters and mode-I fracture toughness of rock materials. Int. J. Rock Mech. Min. Sci. 2012, 49, 105–112. [Google Scholar] [CrossRef]
  12. Qian, Q.; Qi, C.; Wang, M. Dynamic strength of rocks and physical nature of rock strength. J. Rock Mech. Geotech. Eng. 2009, 1, 1–10. [Google Scholar] [CrossRef] [Green Version]
  13. Kalthoff, J.F.; Shockey, D.A. Instability of cracks under impulse loads. J. Appl. Phys. 1977, 48, 986–993. [Google Scholar] [CrossRef]
  14. Homma, H.; Shockey, D.A.; Murayama, Y. Response of cracks in structural materials to short pulse loads. J. Mech. Phys. Solids 1983, 31, 261–279. [Google Scholar] [CrossRef]
  15. Shockey, D.A.; Kalthoff, J.F.; Erlich, D.C. Evaluation of dynamic crack instability criteria. Int. J. Fract. 1983, 22, 217–229. [Google Scholar] [CrossRef]
  16. Petrov, Y.V.; Utkin, A.A. Dependence of the dynamic strength on loading rate. Sov. Mater. Sci. 1989, 25, 153–156. [Google Scholar] [CrossRef]
  17. Bragov, A.M.; Petrov, Y.V.; Karihaloo, B.L.; Konstantinov, A.Y.; Lamzin, D.A.; Lomunov, A.K.; Smirnov, I.V. Dynamic strengths and toughness of an ultra high performance fibre reinforced concrete. Eng. Fract. Mech. 2013, 110, 477–488. [Google Scholar] [CrossRef]
  18. Martemyanov, A.; Selyutina, N.S.; Katorina, A. Incubation time criterion analysis of rock materials under dynamic loadings. Procedia Struct. Integr. 2017, 6, 336–343. [Google Scholar] [CrossRef]
  19. Martemyanov, A.N.; Petrov, Y.V. Understanding of Rock Material Behavior under Dynamic Loadings Based on Incubation Time Criteria Approach BT-Physical and Mathematical Modeling of Earth and Environment Processes; Karev, V., Klimov, D., Pokazeev, K., Eds.; Springer International Publishing: Cham, Switzerland, 2018; pp. 233–248. [Google Scholar]
  20. Petrov, Y.V.; Smirnov, I.V.; Volkov, G.A.; Abramian, A.K.; Bragov, A.M.; Verichev, S.N. Dynamic failure of dry and fully saturated limestone samples based on incubation time concept. J. Rock Mech. Geotech. Eng. 2017, 9, 125–134. [Google Scholar] [CrossRef]
  21. Smirnov, I.; Konstantinov, A. Strain Rate Dependencies and Competitive Effects of Dynamic Strength of Some Engineering Materials. Appl. Sci. 2020, 10, 3293. [Google Scholar] [CrossRef]
  22. Chen, F.; Wang, E.; Zhang, B.; Zhang, L.; Meng, F. Prediction of Fracture Damage of Sandstone Using Digital Image Correlation. Appl. Sci. 2020, 10, 1280. [Google Scholar] [CrossRef] [Green Version]
  23. Zhang, Q.B.; Zhao, J. Determination of mechanical properties and full-field strain measurements of rock material under dynamic loads. Int. J. Rock Mech. Min. Sci. 2013, 60, 423–439. [Google Scholar] [CrossRef]
  24. Zhang, F.; Yan, G.; Yang, Q.; Gao, J.; Li, Y. Strain Field Evolution Characteristics of Free Surface during Crater Blasting in Sandstone under High Stress. Appl. Sci. 2020, 10, 6285. [Google Scholar] [CrossRef]
  25. Fourmeau, M.; Gomon, D.; Vacher, R.; Hokka, M.; Kane, A.; Kuokkala, V.-T. Application of DIC Technique for Studies of Kuru Granite Rock under Static and Dynamic Loading. Procedia Mater. Sci. 2014, 3, 691–697. [Google Scholar] [CrossRef] [Green Version]
  26. Gao, G.; Huang, S.; Xia, K.; Li, Z. Application of Digital Image Correlation (DIC) in Dynamic Notched Semi-Circular Bend (NSCB) Tests. Exp. Mech. 2015, 55, 95–104. [Google Scholar] [CrossRef]
  27. Xing, H.Z.; Zhang, Q.B.; Ruan, D.; Dehkhoda, S.; Lu, G.X.; Zhao, J. Full-field measurement and fracture characterisations of rocks under dynamic loads using high-speed three-dimensional digital image correlation. Int. J. Impact Eng. 2018, 113, 61–72. [Google Scholar] [CrossRef]
  28. Xing, H.Z.; Zhang, Q.B.; Braithwaite, C.H.; Pan, B.; Zhao, J. High-Speed Photography and Digital Optical Measurement Techniques for Geomaterials: Fundamentals and Applications; Springer: Vienna, Austria, 2017; Volume 50, ISBN 0060301611640. [Google Scholar]
  29. Healy, D.; Rizzo, R.E.; Cornwell, D.G.; Farrell, N.J.C.; Watkins, H.; Timms, N.E.; Gomez-Rivas, E.; Smith, M. FracPaQ: A MATLABTM toolbox for the quantification of fracture patterns. J. Struct. Geol. 2017, 95, 1–16. [Google Scholar] [CrossRef] [Green Version]
  30. Duda, R.O.; Hart, P.E. Use of the Hough Transform to Detect Lines and Curves in Pictures. CACM 1972, 15, 11–15. [Google Scholar] [CrossRef]
  31. Ballard, D.H. Generalizing the Hough transform to detect arbitrary shapes. Pattern Recognit. 1981, 13, 111–122. [Google Scholar] [CrossRef] [Green Version]
  32. ISRM. ISRM Suggested methods for determining tensile strength of rock materials. Int. J. Rock Mech. Min. Sci. Geomech. Abstr. 1978, 15, 99–103. [Google Scholar] [CrossRef]
  33. Dai, F.; Xia, K. Loading Rate Dependence of Tensile Strength Anisotropy of Barre Granite. Pure Appl. Geophys. 2010, 167, 1419–1432. [Google Scholar] [CrossRef]
  34. Kolsky, H. An Investigation of the Mechanical Properties of Materials at very High Rates of Loading. Proc. Phys. Soc. Sect. B 1949, 62, 676–700. [Google Scholar] [CrossRef]
  35. Liu, K.; Zhang, Q.B.; Zhao, J. Dynamic increase factors of rock strength. In Proceedings of the International Conference on Rock Dynamics and Applications (RocDyn), Trondheim, Norway, 26–27 June 2018; CRC Press: Boca Raton, FL, USA, 2018; pp. 169–174. [Google Scholar]
  36. Petrov, Y.V.; Morozov, N.F. On the Modeling of Fracture of Brittle Solids. J. Appl. Mech. 1994, 61, 710–712. [Google Scholar] [CrossRef]
  37. Dalmas, D.; Guerra, C.; Scheibert, J.; Bonamy, D. Damage mechanisms in the dynamic fracture of nominally brittle polymers. Int. J. Fract. 2013, 184, 93–111. [Google Scholar] [CrossRef] [Green Version]
  38. Li, X.F.; Li, X.; Li, H.B.; Zhang, Q.B.; Zhao, J. Dynamic tensile behaviours of heterogeneous rocks: The grain scale fracturing characteristics on strength and fragmentation. Int. J. Impact Eng. 2018, 118, 98–118. [Google Scholar] [CrossRef]
  39. Zhang, Z.X.; Kou, S.Q.; Yu, J.; Yu, Y.; Jiang, L.G.; Lindqvist, P.-A. Effects of loading rate on rock fracture. Int. J. Rock Mech. Min. Sci. 1999, 36, 597–611. [Google Scholar] [CrossRef]
  40. Li, D.; Wong, L.N.Y. The Brazilian disc test for rock mechanics applications: Review and new insights. Rock Mech. Rock Eng. 2013, 46, 269–287. [Google Scholar] [CrossRef]
Figure 1. Layout of experimental system.
Applsci 11 11230 g001
Figure 2. Schematic view of the dynamic Brazilian test under SHPB loading.
Applsci 11 11230 g002
Figure 3. Experimental results for the Breccia specimen. (a) Raw signals of the Brazilian test. (b) Raw and filtered signal at a striking velocity of 4.86 m/s. (c) The incident (In.), reflected (Re.), transmitted (Tr.), and superposed (In. + Re.) waves. (d) Verified stress equilibrium. (e) Determination of dynamic tensile strength and loading rate.
Applsci 11 11230 g003
Figure 4. Experimental results for the Andesite specimen. (a) Raw signals of the Brazilian test. (b) Raw and filtered signal at a striking velocity of 4.88 m/s. (c) The incident (In.), reflected (Re.), transmitted (Tr.), and superposed (In. + Re.) waves. (d) Verified stress equilibrium. (e) Determination of dynamic tensile strength and loading rate.
Applsci 11 11230 g004
Figure 5. Tensile strengths of Breccia and Andesite versus stress rate.
Applsci 11 11230 g005
Figure 6. Full-field strain of the Breccia specimen at 4.86 m/s striking velocity: (a) 0 μs; (b) 80 μs; (c) 90 μs; (d) 100 μs; (e) 110 μs; (f) 120 μs.
Applsci 11 11230 g006
Figure 7. Full-field strain of the Andesite specimen at 4.88 m/s striking velocity: (a) 0 μs; (b) 210 μs; (c) 220 μs; (d) 230 μs; (e) 240 μs; (f) 250 μs.
Applsci 11 11230 g007
Figure 8. Images of the fragmentized process and main crack width at different moments: (a) Breccia specimen at 4.86 m/s striking velocity; (b) Andesite specimen at 4.88 m/s striking velocity.
Applsci 11 11230 g008
Figure 9. The fracture traces of the Breccia specimen at 4.86 m/s striking velocity obtained by FracPaQ: (a) 150 μs; (b) 200 μs; (c) 250 μs; (d) 300 μs; (e) 350 μs; (f) 400 μs.
Applsci 11 11230 g009
Figure 10. The fracture traces of the Andesite specimen at 4.88 m/s striking velocity obtained by FracPaQ: (a) 280 μs; (b) 330 μs; (c) 380 μs; (d) 430 μs; (e) 480 μs; (f) 530 μs.
Applsci 11 11230 g010
Figure 11. The orientation distribution and normalized length of fracture traces in fragmentized processes: (a) the Breccia specimen at 4.86 m/s striking velocity; (b) the Andesite specimen at 4.88 m/s striking velocity.
Applsci 11 11230 g011
Figure 12. The scatter distribution of lengths at orientations and fitted results by Gaussian function of typical fragmentized processes at different moments.
Applsci 11 11230 g012
Table 1. The fitted parameters of the Gaussian function.
SpecimenTime (μs)y0xcwAR2
Breccia150
200
250
300
350
400
4.52
3.82
5.86
5.10
4.94
7.11
90.23
86.67
89.32
89.50
89.59
88.82
4.25
8.61
4.16
5.67
6.16
6.35
18.24
16.16
32.22
33.97
36.89
37.46
0.930
0.900
0.919
0.970
0.973
0.963
Andesite280
330
380
430
480
530
6.42
6.37
7.22
9.57
9.84
11.22
88.56
88.16
88.86
88.22
88.01
88.21
4.14
3.87
4.72
5.20
5.90
6.21
28.98
37.60
37.11
34.99
33.07
32.34
0.931
0.963
0.961
0.943
0.936
0.959
Publisher’s Note: MDPI stays neutral with regard to jurisdictional claims in published maps and institutional affiliations.

