
Project Management Information Systems (PMISs): A Statistical-Based Analysis for the Evaluation of Software Packages Features


Abstract
:1. Introduction
2. Literature Review
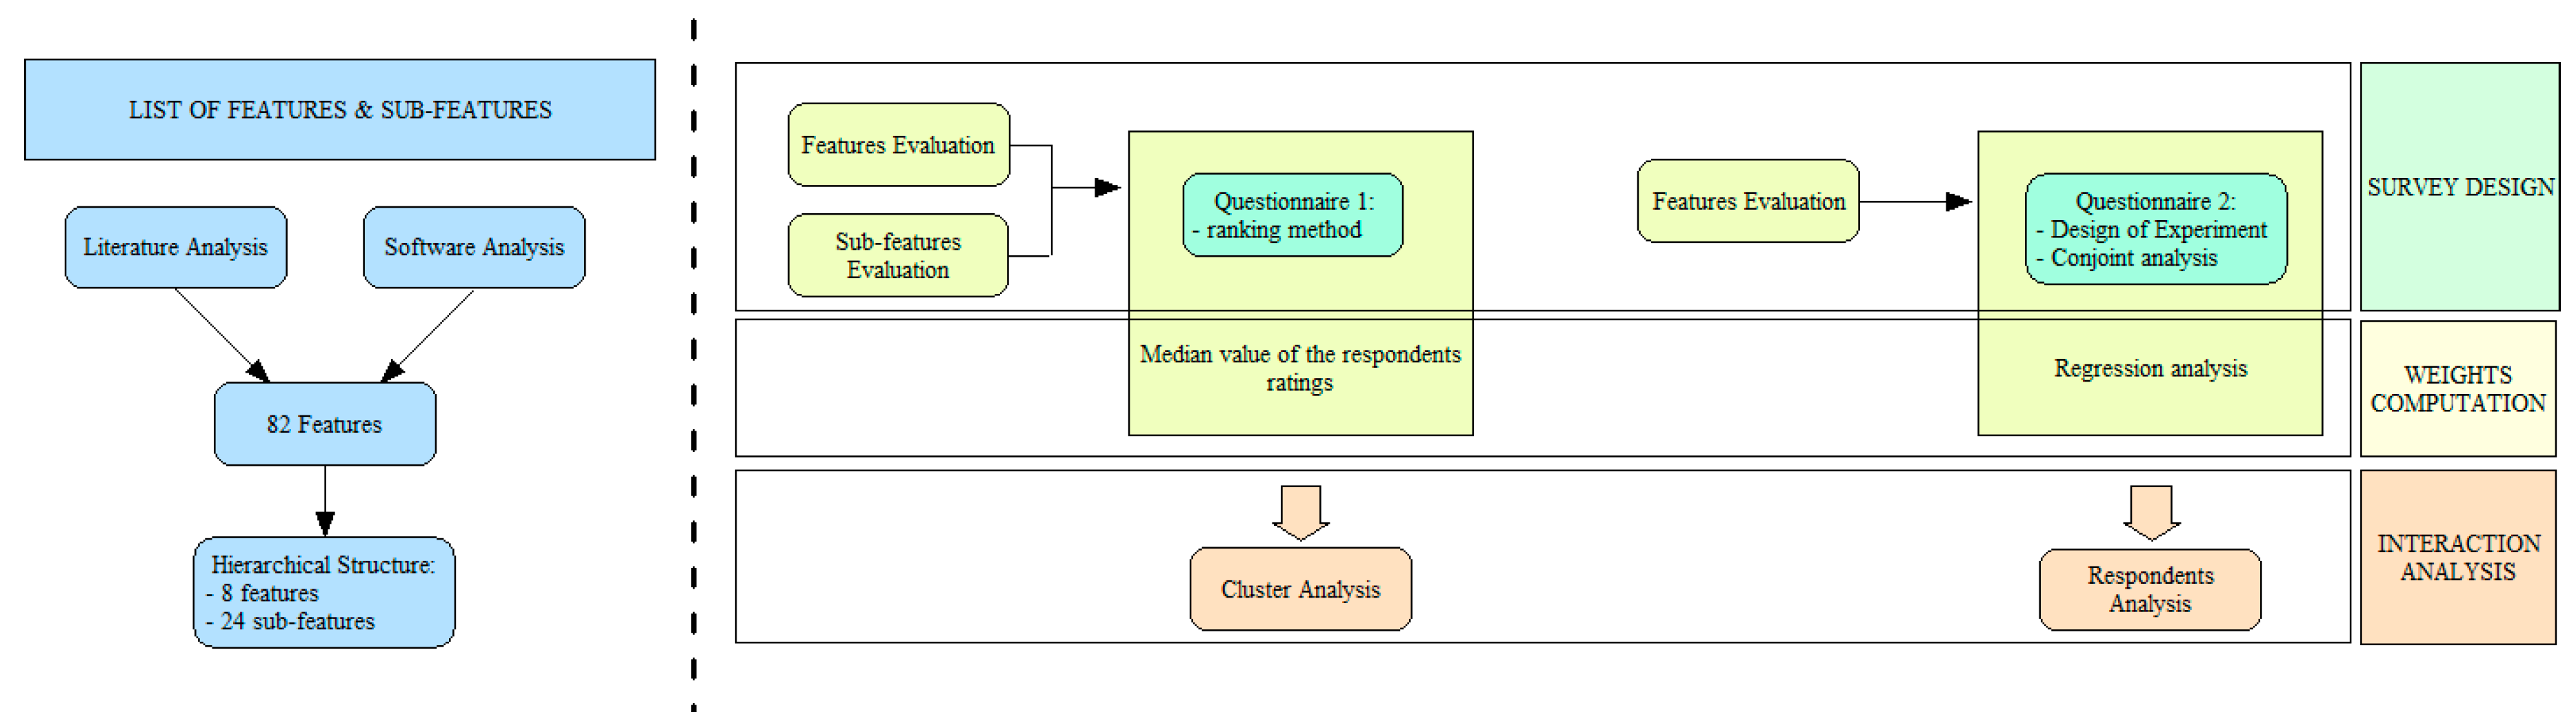
3. Methodological Approach
3.1. PMIS Features and Sub-Features
3.2. Survey Design and Analysis of Data
3.2.1. First Survey: Design and Analysis of Data
3.2.2. Second Survey: Design and Analysis of Data
4. Results and Discussion
4.1. List of PMIS Features and Sub-Features
4.2. First Survey
4.3. Second Survey
5. Conclusions
Author Contributions
Funding
Institutional Review Board Statement
Informed Consent Statement
Conflicts of Interest
Appendix A. Initial List of Features and Sub-Features
| Feature | Sub-Feature | Description/Aim | References | Software |
| 1. Activity planning It includes all those tools for project activities planning and scheduling | 1.1 Critical Path Method (CPM) | Project planning and scheduling | [11,12,13,16,17,18,19,24,41] | Asana; MS Project; Podio |
| 1.2 WBS | Hierarchical decomposition of the project | [11,12,13,24,41,42] | Asana; MS Project; Wrike | |
| 1.3 Gantt chart | Project planning and identification of critical paths | [11,13,16,18,20,24,41] | MS Project; Wrike | |
| 1.4 Milestones | Representation of projects by means of milestones | [12,20,24,41,42] | Basecamp, Asana, MS Project | |
| 1.5 Intelligent Programs | Update of activities and projects completion times when priorities and resources change | Liquidplanner | ||
| 2. Resource planning (all features for project resources management) | 2.1 Allocation of Resources | Planning of project resources | [12,16,17,18,24,41,42,43] | Asana; MS Project; Liquidplanner |
| 2.2 Balancing of Resources | Balancing of resources i.e., overload elimination | [14,16,17,24,41] | MS Project; Liquidplanner; Wrike | |
| 2.3 Critical Chain Project Method (CCPM) | Planning and scheduling of activities considering the resources’ availability | [17] | MS Project (ProChain) | |
| 2.4 Cost Management | Planning and managing of project costs | [11,12,13,16,17,19,42,43] | MS Project; Podio; Liquidplanner | |
| 2.5 Calendar | Development and customization of projects and resources calendars | [12,22,24,41,43] | Trello; Asana; MS Project; Podio | |
| 2.6 Resource Chart | Visualization of resources workload | [12,16,17,18,24,41,42] | Asana; MS Project; Podio | |
| 2.7 Resource Breakdown Structure (RBS) | Hierarchical structure of resources by category and type | [24] | Asana; MS Project; Huddle; Podio | |
| 2.8 Stakeholders Directory | Recording all information on team members and software users (e.g., telephone number, address, email, etc.) in a single directory | [22,24] | ||
| 3. Control (all features needed to control budget, work and project results) | 3.1 Performance Tracking | Project monitoring by comparing the current performance with the planned one | [16,17,20,42] | Trello; MS Project; Podio |
| 3.2 Budget Control | Comparing the actual cost values with the planned ones | [20,24,42] | MS Project; Liquidplanner | |
| 3.3 Time Control | Comparing the actual work values with the planned ones | [16,20,24] | Trello; Asana; MS Project; Podio; Liquidplanner; Wrike | |
| 3.4 Travel Cost | Monitoring of travel expenses | [24] | ||
| 3.5 Quality Management and validate | Inclusion of procedures for checking project results (e.g., check whether all requirements are met) | [43] | ||
| 4. Risk Analysis (all features for identifying, evaluating, monitoring and managing risks and issues) | 4.1 PERT | Performing the PERT analysis to compute the project time to completion when activities durations are random variables | [11,13,18,20] | |
| 4.2 Simulation | Allowing to compare costs and timescales of different project scenarios | [24] | MS Project (RiskyProject) | |
| 4.3 Risk Management | Supporting the project risks management (e.g., SWOT analysis, creation of risk register, etc.) | [11,12,13,14,16,19,20,24,41,42] | ||
| 4.4 Issue Management | Supporting the project issues management (e.g., creation of issue register, etc.) | [24,42] | ||
| 4.5 Incident management | Association of a problem to one or more person | [24] | ||
| 4.6 Claim Management | Allowing the claim management | [12] | ||
| 5. Reporting (all features for reporting i.e., report, version tracking) | 5.1 Document Management | Managing and/or archiving documents | [11,12,13,19,22,43] | |
| 5.2 Report | Development of standard and/or customized reports | [11,14,20,42,43] | Asana; MS Project; Liquidplanner; Wrike | |
| 5.3 Import/export data | Import/export of different format data | [24] | Asana; MS Project | |
| 5.4 Version Tracking | Documents tracking and recording | [22,24] | MS Project; Huddle; Wrike | |
| 5.5 Archiving project information | Archiving of project and team information | [22,24] | Asana | |
| 6. Communication management (all features for project communication management) | 6.1 Communication | Facilitating communication, collaboration and information sharing among members | [11,12,13,16,18,43] | Trello, Basecamp; Asana; MS Project; Huddle; Podio |
| 6.2 E-mail | Stakeholders’ communication by emails to stay up to date | [16,24] | Trello | |
| 6.3 Chat | Facilitating synchronous communication among team members | [24] | Trello, Basecamp; Asana; Podio | |
| 6.4 Communication Group | Structured platform to facilitate stakeholders communication | [24] | ||
| 6.5 Forum | Facilitating asynchronous communication among team members | [22,24] | Podio | |
| 6.6 Messages Outside the System | Sending information to a participant who is not connected to internet | [22,24] | ||
| 6.7 Video & Audio | Allowing to make video and audio calls | [20] | Podio | |
| 6.8 RSS feed | Access to online contents in a standardized and computer-readable format | [24] | Asana; MS Project; Podio | |
| 6.9 WIKI | Access to a free website where inserting, updating or modifying information | [24] | Asana | |
| 6.10 Automatic check-in | Allowing the team to ask for periodic questions (e.g., progress of an activity) | Basecamp | ||
| 6.11 Activity comments | Allowing to add notes/comments to activities | Trello; Asana; Podio; MS Project; Liquidplanner | ||
| 6.12 Mention | Allowing to mention colleagues needed to complete the work by the instantly display of warning messages | Asana; Liquidplanner; Wrike | ||
| 6.13 Guests | Allowing to communicate with the external stakeholders of a project (e.g., suppliers, contractors, partners, etc..) | Asana | ||
| 6.14 Followers | Allowing to add team members as followers | Asana | ||
| 6.15 Calendars and emails synchronizing | Allowing to automatically transform the content of e-mails into activities to be carried out | Wrike | ||
| 7. Utility (all utility features i.e., to do list, filters and customized fields) | 7.1 To do list | Visualizing the list of things to be done on a specific day | [24,41] | Trello; Basecamp; MS Project; Podio |
| 7.2 Filters | Performing advanced searches on project documents (i.e., filters, sorting, grouping) | [22,24,43] | Asana; MS Project; Podio; Wrike | |
| 7.3 Customized fields | Allowing to customize different fields (e.g., calendars, views, tables, filters, etc.) | [22,24] | Trello; Asana; MS Project; Podio; Wrike | |
| 7.4 Contacts list | Visualizing external (i.e., clients, suppliers, etc.) and internal (i.e., team members, etc.) contacts list | [42] | ||
| 7.5 Procurement management | Visualizing the updated list of procurements | [22] | ||
| 7.6 External tools integrations | Allowing to add software features | [20,21] | Trello; Basecamp; Asana; MS Project; Huddle; Podio; Liquidplanner; Wrike | |
| 7.7 Guide and technical support | Providing help and support to users | [24] | Asana; MS Project; Wrike | |
| 7.8 Mathematical calculations | Allowing at recording, reporting and computing numerical values | MS Project; Podio | ||
| 7.9 Reminder | Displaying remind messages (e.g., list of things to be done or commitments on a specific day) | [24] | MS Project | |
| 7.10 Multi-language support | Installing and using different languages | [24] | ||
| 7.11 Evaluation sheets | Filling evaluation sheets on suppliers, clients, project members, etc. | [12,20] | ||
| 7.12 Rules | Setting rules to automate important actions | Asana | ||
| 7.13 Project copy | Copying projects | Asana | ||
| 7.14 PDF and/or XPS | Saving electronic files in pdf and/or xps formats | MS Project | ||
| 7.15 Customized brand | Customizing the project format by the insertion of the brand, personalized colours, etc. | MS Project | ||
| 7.16 Automatic completion | Allowing to obtain suggestions on activities/resources name, dependencies, etc. | MS Project | ||
| 7.17 Main projects | Grouping projects into a single master project | MS Project | ||
| 7.18 Multi-levels elimination | Allowing to delete more commands | MS Project | ||
| 7.19 Text | Allowing to add text | Podio | ||
| 7.20 Preview | Visualizing previews | Huddle | ||
| 8. Customer information (all features for record and manage customer information) | 8.1 Customer information | Saving customer information, classifying them into categories thus personalising messages to be sent | [24] | |
| 9. Access permits (all features that allows to establish rules for accessing the database and project documents according your role) | 9.1 Access permits | Establishing rules for having access to projects database and documents | [24,42] | Trello; Asana; MS Project; Huddle; Wrike |
| 9.2 Central registers and audit control | Allowing to know who had access to projects files, from where and when, which files were downloaded and when, what changes were made to the file, etc. It can also include the use of digital signatures | [24] | Huddle | |
| 9.3 Integrated protection | Allowing to remotely delete projects data if a device is lost or stolen or if the revocation of user access is needed | Huddle | ||
| 9.4 Mobile PIN | Allowing to add a PIN for mobile devices | Huddle; Wrike | ||
| 9.5 Offline access | Offline access to software contents | [22,24] | ||
| 10. Type of software (all features that refer to the software installation mode) | 10.1 WEB based | Web access by intranet or internet networks | [16,18,24,43] | Trello; Basecamp; Asana; MS Project; Huddle; Podio; Liquidplanner; Wrike |
| 10.2 Desktop | Access by a personal computer | [24] | Asana; MS Project; Huddle | |
| 10.3 Mobile | Mobile access by apps | [24] | Trello; Basecamp; Asana; MS Project; Huddle; Podio; Liquidplanner; Wrike | |
| 11. Type of license (all features that refer to the software type of license) | 11.1 Proprietary | Utilization of the PMIS software under the payment of a license which allows the installation of the software generally on the user work station | [24] | |
| 11.2 Software as a Service—SaaS | Utilization of the PMIS software under the payment of a monthly rent which allows the user to use the software via an internet connection | [24] | ||
| 11.3 Open source | The software house provides the source code which can be modified by the user | [24] | ||
| 12. User interface (all features that allow to store information on the project’s users) | 12.1 Project dashboard | Displaying the projects performance and progresses at a given time/period | [24,43] | Trello; Basecamp; Asana; MS Project; Wrike |
| 12.2 Personal dashboard | Customization of the project’s dashboard | [24] | Huddle; Liquidplanner; Wrike | |
| 12.3 Multiple dashboards | Developing and visualizing multiple dashboards | [24] | ||
| 13. Interdependencies management (all features that allow to manage the interdependencies between activities of different projects that share the same resources) | 13.1 Interdependencies among resources | Verification of interdependencies among resources | [24] | MS Project |
| 13.2 Interdependencies among activities | Verification of interdependencies among activities | [24] | Asana | |
| 13.3 Cross-project visibility | Instantaneous visualization of projects progresses, risks and budgets | Asana; Liquidplanner |
Appendix B
- Gender: (Male; Female)
- How old are you? (≤30; 31–40; 41–50; >50)
- What country do you work in?
- Do you use or have you ever used project management software? (YES; NO) (If yes, what was the best performing software?)
- How many hours have you been involved in project management activities? (0; 1–1000; 1001–3000; 3001–10,000; >10,001)
- Do you have a project management certification? (YES; NO) (If yes, which one? If you have more than one certification, list all of them)
- Have you ever taught in this field? (YES; NO) (If yes, approximately, how many hours?)
- Have you trained in this field? (YES; NO) (If yes, approximately, how many hours?)
- Do you work in the public or private sector? (Public sector; Private sector)
- Specify the sector: (Health care, Services, Civil construction, IT, Manufacturing, Finance, Energy, Others) (If other, which one?)
- Approximately, what the company’s turnover is?
- Activity Planning (features for project activities planning and scheduling)
- Resource Planning (features for project resources management)
- Control (features needed to control budget, work and project results)
- Risk Analysis (features for identifying, evaluating, monitoring and managing risks and issues)
- Reporting (features for reporting, i.e., report, version tracking and dashboard)
- Communication Management (features for project communication management)
- Utility (utility features, i.e., to do list, filters and customized fields)
- Access Permits (it allows to establish rules for having access to projects database and documents)
- Activity Planning
- Resource Planning
- Control
- Risk Analysis
- Reporting
- Communication Management
- Utility
- Access Permits
- CPM—This function allows at performing the Critical Path Method (i.e., calculation of characteristic times, delays, critical path, etc.)
- WBS—This function allows the hierarchical decomposition of the project
- Gantt chart—This function allows to develop the bar chart of the project
- Milestones—This function allows to represent the project through its milestones
- Allocation of resources—This function allows at planning the project resources
- Scheduling with balancing of resources—This function permits to balance resources (i.e., eliminate overloads)
- CCPM—This function allows the development of the Critical Chain Project Management (i.e., scheduling of activities by identifying critical chains with feed and project buffers)
- Cost Management—This function allows to plan and manage all project costs (i.e., resources, raw materials, etc.)
- Calendar—This function includes the design and customization of project and resources calendars
- Resources Chart—This function allows the visualization of the workload of each resource
- Progress Control—This feature allows at comparing the actual cost and work values with the planned ones
- Quality Management and Validate—This feature allows to include procedures for checking project results (i.e., view inspection results or check whether all requirements are met)
- RISK MANAGEMENT SUB-FEATURE
- PERT—This feature allows to perform the PERT analysis to get the project time to completion when activities durations are random variables
- Simulation—In the presence of random costs and times, this function allows to determine the project time to completion through simulation (i.e., Monte Carlo simulation)
- Risk/Issue management—This function supports the management of the project risks/issues (i.e., SWOT analysis, creation of risk/problem registers, etc..)
- Report—This function permits the creation of standard and/or customized reports of the project
- Version Tracking—This function allows to track and record all documents related to the project
- Dashboard—This feature allows team members to access all project-related information through a graphical, concise and customizable representation.
- E-mail—This feature permits the exchange of emails among team members
- Chat/Forum—This feature facilitates synchronous/asynchronous communication among team members
- Video & Audio—This feature allows to make audio and video calls
- To do list—This feature allows to visualize the list of things to be done on a specific day
- Filters—This feature allows to perform advanced searches on project documents (i.e., filters, sorting, grouping)
- Customized fields—This feature allows to customize different fields (i.e., calendars, views, tables, filters, etc.)
| Activity Planning | Resource Planning | Control | Risk Analysis | Reporting | Communication Management | Utility | Access Permits |
| Activity Planning | Resource Planning | Control | Risk Analysis | Reporting | Communication Management | Utility | Access Permits |
| Activity Planning | Resource Planning | Control | Risk Analysis | Reporting | Communication Management | Utility | Access Permits |
| Activity Planning | Resource Planning | Control | Risk Analysis | Reporting | Communication Management | Utility | Access Permits |
| Activity Planning | Resource Planning | Control | Risk Analysis | Reporting | Communication Management | Utility | Access Permits |
| Activity Planning | Resource Planning | Control | Risk Analysis | Reporting | Communication Management | Utility | Access Permits |
| Activity Planning | Resource Planning | Control | Risk Analysis | Reporting | Communication Management | Utility | Access Permits |
| Activity Planning | Resource Planning | Control | Risk Analysis | Reporting | Communication Management | Utility | Access Permits |
| Activity Planning | Resource Planning | Control | Risk Analysis | Reporting | Communication Management | Utility | Access Permits |
| Activity Planning | Resource Planning | Control | Risk Analysis | Reporting | Communication Management | Utility | Access Permits |
| Activity Planning | Resource Planning | Control | Risk Analysis | Reporting | Communication Management | Utility | Access Permits |
| Activity Planning | Resource Planning | Control | Risk Analysis | Reporting | Communication Management | Utility | Access Permits |
| Activity Planning | Resource Planning | Control | Risk Analysis | Reporting | Communication Management | Utility | Access Permits |
| Activity Planning | Resource Planning | Control | Risk Analysis | Reporting | Communication Management | Utility | Access Permits |
| Activity Planning | Resource Planning | Control | Risk Analysis | Reporting | Communication Management | Utility | Access Permits |
| Activity Planning | Resource Planning | Control | Risk Analysis | Reporting | Communication Management | Utility | Access Permits |
References
- Baccarini, D. The concept of project complexity—A review. Int. J. Proj. Manag. 1996, 14, 201–204. [Google Scholar] [CrossRef] [Green Version]
- Williams, T.M. The need for new paradigms for complex projects. Int. J. Proj. Manag. 1999, 17, 269–273. [Google Scholar] [CrossRef] [Green Version]
- Maylor, H.; Brady, T.; Cooke-Davies, T.; Hodgson, D. From projectification to programmification. Int. J. Proj. Manag. 2006, 24, 663–674. [Google Scholar] [CrossRef]
- Elonen, S.; Artto, K.A. Problems in managing internal development projects in multi-project environments. Int. J. Proj. Manag. 2003, 21, 395–402. [Google Scholar] [CrossRef] [Green Version]
- Awe, O.A.; Church, E.M. Project flexibility and creativity: The moderating role of training utility. Manag. Decis. 2020, in press. [CrossRef]
- Annosi, M.C.; Marchegiani, L.; Vicentini, F. Knowledge translation in project portfolio decision-making: The role of organizational alignment and information support system in selecting innovative ideas. Manag. Decis. 2020, 58, 1929–1951. [Google Scholar] [CrossRef]
- A Guide to the Project Management Body of Knowledge; PMBOK Guide Sixth Edition; Project Management Institute (PMI), Inc.: Pennsylvania, PA, USA, 2017.
- van Fenema, P.C.; Koppius, O.R.; van Baalen, P.J. Implementing packaged enterprise software in multi-site firms: Intensification of organizing and learning. Eur. J. Inf. Syst. 2007, 16, 584–598. [Google Scholar] [CrossRef] [Green Version]
- Mitlöhner, J.; Koch, S. Software project effort estimation with voting rules. Decis. Support Syst. 2009, 46, 895–901. [Google Scholar]
- Sen, R.; Singh, S.S.; Borle, S. Open source software success: Measures and analysis. Decis. Support Syst. 2012, 52, 364–372. [Google Scholar] [CrossRef]
- Raymond, L.; Bergeron, F. Project Management information systems: An empirical study of their impact on project manager and project success. Int. J. Proj. Manag. 2008, 26, 213–220. [Google Scholar] [CrossRef] [Green Version]
- Ahlemann, F. Towards a conceptual reference model for project management information systems. Int. J. Proj. Manag. 2009, 27, 19–30. [Google Scholar] [CrossRef]
- Karim, A.J. Project Management Information Systems (PMIS) factors: An empirical study of their impact on Project Management Decision Making (PMDM) performance. Res. J. Econ. Bus. ICT 2011, 2, 22–27. [Google Scholar]
- Caniels, M.C.J.; Bakens, R.J.J.M. The effects of Project Management Information Systems on decision making in a multi project environment. Int. J. Proj. Manag. 2012, 20, 162–175. [Google Scholar] [CrossRef]
- Lee, S.K.; Yu, J.H. Success model of project management information system in construction. Autom. Constr. 2012, 25, 82–93. [Google Scholar] [CrossRef]
- Braglia, M.; Frosolini, M. An integrated approach to implement Project Management Information System within the Extended Enterprise. Int. J. Proj. Manag. 2014, 32, 18–29. [Google Scholar] [CrossRef]
- Wale, P.M.; Jain, N.D.; Godhani, N.R.; Beniwal, S.R.; Mir, A.A. Planning and Scheduling of Project using Microsoft Project (case study of a building in India). IOSR J. Mech. Civ. Eng. 2015, 5, 57–63. [Google Scholar]
- Obodoh, D.A.; Mbanusi, E.C.; Obodoh, C.M. Impact of Project Management Software on the Project Failure Rates in Nigerian Construction Industry. Int. J. Sci. Eng. Appl. Sci. 2016, 2, 358–367. [Google Scholar]
- Nguyen, T.D.; Nguyen, D.T.; Nguyen, T.M. Information System Success: The Project Management Information System for ERP Projects. In Lecture Notes of the Institute for Computer Sciences; Springer: Cham, Switzerland, 2016. [Google Scholar]
- Jaffari, A.; Manivong, K. Towards a smart project management information system. Int. J. Proj. Manag. 1998, 16, 249–265. [Google Scholar]
- Liberatore, M.J.; Pollack-Johnson, B.; Smith, A.C. Project Management in construction: Software use and research directions. J. Constr. Eng. Manag. 2001, 127, 101–107. [Google Scholar] [CrossRef]
- Nitithamyong, P.; Skibniewsky, M.J. Web-based construction project management systems: How to make them successful? Autom. Constr. 2004, 13, 491–506. [Google Scholar] [CrossRef]
- Liberatore, M.J.; Pollack-Johnson, B. Factors influencing the usage and selection of project management software. IEEE Trans. Eng. Manag. 2003, 50, 164–174. [Google Scholar] [CrossRef]
- Enea, M.; Muriana, C. An AHP-based approach to PMISs assessment. Int. J. Bus. Environ. 2014, 7, 32–60. [Google Scholar] [CrossRef]
- Hino, A.; Imai, R. Ranking and Rating: Neglected Biases in Factor Analysis of Postmaterialist Values. Int. J. Public Opin. Res. 2019, 31, 368–381. [Google Scholar] [CrossRef] [Green Version]
- Reynolds, T.J.; Jolly, J.P. Measuring personal values: An evaluation of alternative methods. J. Mark. Res. 1980, 17, 531–536. [Google Scholar] [CrossRef]
- Krosnick, J.A. Maximizing questionnaire quality. In Measures of Political Attitudes: Volume 2 of Measures of Social Psychological Attitudes; Robinson, J.P., Shaver, P.R., Wrightsman, L.S., Eds.; Academic Press: San Diego, CA, USA, 1999; pp. 37–57. [Google Scholar]
- Roux, M. A Comparative Study of Divisive and Agglomerative Hierarchical Clustering Algorithms. J. Classif. 2018, 35, 345–366. [Google Scholar] [CrossRef] [Green Version]
- Akalin, A. Computational Genomics with r; Chapman and Hall/CRC: New York, NY, USA, 2020. [Google Scholar]
- Bora, D.J.; Gupta, A.K. Effect of Different Distance Measures on the Performance of K-Means Algorithm: An Experimental Study in Matlab. Int. J. Comput. Sci. Inf. Technol. 2014, 5, 2501–2506. [Google Scholar]
- Acito, F.; Jain, A.K. Evaluation of Conjoint Analysis Results: A Comparison of Methods. J. Mark. Res. 1980, 17, 106–112. [Google Scholar] [CrossRef]
- Saaty, T.L. Axiomatic foundation of the analytic hierarchy process. Manag. Sci. 1986, 32, 841–855. [Google Scholar] [CrossRef]
- Fischer, G.W.; Luce, M.F.; Jia, J.; Frances, M.; Jianmin, L.; Carolina, N. Attribute conflict and preference uncertainty: Effects on judgment time and error. Manag. Sci. 2000, 46, 88–103. [Google Scholar] [CrossRef]
- Souza, J.P.E.; Alves, J.M.; Damiani, J.H.S.; Silva, M.B. Design of Experiments: Its importance in the efficient Project Management. In Proceedings of the 22nd International Conference on Production Research, Iguassu Falls, Brazil, 28 July–1 August 2013. [Google Scholar]
- Barron, F.H.; Barrett, B.E. Decision quality attribute using weights ranked. Manag. Sci. 1996, 42, 1515–1523. [Google Scholar] [CrossRef]
- Kwong, C.K.; Bai, H. Determining the importance weights for the customer requirements in QFD using a fuzzy AHP with an extent analysis approach. IIE Trans. 2003, 35, 619–626. [Google Scholar] [CrossRef]
- Barone, S.; Lombardo, A.; Tarantino, P. A weighted logistic regression for conjoint analysis and kansei engineering. Qual. Reliab. Eng. Int. 2007, 23, 689–706. [Google Scholar] [CrossRef]
- Barone, S.; Lombardo, A.; Tarantino, P. A heuristic method for estimating attribute importance by measuring choice time in a ranking task. Risk Decis. Anal. 2012, 3, 225–237. [Google Scholar] [CrossRef]
- Barone, S.; Errore, A.; Lombardo, A. Prioritization of Alternatives with AHP Plus Response Latency and Web Surveys. Qual. Total Qual. Manag. Bus. Excell. 2013, 25, 953–965. [Google Scholar] [CrossRef]
- Barone, S.; Lombardo, A. Service quality design through a smart use of conjoint analysis. Asian J. Qual. 2004, 5, 34–42. [Google Scholar] [CrossRef]
- Chowdeswari, C.; Satish Chandra, D.; Asadi, S. Optimal planning and scheduling of high rise buildings. Int. J. Civ. Eng. Technol. 2017, 8, 312–324. [Google Scholar]
- Taniguchi, A.; Onosato, M. Use of Project Management Information System to Initiate the Quality Gate Process for ERP Implementation. Int. J. Inf. Technol. Comput. Sci. 2017, 12, 1–10. [Google Scholar] [CrossRef] [Green Version]
- Zambare, P.; Dhawale, A. Project Management Information System in construction industry. Int. J. Eng. Sci. Res. Technol. 2017, 6, 54–60. [Google Scholar]


| Feature | Activity Planning | Resource Planning | Control | Risk Analysis | Reporting | Comm. Manag. | Utility | Access Permits | |
|---|---|---|---|---|---|---|---|---|---|
| Prototype | |||||||||
| 1 | −1 | −1 | −1 | −1 | −1 | −1 | −1 | −1 | |
| 2 | +1 | −1 | −1 | −1 | −1 | +1 | +1 | +1 | |
| 3 | −1 | +1 | −1 | −1 | +1 | −1 | +1 | +1 | |
| 4 | +1 | +1 | −1 | −1 | +1 | +1 | −1 | −1 | |
| 5 | −1 | −1 | +1 | −1 | +1 | +1 | +1 | −1 | |
| 6 | +1 | −1 | +1 | −1 | +1 | −1 | −1 | +1 | |
| 7 | −1 | +1 | +1 | −1 | −1 | +1 | −1 | +1 | |
| 8 | +1 | +1 | +1 | −1 | −1 | −1 | +1 | −1 | |
| 9 | −1 | −1 | −1 | +1 | +1 | +1 | −1 | +1 | |
| 10 | +1 | −1 | −1 | +1 | +1 | −1 | +1 | −1 | |
| 11 | −1 | +1 | −1 | +1 | −1 | +1 | +1 | −1 | |
| 12 | +1 | +1 | −1 | +1 | −1 | −1 | −1 | +1 | |
| 13 | −1 | −1 | +1 | +1 | −1 | −1 | +1 | +1 | |
| 14 | +1 | −1 | +1 | +1 | −1 | +1 | −1 | −1 | |
| 15 | −1 | +1 | +1 | +1 | +1 | −1 | −1 | −1 | |
| 16 | +1 | +1 | +1 | +1 | +1 | +1 | +1 | +1 | |
| Feature/Sub-Feature | Number of Respondents per Cluster |
|---|---|
| Features level | Cluster 1 = 37; Cluster 2 = 21; Cluster 3 = 5; Cluster 4 = 4 |
| Activity Planning sub-feature | Cluster 1 = 17; Cluster 2 = 17; Cluster 3 = 16; Cluster 4 = 17 |
| Resource Planning sub-feature | Cluster 1 = 31; Cluster 2 = 15; Cluster 3 = 12; Cluster 4 = 9 |
| Control sub-feature | Cluster 1 = 48; Cluster 2 = 19 |
| Risk Management sub-feature | Cluster 1 = 27; Cluster 2 = 33; Cluster 3 = 7 |
| Reporting sub-feature | Cluster 1 = 24; Cluster 2 = 36; Cluster 3 = 18 |
| Communication Management sub-feature | Cluster 1 = 37; Cluster 2 = 12; Cluster 3 = 18 |
| Utility sub-feature | Cluster 1 = 46; Cluster 2 = 13; Cluster 3 = 8 |
| Feature | Cluster 1 | Cluster 2 | Cluster 3 | Cluster 4 | TOT |
|---|---|---|---|---|---|
| Activity Planning | 0.229 | 0.189 | 0.235 | 0.141 | 0.221 |
| Resource Planning | 0.171 | 0.163 | 0.206 | 0.051 | 0.167 |
| Control | 0.171 | 0.135 | 0.059 | 0.115 | 0.167 |
| Risk Analysis | 0.143 | 0.135 | 0.088 | 0.090 | 0.139 |
| Reporting | 0.114 | 0.108 | 0.118 | 0.116 | 0.111 |
| Communication Management | 0.086 | 0.189 | 0.088 | 0.167 | 0.111 |
| Utility | 0.057 | 0.054 | 0.029 | 0.141 | 0.056 |
| Access Permits | 0.029 | 0.027 | 0.177 | 0.179 | 0.028 |
| Feature | Sub-Feature | Weight |
|---|---|---|
| Activity Planning | CPM | 0.181 |
| WBS | 0.273 | |
| Gantt Chart | 0.273 | |
| Milestones | 0.273 | |
| Resource Planning | Allocation of resources | 0.239 |
| Scheduling with balancing of resources | 0.190 | |
| CCPM | 0.143 | |
| Cost Management | 0.190 | |
| Calendar | 0.143 | |
| Resource chart | 0.095 | |
| Control | Progress control | 0.667 |
| Quality Management and Validate | 0.333 | |
| Risk Analysis | PERT | 0.285 |
| Simulation | 0.285 | |
| Risk/Issue Management | 0.430 | |
| Reporting | Report | 0.285 |
| Version Tracking | 0.285 | |
| Dashboard | 0.430 | |
| Communication Management | 0.500 | |
| Chat/Forum | 0.333 | |
| Video & Audio | 0.167 | |
| Utility | To do list | 0.500 |
| Filters | 0.333 | |
| Customized Fields | 0.167 |
| Risk Analysis | Cluster 1 | Cluster 2 | Cluster 3 | TOT |
|---|---|---|---|---|
| PERT | 0.333 | 0.167 | 0.333 | 0.285 |
| Simulation | 0.167 | 0.333 | 0.500 | 0.285 |
| Risk/Issue Management | 0.500 | 0.500 | 0.167 | 0.430 |
| Source | DF | AdjSS | AdjMS | F-Value | p-Value |
|---|---|---|---|---|---|
| Regression | 63 | 478.624 | 7.5972 | 10.60 | 0.000 |
| Activity Planning | 1 | 2.250 | 2.2500 | 3.14 | 0.079 |
| Resource Planning | 1 | 6.250 | 6.2500 | 8.72 | 0.004 |
| Control | 1 | 12.250 | 12.2500 | 17.09 | 0.000 |
| Risk Analysis | 1 | 71.908 | 71.9076 | 100.32 | 0.000 |
| Reporting | 1 | 5.501 | 5.5013 | 7.67 | 0.006 |
| Communication Management | 1 | 6250 | 6.2500 | 8.72 | 0.004 |
| Utility | 1 | 5.168 | 5.1680 | 7.21 | 0.008 |
| Access Permits | 1 | 3.939 | 3.9388 | 5.50 | 0.021 |
| Interviewed | 11 | 32.715 | 2.9741 | 4.15 | 0.000 |
| Activity Planning Interviewed | 11 | 17.514 | 1.5922 | 2.22 | 0.017 |
| Resource Planning Interviewed | 11 | 15.077 | 1.3706 | 1.91 | 0.043 |
| Control Interviewed | 11 | 18.764 | 1.7058 | 2.38 | 0.010 |
| Communication Management Interviewed | 11 | 14.566 | 1.3242 | 1.85 | 0.053 |
| Error | 128 | 91.750 | 0.7168 | ||
| Total | 191 | 570.374 | |||
| Model Summary | S | R2 | R2adj | ||
| 0.846639 | 83.91% | 76% |
| Feature | Coefficients Regression | Weights |
|---|---|---|
| Activity Planning | 0.750 | 0.104 |
| Resource Planning | 1.250 | 0.175 |
| Control | 1.750 | 0.243 |
| Risk Analysis | 1.224 | 0.171 |
| Reporting | 0.339 | 0.047 |
| Communication Management | 1.250 | 0.174 |
| Utility | 0.328 | 0.046 |
| Access Permits | 0.286 | 0.040 |
Publisher’s Note: MDPI stays neutral with regard to jurisdictional claims in published maps and institutional affiliations. |
© 2021 by the authors. Licensee MDPI, Basel, Switzerland. This article is an open access article distributed under the terms and conditions of the Creative Commons Attribution (CC BY) license (https://creativecommons.org/licenses/by/4.0/).
Share and Cite
Micale, R.; La Fata, C.M.; Lombardo, A.; La Scalia, G. Project Management Information Systems (PMISs): A Statistical-Based Analysis for the Evaluation of Software Packages Features. Appl. Sci. 2021, 11, 11233. https://doi.org/10.3390/app112311233
Micale R, La Fata CM, Lombardo A, La Scalia G. Project Management Information Systems (PMISs): A Statistical-Based Analysis for the Evaluation of Software Packages Features. Applied Sciences. 2021; 11(23):11233. https://doi.org/10.3390/app112311233
Chicago/Turabian StyleMicale, Rosa, Concetta Manuela La Fata, Alberto Lombardo, and Giada La Scalia. 2021. "Project Management Information Systems (PMISs): A Statistical-Based Analysis for the Evaluation of Software Packages Features" Applied Sciences 11, no. 23: 11233. https://doi.org/10.3390/app112311233