Article

Life Cycle Assessment of Free-Floating Bike Sharing on Greenhouse Gas Emissions: A Case Study in Nanjing, China

1
School of Transportation, Southeast University, Nanjing 211189, China
2
National Demonstration Center for Experimental Road and Traffic Engineering Education, Southeast University, Nanjing 211189, China
3
School of Civil and Transportation Engineering, Hebei University of Technology, Tianjin 300131, China
*
Author to whom correspondence should be addressed.
Appl. Sci. 2021, 11(23), 11307; https://doi.org/10.3390/app112311307
Submission received: 4 November 2021 / Revised: 25 November 2021 / Accepted: 25 November 2021 / Published: 29 November 2021
(This article belongs to the Section Transportation and Future Mobility)

Abstract

:
The free-floating bike sharing (FFBS) system appears in the form of low-carbon transport mode. Life cycle assessment (LCA) is a method to analyze the environmental impact of FFBS but has rarely considered the trip chain if the intermodal transport modes were employed. This paper proposes a mathematical formalization of LCA in response to the trip chain. The environmental benefit of FFBS was analyzed by this method considering the production, use, operation, and disposal phases in Nanjing. An online survey was conducted to analyze the mechanism of modal shift influenced by FFBS. The results showed that most respondents only use FFBS in the trip, with savings of 63.726 g CO2-eq/p·km, mainly shifting from lower-emission modes (28.30% from bus, 14.86% from metro, and 33.97% from non-motorized modes), while the trip mode of connecting public transport with FFBS could better replace the motorized transport trip and generate better low-carbon benefits with savings of 300.718 g CO2-eq/p·km. One FFBS should be used for at least 227 days to generate positive environmental benefits based on the current number of FFBS and the assumption of the utilization of each bike, which is once a day on average. The research results can effectively support the environmental benefit analysis of FFBS, the subsequent planning based on the low-carbon concept, and the implementation of relevant incentive policies.

1. Introduction

The energy consumption and greenhouse gas (GHG) emissions of China’s transportation sector account for a large proportion of the total national energy consumption. Therefore, the transport sector must achieve low-carbon development transformation as soon as possible in the context of a global response to climate change [1,2]. In this sense, the concept of a smart city has been applied to address the challenges, such as pollution, congestion, and lack of social infrastructure [3,4,5], to make cities more efficient, sustainable, equitable, and livable [6,7,8]. As an aspect of smart cities, the implementation of smart urban mobility [9,10,11], such as promoting public transportation, establishing bike-sharing systems, and restricting the use of cars, can reduce traffic congestion and GHG emissions [12,13,14]. As a new transport mode and part of the sharing economy, shared transportation is the innovation of the green development pattern, supporting sustainable urban transformations [15,16]. Free-floating bike sharing (FFBS) is a part of shared transportation and a short-term bike rental service, which is connected to the internet through smart phones to help users park the dock-less bikes almost anywhere in the service area and enable smooth door-door transport without being limited by station infrastructure [17,18,19]. FFBS not only facilitates short-distance trips of three kilometers or less [20], but also expands the service radius of public transport by connecting to them, enhancing the possibility of multi-mobility [21,22,23]. The emergence of the FFBS allows the using right of bikes to be constantly switched, and bikes are used by different users at different times [24], which greatly improves the use efficiency of bikes. Two widely used patterns of FFBS are direct use and connection with public transport in a trip chain [25].
The emergence of FFBS provides new ideas for reducing greenhouse gas emissions and promoting urban sustainable travel [26,27], which is of great significance to achieve the global environmental initiatives, including the United Nations’ sustainable development goals [28] and the Paris Agreement. However, in the field of transportation, the existing research mainly focuses on the energy consumption and carbon emissions in the use phase of transportation modes. Moreover, fewer papers have calculated carbon emissions in the life cycle [29], let alone considering the trip chain. Life cycle assessment (LCA) is a more scientific and comprehensive evaluation method, which is usually applied to assess the impact of a system on the environment in the life cycle from cradle to grave. LCA has great flexibility with a systematic theory and standard during application. Therefore, from the perspective of the life cycle, comprehensive consideration of the four phases of production, use, operation, and disposal of FFBS can further verify whether FFBS really generates positive environmental benefits.
The environmental benefits generated by FFBS are closely related to the modal shift, which is the difference between the GHG emission of using original transport modes and using other transport modes if FFBS was not available for the trip chain. Existing research on the modal shift is mainly based on simplified assumptions [30,31], such as roughly setting the modal shift threshold using the trip distance without considering others. The modal shift structures influenced by FFBS are different in different usage patterns. For example, the mode of FFBS connecting public transport can better replace a car trip [32,33]. Hence, it is necessary to analyze the different usage patterns of FFBS. In addition, the user’s trip chain information cannot be obtained according to the historical trip data of FFBS. Therefore, this study analyzed the use characteristics of FFBS and the modal shift distribution under the influence of FFBS based on the trip chain through questionnaires, and evaluated the environmental benefits of FFBS. This paper discusses the following questions:
  • What are the modal shift patterns and environmental benefits of FFBS in different usage patterns?
  • Do the environmental benefits of FFBS change throughout its life cycle when considering the trip chain?
The following part of this paper is structured as follows: the next section introduces the related research on FFBS environmental benefits, as well as the application of life cycle assessment in FFBS. Section 3 introduces the questionnaire design and GHG emission accounting for the analysis. The modal shift results under the influence of FFBS and the net environmental benefits of FFBS are analyzed in Section 4. The last section summarizes the research and puts forward the implication of future research.

2. Literature Review

Keywords were used to find the related literature since 2010 in Web of Science. The search string was AK = ((“bike-share” OR “free-floating bike-sharing” OR “public bike” OR “public bicycle” OR “dock-less bike-sharing”) OR (“life cycle assessment” OR “emission reduction” OR “GHG emission” OR “carbon emission” OR “modal shift”)).
Bike sharing provides convenient and environmentally friendly trip modes for people because it does not generate air and noise pollution [34]. Although the emergence of bike sharing instead of other transport modes leads to emission reduction, the production, operation, and disposal of bikes will generate GHG emissions from the perspective of the life cycle.
Existing studies have mainly focused on the use phase. The GHG emission reduction of bike sharing is mainly achieved by replacing other transport modes in the trip, such as motor vehicles and public transport. Anderson [31] assessed a bike-sharing program in Portland and found that the bike-sharing program could improve air quality and increase sports activity rates for bike-sharing users. Eliot et al. [35] assessed the impact of the Bike to Work Day on the bike mode shift by a questionnaire. The study found that 4% of participants started regular bike commuting through the event, with estimated 3.1 million regional VMT reductions and 1200 tons of GHG emission reductions per year. Zhang and Mi [30] evaluated the environmental benefits of the FFBS in Shanghai from the perspective of space and time. When the trip distance of the FFBS was greater than 1 km, FFBS was considered to replace the car for the trip. Through a questionnaire survey, Wang et al. [36] divided the modal shift threshold between different transport modes to determine the different transport modes replaced by public bikes at different distances in Hohhot, and found public bikes can reduce carbon emissions by 4381.28 tons. Kou et al. [37] proposed a bike share emission reduction estimation model based on considering factors, such as the trip distance, trip purpose, trip start time, public transport accessibility, and historical distribution of trip mode selection, to estimate the alternative traffic mode of a shared bicycle trip. However, these studies only considered the GHG emission reduction of FFBS in the use phase, and did not perform a comprehensive analysis from the perspective of the life cycle.
Recently, some scholars analyzed the environmental benefits of the bike sharing system (BSS) by using life cycle assessment. Luo et al. [19] conducted life cycle assessment and comparison of the station-based BSS and free-floating BSS in the United States. Through scenario analysis, they quantified the impact of different modal shift structures caused by BSS on greenhouse gas emissions and the overall standardization environment. Bonilla-Alicea et al. [38] used life cycle assessment to compare private bicycle, smart dock BSS, and smart bike BSS, and evaluated the impact of the use of electronic equipment on the environmental benefits of BSS. Zheng et al. [39] used a questionnaire survey to understand the change of the trip mode after the introduction of shared bikes for directly use. On this basis, the change of the trip behavior and the life cycle environmental impact of shared bikes were modeled. Sensitivity analysis showed that aging, rising rent, and an increasing number of shared bikes had a negative impact on the environmental benefits of shared bikes. From the perspective of the life cycle, Wang [29] quantitatively analyzed the carbon footprint of different transport modes, obtained the data of the modal shift by a questionnaire, and analyzed the environmental benefit of FFBS through scenario analysis. Chen et al. [40] calculated the emission reduction threshold of FBBS by assuming different disposal methods. According to the total amount of FFBS in Beijing, it was found that it takes at least 686 days for an FBBS to reach the net emission equilibrium point. These studies show that the emergence of bike sharing has played a positive role in the development of low-carbon transportation. However, they fail to analyze the trip chain when users use shared bikes. Then, it is difficult to determine whether FFBS will still generate positive environmental benefits under the trip chain.

3. Materials and Methods

3.1. Study Area

Nanjing is the capital of Jiangsu Province, and is an important central city in eastern China. In order to optimize the urban traffic trip structure and promote residents from the car trip to ‘public transport + bike’ trip, Nanjing has vigorously developed a station-based bike-sharing service since 2013. The FFBS was introduced into Nanjing in January 2017. After the capacity scale adjustment of FFBS in the first half of 2020, the amount of FFBS of Nanjing is 257,000 [41]. The mode share of residents in the main urban area of Nanjing in 2018 is as follows: public transport 29.50%, private car 17.70%, walking 24.20%, and bike 27.20% [42]. As one of the large-scale bike-sharing operating cities in China, Nanjing is selected as the study area. The rapid development of FFBS has also had a significant impact on other transport modes. In a survey with a total sample size of 30,401, 74.79% of respondents believe that FFBS can effectively improve the connection problem of a public transport trip. In total, 68.97% of respondents believed that FFBS can effectively reduce the use of private cars [43].

3.2. Questionnaire

It is necessary to reasonably estimate the emission reduction effect of its usage phase. Therefore, the goal of this study was to investigate what pattern of FFBS is applied in a trip chain, and what kind of transport mode is usually abandoned by users to ride FFBS. The questionnaire begins with the two key questions: “What is the last usage pattern of free-floating bike sharing, directly for short-distance trip (Pattern 1) or combined with bus/metro (Pattern 2)?” and “If FFBS was not available, which transport modes would you have used primarily for this trip?” The first question requires respondents to choose whether to use FFBS on Pattern 1 or Pattern 2. According to the respondent’s choice, it jumps to the corresponding questions to collect the respondent’s choice of the alternative transportation modes for the trip chain under the specific usage pattern. The emission reduction effect of FFBS is calculated more accurately through considering the trip chain of users.
There are some standard questions about respondents’ personal socio-economic attributes (such as age, gender, occupation, income, and education) and trip characteristics (trip purpose, trip origin, and destination type). Additionally, we weighted the results according to the FFBS usage frequency of each respondent to measure the differences between individuals. The answers to the following questions will be used in this paper.
Q1: How often do you use the FFBS?
Q2: What was the last usage pattern of FFBS, directly for short trips or for connecting public transport?
Q3: What was the distance for the last time you use FFBS (one-way, in km)?
Q4: What was the duration for the last time you use FFBS (one-way, in minutes)?
Q5: If FFBS were not available, which mode have you used primarily for this short-distance trip instead of using FFBS directly (Pattern 1)? If you use this other transport mode, how long would it have taken you to reach the destination on the same route?
Q6: If the last FFBS trip was used to connect the bus/metro, what kind of public transport do you connect to? And how much time was spent on the bus/metro (one-way, in minutes)?
Q7: If you could not use FFBS to connect the bus/metro (Pattern 2), what traffic mode would you have chosen for this trip? And if you used this other traffic mode, how long would it have taken you to reach the destination on the same route (one-way, in minutes)?
Considering the universality and convenience of the survey, this survey was achieved online in nearly an eight-week period in April and May 2021 in Nanjing through sample service provided by the survey platform. The temperature varied from 15 to 30 degrees Celsius during the survey period, and most of the weather was cloudy, which was suitable for riding FFBS.

3.3. Method

The method is based on questionnaire data of modal shift and life cycle assessment. As shown in Figure 1, the production, operation, and disposal phases belong to the phase of GHG emissions. In the use phase, FFBS do not need to consume energy, but public transport modes and cars do. Therefore, if FFBS replaces other modes in the trip, it leads to GHG emission reduction. Therefore, the core of evaluating the environmental impact of FFBS is to determine the modal shift by each FFBS trip. In functional unit determination, the carbon equivalent emission per passenger-kilometer (gCO2-eq/p·km) is used. We establish the hypothesises that the emergence of FFBS will not affect the production and disposal of other public transport modes and cars; moreover, walking and riding bikes do not generate GHG emissions in the usage phase [29,40].
By comparing the emissions of other transportation modes with those of FFES, the emissions reduced by using FFES can be quantified. At the same time, the environmental benefits of FFES can be obtained by calculating the difference between the emission reduction in the use phase and GHG emissions generated by other phases of the FFBS life cycle.

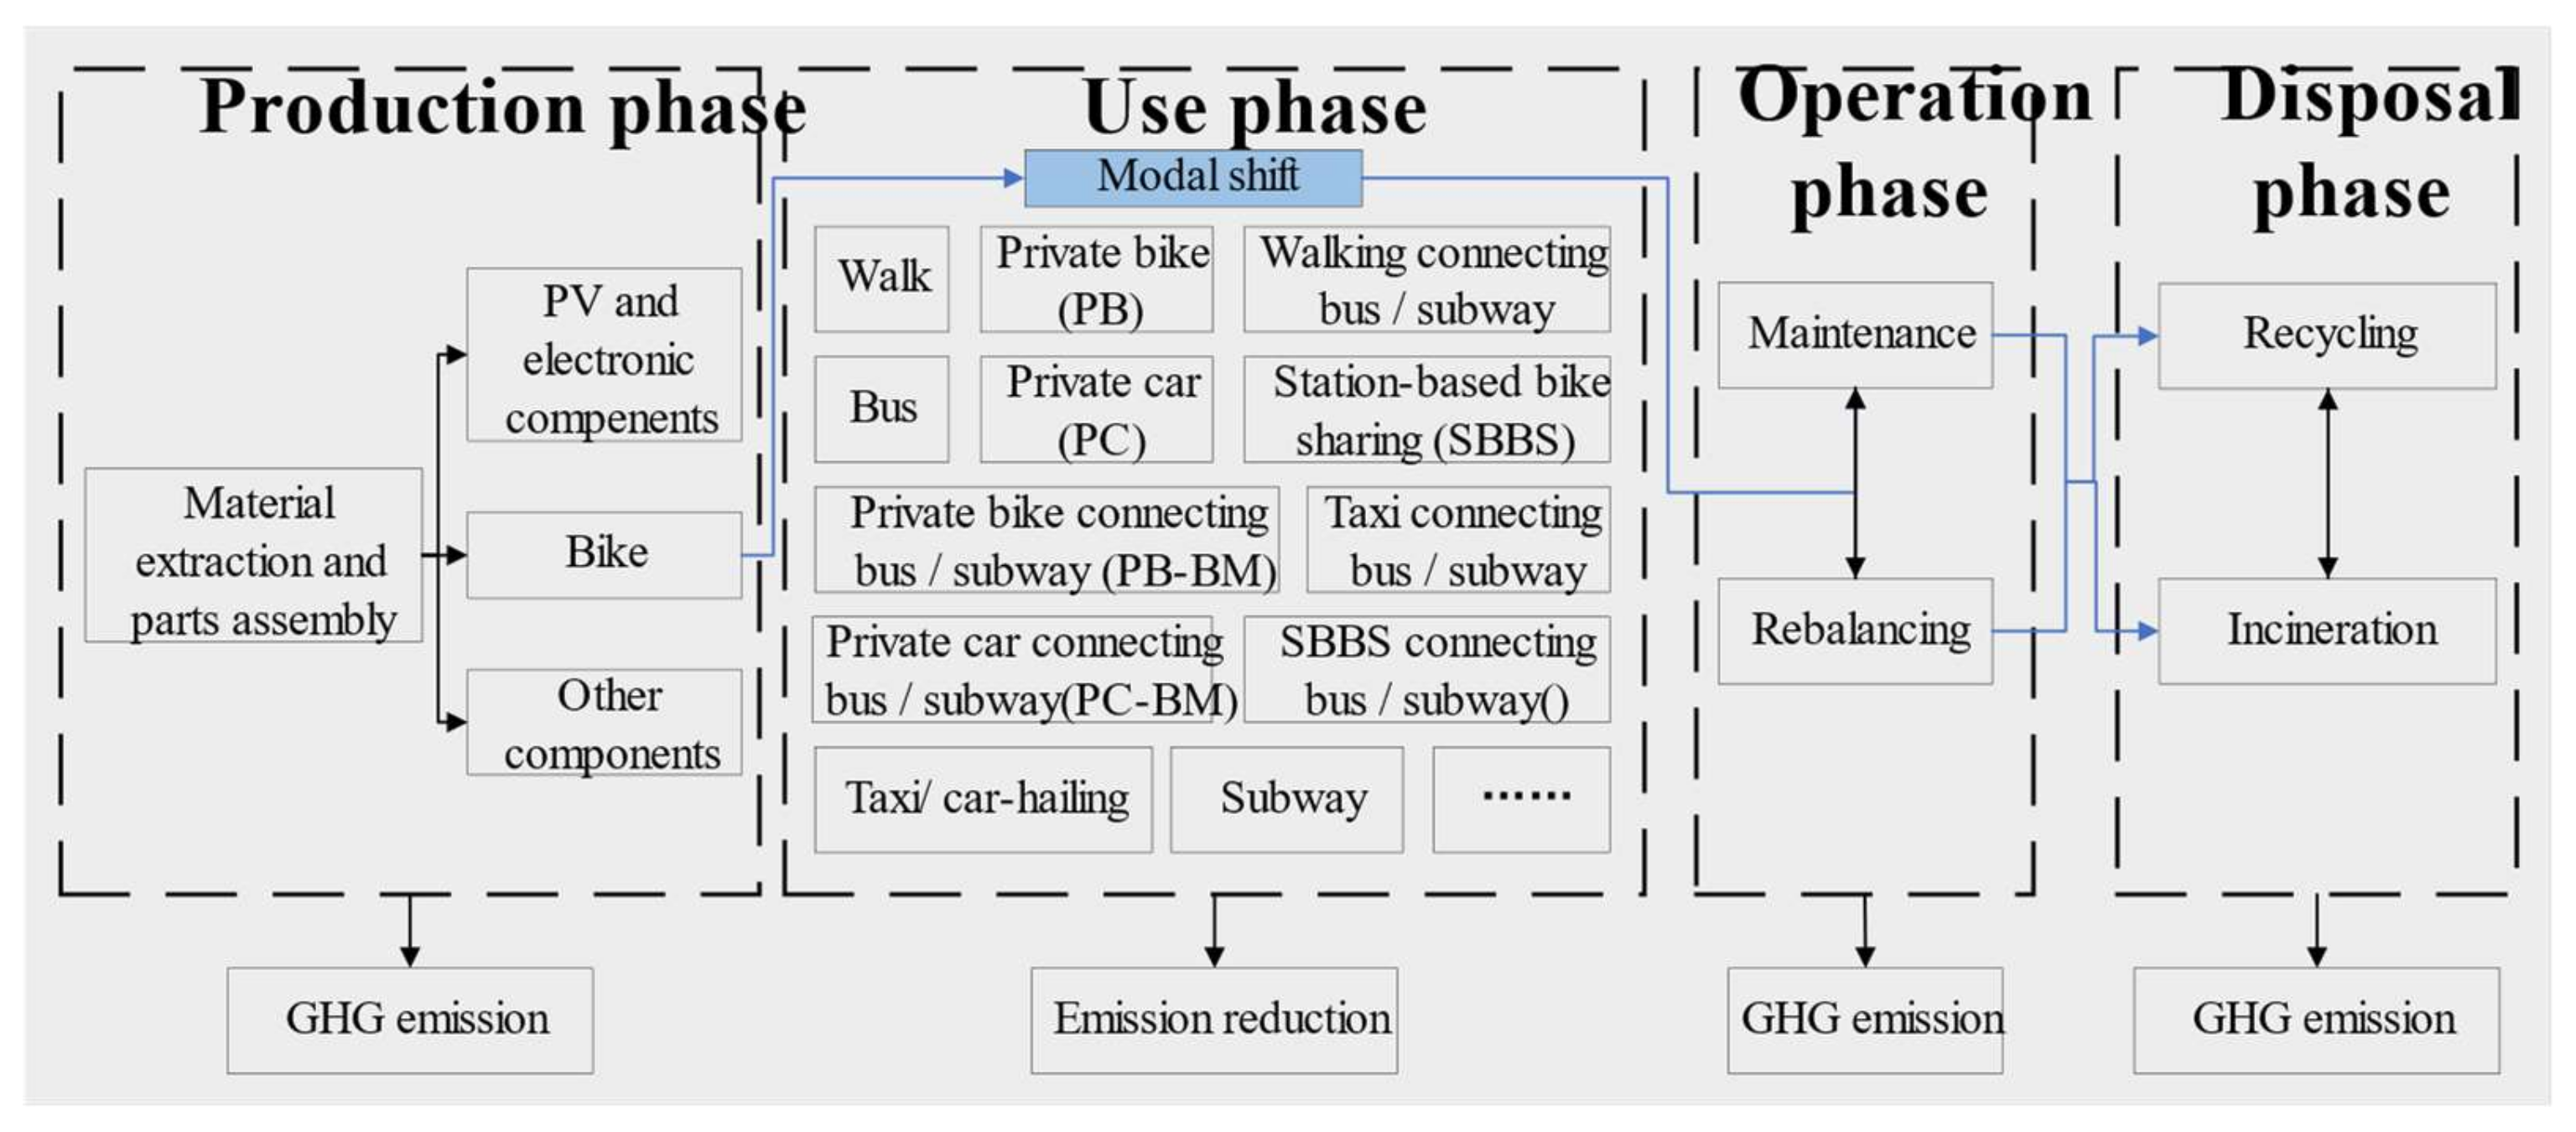
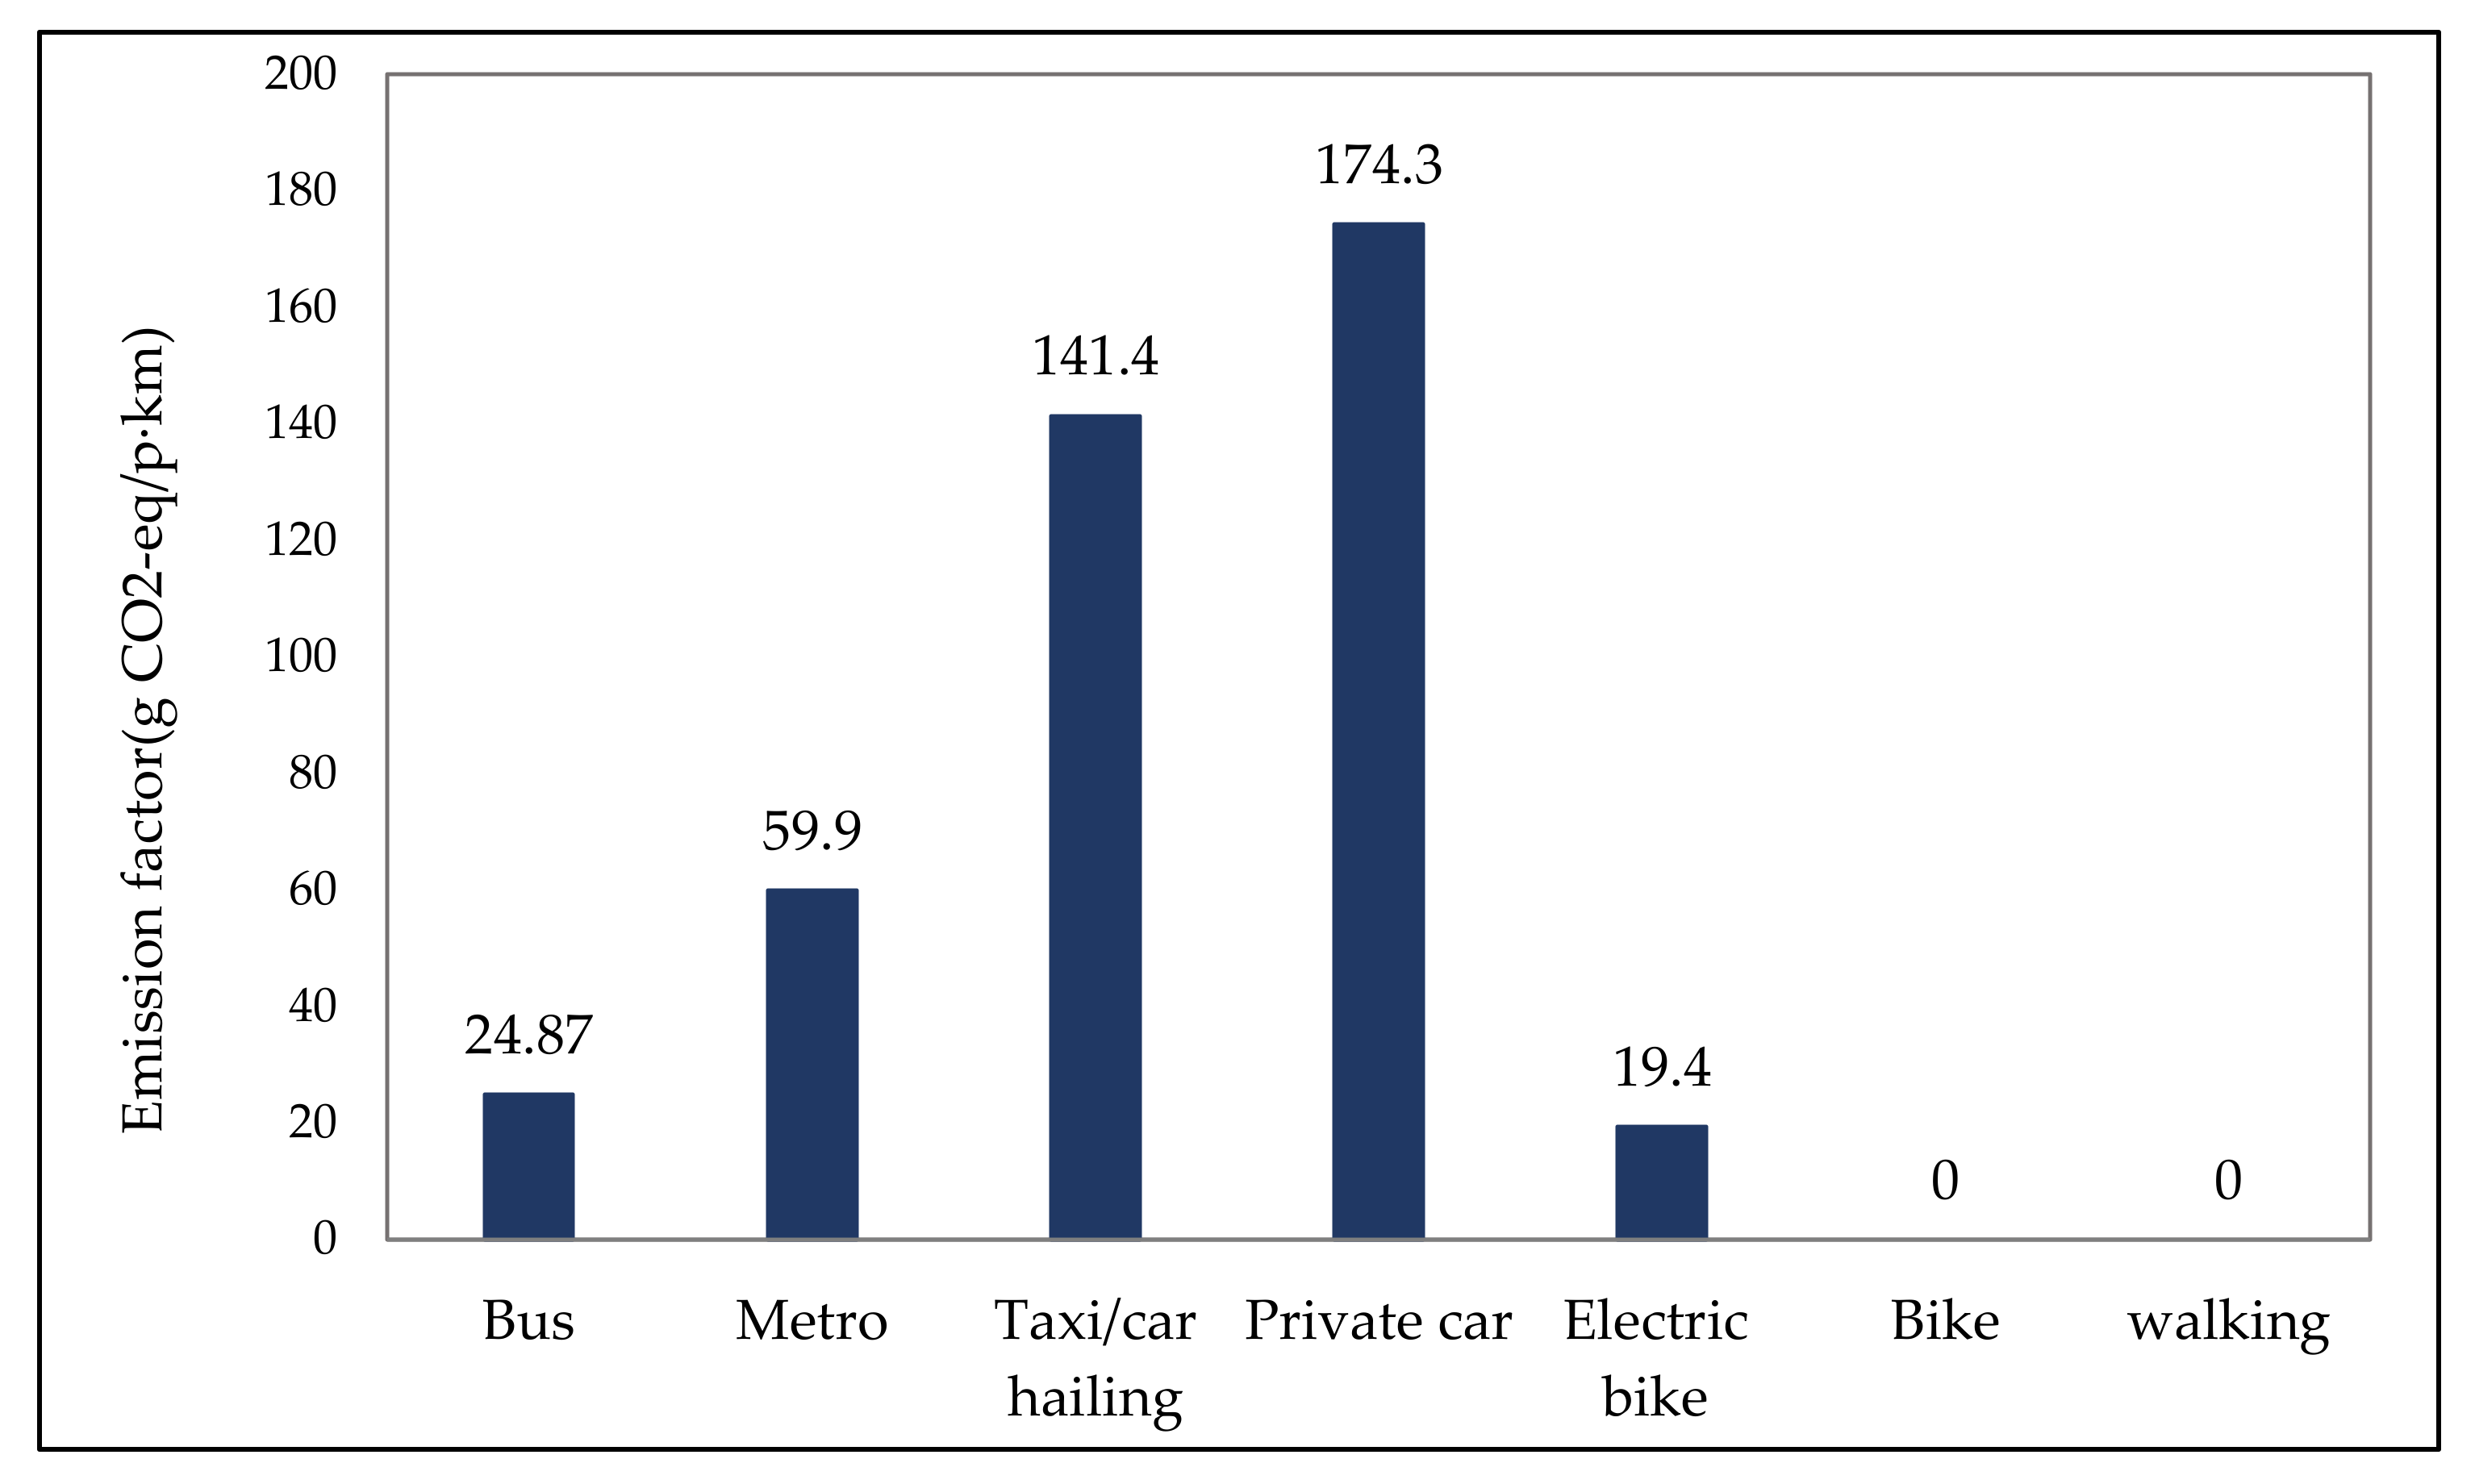
3.3.1. The Environmental Impact Calculations

The production phase of FFBS mainly includes four main processes: raw material production, processing, parts assembly, and transportation. FFBS is a traffic tool for single people. Hence, the number of passenger-kilometers traveled equals the number of vehicle-kilometers traveled [29,44]. The emission coefficient E F p of FFBS at the production stage can be calculated as:
E F p = P E C D · F · T = k = 1 K C k · θ k D · F · T
where:
  • P E C is the GHG emission generated by FFBS;
  • D is the average trip distance (km) of a FFBS trip;
  • F is the average annual turnover number of FFBS;
  • T is the service life of FFBS (years);
  • C k is the kth energy consumption required by FFBS; and
  • θ k is the GHG emission factor of the kth energy.
Taking Nanjing as an example, the main manufacturing plant of FFBS is located in Danyang City. The average distance of trucks that can load 100 FFBS from Danyang to Nanjing is 94 km, so the average delivery distance of each bike is 0.94 km. The GHG emissions in the delivery process for the production phase can be calculated as:
G H G t = D t C t θ t A
where:
  • G H G t is the GHG emission when the unit FFBS is transported to the destination;
  • D t is the distance between the production place and the destination;
  • C t is the energy consumption of the unit delivery truck used;
  • θ t is the GHG emission factor of the energy; and
  • A is the load FFBS number of per transportation truck available.
The GHG emission reduction effect of FFBS is the difference of GHG emissions between using FFBS and other transport modes if FFBS was not available in the same trip. In the use phase, public transport and motor vehicles generate GHG emissions due to energy consumption. Therefore, for other transportation modes, such as bus, metro, taxi, and private car, the emission factor ( E F u i ) of the mode i per km in the use phase is obtained by considering the GHG emissions related to energy consumption [29]. The GHG emission per km of transport mode i in the use phase E F u i is formulated as:
E F u i = C i · θ i
where C i is the energy consumption per km of transport mode i. The GHG emissions of other transport modes in the use phase is G H G u i = E F u i · D i s t a n c e u i . D i s t a n c e u i is the trip distance of the alternative transport mode i for the associated FFBS trip. D i s t a n c e u i = v i · t i . v i is the average operating speed of the ith transport mode in Nanjing. The average operating speeds of taxi, private car, bus, and metro are 25.60, 26.00, 18.00, and 45.40 km/h, respectively [45,46]. t i is the time spent by using alternative transportation mode i to complete the trip, which is obtained by question Q5 or question Q7.
According to the “Didi Platform Green Transport White Paper 2020” released by Didi Chuxing, which is the world’s leading mobility technology platform, Figure 2 shows the GHG emission factors of different transport modes at the use phase [47]. The calculation is temporarily replaced by the electric bike data when the alternative transportation mode chosen by the respondents is other.
The operation phase of FFBS mainly includes two main processes: rebalancing and maintenance [40]. The rebalancing of FFBS mainly uses three types of vehicles, namely, small trucks, three-wheel electric vehicles, and Iveco vehicles. According to the data collected from an FFBS enterprise in Nanjing, the condition of dispatching vehicles in Nanjing is shown in Table 1, and the rebalancing proportion from this enterprise is 10%. The enterprise occupies a large market share in Nanjing and is representative. Therefore, the number of FFBS rebalanced daily in Nanjing is 10% of the total amount of FFBS. The GHG emission factors of small trucks, three-wheel electric vehicles, and Iveco vehicles at the use phase are 257.7, 81.2, and 300.0 gCO2-eq/km, respectively [40].
Therefore, in terms of rebalancing, the GHG emissions of FBSS are:
G H G r = r = 1 R n r v · α r E F u r D r N
where:
  • G H G r is the emission of per FFBS during rebalancing;
  • n r v is the total number of dispatched vehicles in Nanjing;
  • α r is the proportion of the rth dispatched vehicles;
  • E F u r is the GHG emission factor of the rth dispatched vehicles in use phase;
  • D r is the average daily rebalancing distance per rth dispatched vehicles; and
  • N is the total number of FFBS in Nanjing.
For the maintenance process of FFBS, the following formula is used:
G H G m = m = 1 M C m · θ m · P m
where G H G m is the GHG emission from the FFBS maintenance process and P m is the maintenance probability of the mth bike part, referred to in [40].
In the disposal phase of FFBS, recycling and waste incineration are mainly considered. It is assumed that 90% of the recovery efficiency is used [19,48]. Additionally, the remaining components are burned as waste. Referring to the calculation formula of GHG emissions from waste incineration, the GHG emissions G H G d for non-recyclable partial incineration are calculated as follows:
G H G d = d = 1 D B C d · E F d
where B C d is the weight of the dth non-recyclable bike component and E F d is the GHG emission factor for burning the dth bike component. Therefore, the final GHG emission in the life cycle of FFBS is:
G H G = p = 1 P G H G p
where G H G p is the GHG emission of each phase in the life cycle. Because the emergence of FFBS will not have a significant impact on the production and disposal of public transport, and the function orientations of FFBS and cars are different, this paper does not take other phases of other traffic modes into account instead of the use phase.

3.3.2. Respondents Weighted Factor

The above calculation estimates the trip distance of the respondents using FFBS and the alternative transport mode for the same trip, and calculates the GHG emission reduction effect of each FFBS trip. In order to obtain the reduction of GHG emission under the influence of FFBS over a year, we will weight the answer according to the weekly frequency of FFBS used considering the user heterogeneity. Additionally, it is assumed that the latest FFBS trip behavior of the interviewee represents its annual behavior [44], and the respondents weighted factor (WF) will be used, which represents the annual use of FFBS by each respondent, as shown in Table 2.

3.3.3. Generalization of the Sample to the Nanjing Usages

After the evaluation of the FFBS business service in the first half of 2020, the capacity scale number of FFBS was adjusted to 257,000 in Nanjing. Additionally, the daily usage of FFBS was about 1.3 million person-times by the end of 2017 [42]. Therefore, we assume that 1.3 million people have used FFBS at least once in Nanjing based on these figures. The following equation is used to calculate the impact of the promotion of FFBS on annual GHG emissions in Nanjing [44]:
G H G = N F F B S · ( φ d i r e c t i W F i · G H G i n d i r e c t + φ c o n n e c t i o n j W F j · G H G j n c o n n e c t i o n )
where G H G is the GHG emission reduction of FFBS in Nanjing considering respondents weighting factor, N F F B S the number of FFBS users in Nanjing, and φ d i r e c t and φ c o n n e c t i o n are the proportions of respondents who use FFBS for Pattern 1 and for Pattern 2 in the survey, respectively.

4. Results

4.1. Descriptive Analysis

A total of 1688 valid questionnaires were collected, of which 76.96% of respondents used FFBS for a direct short-distance trip, and 23.04% of respondents used FFBS for bus/metro connection. According to different usage patterns, we obtained the sample distribution as shown in Table 3 and Table 4. In different usage patterns, most samples were made up of young people, which could be explained by the physical constraints of those who are over 45 years old. Interestingly, in the sample for Pattern 2, the proportion of respondents who own other private transportation was higher than that of the sample for Pattern 1. In terms of trip behavior characteristics, among the samples for Pattern 1, more than half of the respondents used FFBS less than once a week. In the samples for Pattern 2, more than half of the respondents used it at least twice a week. In other surveys, it was found that users with high frequency mainly used FFBS as a daily metro connection tool, and that the higher the frequency is, the higher the dependence on FFBS works as a connection tool [29], so the results of this study are more credible. As for the trip purpose, about 1/3 of the samples for Pattern 1 use FFBS for commuting, and this proportion is close to half for Pattern 2.
Trip distance is an important factor affecting GHG emissions. We investigated the trip distance in the two patterns. From the overall sample, the average riding distance of the respondents is 2.2 km. However, considering the differences in the usage pattern of FFBS, there is a large gap in the distribution of riding distance. In Pattern 1, the average riding distance of the sample is 2.3 km. When the FFBS is used to connect the bus/metro, the average riding distance of the sample is 1.9 km. In the sample of Pattern 2, 93.80% of the respondents’ trip time on the bus or metro is not more than 40 min. The average trip time on the bus of the respondents for Pattern 2 is 19.3 min, and the average trip time on the metro is 21.5 min.

4.2. GHG Emission Reduction Results

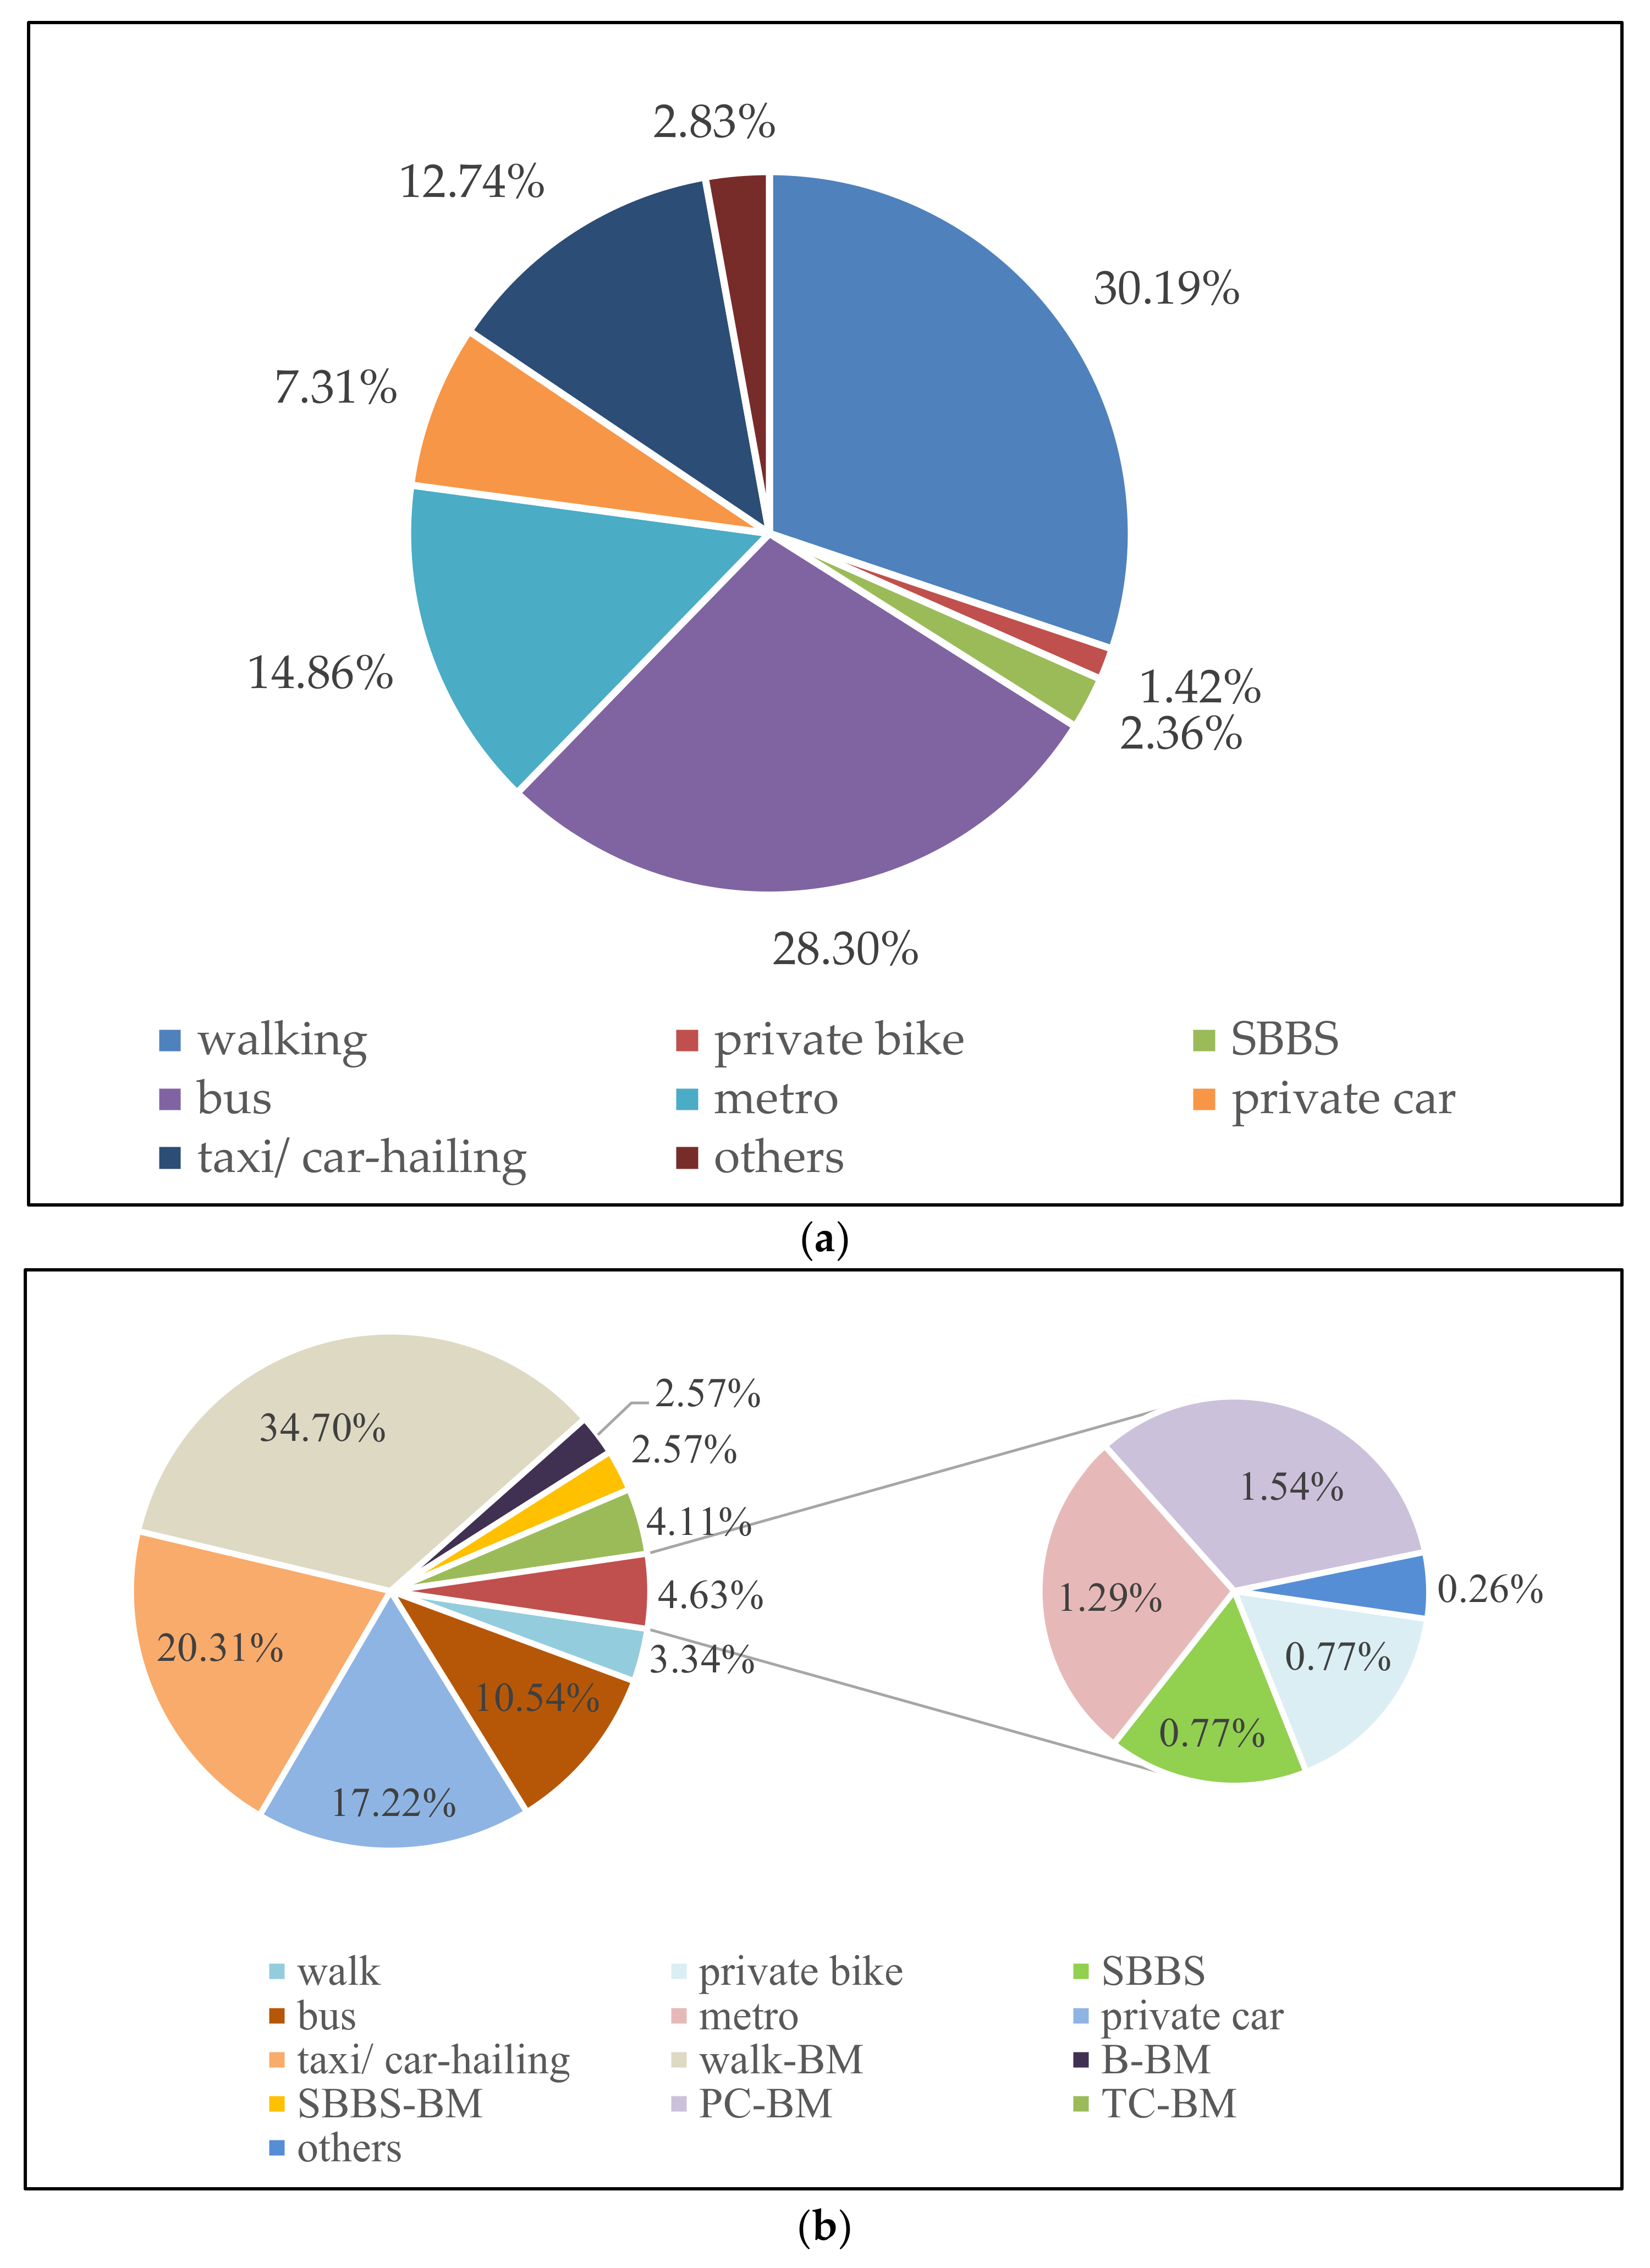
4.2.1. Substitute Structures

The questionnaire shows that among the samples for Pattern 1, nearly 80% of the respondents’ ride FFBS after abandoning non-motorized modes, buses, and metros, as shown in Figure 3a. The average intervals of Nanjing metro station and bus station is about 1.5 and 1 km, respectively. Therefore, some respondents for Pattern 1 will choose to replace public transport, because the flexibility and accessibility of FFBS are better than public transport in short-distance trips. At the same time, compared with the impact of bike sharing in other countries around the world on modal shift, it is found that due to the short-distance characteristics of bikes, the proportion of bike sharing replacing the original car trip is very low but that replacing original public transport and walking trips is more than 80% [49,50,51].
In the sample of Pattern 2, more than 1/3 of the users choose to use walking to connect bus/metro if FFBS connecting public transport is not available, but 43.20% of the users choose motor vehicles or motor vehicles to connect public transport. FFBS connecting public transport has a stronger substitution effect on motor traffic. Meanwhile, fewer respondents use SBBS or private bikes to replace FFBS, which are more flexible, as shown in Figure 3b. Some studies have shown that most people choose to use shared bikes instead of walking or private bikes as a supplement to the public transport after introducing a bike sharing system [33]. As a short-distance transport mode, the shared bike is a functional replacement for walking and public transport. However, because FFBS has a strong complementarity with public transport, it can more effectively cut the reliance of motor vehicles [32,33].

4.2.2. The Total GHG Emission of FFBS in Life Cycle

According to the data from bike operators, relevant studies, and the Ecoinvent database [19,40], the weight of each bike is about 20 kg, including 15.181 kg steel, 0.171 kg aluminum, 1.105 kg plastic, 2.143 kg paper, 1.400 kg rubber, 0.35 kg electrical equipment, 0.15 kg battery, and 0.02 kg photovoltaic panel, etc. Producing a bike requires 0.001 m3 of water, 0.37 kWh of electricity, and 0.85 m3 of natural gas. According to the recovery efficiency setting in the disposal phase, taking Nanjing as an example, the GHG emission of a FFBS is 54.209 kg CO2-eq.
The operation phase is mainly divided into two parts: rebalancing and maintenance. First of all, according to the obtained scheduling statistical data, shown in Table 1, assuming that the daily average scheduling distance of small trucks, three-wheel electric vehicles, and Iveco vehicles is 100, 185, and 70 km, respectively. The GHG emission generated by the daily scheduling of each FFBS is 0.012 kg CO2-eq. Hence, in the service life of FFBS, the GHG emission generated by the scheduling is 13.384 kg CO2-eq. Due to lack of corresponding data, the average GHG emission per FFBS maintenance was 0.319 kg CO2-eq [40]. Therefore, in the whole operation phase, each FFBS emits an average of 13.727 kg CO2-eq. In the disposal phase, it is assumed that 90% of the recyclable metals can be reused, and the remaining parts are all disposed as waste for incineration. According to the formula, the average emission of 8.774 kg CO2-eq will be generated in each FFBS disposal phase.
It is calculated that in the life cycle of FFBS, the three phases of production, operation, and disposal will generate GHG emissions of 76.710 kg CO2-eq, of which the production phase generates the most GHG emissions.

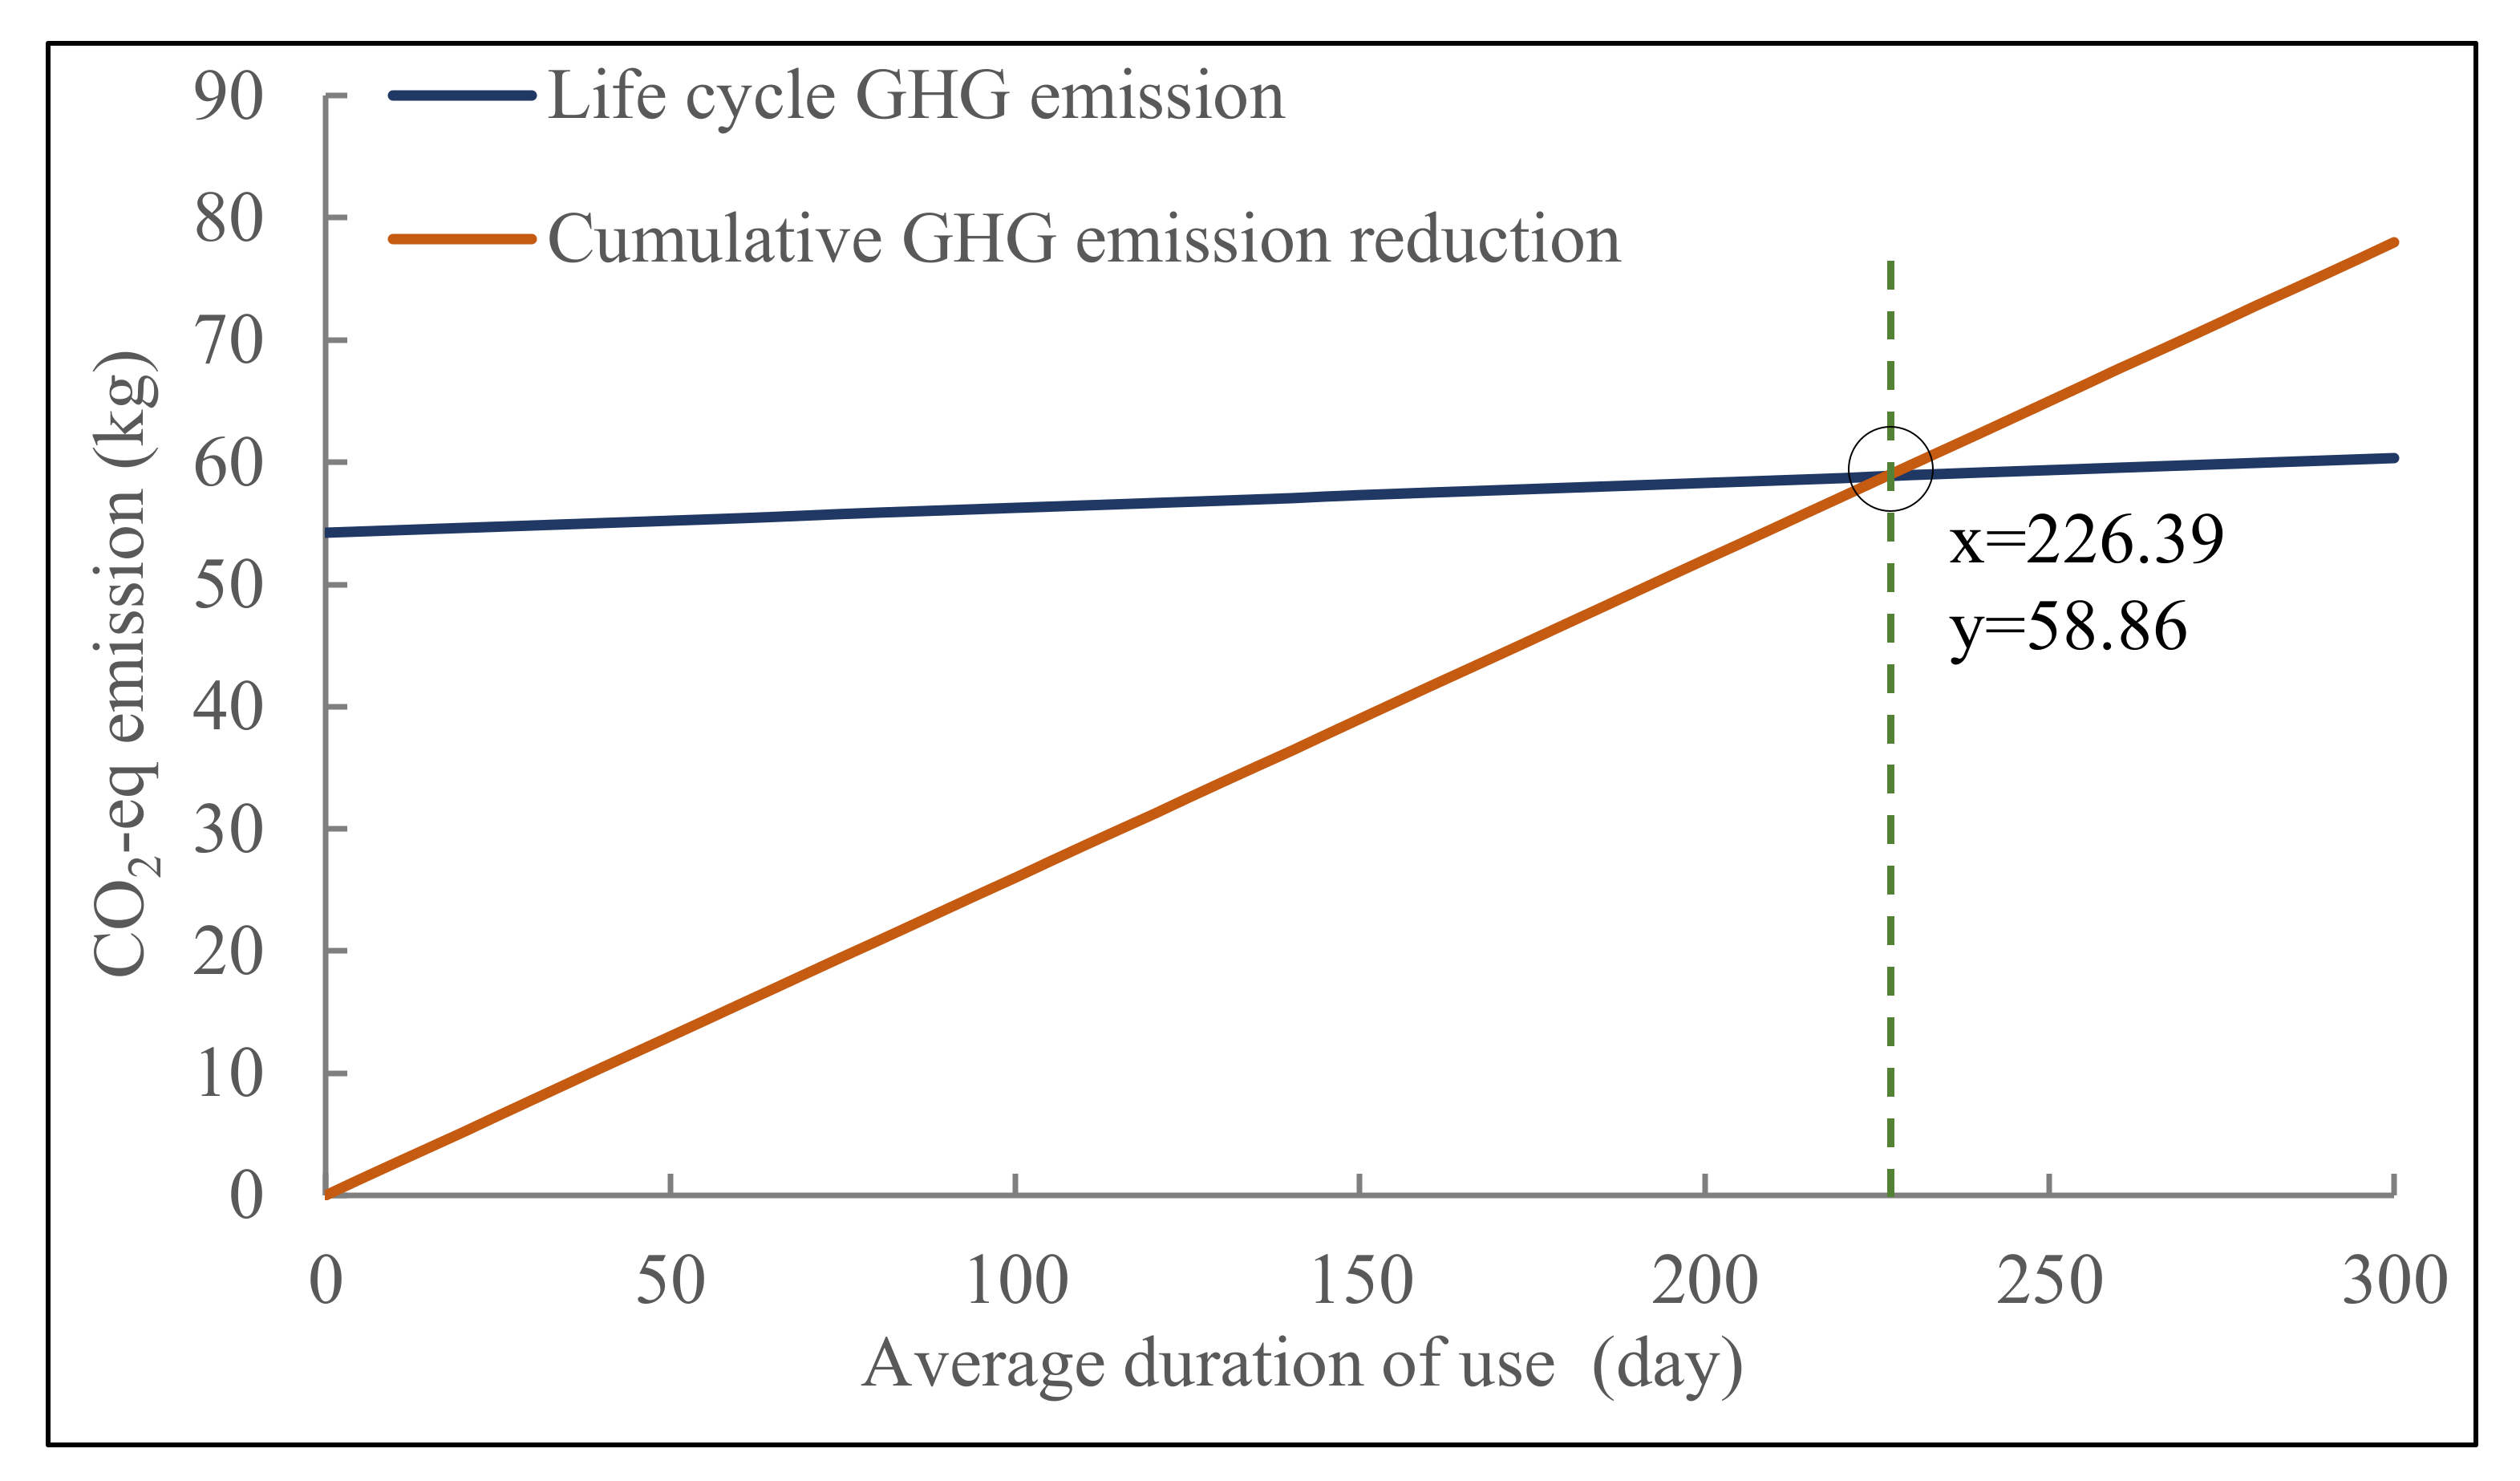
4.2.3. Assessing the GHG Emission Reduction of Every FFBS Trip

According to the survey results, the GHG emission reduction effect caused by FFBS in the use phase is estimated. As for the 1299 samples of Pattern 1, a total of 190.395 kg CO2-eq of GHG emission were saved during the use phase. While 34.90% of the samples did not generate GHG emission reduction in their FFBS trip, because they will use walking or other bikes for the trip, which do not generate GHG emissions in the use phase without FFBS. Most samples have an effective GHG emission reduction effect. Although FFBS has a low substitution rate for motor traffic in Pattern 1 samples, the reduction effect is still significant due to the high GHG emission factor of motor traffic. On average, the GHG saving using FFBS is about 63.726 g CO2-eq/p·km among the Pattern 1 samples.
As for the 389 samples of Pattern 2, a total of 241.275 kg CO2-eq GHG emissions were reduced during the use phase. However, 15.17% of the samples increase GHG emissions. The reason is that if users do not use FFBS to connect the metro for the trip, they will turn to directly use bus or other non-motorized modes. In total, 39.85% did not reduce GHG emissions in the FFBS trip, because these respondents would still choose other non-motorized modes to connect the bus/metro without FFBS. In the sample of Pattern 2, the GHG emission reduction benefits mainly come from replacing the motor vehicle trip. In the Pattern 2 samples, about 300.718 g CO2-eq/p·km was saved, far greater than the average of samples for Pattern 1. The GHG emission reduction is about 118.329 g CO2-eq/p·km for the overall sample, which may be demonstrated as FFBS, as a supplement of the public transport, enhances the accessibility of public transport, and people are more willing to shift from high-emission motor transport to low-emission public transport. When FFBS is directly used for trips, because of the great influence of people’s physical strength, which explains the short-distance characteristics of FFBS, the GHG emission reduction effect is not significant. Another study has shown that dock bike-sharing systems in different American cities reduce emissions by about 283 to 581 g CO2-eq per shared bike trip [37]. This may be due to differences in our modeling methods. In addition, there are differences in the traffic environment and trip characteristics of different cities. At the same time, we consider the trip chain of users, which will affect the final result.
Considering the user heterogeneity, the respondent weighted factor is introduced to characterize the annual behavior of using FFBS. The result shows that the annual emission reduction benefits of FFBS in the use phase are 16.783 tons of CO2-eq in the sample for Pattern 1 and 24.470 tons of CO2-eq in the sample of Pattern 2. Then, according to the proportion of users with different use patterns obtained by the survey, when the number of FFBS users in Nanjing is 1.3 million, 76.96% of the users choose to use FFBS for a direct trip, and 23.04% of the users are used to connect the bus/metro. The existing norms stipulate that the mandatory retirement age of the FFBS is 3 years. When Nanjing has 257,000 FFBS, FFBS generate the net annual environmental benefits for Nanjing transportation sector by 25,195.921 tons of CO2-eq emission reductions in the life cycle. FFBS system has significant environmental benefits and effectively improves the traffic trip structure. However, most respondents only use FFBS for short-distance trips. In short-distance trips, most choose public transport and non-motorized modes as alternatives, so the environmental benefit is not significant. At the same time, in the sample of connecting trips, nearly half of the users are commuter trips, and more than 1/3 of them choose motorized traffic as alternatives. Therefore, strengthening the connection between FFBS and public transport is conducive to alleviating the impact of commuting at the trip peak. The relevant management departments should reasonably arrange parking areas of FFBS near public transport sites and reasonably regulate the number of FFBS in different areas. In addition, as shown in Figure 4, when there are 257,000 FFBS in Nanjing, each bike is used once a day on average, and the average riding distance is 2.2 km, and each bike needs to be used for at least 227 days to achieve zero emissions. The GHG emissions generated in the production, operation, and disposal phases can be offset by using FFBS. However, with the improvement of the FFBS turnover rate, it can reach an equilibrium point faster in the current situation. Furthermore, the management departments should also reasonably determine the inputs number of FFBS with the life cycle concept of FFBS and the actual situation.

5. Conclusions

As a new choice and an effective supplement to public transport, FFBS has an impact on people’s choice of trip modes. This paper quantified the carbon emission footprint of FFBS, analyzed the modal shift patterns in response to different usage patterns of FFBS, and estimated the break-even point based on the number of FFBS and the utilization of each bike, which is once a day on average. The results showed that the popularity of FFBS has brought positive environmental benefits. Additionally, the trip mode of using FFBS combined with public transport can replace motorized traffic more effectively with greater environmental benefits. The main conclusions of this study can be summarized as follows:
  • Through the questionnaire survey, it was found that the average riding distance of users was different under different usage patterns. The average riding distance was 2.3 km of using FFBS directly for short-distance trips. The average riding distance for users using FFBS to connect to public transport was 1.9 km. In addition, in the samples for Pattern 2, the frequency of respondents using FFBS was higher than that of respondents of Pattern 1. The complementary role of FFBS and public transport enhances the accessibility of both sides and provides users with a more convenient and efficient trip mode.
  • FFBS is not a zero-carbon transport tool. In its life cycle, GHG emissions will be generated in the production, operation, and disposal phases. A total of 76.710 kg CO2-eq emissions are generated for each FFBS. The production phase will generate the most CO2 emissions, accounting for 70.67%. The environmental effect of FFBS is mainly achieved by replacing other high-emission transport modes in the use phase. In the sample of Pattern 1, nearly 80% chose other non-motorized modes or public transport modes as alternatives. In the sample of Pattern 2, 43.20% chose motorized traffic as alternatives.
  • When Nanjing has 257,000 FBBS and each FFBS is used on average once a day, the break-even point is about 227 days, which means the FFBS system can achieve a positive net environmental benefit. The amount of FFBS environmental benefits mainly depends on the modal shift and its use efficiency. When the turnover rate becomes higher, the environmental benefit will also be significantly improved.
In sum, this paper provides some views on the environmental impacts of FFBS from the perspective of life cycle, but there are still shortcomings. We made assumptions about user behavior, which may lead to uncertainty of the results in order to get annual results. Additionally, how to combine intermodal survey data with historical trip data of FFBS is also a subject worthy of further study. In addition, with the popularization of new energy vehicles, modal shift patterns need to be considered more comprehensively in the future. The total amount of FFBS, use efficiency, and operation efficiency will still have an impact on the environmental benefits of FFBS, which is a great test for the government and enterprises. Therefore, it is still necessary to control the delivery of FFBS, reasonably plan the effective parking range of FFBS, improve the service level of FFBS near public transport sites, and introduce incentive measures to improve the proportion of users using FFBS to connect public transport. Future research could analyze measurement of the amount and the implementation of incentive measures, and consider the marginal effect of FFBS on other transport modes to provide more powerful support for the green development of FFBS.

Author Contributions

Conceptualization, R.L., X.M. and Y.J.; methodology, R.L.; formal analysis, R.L., F.Z. and X.M.; investigation, R.L. and X.M.; funding acquisition, Y.J.; writing—original draft preparation, R.L.; writing—review and editing, X.M., F.Z. and Y.J. All authors have read and agreed to the published version of the manuscript.

Funding

This research was funded by the National Key Research and Development Program of China under Grant 2018YFB1600900 and National Demonstration Center for Experimental Road and Traffic Engineering Education (Southeast University).

Institutional Review Board Statement

The study was conducted according to the guidelines of the Declaration of Helsinki and approved by the Institutional Review Board of School of Transportation, Southeast University.

Informed Consent Statement

Informed consent was obtained from all respondents involved in the questionnaire survey.

Data Availability Statement

The raw questionnaire used in this study is available from the corresponding author on request.

Conflicts of Interest

The authors declare no conflict of interest.

References

  1. Yuan, Z.Y.; Li, Z.Y.; Kang, L.P.; Tan, X.Y.; Zhou, X.J.; Li, X.J.; Li, C.; Peng, T.D.; Ou, X.M. A review of low-carbon measurements and transition pathway of transport sector in China. Clim. Change Res. 2021, 17, 27–35. [Google Scholar] [CrossRef]
  2. Wang, H.L.; He, J.K. Peaking rule of CO2 emissions, energy consumption and transport volume in transportation sector. China Popul. Resour. Environ. 2018, 28, 59–65. [Google Scholar] [CrossRef]
  3. Patrão, C.; Moura, P.; Almeida, A.T.d. Review of Smart City Assessment Tools. Smart Cities 2020, 3, 55. [Google Scholar] [CrossRef]
  4. Martins, F.; Patrão, C.; Moura, P.; de Almeida, A.T. A Review of Energy Modeling Tools for Energy Efficiency in Smart Cities. Smart Cities 2021, 4, 75. [Google Scholar] [CrossRef]
  5. Bibri, S.E.; Krogstie, J. Smart sustainable cities of the future: An extensive interdisciplinary literature review. Sustain. Cities Soc. 2017, 31, 183–212. [Google Scholar] [CrossRef]
  6. Shiroishi, Y.; Uchiyama, K.; Suzuki, N. Society 5.0: For Human Security and Well-Being. Computer 2018, 51, 91–95. [Google Scholar] [CrossRef]
  7. Olariu, S. A Survey of Vehicular Cloud Research: Trends, Applications and Challenges. IEEE Trans. Intell. Transp. Syst. 2020, 21, 2648–2663. [Google Scholar] [CrossRef]
  8. Chourabi, H.; Nam, T.; Walker, S.; Gil-Garcia, J.R.; Mellouli, S.; Nahon, K.; Pardo, T.A.; Scholl, H.J. Understanding Smart Cities: An Integrative Framework. In Proceedings of the 2012 45th Hawaii International Conference on System Sciences, Maui, HI, USA, 4–7 January 2012; pp. 2289–2297. [Google Scholar]
  9. Olariu, S.; Popescu, D.C. SEE-TREND: SEcurE Traffic-Related EveNt Detection in Smart Communities. Sensors 2021, 21, 7652. [Google Scholar] [CrossRef]
  10. Moradbeikie, A.; Keshavarz, A.; Rostami, H.; Paiva, S.; Lopes, S.I. GNSS-Free Outdoor Localization Techniques for Resource-Constrained IoT Architectures: A Literature Review. Appl. Sci. 2021, 11, 793. [Google Scholar] [CrossRef]
  11. Ligarski, M.J.; Wolny, M. Quality of Life Surveys as a Method of Obtaining Data for Sustainable City Development—Results of Empirical Research. Energies 2021, 14, 7592. [Google Scholar] [CrossRef]
  12. Cerutti, P.S.; Martins, R.D.; Macke, J.; Sarate, J.A.R. “Green, but not as green as that”: An analysis of a Brazilian bike-sharing system. J. Clean. Prod. 2019, 217, 185–193. [Google Scholar] [CrossRef]
  13. Nam, T.; Pardo, T.A. Conceptualizing smart city with dimensions of technology, people, and institutions. In Proceedings of the 12th Annual International Digital Government Research Conference: Digital Government Innovation in Challenging Times, College Park, MD, USA, 12–15 June 2011; pp. 282–291. [Google Scholar]
  14. Arena, M.; Cheli, F.; Zaninelli, D.; Capasso, A.; Lamedica, R.; Piccolo, A. Smart Mobility for Sustainability. In Proceedings of the AEIT Annual Conference 2013, Palermo, Italy, 3–5 October 2013; pp. 1–6. [Google Scholar]
  15. Mi, Z.; Coffman, D.M. The sharing economy promotes sustainable societies. Nat. Commun. 2019, 10, 1214. [Google Scholar] [CrossRef] [PubMed] [Green Version]
  16. Enochsson, L.; Voytenko Palgan, Y.; Plepys, A.; Mont, O. Impacts of the Sharing Economy on Urban Sustainability: The Perceptions of Municipal Governments and Sharing Organisations. Sustainability 2021, 13, 4213. [Google Scholar] [CrossRef]
  17. Shaheen, S.A.; Guzman, S.; Zhang, H. Bikesharing in Europe, the Americas, and Asia:Past, Present, and Future. Transp. Res. Rec. 2010, 2143, 159–167. [Google Scholar] [CrossRef] [Green Version]
  18. Ma, X.; Ji, Y.; Yuan, Y.; Van Oort, N.; Jin, Y.; Hoogendoorn, S. A comparison in travel patterns and determinants of user demand between docked and dockless bike-sharing systems using multi-sourced data. Transp. Res. Part A Policy Pract. 2020, 139, 148–173. [Google Scholar] [CrossRef]
  19. Luo, H.; Kou, Z.; Zhao, F.; Cai, H. Comparative life cycle assessment of station-based and dock-less bike sharing systems. Resour. Conserv. Recycl. 2019, 146, 180–189. [Google Scholar] [CrossRef]
  20. Ji, Y.; Ma, X.; He, M.; Jin, Y.; Yuan, Y. Comparison of usage regularity and its determinants between docked and dockless bike-sharing systems: A case study in Nanjing, China. J. Clean. Prod. 2020, 255, 120110. [Google Scholar] [CrossRef]
  21. Risimati, B.; Gumbo, T.; Chakwizira, J. Spatial Integration of Non-Motorized Transport and Urban Public Transport Infrastructure: A Case of Johannesburg. Sustainability 2021, 13, 1461. [Google Scholar] [CrossRef]
  22. Boulange, C.; Gunn, L.; Giles-Corti, B.; Mavoa, S.; Pettit, C.; Badland, H. Examining associations between urban design attributes and transport mode choice for walking, cycling, public transport and private motor vehicle trips. J. Transp. Health 2017, 6, 155–166. [Google Scholar] [CrossRef]
  23. Arroub, A.; Zahi, B.; Sabir, E.; Sadik, M. A literature review on Smart Cities: Paradigms, opportunities and open problems. In Proceedings of the 2016 International Conference on Wireless Networks and Mobile Communications (WINCOM), Fez, Morocco, 26–29 October 2016; pp. 180–186. [Google Scholar]
  24. Luo, H.; Zhao, F.; Chen, W.-Q.; Cai, H. Optimizing bike sharing systems from the life cycle greenhouse gas emissions perspective. Transp. Res. Part C Emerg. Technol. 2020, 117, 102705. [Google Scholar] [CrossRef]
  25. Chenyan, Z. Research on the coopetition relationship between Public bus and Bike sharing and policy effect: Based on travel mode choice. Master’s Thesis, Beijing Jiaotong University, Beijing, China, 2020. [Google Scholar]
  26. Ma, L.; Zhang, X.; Ding, X.; Wang, G. Bike sharing and users’ subjective well-being: An empirical study in China. Transp. Res. Part A Policy Pract. 2018, 118, 14–24. [Google Scholar] [CrossRef]
  27. De Chardon, C.M. The contradictions of bike-share benefits, purposes and outcomes. Transp. Res. Part A Policy Pract. 2019, 121, 401–419. [Google Scholar] [CrossRef]
  28. United Nations. United Nations Sustainable Development Goals. Available online: https://www.un.org/sustainabledevelopment/ (accessed on 19 November 2021).
  29. Jie, W. Study on the Influence of Bike-sharing on Carbon Emissions in Traffic Field and its Policy Implications. Master’s Thesis, Beijing University of Civil Engineering and Architecture, Beijing, China, 2019. [Google Scholar]
  30. Zhang, Y.; Mi, Z. Environmental benefits of bike sharing: A big data-based analysis. Appl. Energy 2018, 220, 296–301. [Google Scholar] [CrossRef]
  31. Anderson, N.A. Portland Bicycle Share Health Impact Assessment. 2015. Available online: https://digitalcommons.usm.maine.edu/cgi/viewcontent.cgi?article=1108&context=muskie_capstones (accessed on 5 May 2021).
  32. Shaheen, S.; Martin, E.; Cohen, A. Public Bikesharing and Modal Shift Behavior: A Comparative Study of Early Bikesharing Systems in North America. Int. J. Transp. 2013, 1, 35–54. [Google Scholar] [CrossRef]
  33. Fan, A.; Chen, X.; Wan, T. How Have Travelers Changed Mode Choices for First/Last Mile Trips after the Introduction of Bicycle-Sharing Systems: An Empirical Study in Beijing, China. J. Adv. Transp. 2019, 2019, 5426080. [Google Scholar] [CrossRef] [Green Version]
  34. Li, P.; Zhao, P.; Brand, C. Future energy use and CO2 emissions of urban passenger transport in China: A travel behavior and urban form based approach. Appl. Energy 2018, 211, 820–842. [Google Scholar] [CrossRef]
  35. Rose, E.; Gallivan, F.; Lara, L. Survey-Based Evaluation of Bike-to-Work Day in the San Francisco Bay Area. In Proceedings of the Transportation Research Board 95th Annual Meeting, Washington, DC, USA, 10–14 January 2016. [Google Scholar]
  36. Wang, Z.; Xue, M.; Zhao, Y.; Zhang, B. Trade-off between environmental benefits and time costs for public bicycles: An empirical analysis using streaming data in China. Sci. Total Environ. 2020, 715, 136847. [Google Scholar] [CrossRef]
  37. Kou, Z.; Wang, X.; Chiu, S.F.; Cai, H. Quantifying greenhouse gas emissions reduction from bike share systems: A model considering real-world trips and transportation mode choice patterns. Resour. Conserv. Recycl. 2020, 153, 104534. [Google Scholar] [CrossRef]
  38. Bonilla-Alicea, R.; Watson, B.C.; Shen, Z.; Tamayo, L.; Telenko, C. Life cycle assessment to quantify the impact of technology improvements in bike: Haring systems. J. Ind. Ecol. 2020, 24, 138–148. [Google Scholar] [CrossRef] [Green Version]
  39. Zheng, F.; Gu, F.; Zhang, W.; Guo, J. Is Bicycle Sharing an Environmental Practice? Evidence from a Life Cycle Assessment Based on Behavioral Surveys. Sustainability 2019, 11, 1550. [Google Scholar] [CrossRef] [Green Version]
  40. Chen, J.; Zhou, D.; Zhao, Y.; Wu, B.; Wu, T. Life cycle carbon dioxide emissions of bike sharing in China: Production, operation, and recycling. Resour. Conserv. Recycl. 2020, 162, 105011. [Google Scholar] [CrossRef]
  41. Nanjing Transport Bureau. Report on Business Service Evaluation of Free-floating Bike Sharing Enterprises in the First Half of 2020. Available online: http://jtj.nanjing.gov.cn/njsjtysj/202012/t20201204_2742897.html (accessed on 30 June 2021).
  42. Nanjing Planning Bureau. Annual Report of Nanjing Traffic Development 2018; Nanjing Planning Bureau: Nanjing, China, 2018. [Google Scholar]
  43. Southeast University. Research on Development of Free-Floating Bike Sharing in Jiangsu Province; Southeast University: Nanjing, China, 2017. [Google Scholar]
  44. De Bortoli, A.; Christoforou, Z. Consequential LCA for territorial and multimodal transportation policies: Method and application to the free-floating e-scooter disruption in Paris. J. Clean. Prod. 2020, 273. [Google Scholar] [CrossRef]
  45. Niu, T. Development of High-Resolution Road Vehicle Emission Inventory for Nanjing Based on Intelligent Transportation Big Data. Master’s Thesis, Tsinghua University, Beijing, China, 2017. [Google Scholar]
  46. Liu, S. Quantitative Analysis of Social Benefits of Nanjing Metro Line 4. Logist. Enginering Manag. 2020, 42, 130–132. [Google Scholar] [CrossRef]
  47. Didi Development Research Institute, D.C. Didi Platform Green Transport White Paper 2020. 2020. Available online: https://figshare.com/articles/book/Didi_Platform_Green_Transport_White_Paper_2020_pdf/17056415 (accessed on 8 May 2021).
  48. Haupt, M.; Kägi, T.; Hellweg, S. Life cycle inventories of waste management processes. Data Brief 2018, 19, 1441–1457. [Google Scholar] [CrossRef]
  49. Park, C.; Sohn, S.Y. An optimization approach for the placement of bicycle-sharing stations to reduce short car trips: An application to the city of Seoul. Transp. Res. Part A Policy Pract. 2017, 105, 154–166. [Google Scholar] [CrossRef]
  50. Lin, J.R.; Yang, T.H. Strategic design of public bicycle sharing systems with service level constraints. Transp. Res. Part E Logist. Transp. Rev. 2011, 47, 284–294. [Google Scholar] [CrossRef]
  51. Braun, L.M.; Rodriguez, D.A.; Cole-Hunter, T.; Ambros, A.; Donaire-Gonzalez, D.; Jerrett, M.; Mendez, M.A.; Nieuwenhuijsen, M.J.; de Nazelle, A. Short-term planning and policy interventions to promote cycling in urban centers: Findings from a commute mode choice analysis in Barcelona, Spain. Transp. Res. Part A Policy Pract. 2016, 89, 164–183. [Google Scholar] [CrossRef] [Green Version]
Figure 1. System boundary of the free-floating bike sharing system.
Applsci 11 11307 g001
Figure 2. The GHG emission of different transport modes during the use phase.
Applsci 11 11307 g002
Figure 3. The proportion of different modes if FFBS is not available. (a) Directly used for a short-distance trip. (b) Connecting with bus or metro. PB-BM refers to the private bike connected to the bus or metro, SBBS-BM refers to the station-based bike sharing connected to the bus or metro, PC-BM refers to the private car connected to the bus or metro, TC-BM refers to the taxi/car-hailing connected to the bus or metro.
Applsci 11 11307 g003
Figure 4. Equilibrium point of FFBS.
Applsci 11 11307 g004
Table 1. Types and characteristics of dispatching vehicles.
Small TruckIveco VehicleThree-Wheel Electric Vehicle
Number of single-load50–6020–2510–15
Daily average scheduling distance (km)80–12060–80without limitation
Daily average scheduling times4–55–710
Table 2. Equivalent frequency range and annual average number of FFBS ride.
FFES Usage Frequency RangeAnnual Average Number of FFBS RideExplanation
Less than once a week15
Once a week52
Two to three times a week1302.5 times a week, every week for the year
Four to five times a week2344.5 times a week, every week for the year
More than 5 times a week3126 times a week, multiplied by 52 weeks
Table 3. Demographics and usage characteristics of sample for Pattern 1.
Trip PurposeIncome Per YearPersonally Owned Means of Transport
Commuting trip34.20%<80,00063.44%private bike29.48%
Leisure trip31.20%80,000–160,00031.37%electric bicycle61.08%
Return trip6.80%>160,0005.19%private car57.78%
Elasticity trip27.80%
AgeUse frequency per weekCycling distance using free-floating bike sharing
12–189.20%Less than once56.84%<1 km29.25%
19–2638.68%Once14.15%1–2 km32.31%
27–3423.35%Two to three times16.98%2–5 km31.37%
34–4419.10%Four to five times6.84%5–10 km6.60%
45–609.67%More than 5 times5.19%>10 km0.47%
>600.00%
Table 4. Demographics and usage characteristics of sample for Pattern 2.
Trip PurposeIncome Per YearPersonally Owned Means of TransportMode of Transport Connected to FFBS
Commuting trip49.90%<80,00049.10%private bike40.36%Bus25.45%
Leisure trip28.50%80,000–160,00042.93%electric bike69.92%metro74.55%
Return trip8.70%>160,0007.97%private car74.81%
Elasticity trip12.90%
AgeUse frequency per weekCycling distance using free-floating bike sharingTrip time using bus or metro
12–182.06%Less than once29.82%<1 km12.60%<5 min2.06%
19–2645.76%Once15.94%1–2 km60.41%5–10 min18.25%
27–3433.93%2 to 3 times35.22%2–5 km26.22%10–20 min33.42%
34–4413.88%Four to five times10.03%5–10 km0.77%20–30 min26.99%
45–604.11%More than 5 times9.00%>10 km0.00%30–40 min13.11%
>600.26% 40–50 min4.11%
50–60 min1.54%
>60 min0.51%
Publisher’s Note: MDPI stays neutral with regard to jurisdictional claims in published maps and institutional affiliations.

