
MiR-486-3p and MiR-938—Important Inhibitors of Pacemaking Ion Channels and/or Markers of Immune Cells

 , , and
Abstract
:1. Introduction
2. Materials and Methods
2.1. MiRNAs
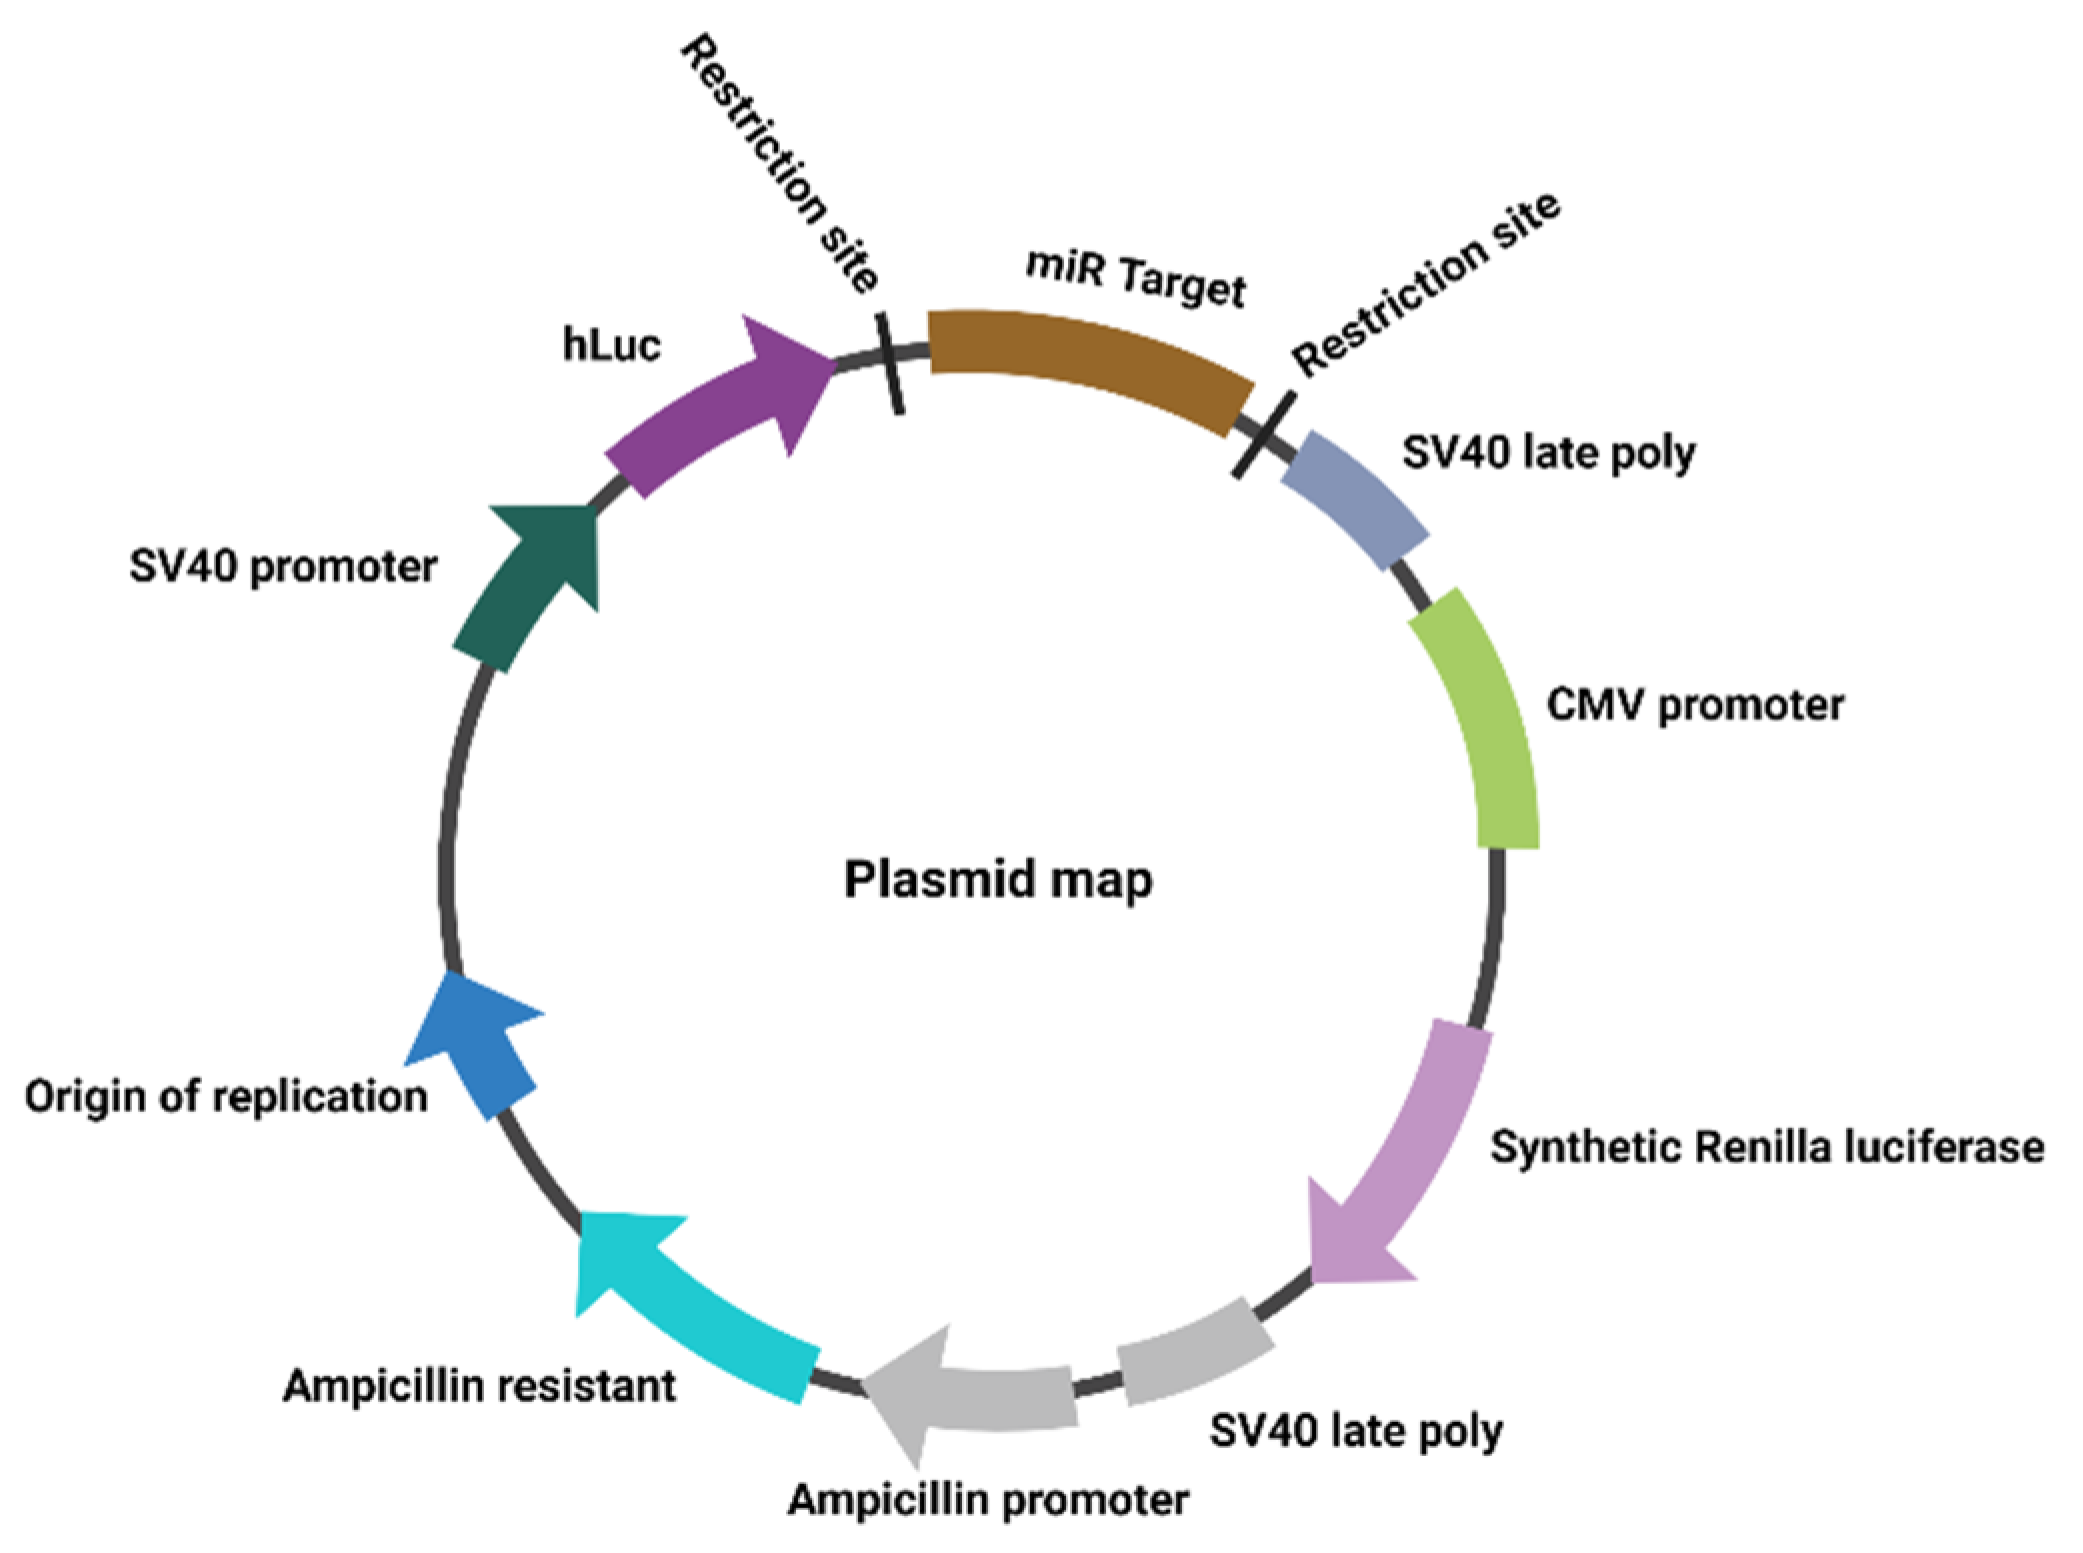
2.2. Plasmids
2.3. Plasmid Amplification
2.4. Luciferase Reporter Gene Assay
2.5. Statistical Analysis
2.6. Binding Sites Prediction
3. Results
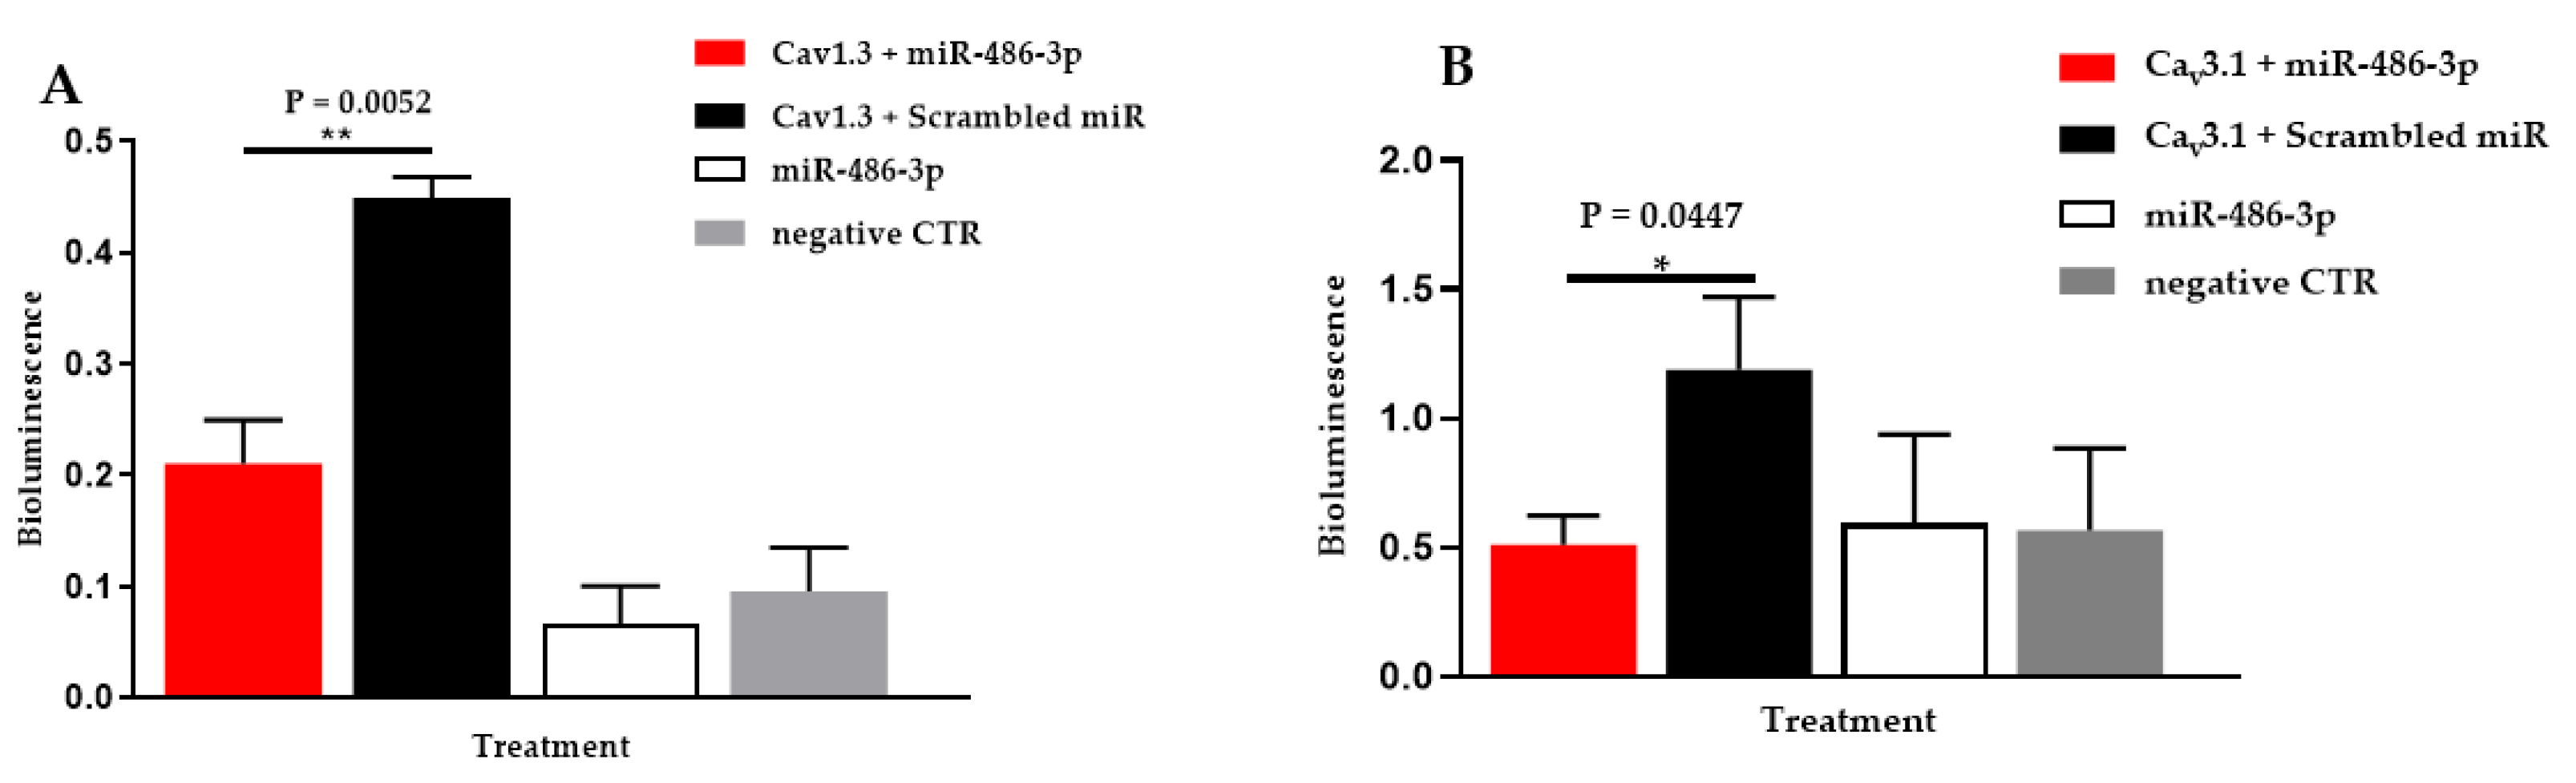
3.1. Hsa-miR-486-3p Significantly Downregulates Hsa-Cav1.3
3.2. Hsa-miR-486-3p Significantly Downregulates Hsa-Cav3.1
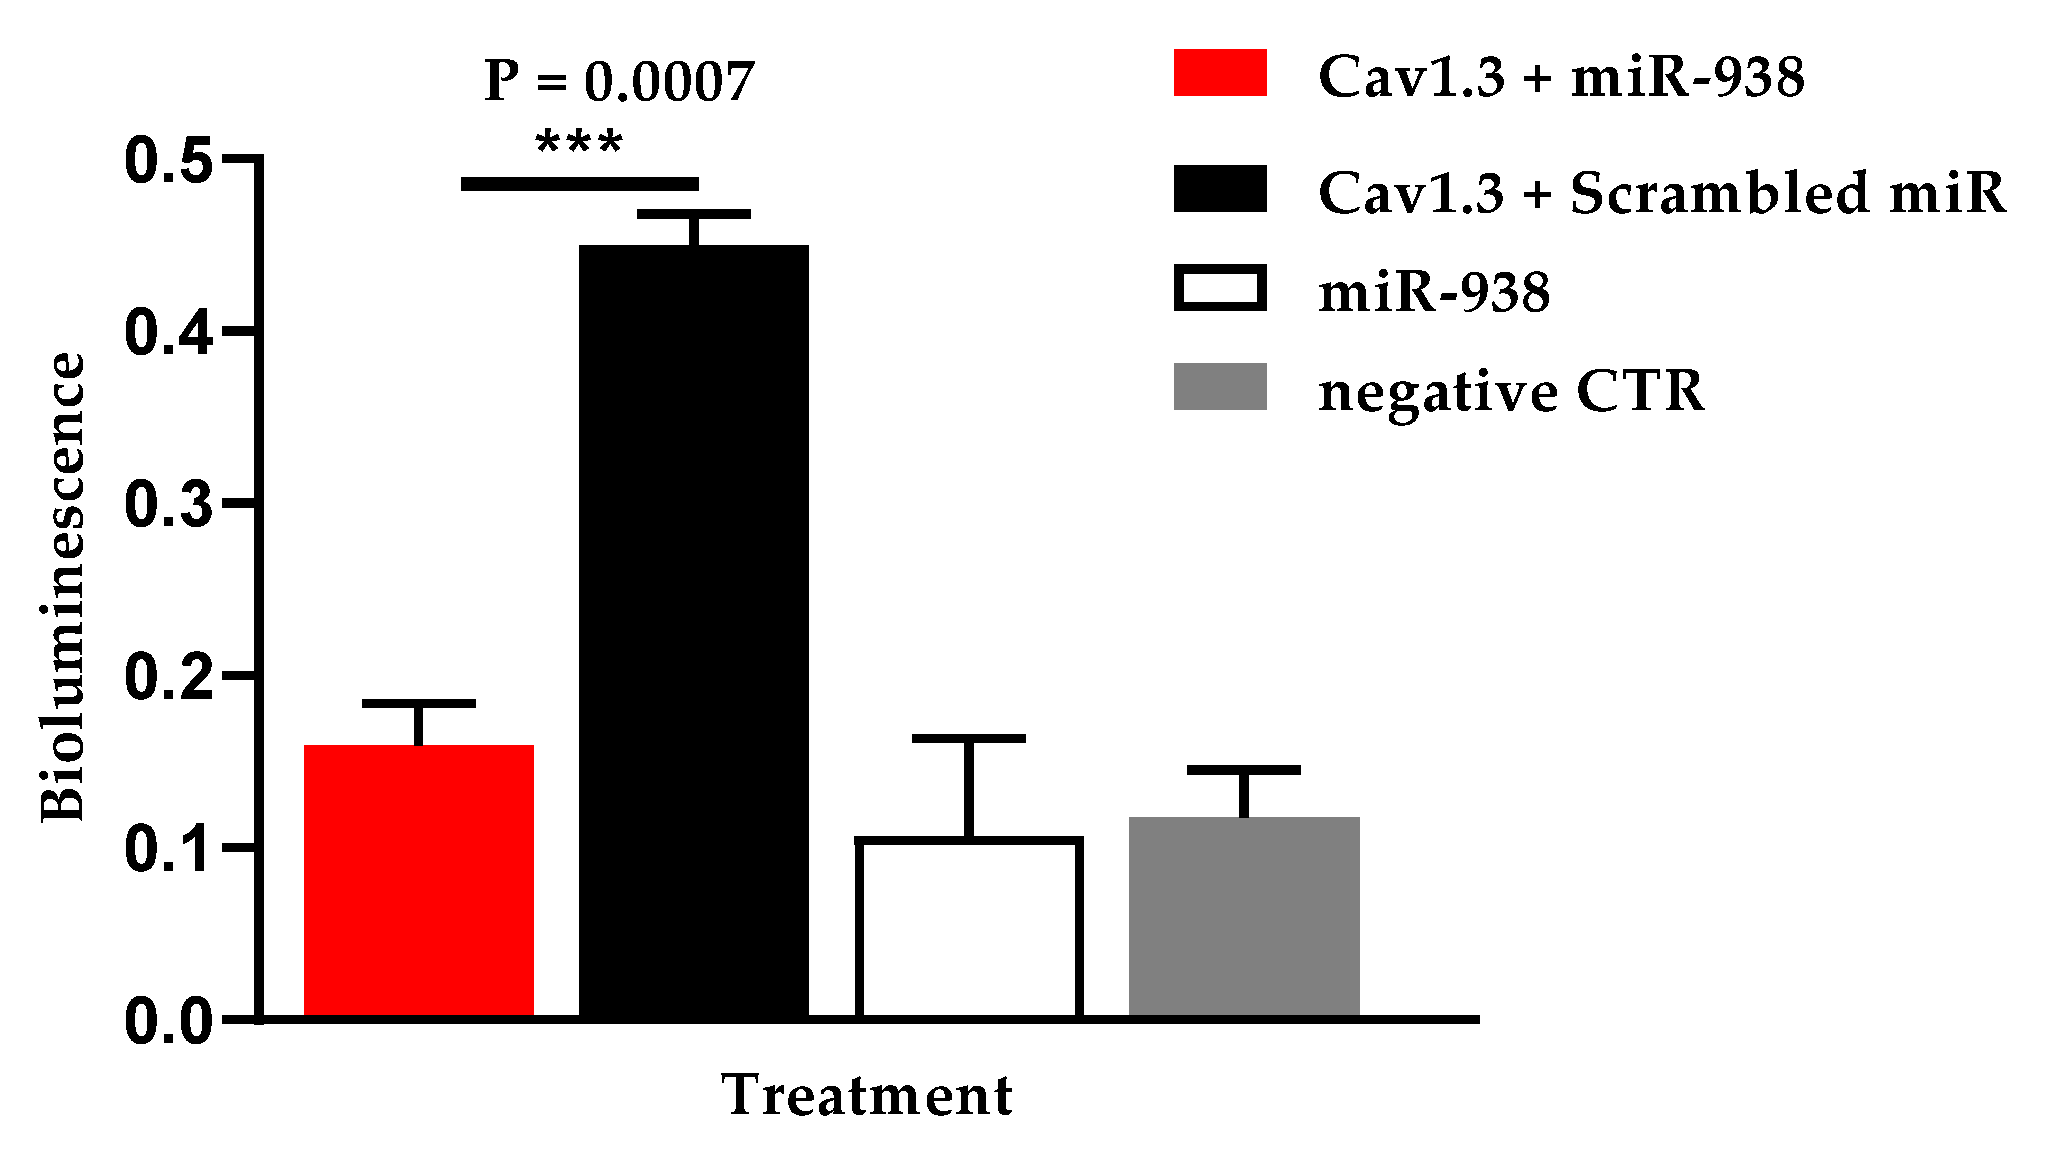
3.3. Hsa-miR-938 Significantly Downregulates Hsa-Cav1.3
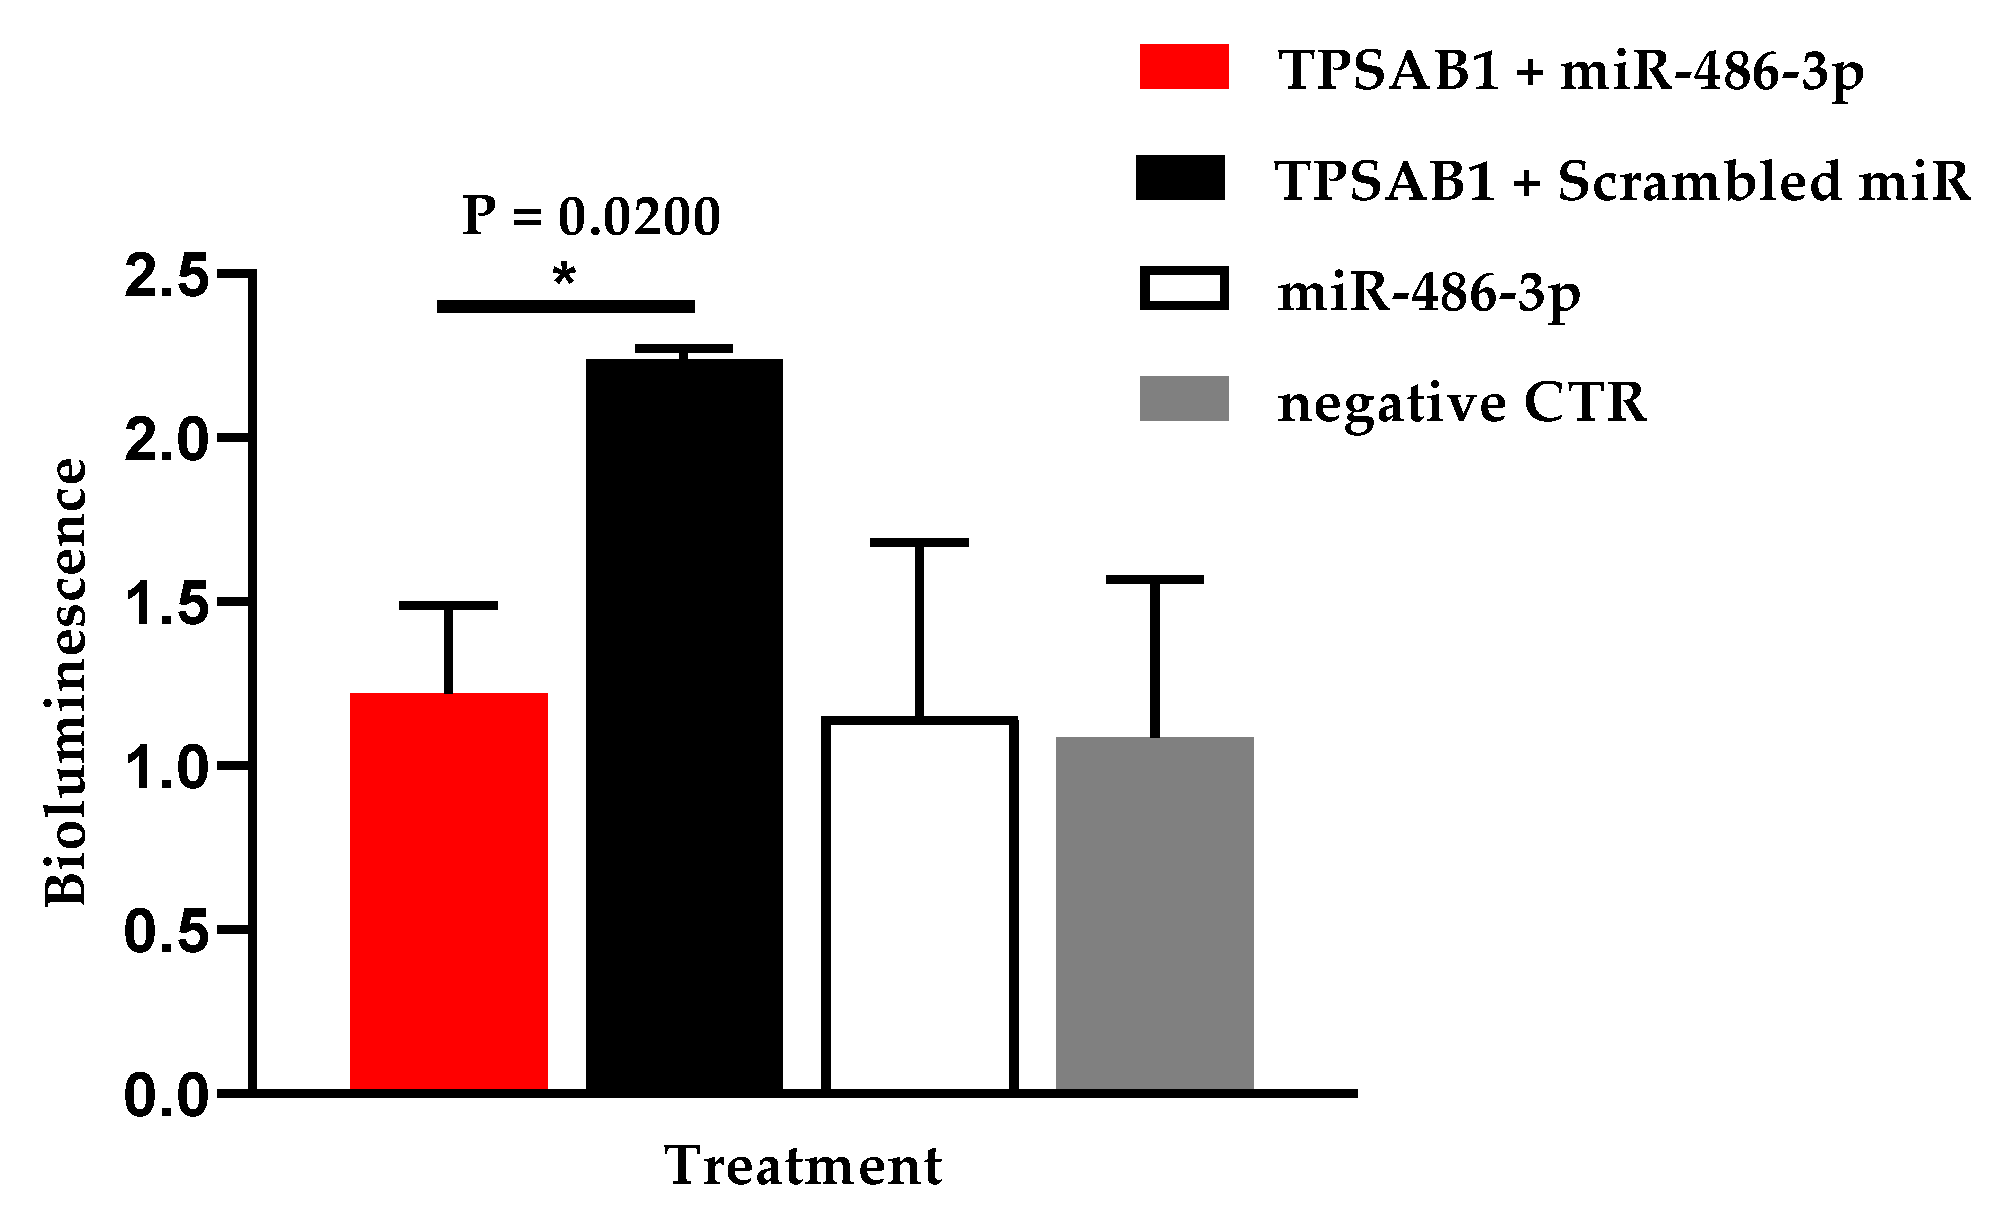
3.4. Hsa-miR-486-3p Significantly Downregulates Hsa-TPSAB1
4. Discussion
4.1. Hsa-miR-486-3p
4.2. Hsa-Cav1.3 and Hsa-miR-486-3p
4.3. Hsa-Cav3.1 and Hsa-miR-486-3p
4.4. Hsa-TPSAB1 and Hsa-miR-486-3p
4.5. Hsa-miR-938
5. Conclusions
Author Contributions
Funding
Data Availability Statement
Acknowledgments
Conflicts of Interest
References
- Chandler, N.J.; Greener, I.D.; Tellez, J.O.; Inada, S.; Musa, H.; Molenaar, P.; DiFrancesco, D.; Baruscotti, M.; Longhi, R.; Anderson, R.H.; et al. Molecular architecture of the human sinus node insights into the function of the cardiac pacemaker. Circulation 2009, 119, 1562–1575. [Google Scholar] [CrossRef] [Green Version]
- Stephenson, S.R.; Atkinson, A.; Kottas, P.; Perde, F.; Jafarzadeh, F.; Bateman, M.; Iaizzo, P.A.; Zhao, J.; Zhang, H.; Anderson, R.H.; et al. High resolution 3-dimensional imaging of the human cardiac conduction system from microanatomy to mathematical modeling. Sci. Rep. 2017, 7, 1–13. [Google Scholar] [CrossRef] [PubMed] [Green Version]
- Dobrzynski, H.; Anderson, R.H.; Atkinson, A.; Borbas, Z.; D’Souza, A.; Fraser, J.F.; Inada, S.; Logantha, S.J.; Monfredi, O.; Morris, G.; et al. Structure, function and clinical relevance of the cardiac conduction system, including the atrioventricular ring and outflow tract tissues. Pharmacol. Ther. 2013, 139, 260–288. [Google Scholar] [CrossRef] [PubMed]
- Petkova, M.; Atkinson, A.J.; Yanni, J.; Stuart, L.; Aminu, A.J.; Ivanova, A.D.; Pustovit, K.B.; Geragthy, C.; Feather, A.; Li, N.; et al. Identification of Key Small Non-Coding MicroRNAs Controlling Pacemaker Mechanisms in the Human Sinus Node. J. Am. Hear. Assoc. 2020, 9, e016590. [Google Scholar] [CrossRef]
- Zhang, H.; Holden, A.V.; Kodama, I.; Honjo, H.; Lei, M.; Varghese, T.; Boyett, M. Mathematical models of action potentials in the periphery and center of the rabbit sinoatrial node. Am. J. Physiol. Circ. Physiol. 2000, 279, H397–H421. [Google Scholar] [CrossRef]
- Thum, T.; Galuppo, P.; Kneitz, S.; Fiedler, J.; Van Laake, L.; Mummery, C.; Ertl, G.; Bauersachs, J. WITHDRAWN: MicroRNAs in the Human Heart: A Clue to Fetal Gene Reprogramming in Heart Failure. J. Mol. Cell. Cardiol. 2007, 17, 258–267. [Google Scholar] [CrossRef]
- Boettger, T.; Braun, T. A new level of complexity the role of micrornas in cardiovascular development. Circ. Res. 2012, 110, 1000–1013. [Google Scholar] [CrossRef] [Green Version]
- Romaine, S.P.R.; Tomaszewski, M.; Condorelli, G.; Samani, N.J. MicroRNAs in cardiovascular disease: An introduction for clinicians. Heart 2015, 101, 921–928. [Google Scholar] [CrossRef]
- Torrente, A.G.; Mesirca, P.; Neco, P.; Rizzetto, R.; Dubel, S.; Barrere, C.; Sinegger-Brauns, M.; Striessnig, J.; Richard, S.; Nargeot, J.; et al. L-type Cav1.3 channels regulate ryanodine receptor-dependent Ca2+release during sino-atrial node pacemaker activity. Cardiovasc. Res. 2016, 109, 451–461. [Google Scholar] [CrossRef] [Green Version]
- Aminu, A.J.; Petkova, M.; Atkinson, A.J.; Yanni, J.; Morris, A.D.; Simms, R.T.; Chen, W.; Yin, Z.; Kuniewicz, M.; Holda, M.K.; et al. Further insights into the molecular complexity of the human sinus node—The role of ‘novel’ transcription factors and microRNAs. Prog. Biophys. Mol. Biol. 2021, 166, 86–104. [Google Scholar] [CrossRef]
- Riolo, G.; Cantara, S.; Marzocchi, C.; Ricci, C. miRNA Targets: From Prediction Tools to Experimental Validation. Methods Protoc. 2020, 4, 1. [Google Scholar] [CrossRef] [PubMed]
- Li, N.; Artiga, E.; Kalyanasundaram, A.; Hansen, B.J.; Webb, A.; Pietrzak, M.; Biesiadecki, B.; Whitson, B.; Mokadam, N.A.; Janssen, P.M.L.; et al. Altered microRNA and mRNA profiles during heart failure in the human sinoatrial node. Sci. Rep. 2021, 11, 1–15. [Google Scholar] [CrossRef]
- Hsu, A.; Chen, S.-J.; Chang, Y.-S.; Chen, H.-C.; Chu, P.-H. Systemic Approach to Identify Serum microRNAs as Potential Biomarkers for Acute Myocardial Infarction. BioMed Res. Int. 2014, 2014, 418628. [Google Scholar] [CrossRef] [PubMed]
- Zhang, R.; Lan, C.; Pei, H.; Duan, G.; Huang, L.; Li, L. Expression of circulating miR-486 and miR-150 in patients with acute myocardial infarction. BMC Cardiovasc. Disord. 2015, 15, 51. [Google Scholar] [CrossRef] [PubMed] [Green Version]
- Lange, S.; Banerjee, I.; Carrion, K.; Serrano, R.; Habich, L.; Kameny, R.; Lengenfelder, L.; Dalton, N.; Meili, R.; Börgeson, E.; et al. miR-486 is modulated by stretch and increases ventricular growth. JCI Insight 2019, 4, 125507. [Google Scholar] [CrossRef]
- Mukai, N.; Nakayama, Y.; Murakami, S.; Tanahashi, T.; I Sessler, D.; Ishii, S.; Ogawa, S.; Tokuhira, N.; Mizobe, T.; Sawa, T.; et al. Potential contribution of erythrocyte microRNA to secondary erythrocytosis and thrombocytopenia in congenital heart disease. Pediatr. Res. 2018, 83, 866–873. [Google Scholar] [CrossRef] [Green Version]
- Hulsmans, M.; Clauss, S.; Xiao, L.; Aguirre, A.D.; King, K.R.; Hanley, A.; Hucker, W.J.; Wülfers, E.M.; Seemann, G.; Courties, G.; et al. Macrophages Facilitate Electrical Conduction in the Heart. Cell 2017, 169, 510–522.e20. [Google Scholar] [CrossRef] [Green Version]
- Amaratunga, E.A.; Corwin, D.S.; Moran, L.; Snyder, R. Bradycardia in Patients With COVID-19: A Calm Before the Storm? Cureus 2020, 12, e8599. [Google Scholar] [CrossRef]
- Capoferri, G.; Osthoff, M.; Egli, A.; Stoeckle, M.; Bassetti, S. Relative bradycardia in patients with COVID-19. Clin. Microbiol. Infect. 2020, 27, 295–296. [Google Scholar] [CrossRef]
- Tang, H.; Gao, Y.; Li, Z.; Miao, Y.; Huang, Z.; Liu, X.; Xie, L.; Li, H.; Wen, W.; Zheng, Y.; et al. The noncoding and coding transcriptional landscape of the peripheral immune response in patients with COVID-19. Clin. Transl. Med. 2020, 10, 200. [Google Scholar] [CrossRef]
- Platzer, J.; Engel, J.; Schrott-Fischer, A.; Stephan, K.; Bova, S.; Chen, H.; Zheng, H.; Striessnig, J. Congenital Deafness and Sinoatrial Node Dysfunction in Mice Lacking Class D L-Type Ca2+ Channels. Cell 2000, 102, 89–97. [Google Scholar] [CrossRef] [Green Version]
- Zhang, Z.; Xu, Y.; Song, H.; Rodriguez, J.; Tuteja, D.; Namkung, Y.; Shin, H.-S.; Chiamvimonvat, N. Functional roles of Cav1.3 (alpha1D 3) calcium channel in sinoatrial nodes. Circ. Res. 2002, 90, 981–987. [Google Scholar] [CrossRef] [PubMed] [Green Version]
- Mangoni, M.E.; Traboulsie, A.; Leoni, A.L.; Couette, B.; Marger, L.; Le Quang, K.; Kupfer, E.; Cohen-Solal, A.; Vilar, J.; Shin, H.-S. Bradycardia and slowing of the atrioventricular conduction in mice lacking Cav3.1/alpha(1G) T-type calcium channels. Circ. Res. 2006, 98, 1422–1430. [Google Scholar] [CrossRef] [Green Version]
- Zimmer, A.; Bagchi, A.K.; Vinayak, K.; Bello-Klein, A.; Singal, P.K. Innate immune response in the pathogenesis of heart failure in survivors of myocardial infarction. Am. J. Physiol. Circ. Physiol. 2019, 316, H435–H445. [Google Scholar] [CrossRef]
- Swirski, F.K.; Nahrendorf, M. Cardioimmunology: The immune system in cardiac homeostasis and disease. Nat. Rev. Immunol. 2018, 18, 733–744. [Google Scholar] [CrossRef] [PubMed]
- Lazzerini, P.E.; Laghi-Pasini, F.; Boutjdir, M.; Capecchi, P.L. Cardioimmunology of arrhythmias: The role of autoimmune and inflammatory cardiac channelopathies. Nat. Rev. Immunol. 2018, 19, 63–64. [Google Scholar] [CrossRef] [PubMed]
- Lyons, J.; Yu, X.; Hughes, J.D.; Le, Q.T.; Jamil, A.; Bai, Y.; Ho, N.; Zhao, M.; Liu, Y.; O’Connell, M.; et al. Elevated basal serum tryptase identifies a multisystem disorder associated with increased TPSAB1 copy number. Nat. Genet. 2016, 48, 1564–1569. [Google Scholar] [CrossRef]
- Antoniak, S.; Sparkenbaugh, E.M.; Tencati, M.; Rojas, M.; Mackman, N.; Pawlinski, R. Protease activated receptor-2 conrtibutes to heart failure. PLoS ONE 2013, 8, e81733. [Google Scholar] [CrossRef] [Green Version]
- Chen, C.; Darrow, A.L.; Qi, J.S.; D’Andrea, M.R.; Andrade-Gordon, P. A novel serine protease predominantely expressed in macrophages. Biochem. J. 2003, 374, 97–107. [Google Scholar] [CrossRef] [PubMed]
- Hu, Y.-F.; Dawkins, J.F.; Cho, H.C.; Marbán, E.; Cingolani, E. Biological pacemaker created by minimally invasive somatic reprogramming in pigs with complete heart block. Sci. Transl. Med. 2014, 6, 245ra94. [Google Scholar] [CrossRef] [Green Version]
- Li, C.-F.; Li, Y.-C.; Jin, J.-P.; Yan, Z.-K.; Li, D.-D. miR-938 promotes colorectal cancer cell proliferation via targeting tumor suppressor PHLPP2. Eur. J. Pharmacol. 2017, 807, 168–173. [Google Scholar] [CrossRef]
- Wu, Y.; Jia, Z.; Cao, D.; Wang, C.; Wu, X.; You, L.; Wen, S.; Pan, Y.; Cao, X.; Jiang, J. Predictive Value of MiR-219-1, MiR-938, MiR-34b/c, and MiR-218 Polymorphisms for Gastric Cancer Susceptibility and Prognosis. Dis. Markers 2017, 2017, 4731891. [Google Scholar] [CrossRef] [PubMed]
- Cao, Z.; Feng, M.; Yang, G.; Zhang, T. Plasma miRNAs Effectively Distinguish Patients with Pancreatic Cancer from Controls: A Multicenter Study. J. Am. Coll. Surg. 2017, 225, e125. [Google Scholar] [CrossRef] [Green Version]
- Yanni, J.; D’Souza, A.; Wang, Y.; Li, N.; Hansen, B.J.; Zakharkin, S.O.; Smith, M.; Hayward, C.; Whitson, B.A.; Mohler, P.J.; et al. Silencing miR-370-3p rescues funny current and sinus node function in heart failure. Sci. Rep. 2020, 10, 1–23. [Google Scholar] [CrossRef] [PubMed]


| Hsa-miRNA | Hsa-miRNA Sequence | Predicted Target mRNA | Number of Binding Sites for Hsa-miRNA on Hsa-mRNA |
|---|---|---|---|
| Hsa-miR-1-3p | UGGAAUGUAAAGAAGUAUGUAU | HCN1 | 1 |
| HCN4 | 1 | ||
| TBX3 | 1 | ||
| Hsa-miR-30c-5p | UGUAAACAUCCUACACUCUCAGC | HCN1 | 1 |
| HCN4 | 1 | ||
| COL1A1 | 0 | ||
| Hsa-miR-486-3p | CGGGGCAGCUCAGUACAGGAU | HCN1 | 6 |
| HCN4 | 7 | ||
| Cav3.1 | 1 | ||
| Cav1.3 | 6 | ||
| LZTS1 | 12 | ||
| LBH | 1 | ||
| TPSAB1 | 2 | ||
| HLA-DRA | 2 | ||
| CD209 | 1 | ||
| Hsa-miR-133a-3p | UUUGGUCCCCUUCAACCAGCUG | HCN4 | 5 |
| COL1A1 | 1 | ||
| TPSAB1 | 1 | ||
| Hsa-miR-938 | UGCCCUUAAAGGUGAACCCAGU | Cav1.3 | 9 |
| LBH | 1 | ||
| Hsa-miR-429 | UAAUACUGUCUGGUAAAACCGU | TBX18 | 1 |
| Hsa-miR-422a | ACUGGACUUAGGGUCAGAAGGC | TBX3 | 1 |
| Hsa-miRNA | Predicted Target hsa-mRNA | Hsa-miRNA Plus hsa-mRNA Mean ± SEM | Scrambled hsa-miRNA Plus hsa-mRNA Mean ± SEM | Hsa-miRNA No mRNA Mean ± SEM | No hsa-miRNA and No hsa-mRNA (Negative Control) Mean ± SEM |
|---|---|---|---|---|---|
| Hsa-miR-1-3p | HCN1 | 0.789 ± 0.205 | 0.686 ± 0.211 | - | - |
| HCN4 | 0.558 ± 0.144 | 0.422 ± 0.103 | - | - | |
| TBX3 | 0.686 ± 0.244 | 0.586 ± 0.189 | - | - | |
| Hsa-miR-30c-5p | HCN1 | 0.955 ± 0.248 | 0.686 ± 0.211 | - | - |
| HCN4 COL1A1 | 0.689 ± 0.024 0.800 ± 0.232 | 0.422 ± 0.103 0.626 ± 0.292 | - - | - - | |
| Hsa-miR-486-3p | HCN1 | 0.554 ± 0.157 | 0.686 ± 0.211 | 0.593 ± 0.344 | 0.580 ± 0.313 |
| LZTS1 | 0.326 ± 0.178 | 0.556 ± 0.178 | 0.707 ± 0.398 | 0.589 ± 0.310 | |
| LBH | 0.343 ± 0.142 | 0.604 ± 0.228 | 0.7065 ± 0.398 | 0.589 ± 0.310 | |
| HLA-DRA | 0.672 ± 0.228 | 0.944 ± 0.359 | 0.593 ± 0.344 | 0.580 ± 0.313 | |
| Hsa-miR-133a-3p | HCN4 | 0.457 ± 0.111 | 0.422 ± 0.103 | - | - |
| COL1A1 TPSAB1 | 0.334 ± 0.094 0.814 ± 0.300 | 0.542 ± 0.186 0.743 ± 0.372 | 0.255 ± 0.126 0.255 ± 0.126 | 0.666 ± 0.369 0.6666 ± 0.369 | |
| Hsa-miR-938 | LBH | 0.276 ± 0.109 | 0.575 ± 0.190 | 0.081 ± 0.035 | 0.093 ± 0.024 |
| Hsa-miR-429 | TBX18 | 0.593 ± 0.048 | 0.558 ± 0.229 | - | - |
| Hsa-miR-422a | TBX3 | 0.512 ± 0.171 | 0.586 ± 0.179 | - | - |
| Hsa-miRNA | Predicted Target hsa-mRNA | Hsa-miRNA Plus hsa-mRNA Mean ± SEM | Scrambled hsa-miRNA Plus hsa-mRNA Mean ± SEM | Hsa-miRNA No mRNA Mean ± SEM | No hsa-miRNA and No hsa-mRNA (Negative Control) Mean ± SEM |
|---|---|---|---|---|---|
| Hsa-miR-486-3p | Cav3.1 | 0.511 ± 0.111 | 1.188 ± 0.281 | 0.596 ± 0.344 | 0.567 ± 0.318 |
| Cav1.3 | 0.211 ± 0.039 | 0.449 ± 0.019 | 0.057 ± 0.020 | 0.083 ± 0.026 | |
| TPSAB1 | 1.049 ± 0.256 | 2.240 ± 0.032 | 0.593 ± 0.344 | 0.580 ± 0.313 | |
| Hsa-miR-938 | Cav1.3 | 0.159 ± 0.025 | 0.449 ± 0.019 | 0.074 ± 0.020 | 0.087 ± 0.020 |
Publisher’s Note: MDPI stays neutral with regard to jurisdictional claims in published maps and institutional affiliations. |
© 2021 by the authors. Licensee MDPI, Basel, Switzerland. This article is an open access article distributed under the terms and conditions of the Creative Commons Attribution (CC BY) license (https://creativecommons.org/licenses/by/4.0/).
Share and Cite
Aminu, A.J.; Petkova, M.; Chen, W.; Yin, Z.; Kuzmin, V.S.; Atkinson, A.J.; Dobrzynski, H. MiR-486-3p and MiR-938—Important Inhibitors of Pacemaking Ion Channels and/or Markers of Immune Cells. Appl. Sci. 2021, 11, 11366. https://doi.org/10.3390/app112311366
Aminu AJ, Petkova M, Chen W, Yin Z, Kuzmin VS, Atkinson AJ, Dobrzynski H. MiR-486-3p and MiR-938—Important Inhibitors of Pacemaking Ion Channels and/or Markers of Immune Cells. Applied Sciences. 2021; 11(23):11366. https://doi.org/10.3390/app112311366
Chicago/Turabian StyleAminu, Abimbola J, Maria Petkova, Weixuan Chen, Zeyuan Yin, Vlad S Kuzmin, Andrew J Atkinson, and Halina Dobrzynski. 2021. "MiR-486-3p and MiR-938—Important Inhibitors of Pacemaking Ion Channels and/or Markers of Immune Cells" Applied Sciences 11, no. 23: 11366. https://doi.org/10.3390/app112311366
APA StyleAminu, A. J., Petkova, M., Chen, W., Yin, Z., Kuzmin, V. S., Atkinson, A. J., & Dobrzynski, H. (2021). MiR-486-3p and MiR-938—Important Inhibitors of Pacemaking Ion Channels and/or Markers of Immune Cells. Applied Sciences, 11(23), 11366. https://doi.org/10.3390/app112311366