Article

Anisotropic Shear Strength Behavior of Soil–Geogrid Interfaces

1
College of Transportation Engineering, Tongji University, Shanghai 201804, China
2
Key Laboratory of Highway Construction and Maintenance Technology in Loess Region, Shanxi Transportation Technology Research & Development Co., Ltd., Taiyuan 030032, China
3
School of Civil Engineering, Wuhan University, Wuhan 430072, China
4
School of Civil Engineering, Taiyuan University of Technology, Taiyuan 030024, China
5
Engineering Faculty, China University of Geosciences, Wuhan 430074, China
*
Author to whom correspondence should be addressed.
Appl. Sci. 2021, 11(23), 11387; https://doi.org/10.3390/app112311387
Submission received: 31 October 2021 / Revised: 23 November 2021 / Accepted: 28 November 2021 / Published: 1 December 2021
(This article belongs to the Special Issue Advances in Geosynthetics)

Abstract

:
This paper presents an experimental study on the anisotropic shear strength behavior of soil–geogrid interfaces. A new type of interface shear test device was developed, and a series of soil–geogrid interface shear tests were conducted for three different biaxial geogrids and three different triaxial geogrids under the shear directions of 0°, 45° and 90°. Clean fine sand, coarse sand, and gravel were selected as the testing materials to investigate the influence of particle size. The experimental results for the interface shear strength behavior, and the influences of shear direction and particle size are presented and discussed. The results indicate that the interface shear strength under the same normal stress varies with shear direction for all the biaxial and triaxial geogrids investigated, which shows anisotropic shear strength behavior of soil–geogrid interfaces. The soil–biaxial geogrid interfaces show stronger anisotropy than that of the soil–triaxial geogrid interfaces under different shear directions. Particle size has a great influence on the anisotropy shear strength behavior of soil–geogrid interfaces.

1. Introduction

Geogrids have high tensile strength, and are widely used as reinforcements in pavements, embankments, slopes, retaining walls and bridge abutments [1,2,3,4,5,6]. In geogrid-reinforced soil, the geogrid interacts with the surrounding soil through interlocking and friction, causing the tensile stresses to be mobilized in the geogrid, leading to the improved shear strength of geogrid-reinforced soil. Therefore, the shear strength of the soil–geogrid interface plays an important role in the stability of reinforced soil structures and is key to the design of internal stability [7,8].
Extensive experimental research has been conducted to investigate the behavior of soil–geosynthetic interfaces using the pullout test and the direct shear test [9,10,11,12,13,14,15]. Most of the above research focuses on the influences of different soil properties (e.g., type, friction angle, cohesion, gradation, and particle size) and geosynthetic properties (e.g., type, tensile strength, and aperture size) [16,17,18,19,20,21,22,23,24,25,26]. Research has also been conducted on the influences of testing conditions on the shear strength of soil–geosynthetic interfaces, such as loading rate, cyclic loading frequency and displacement. Corresponding experimental results indicate that testing conditions have significant effects on the shear strength of soil–geosynthetic interfaces [11,27,28,29].
The above experimental studies typically considered the shear strength behavior of soil–geogrid interfaces with shear loading applied along a specific direction, such as the machine direction (MD) or cross-machine direction (CMD) for biaxial geogrids and the diagonal direction for triaxial geogrids. However, the loading direction of soil–geogrid interfaces in some field situations may be different from those tested in the standard [30], such as geogrids at the corners of retaining walls or bridge abutments, and may even be uncertain during service life, e.g., geogrids in the pavements under traffic loading; for example, the soil–geogrid interaction for shear loading applied in the MD and CMD of the biaxial geogrid are different [31,32,33]. Therefore, it is important to investigate the influence of shear direction on the shear strength of soil–geogrid interfaces to ensure appropriate and safe design of these reinforced soil structures.
In addition, soil particle size also has a significant effect on the soil–geosynthetic interaction [34,35]. The shear strength of the soil–geosynthetic interface largely depends on the interlocking mechanism between the soil and geosynthetic material, and this interlocking mechanism is significantly affected by particle size [24]. Many studies have analyzed the importance of particle size on the shear strength of soil–geosynthetic interfaces, which is related not only to the type of geosynthetics [35], but also to the ratio of aperture size to average particle size [24,34]. However, the influence of particle size on the shear strength of soil–geogrid interfaces under different shear directions has not been studied. Therefore, the influence of particle size on the anisotropic shear behavior of the soil–geogrid interface remains to be investigated.
The goal of this study is to investigate the influence of shear direction on the shear strength behavior of soil–geogrid interfaces, which could be important for the design of reinforced soil structures. Meanwhile, a new type of interface shear test device that can apply shear loading in different directions was developed to investigate the anisotropic shear strength behavior of soil–geogrid interfaces. To the best of the authors’ knowledge, this is the first apparatus developed for this type of test. A series of interface shear tests were carried out to investigate the influences of shear direction and particle size on the shear strength of the soil–geogrid interface. The experimental results for the shear strength behavior are presented and discussed to provide insights into the design of geogrid-reinforced soil structures.

2. Experimental Program
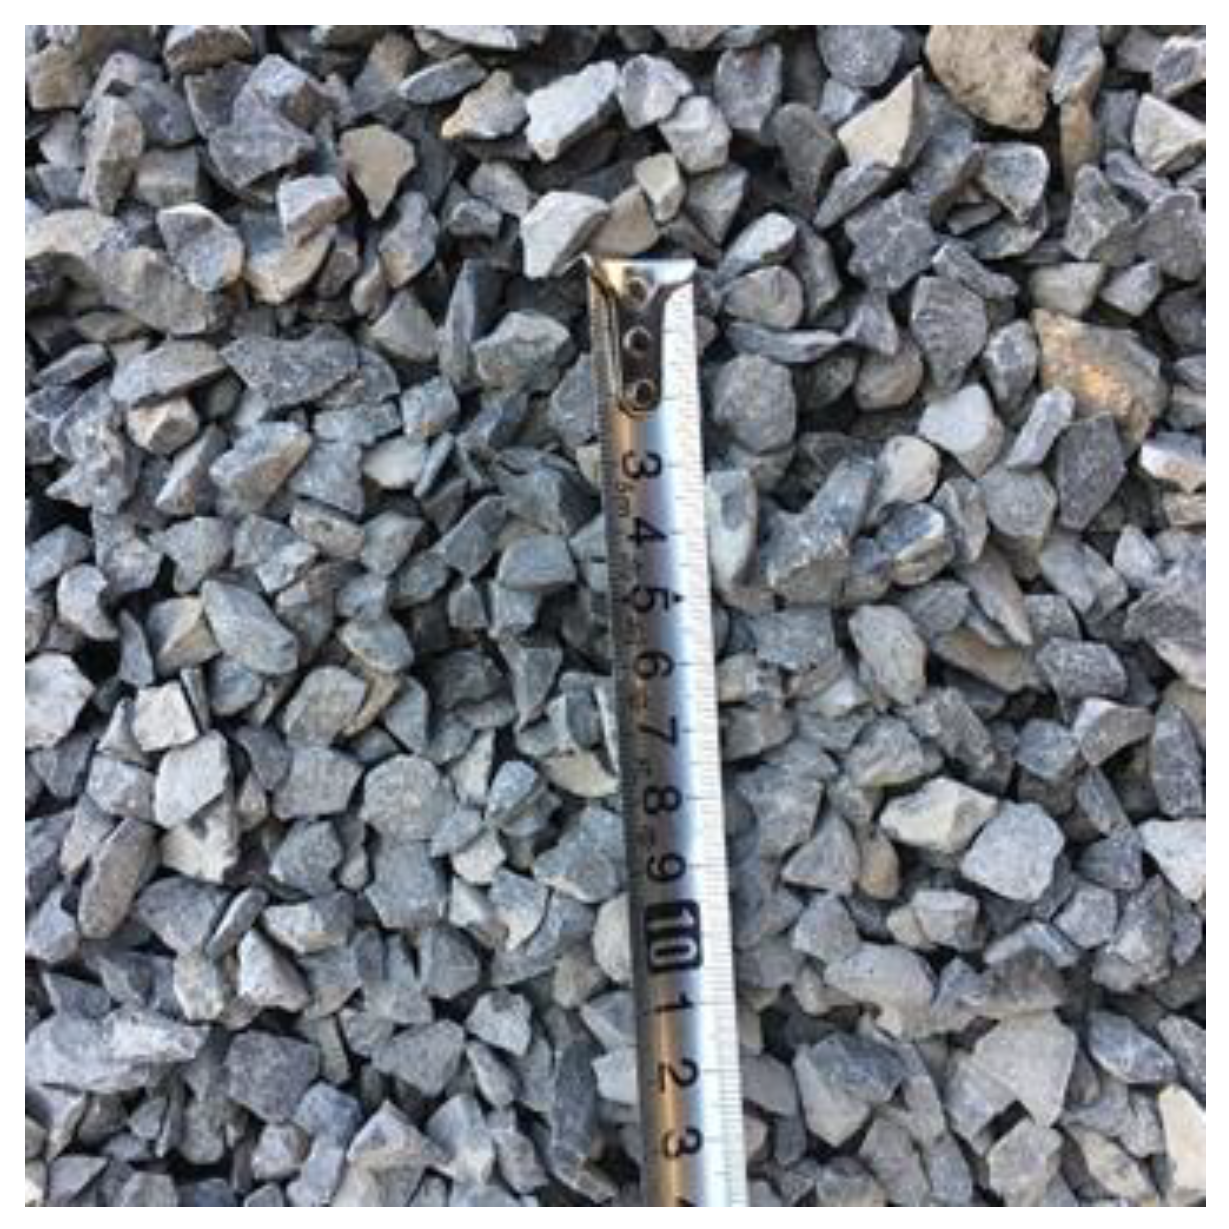
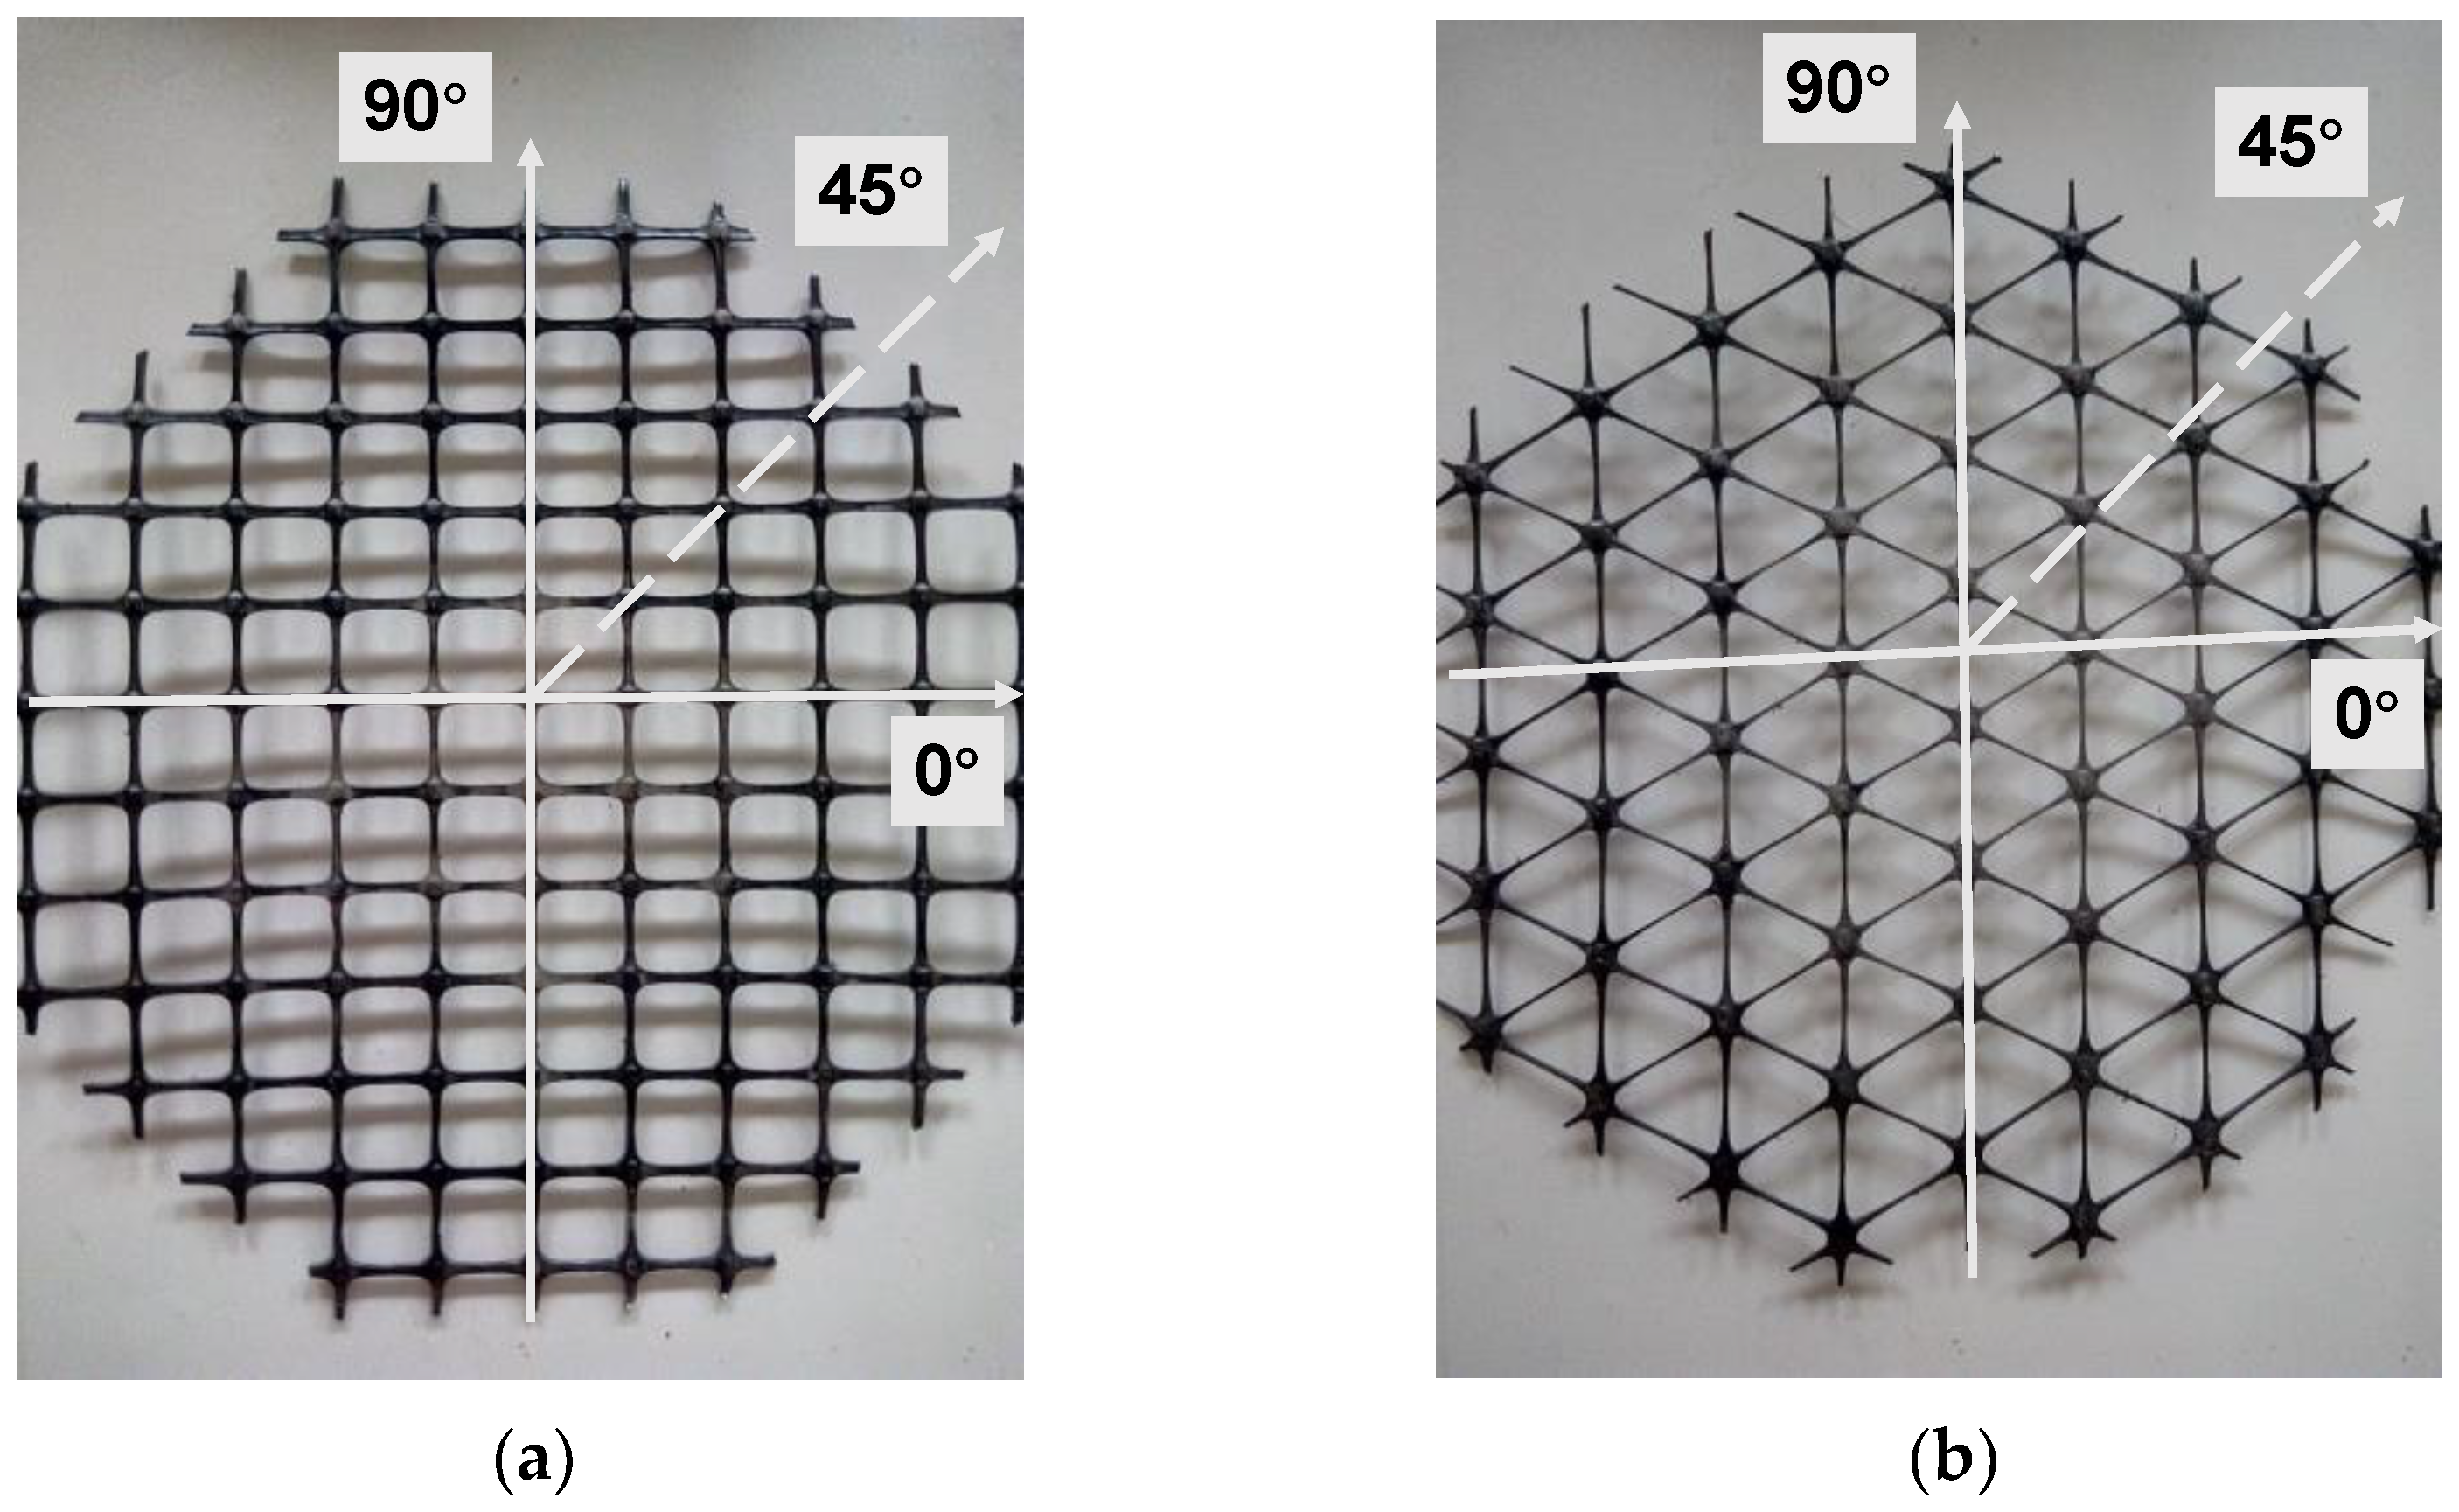
2.1. Materials

Clean fine sand, coarse sand, and gravel were selected as the testing materials in this study. The fine sand particles are uniform, with most of the particle sizes concentrated between 0.2 mm and 0.5 mm. This fine sand is classified as poorly graded sand (SP) according to the Unified Soil Classification System (USCS). The particle sizes of the coarse sand are concentrated between 3 mm and 5 mm, and the particle sizes of the gravel are concentrated between 2.36 mm and 13.2 mm. The fine sand, coarse sand and gravel have friction angles of 28°, 42° and 50°, respectively, based on interpretation of the linear Mohr–Coulomb failure envelope. The friction angles of soil were obtained from direct shear tests. The friction angle of 50 degrees for gravel is at the high end. This is attributed to the strong angularity of the gravel, as shown in Figure 1. Dry soil was used to eliminate the influence of moisture content on the interface characteristics. The soil was compacted in layers using volume control to ensure consistent relative density of 70%. The soil compaction at the top and bottom of the box was kept the same. Interface shearing was applied after the vertical displacement became stable under the applied normal stress.
Three biaxial geogrids (SS20, SS30 and SS40) and three triaxial geogrids (TX150, TX160 and TX170) with different tensile properties were used in the study. The tensile strength values of these geogrids for loading in different directions are shown in Table 1. For both biaxial and triaxial geogrids, tensile strength decreases with the direction of tensile loading, changing from 0° to 45°, and then increases with the direction, changing from 45° to 90°. This indicates that the tensile strength of geogrids is significantly influenced by the direction of tensile loading, and also shows anisotropic behavior in both types of geogrids, especially for the biaxial geogrids.

2.2. Testing Apparatus

An interface shear test apparatus that can apply shear loading in different directions was developed to investigate the anisotropic shear strength behavior of soil–geogrid interfaces in this study. As shown in Figure 2, the anisotropic shear test apparatus consists of a mechanical system, pneumatic system, and electrical control system. The lower shear box has a diameter of 300 mm and a height of 150 mm, and the upper shear box has a diameter of 200 mm and a height of 100 mm. The lower box, which is of larger size, can ensure a constant interface contact area during shearing. Shear displacement would develop along the interface during shearing of the soil–geogrid interface. The gasket between the upper and lower shear boxes ensures that there is no friction between the geogrid specimen and the upper shear box. This apparatus can accommodate circular specimens to ensure consistent shear stress distribution for loading in different directions.

2.3. Testing Procedures

All the biaxial geogrids (SS20, SS30 and SS40) and triaxial geogrids (TX150, TX160 and TX170) were cut into nearly circular specimens with a diameter of 300 mm. Soil was first compacted in the lower shear box, and then the geogrid specimen and gasket were fixed on the lower box in sequence. The upper shear box was then installed on the gasket and filled with soil. The shear displacement was set as 33 mm for the 200 mm diameter upper box to reach a shear strain of 16.5% for the shear plane length. The specimen dimensions were slightly larger than the shear box for the convenience of fixing the geogrid on the shear box. The geogrid was fixed at the elevation of the shear plane and remained fixed during shearing, and the contact area between the geogrid and soil of each test was the same for different shear directions. Direct shear tests on soil–geogrid interfaces were conducted with the shear loading applied horizontally on the lower box at a constant rate of 1 mm/min in the directions of 0°, 45° and 90° (direction indicated in Figure 3), respectively. For each geogrid and shear direction, a series of interface shear tests were performed under the normal stresses of 50 kPa, 100 kPa, 150 kPa and 200 kPa to obtain the failure envelope.

3. Experimental Results

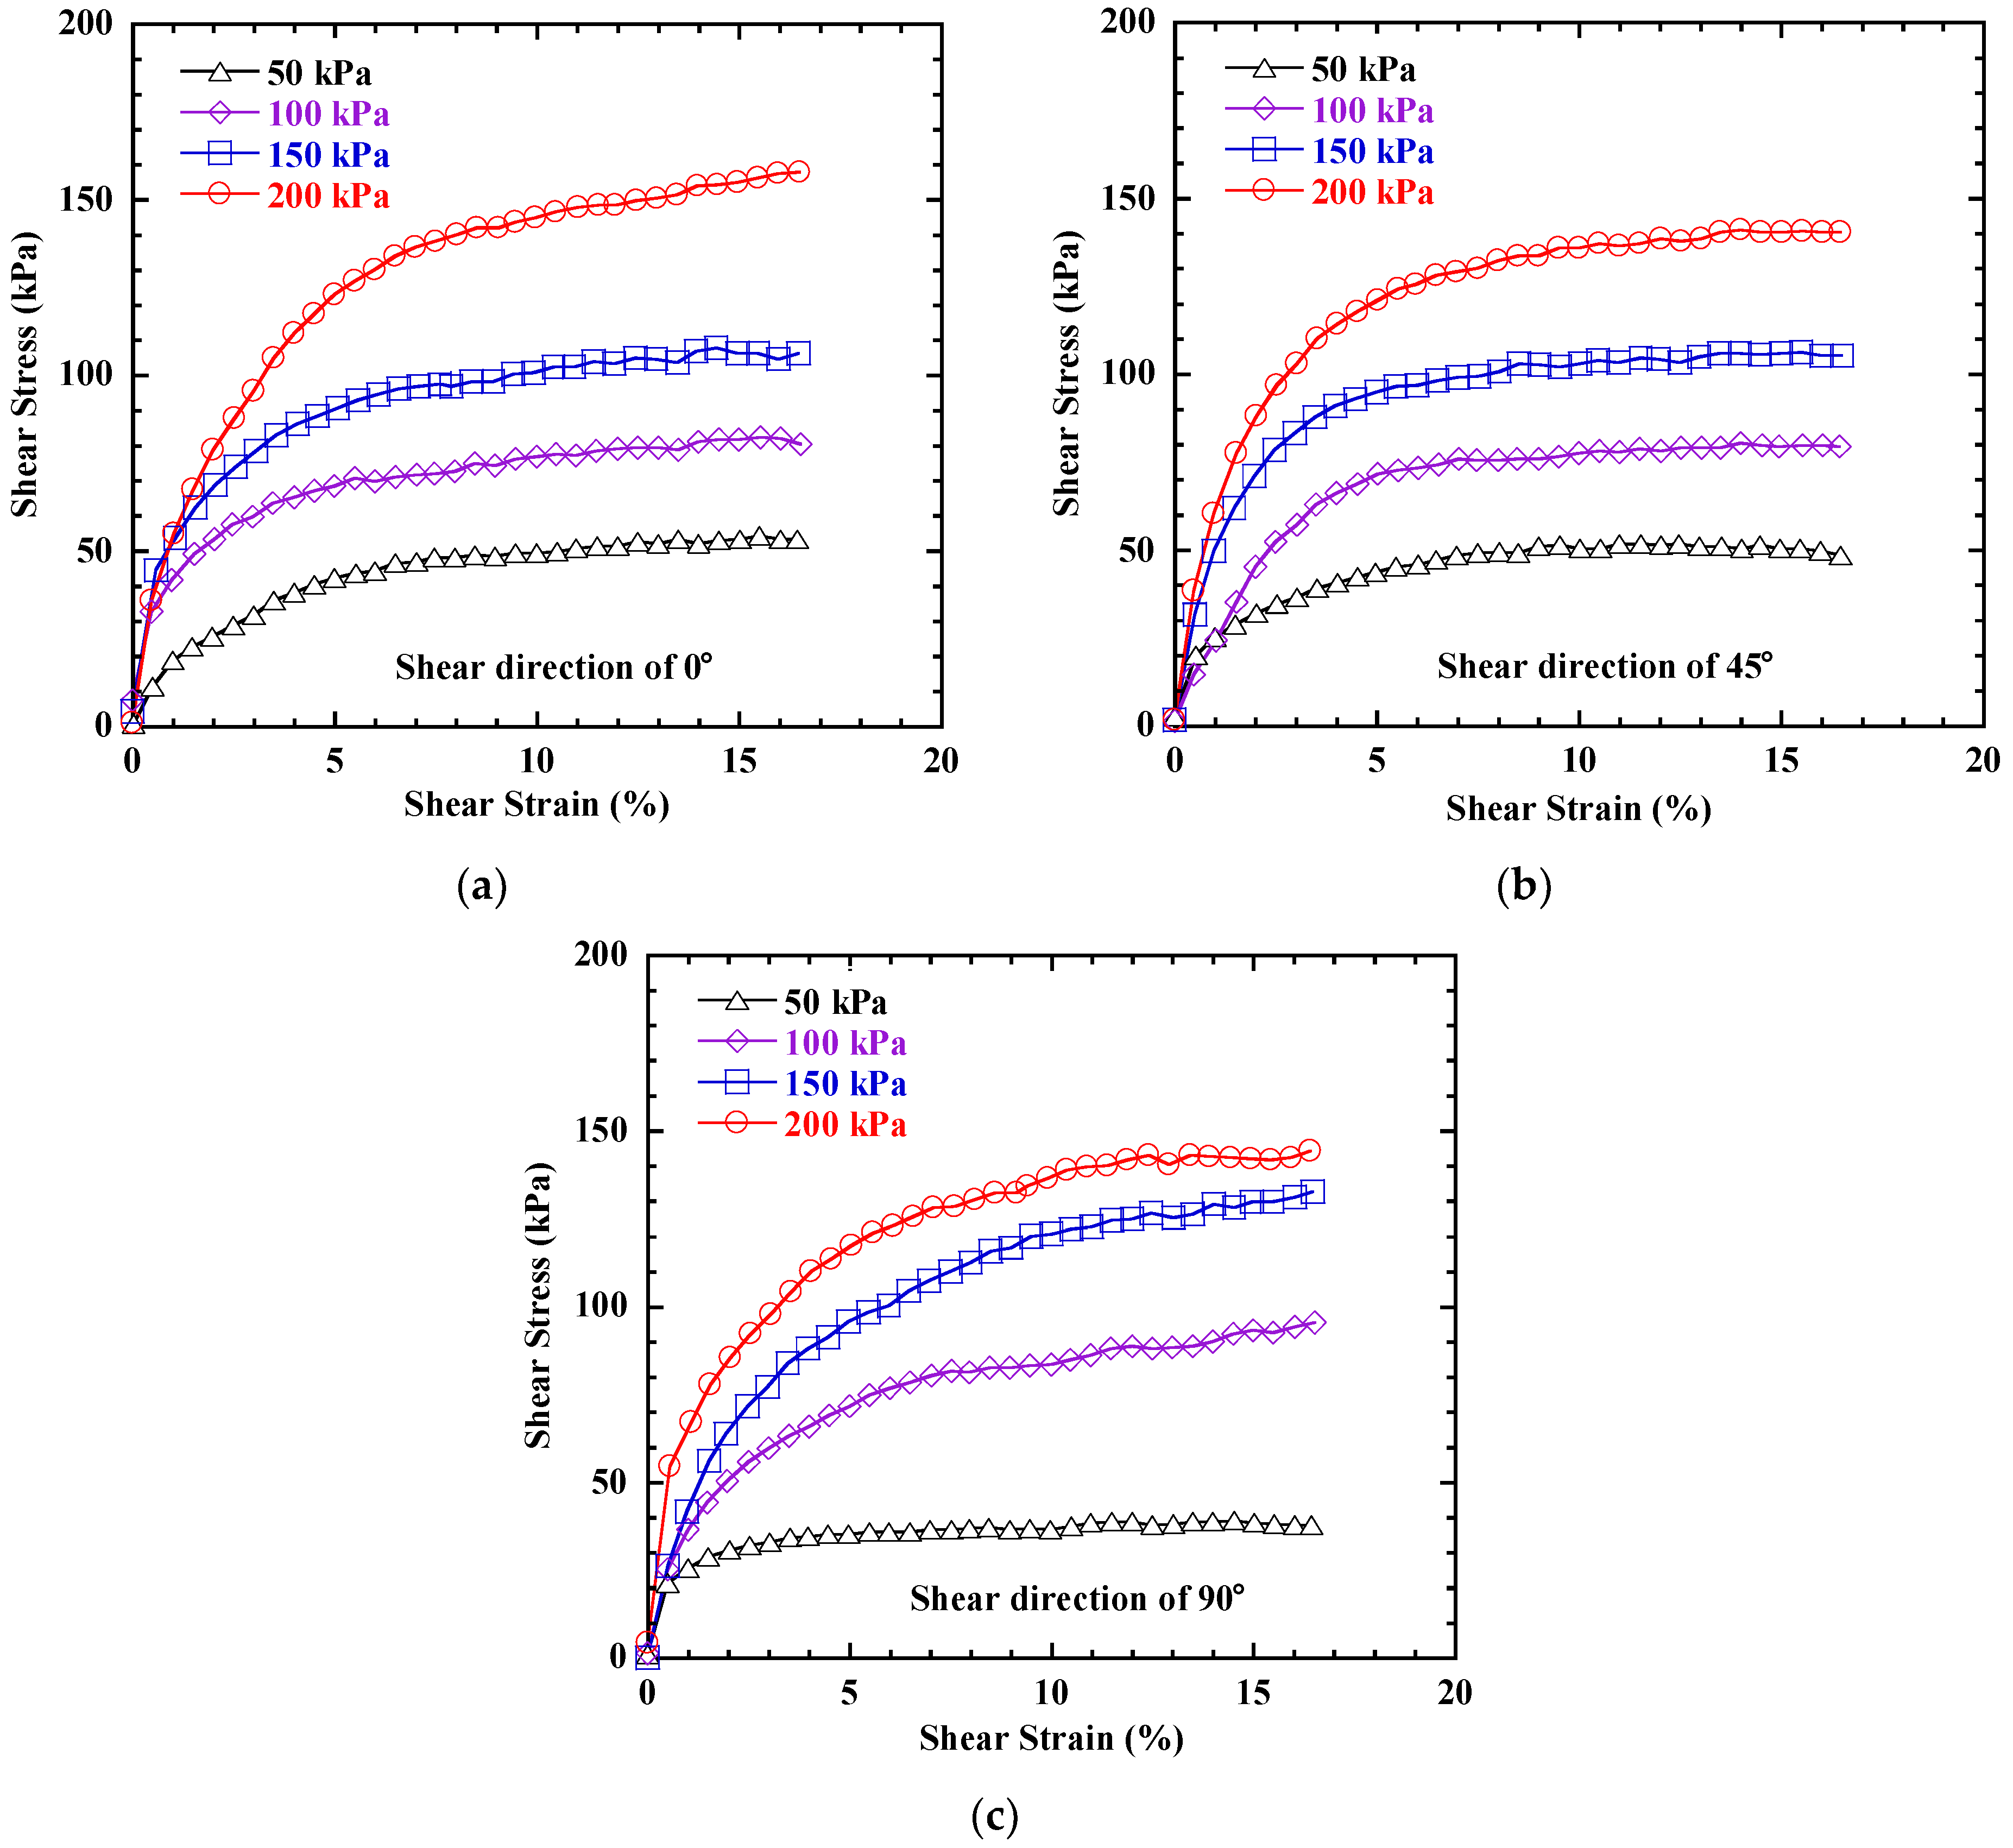
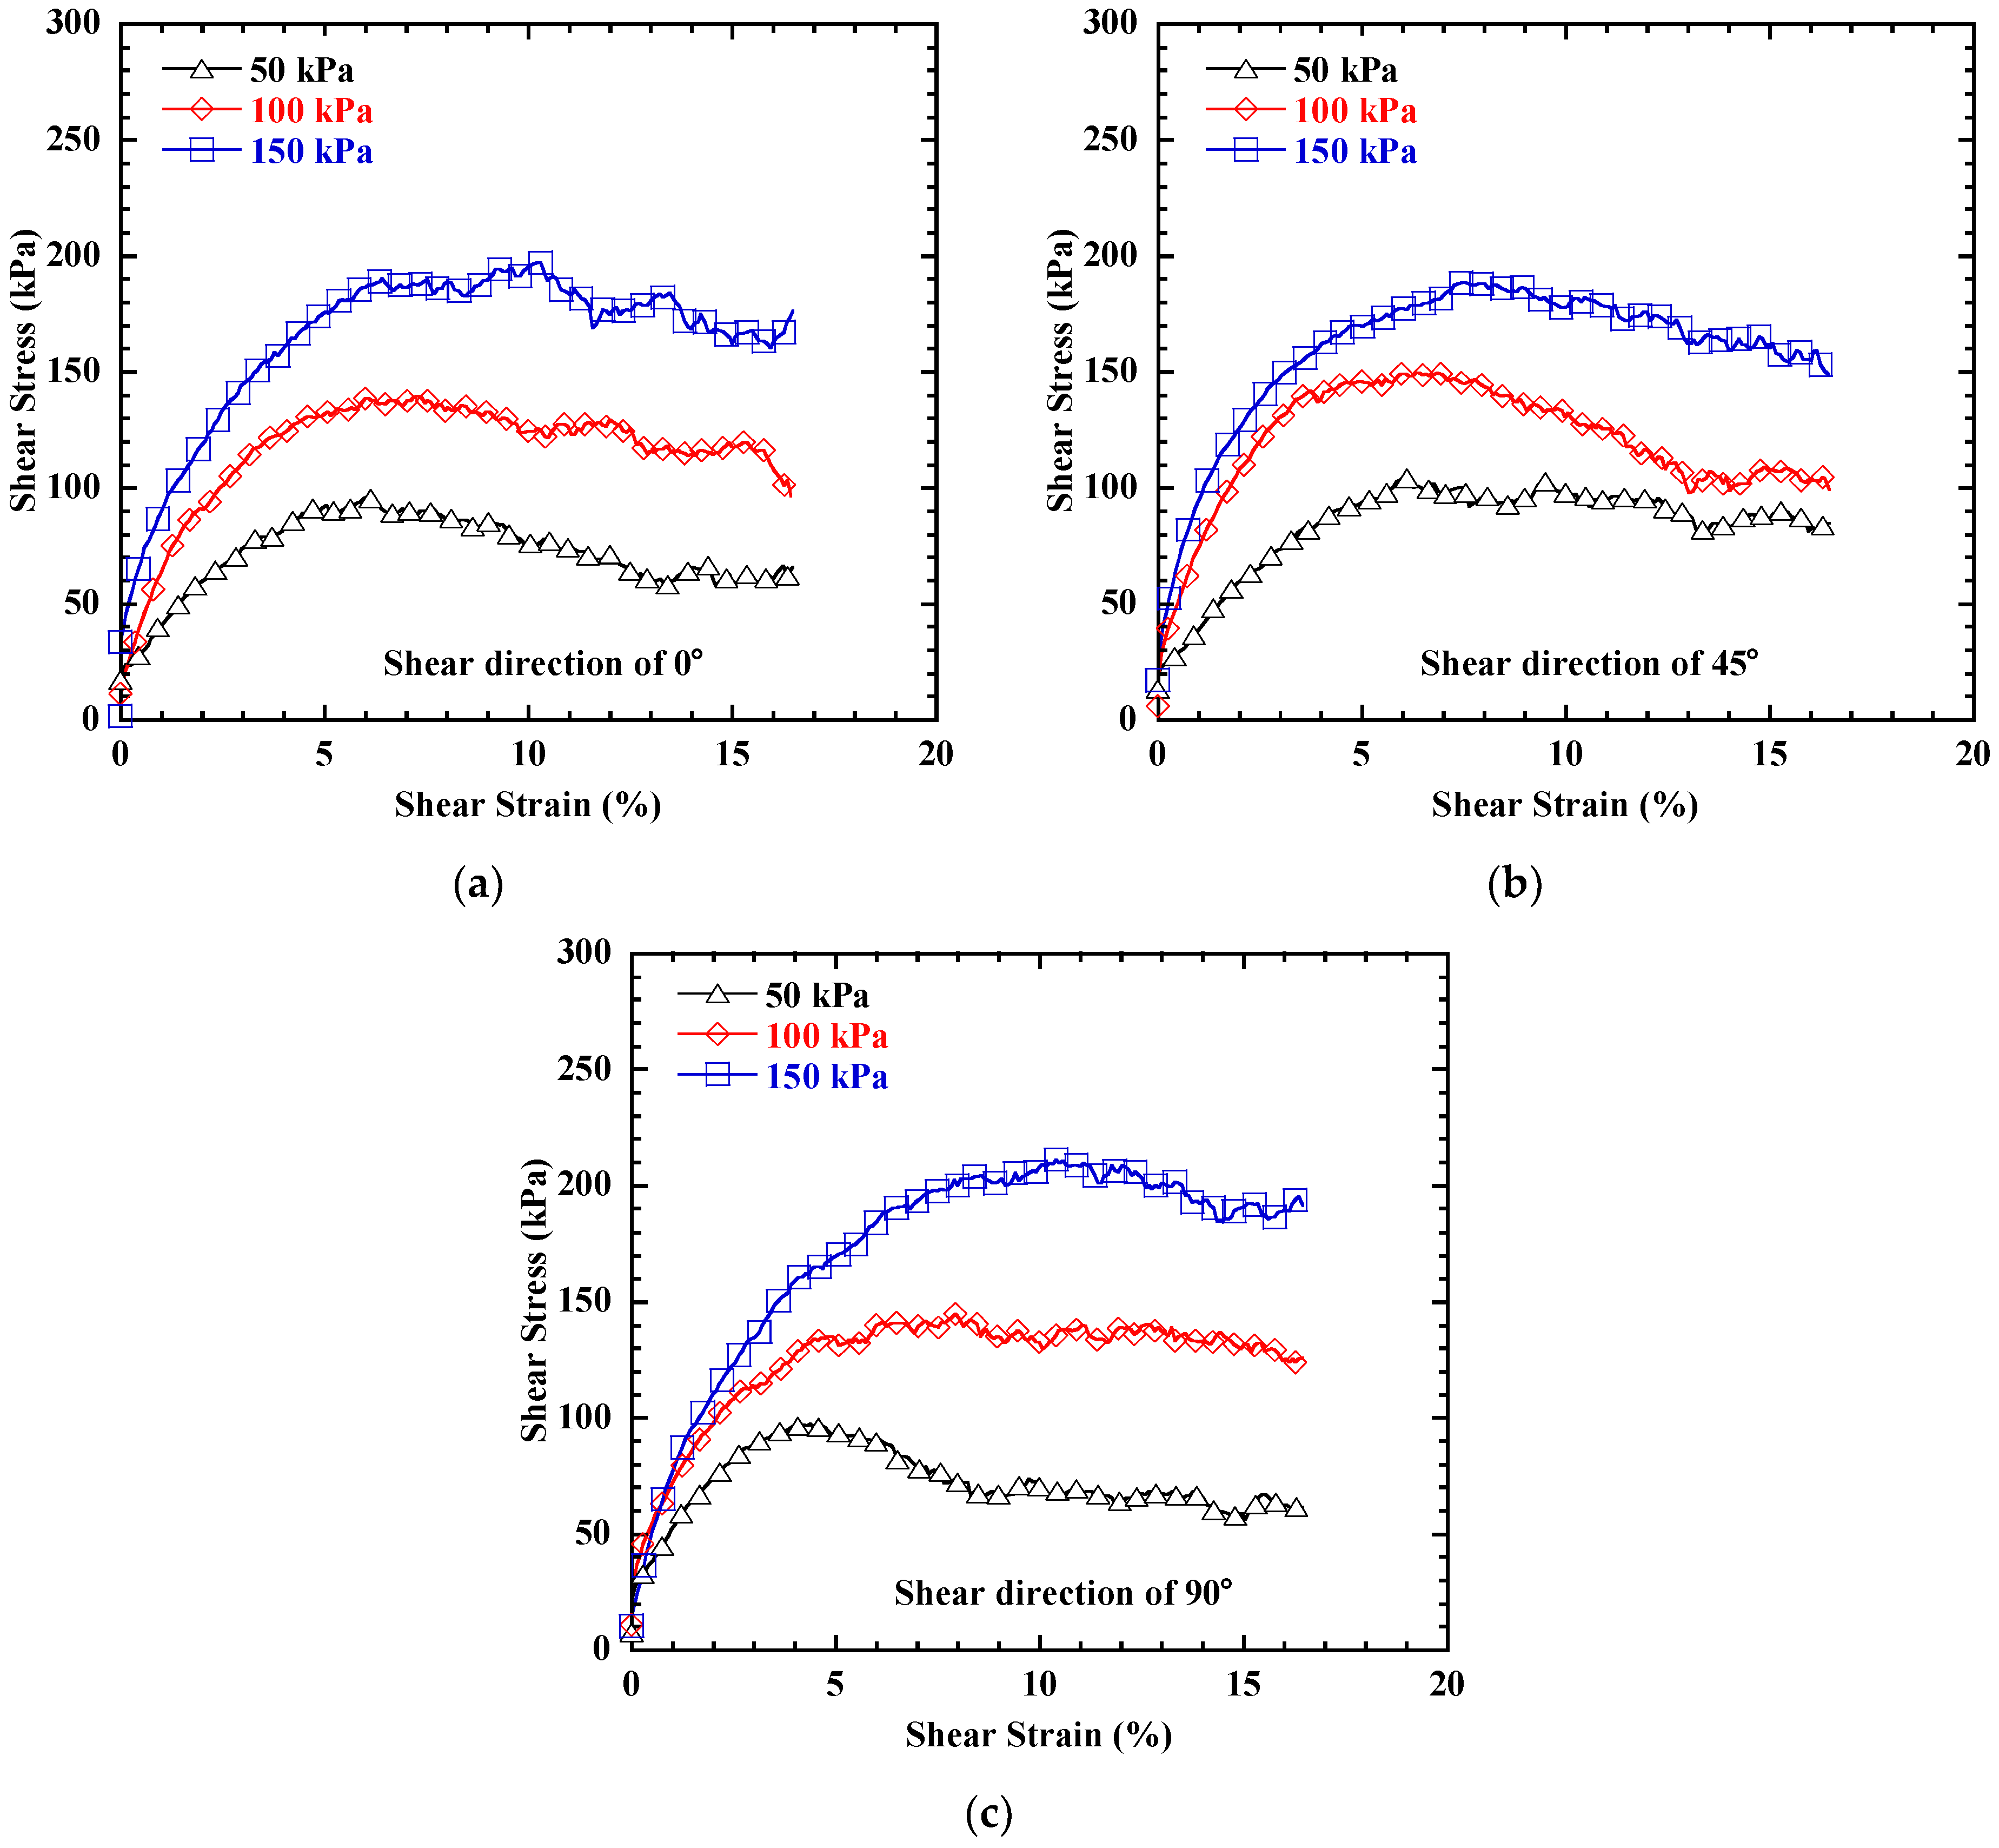
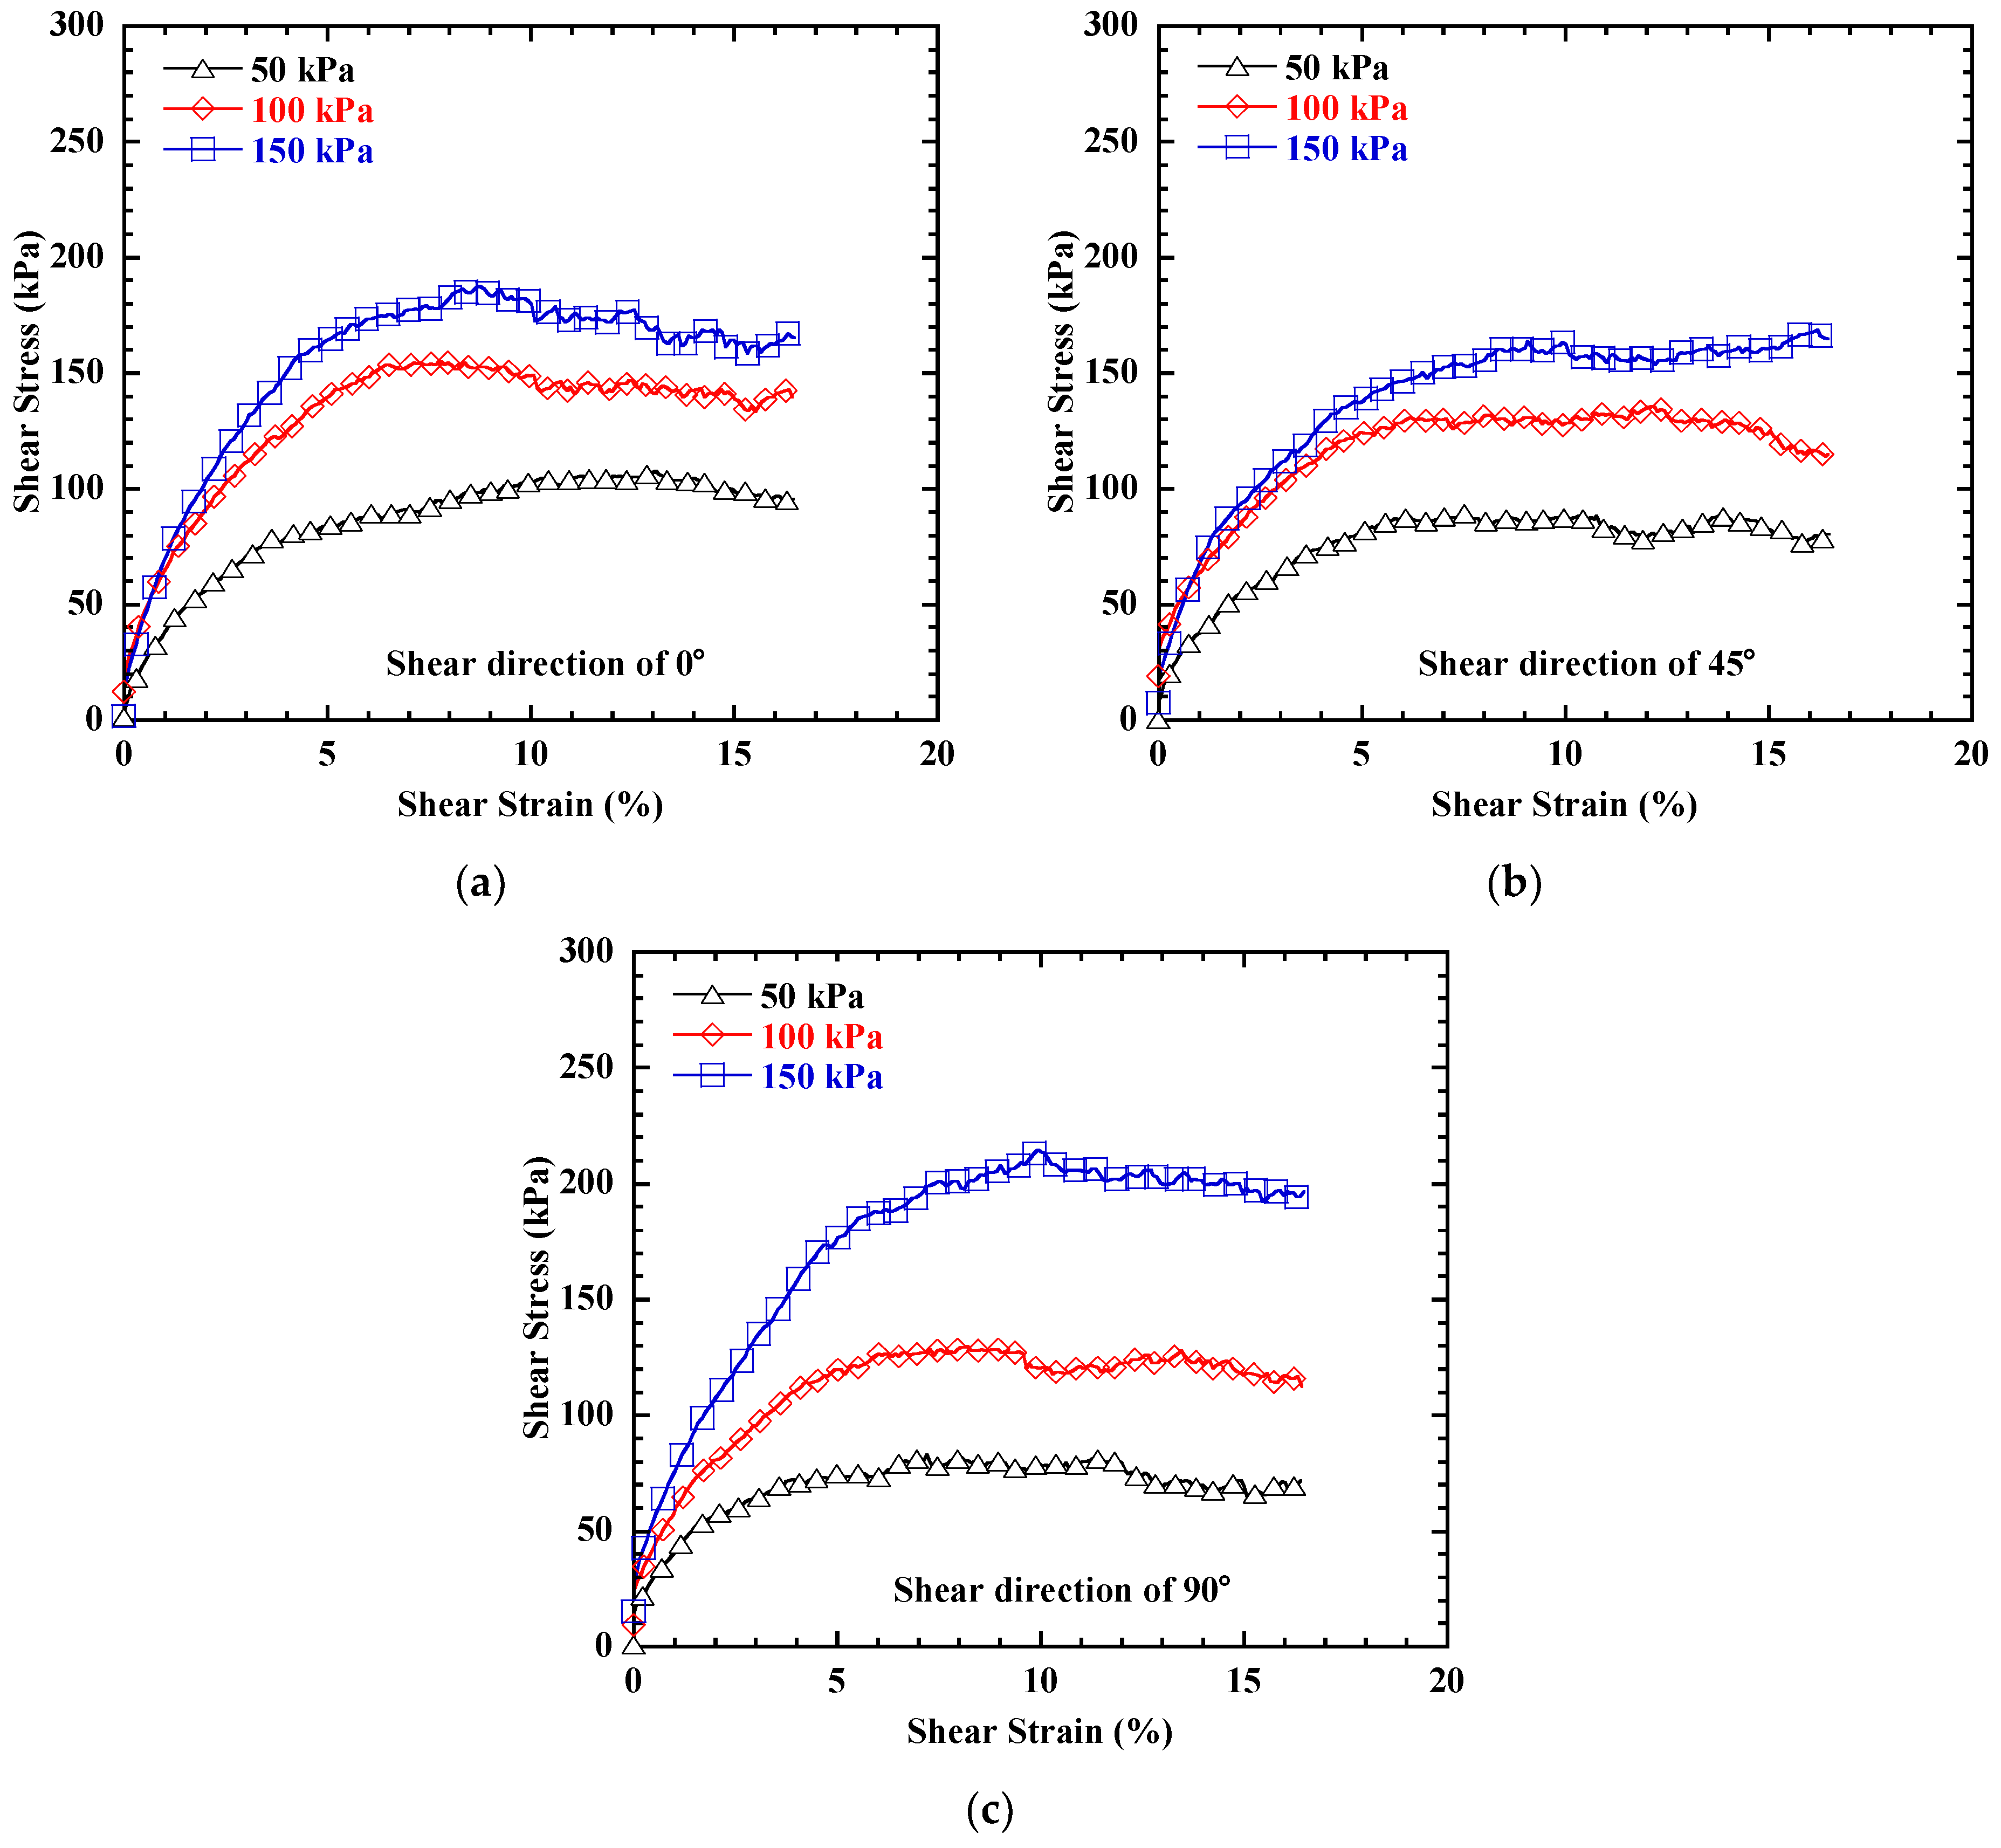
3.1. Shear Strength Behavior

For the fine sand–geogrid interfaces, taking the biaxial geogrid SS30 and the triaxial geogrid TX160 as examples, the interface shear test results for different shear directions are shown in Figure 4 and Figure 5, respectively. The shear stress–shear strain curves of the fine sand–biaxial geogrid (SS30) interface and the fine sand–triaxial geogrid (TX160) interface both show no obvious peak values under different normal stresses, all indicating strain hardening behavior. In the initial stage of shearing, the shear stress increases rapidly. As the shear strain increases, the increasing rate of shear stress gradually decreases, and there is an inflection point between the rapid increase and gradual increase. As the normal stress increases, the shear strain where the inflection point of the curve appears also increases.
In this study, the peak value on the shear stress–strain curve is taken as the shear strength. If no obvious peak is observed on the curve, the shear stress at the shear displacement of 30 mm (i.e., 15% shear strain) is taken as the shear strength of the interface. Figure 6 presents shear strength envelopes for the fine sand–biaxial geogrid (SS30) interface and the fine sand–triaxial geogrid (TX160) interface under different shear directions. It can be observed that the interface shear strengths under the same normal stresses are different for the three different shear directions for both biaxial and triaxial geogrids. This indicates that the shear direction has a certain influence on the shear strength of fine sand–geogrid interfaces.

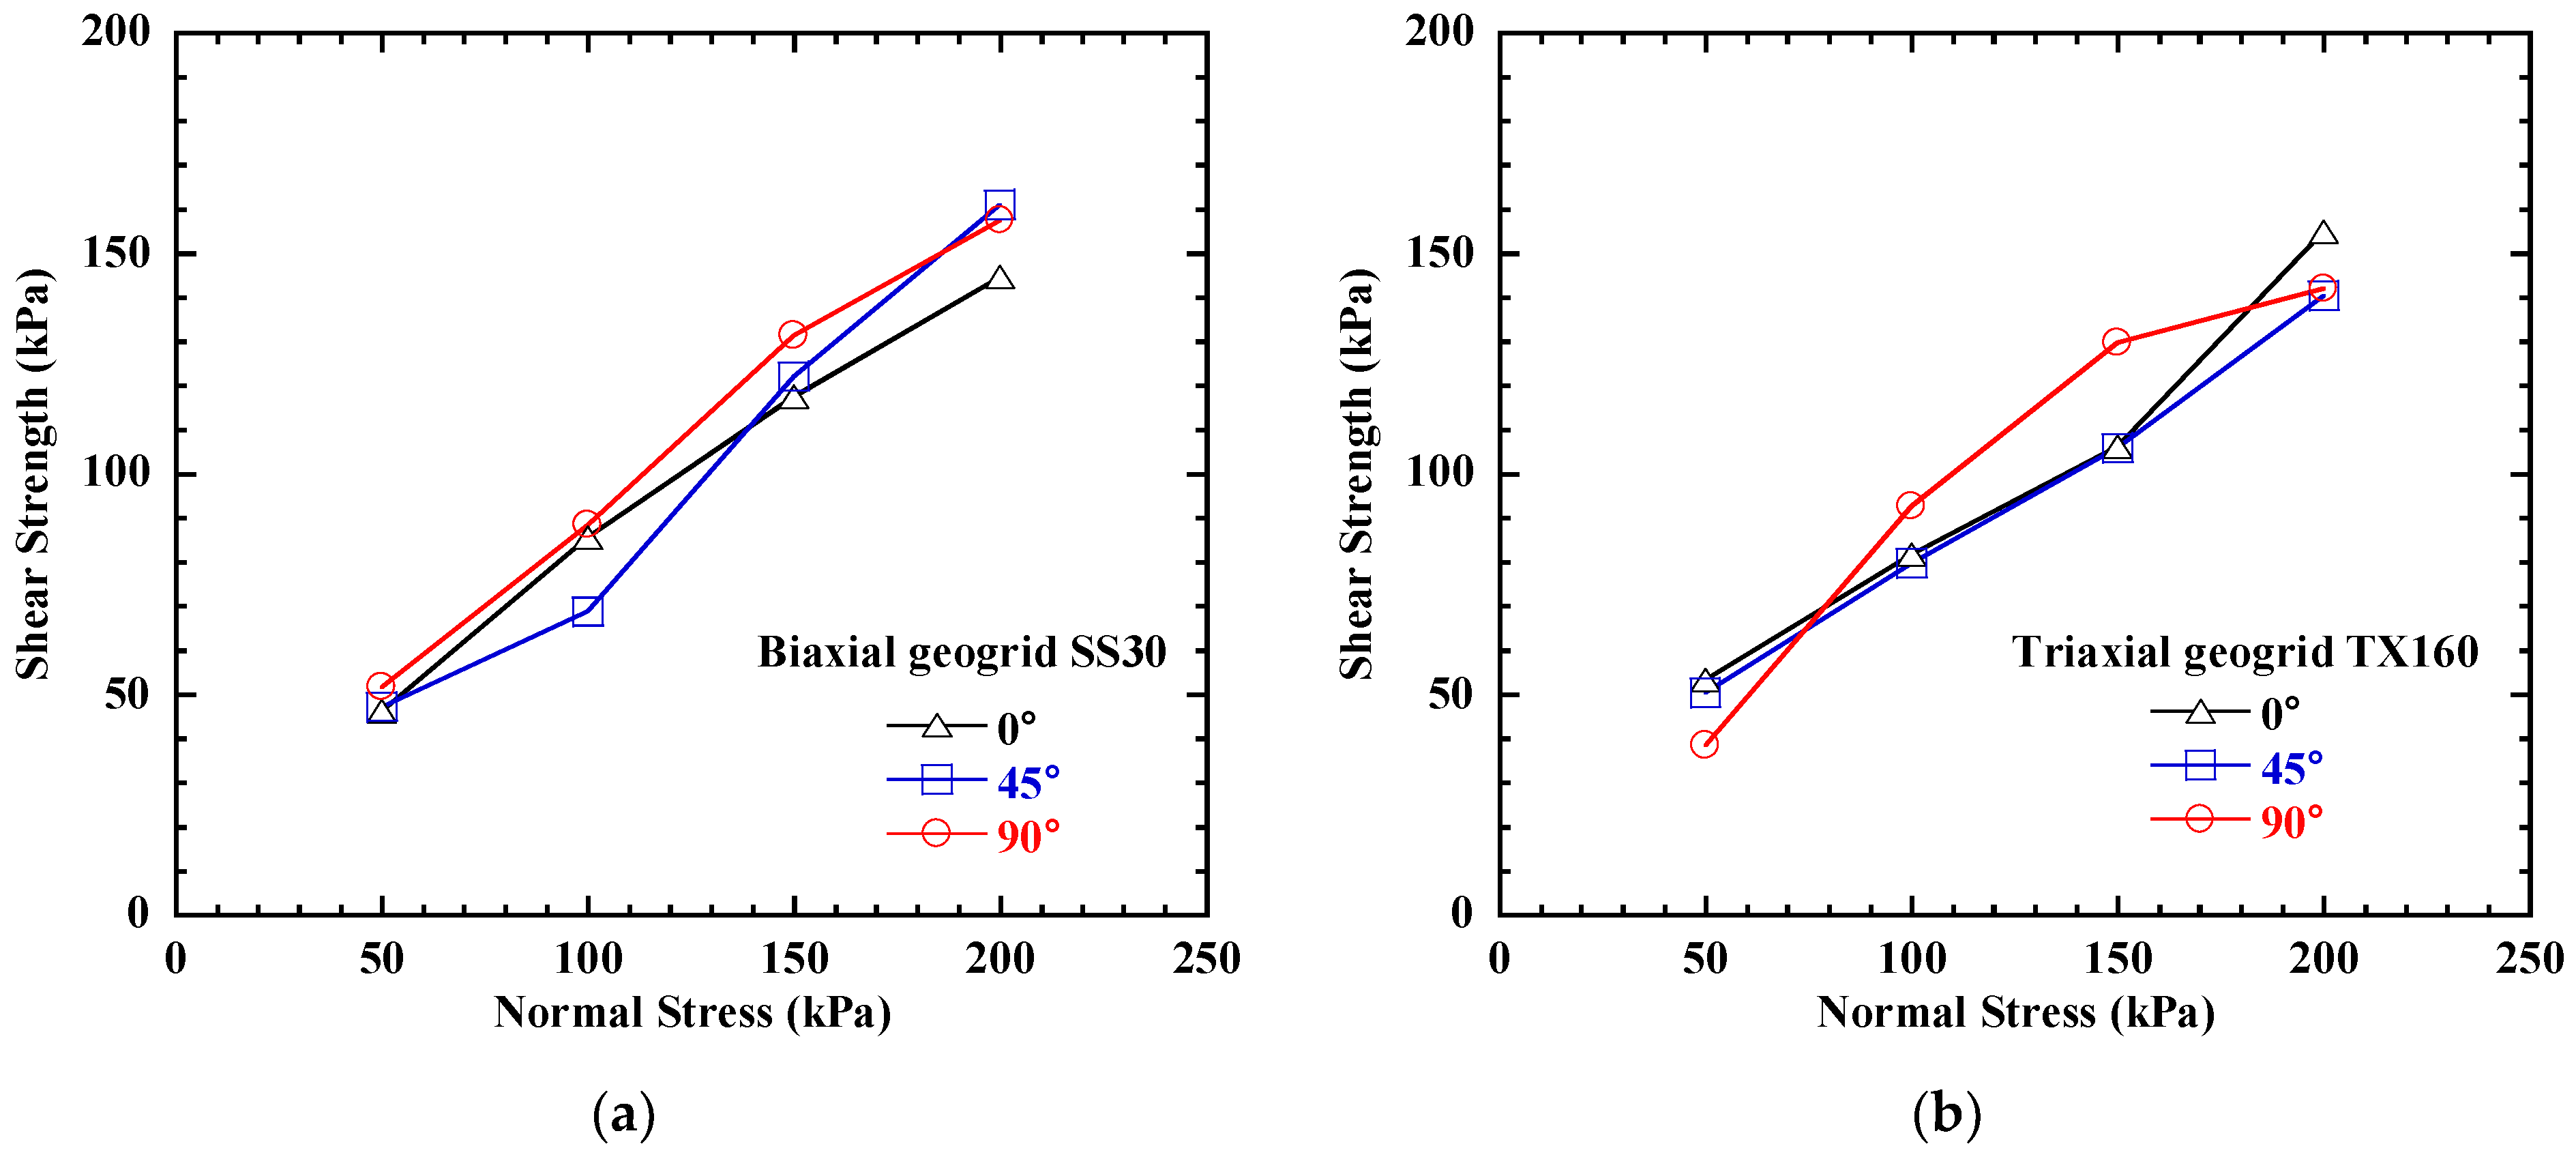
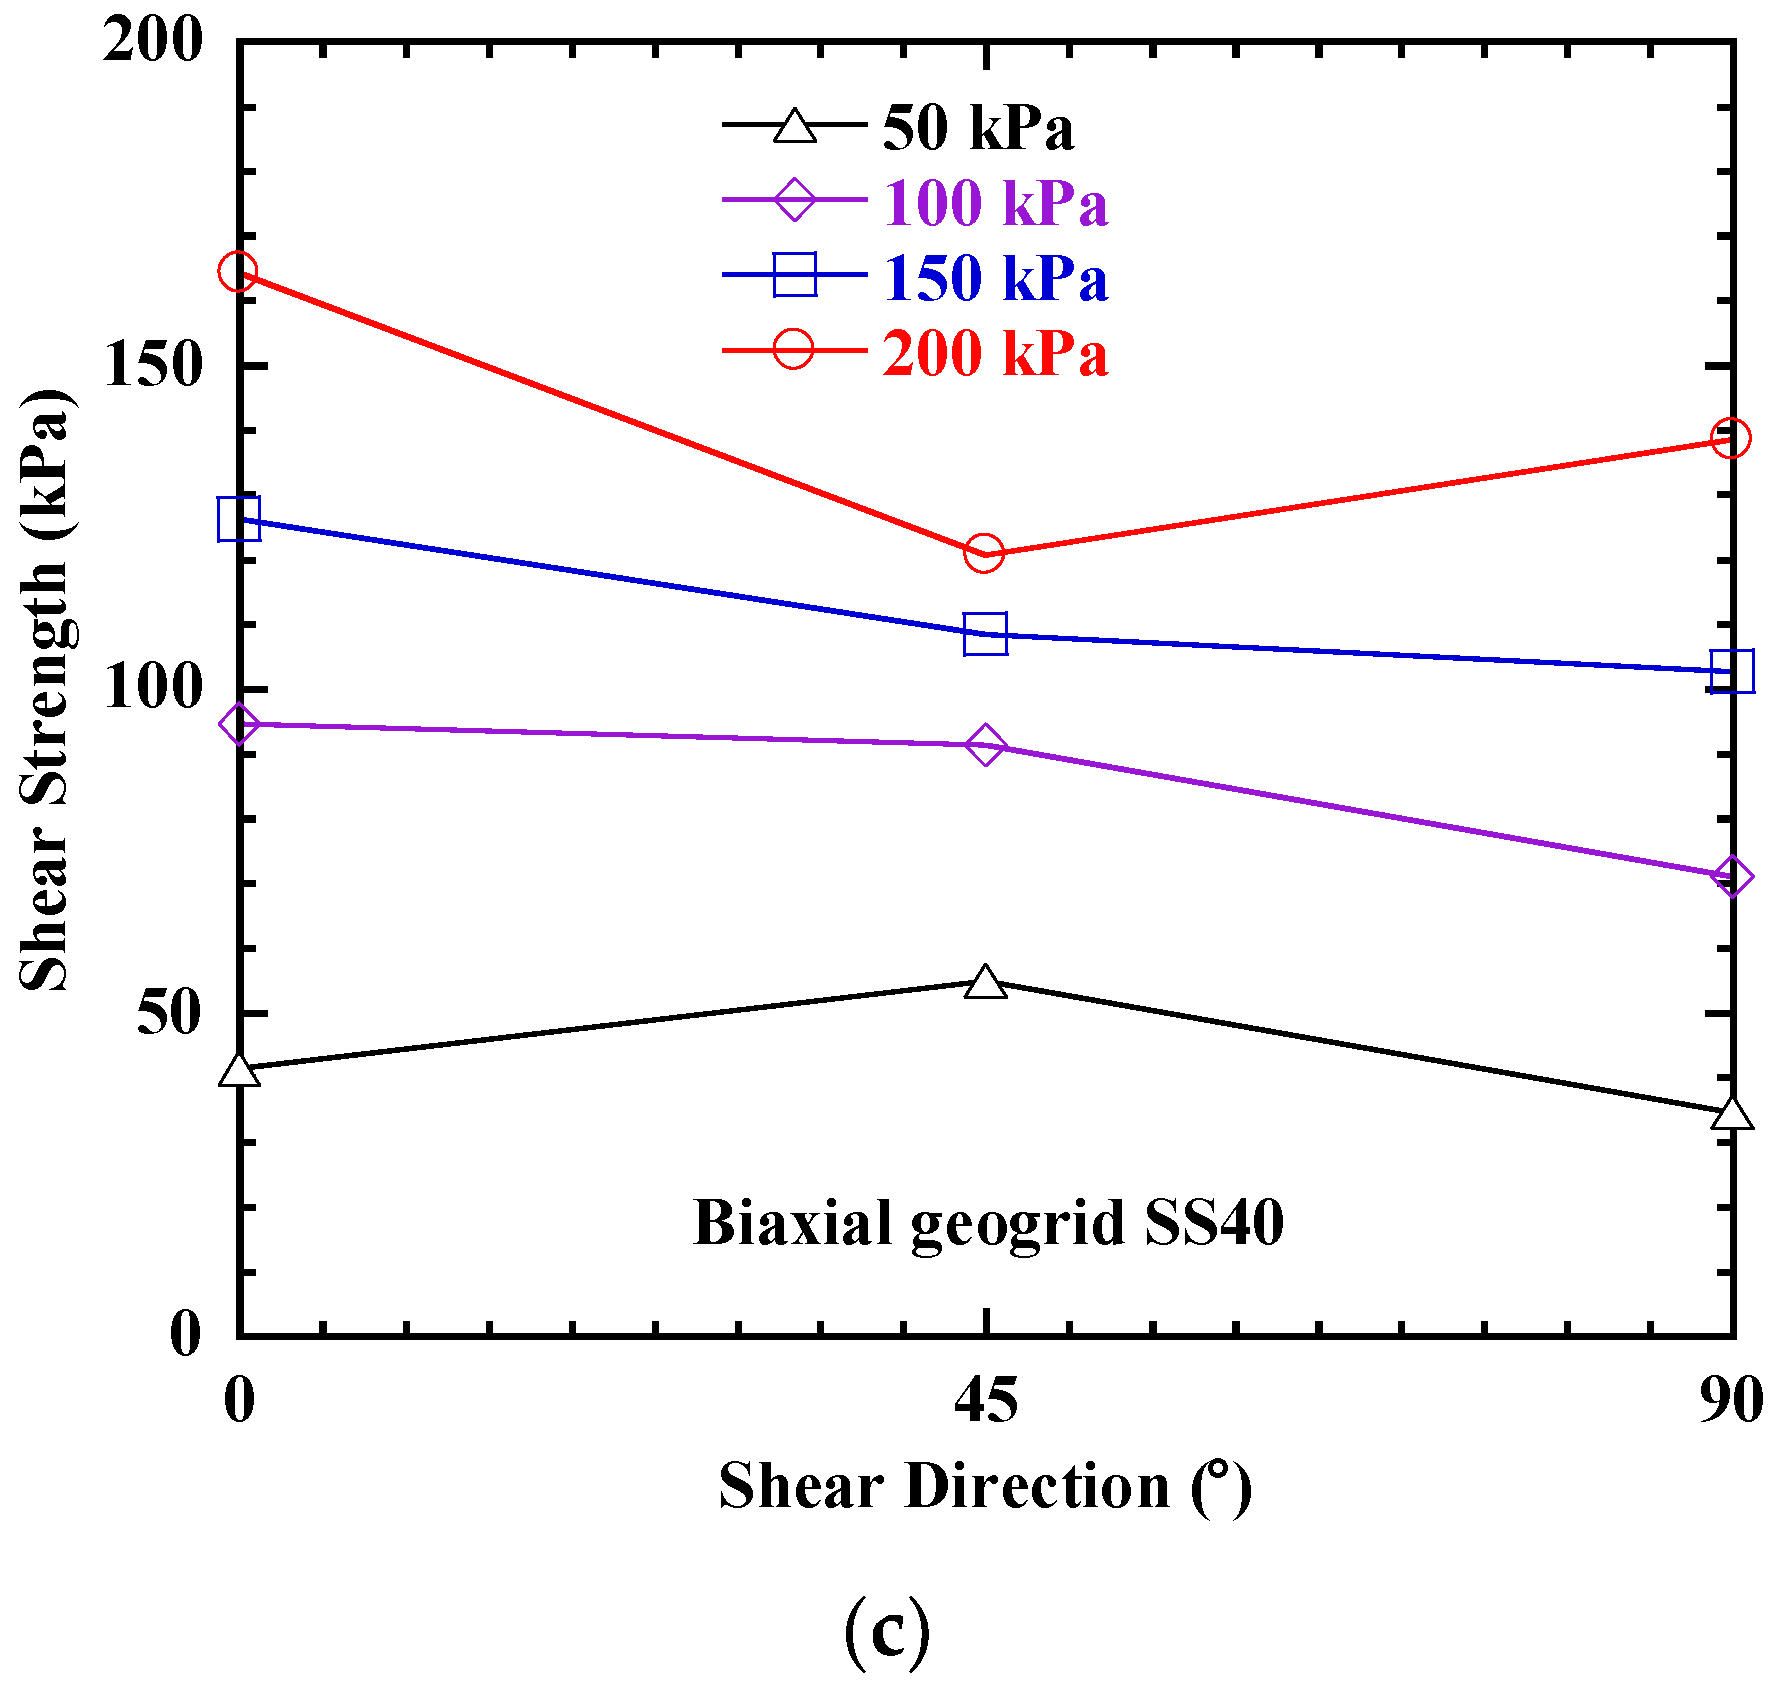
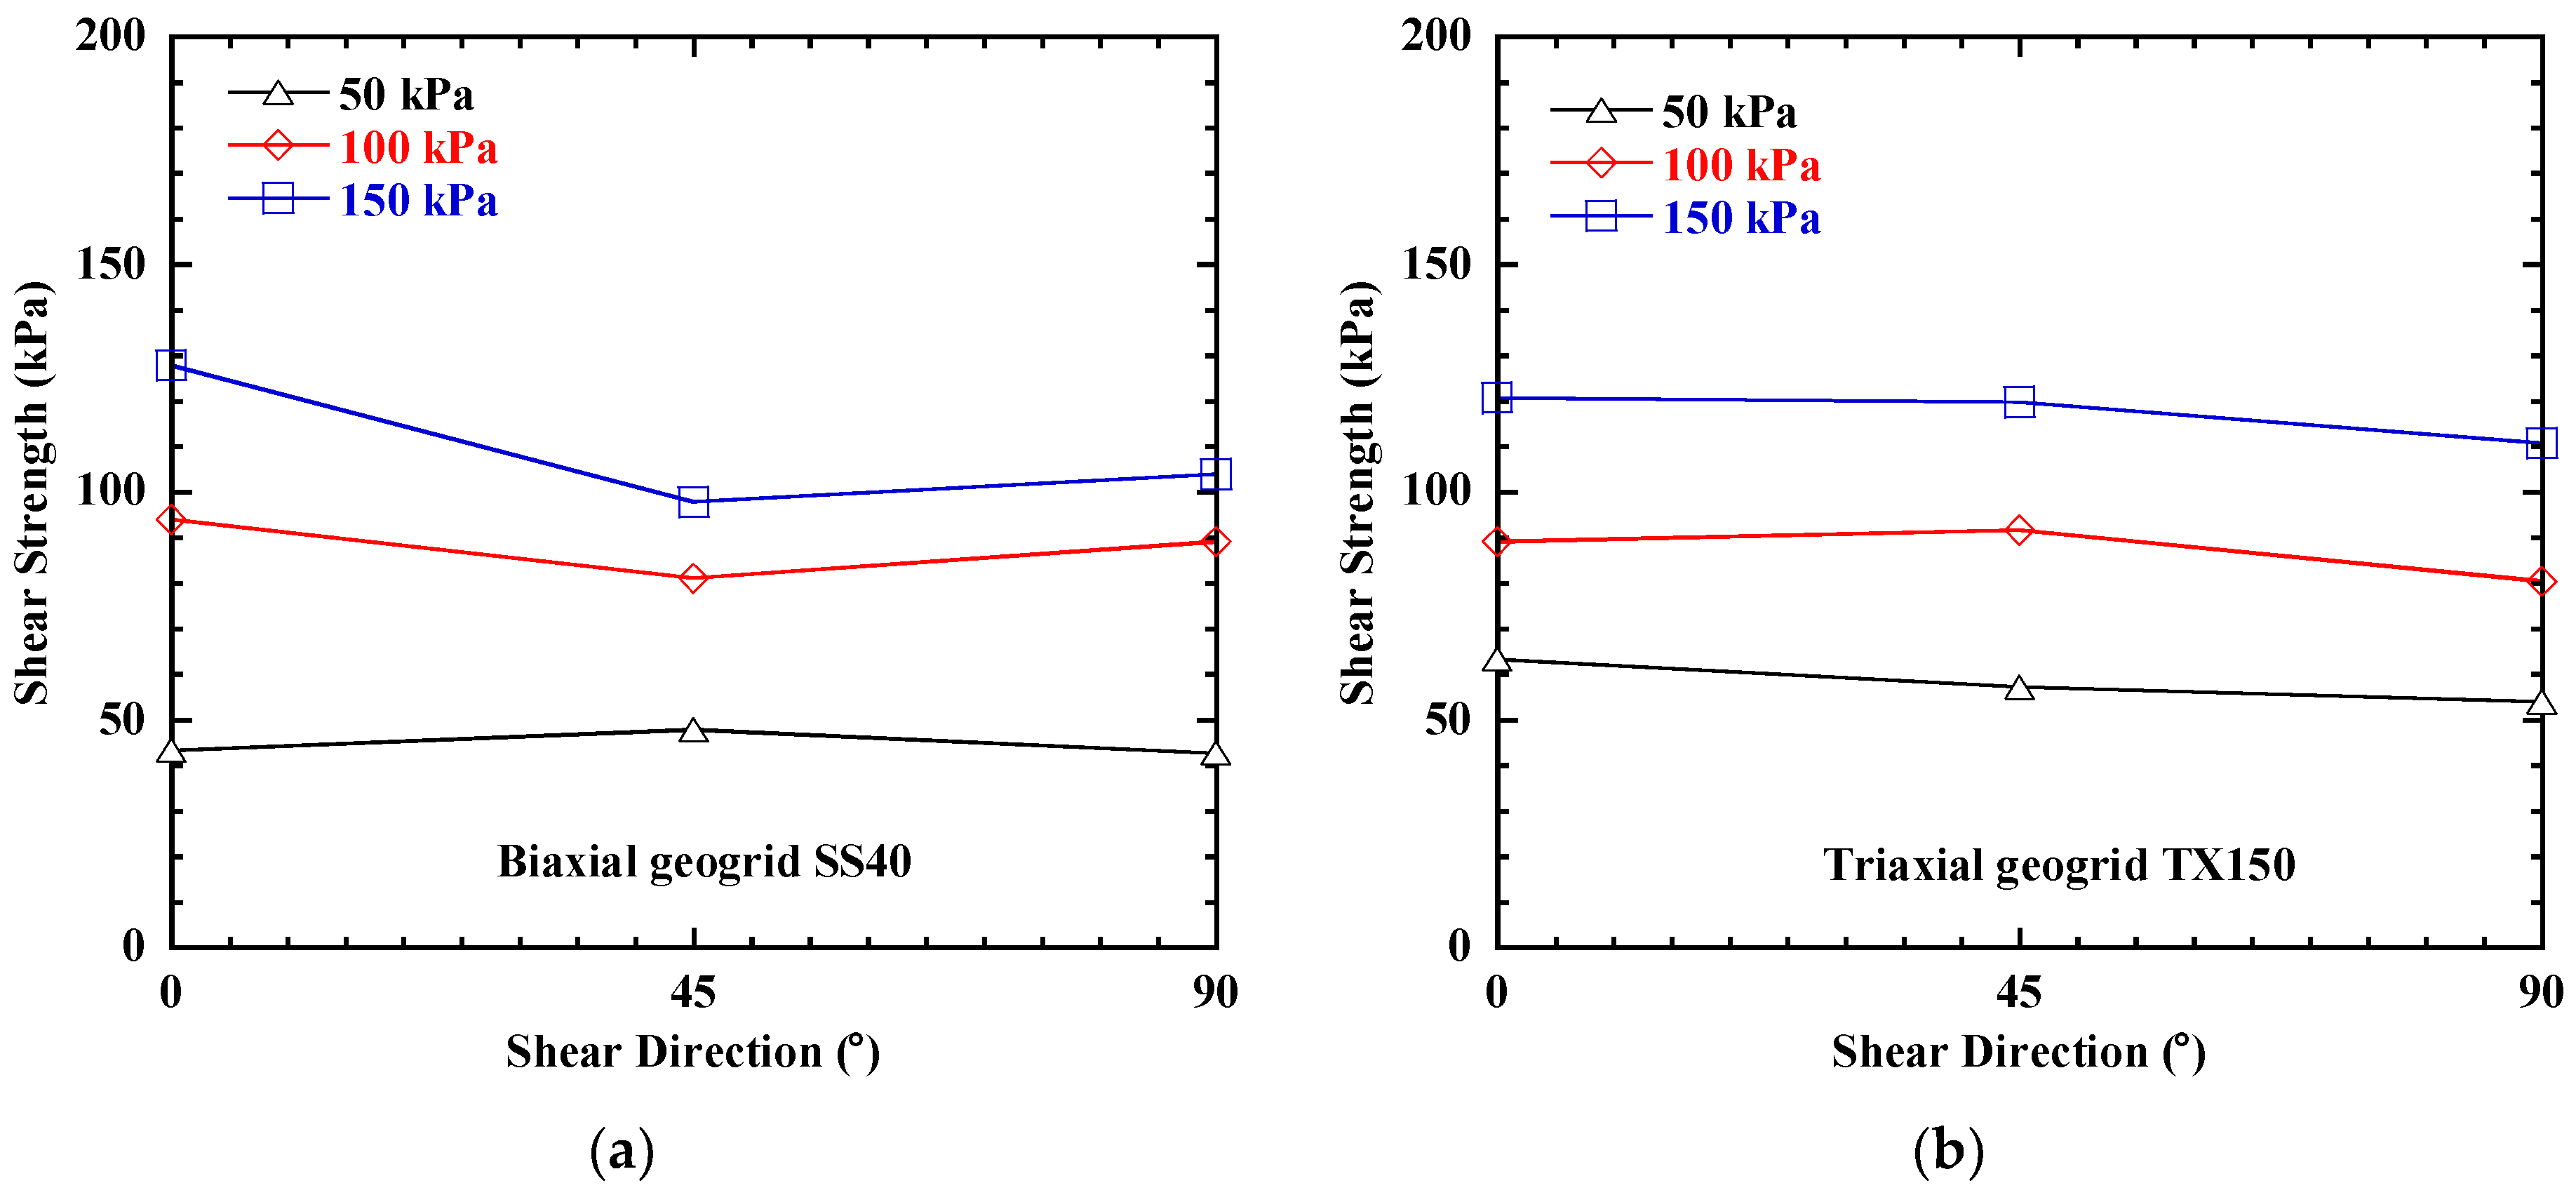
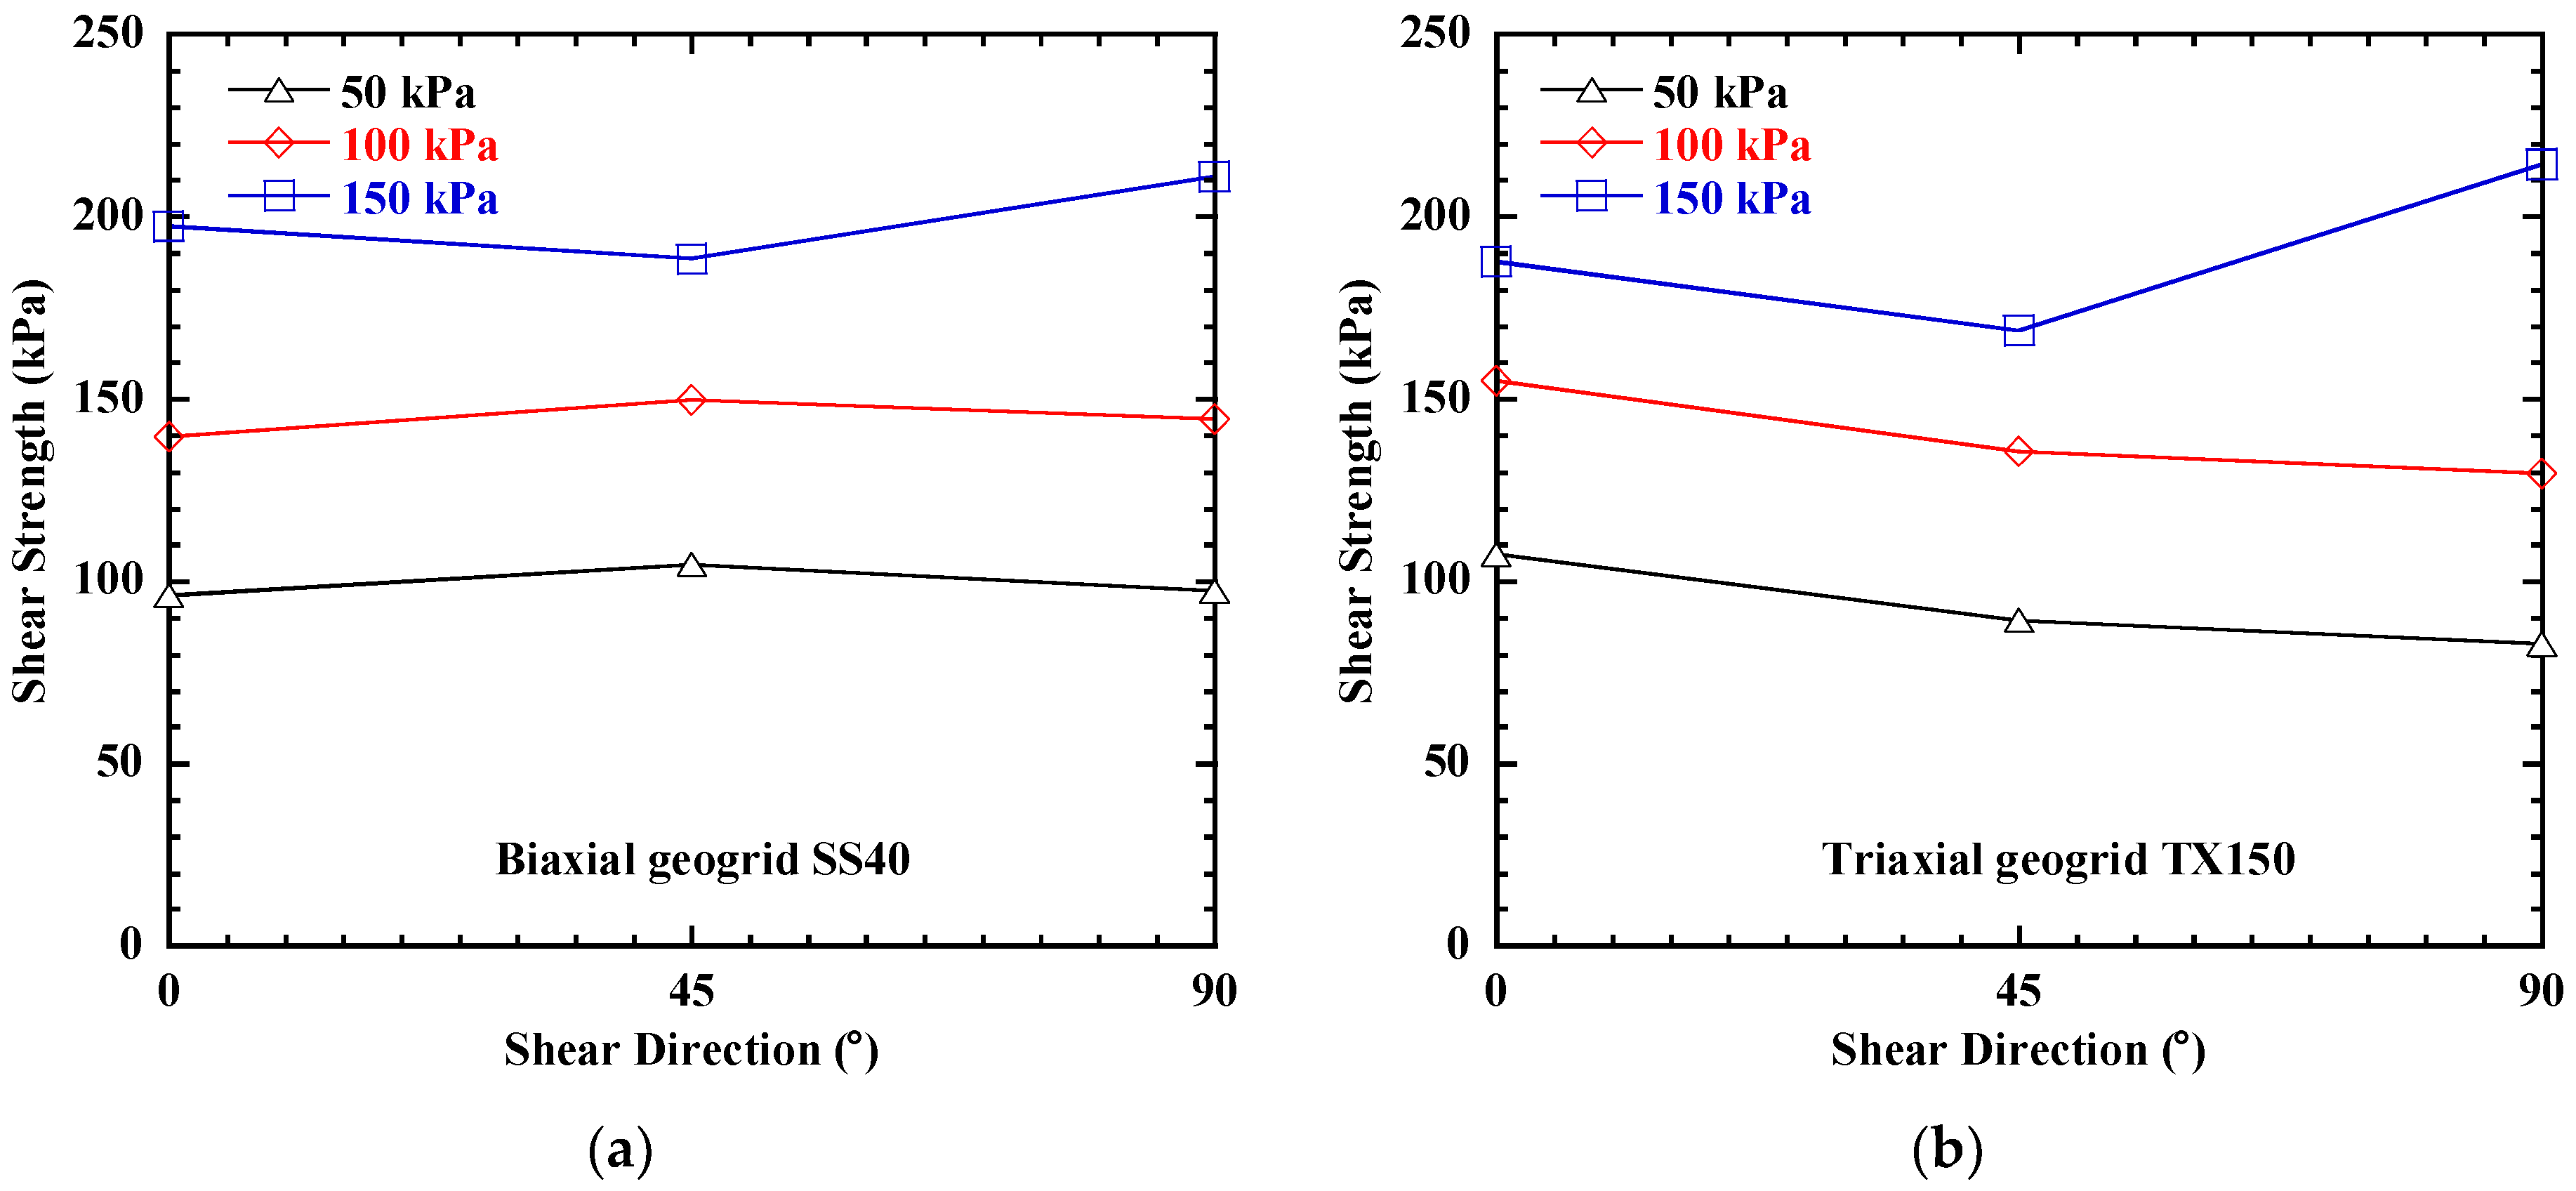
3.2. Influence of Shear Direction

Figure 7 and Figure 8 show the influence of shear direction on the shear strength of fine sand–biaxial geogrid interfaces and fine sand–triaxial geogrid interfaces, respectively. The interface shear strength under the same normal stress varies with shear directions for all the biaxial and triaxial geogrids, which indicates anisotropic shear strength behavior of fine sand–geogrid interfaces. Most of the curves show the lowest shear strength under the shear direction of 45°, especially for fine sand–biaxial geogrid interfaces. However, there is not a consistent trend for the shear strength of fine sand–geogrid interfaces with varying shear direction for biaxial and triaxial geogrids. The interlocking effect of fine sand–biaxial geogrid interfaces is weak, which is mainly dominated by the friction effect, and the friction effect is related to the tensile strength of the geogrid, so the shear strength of soil–geogrid interfaces is greatly affected by the tensile strength of the geogrid. As the tensile strength of the geogrid increases, the difference in friction in different shear directions increases, which enhances the anisotropy. Therefore, the SS40 samples have the greatest influence on shear direction.
Although the three biaxial geogrids have different tensile strengths (e.g., 26.29 kN/m for SS20, 33.97 kN/m for SS30, and 48.26 kN/m for SS40 under shear direction of 0°), as indicated in Table 1, the interface shear strengths between the soil and the three biaxial geogrids are not much different; for example, the shear strength values are approximately 50 kPa for the three soil–biaxial geogrid interfaces under the normal stress of 50 kPa. This confirms that the soil–geogrid interface shear strength mainly depends on the shear strength of the soil itself, rather than the tensile strength of the geogrid. A similar trend is also observed in triaxial geogrids, as shown in Figure 8. In addition, the shear strength values for soil–triaxial geogrid interfaces are also close to those for soil–biaxial geogrid interfaces under the same normal stress. This indicates that the shear strength of soil–geogrid interfaces is not significantly affected by the type of geogrid.
In this study, the anisotropy of soil–geogrid interfaces is evaluated in terms of the percentage of shear strength variation As, which is defined as the ratio of the difference between the maximum and minimum shear strength to the minimum shear strength under the same normal stress, and is expressed as follows:
A s = τ max τ min τ min
where τ max and τ min are the maximum and minimum shear strength values of a soil–geogrid interface for different shear directions under the same normal stress. The higher the percentage of shear strength variation, the stronger the anisotropy of the interface. In Table 2, the percentages of shear strength variation range from 0.68% to 59.29% for soil–biaxial geogrid interfaces, and from 6.01% to 37.99% for soil–triaxial geogrid interfaces. The biaxial geogrid SS40 has the largest percentage of shear strength variation, As = 59.59%, under the normal stress of 50 kPa for soil–biaxial geogrid interfaces, and the triaxial geogrid TX160 has the largest value of As = 37.99% under the normal stress of 50 kPa. These large As values indicate strong anisotropic shear strength behavior of soil–geogrid interfaces. The anisotropy of soil–geogrid interfaces is ignored in the current geosynthetic testing standard, which could be important for the safe design of reinforced soil structures.
The percentages of shear strength variation for all the soil–geogrid interfaces under different normal stresses are summarized in Table 2. With the increase in normal stress, the percentage of shear strength variation generally decreases, indicating less anisotropy. This is because greater normal stress could provide stronger confinement, and thus generate a more stable interlocking structure between the soil particles and the geogrid aperture, which would be less sensitive to the direction of loading.
In general, the percentages of shear strength variation As for soil–biaxial geogrid interfaces are greater than those for soil–triaxial geogrid interfaces under the same normal stress, which indicates stronger anisotropy for soil–biaxial geogrid interfaces than soil–triaxial geogrid interfaces. This is because the triangular aperture of the triaxial geogrid is more stable than the rectangular aperture of the biaxial geogrid, which makes the soil–triaxial geogrid interaction less sensitive to shear direction. This is consistent with the data provided in Table 1, which demonstrates that the biaxial geogrid shows stronger anisotropy than the triaxial geogrid in terms of tensile strength. The stable aperture shape of the triaxial geogrid could improve the interlocking effect between the soil particles and geogrid apertures, thus showing less anisotropic shear strength behavior for the soil–triaxial geogrid interface.

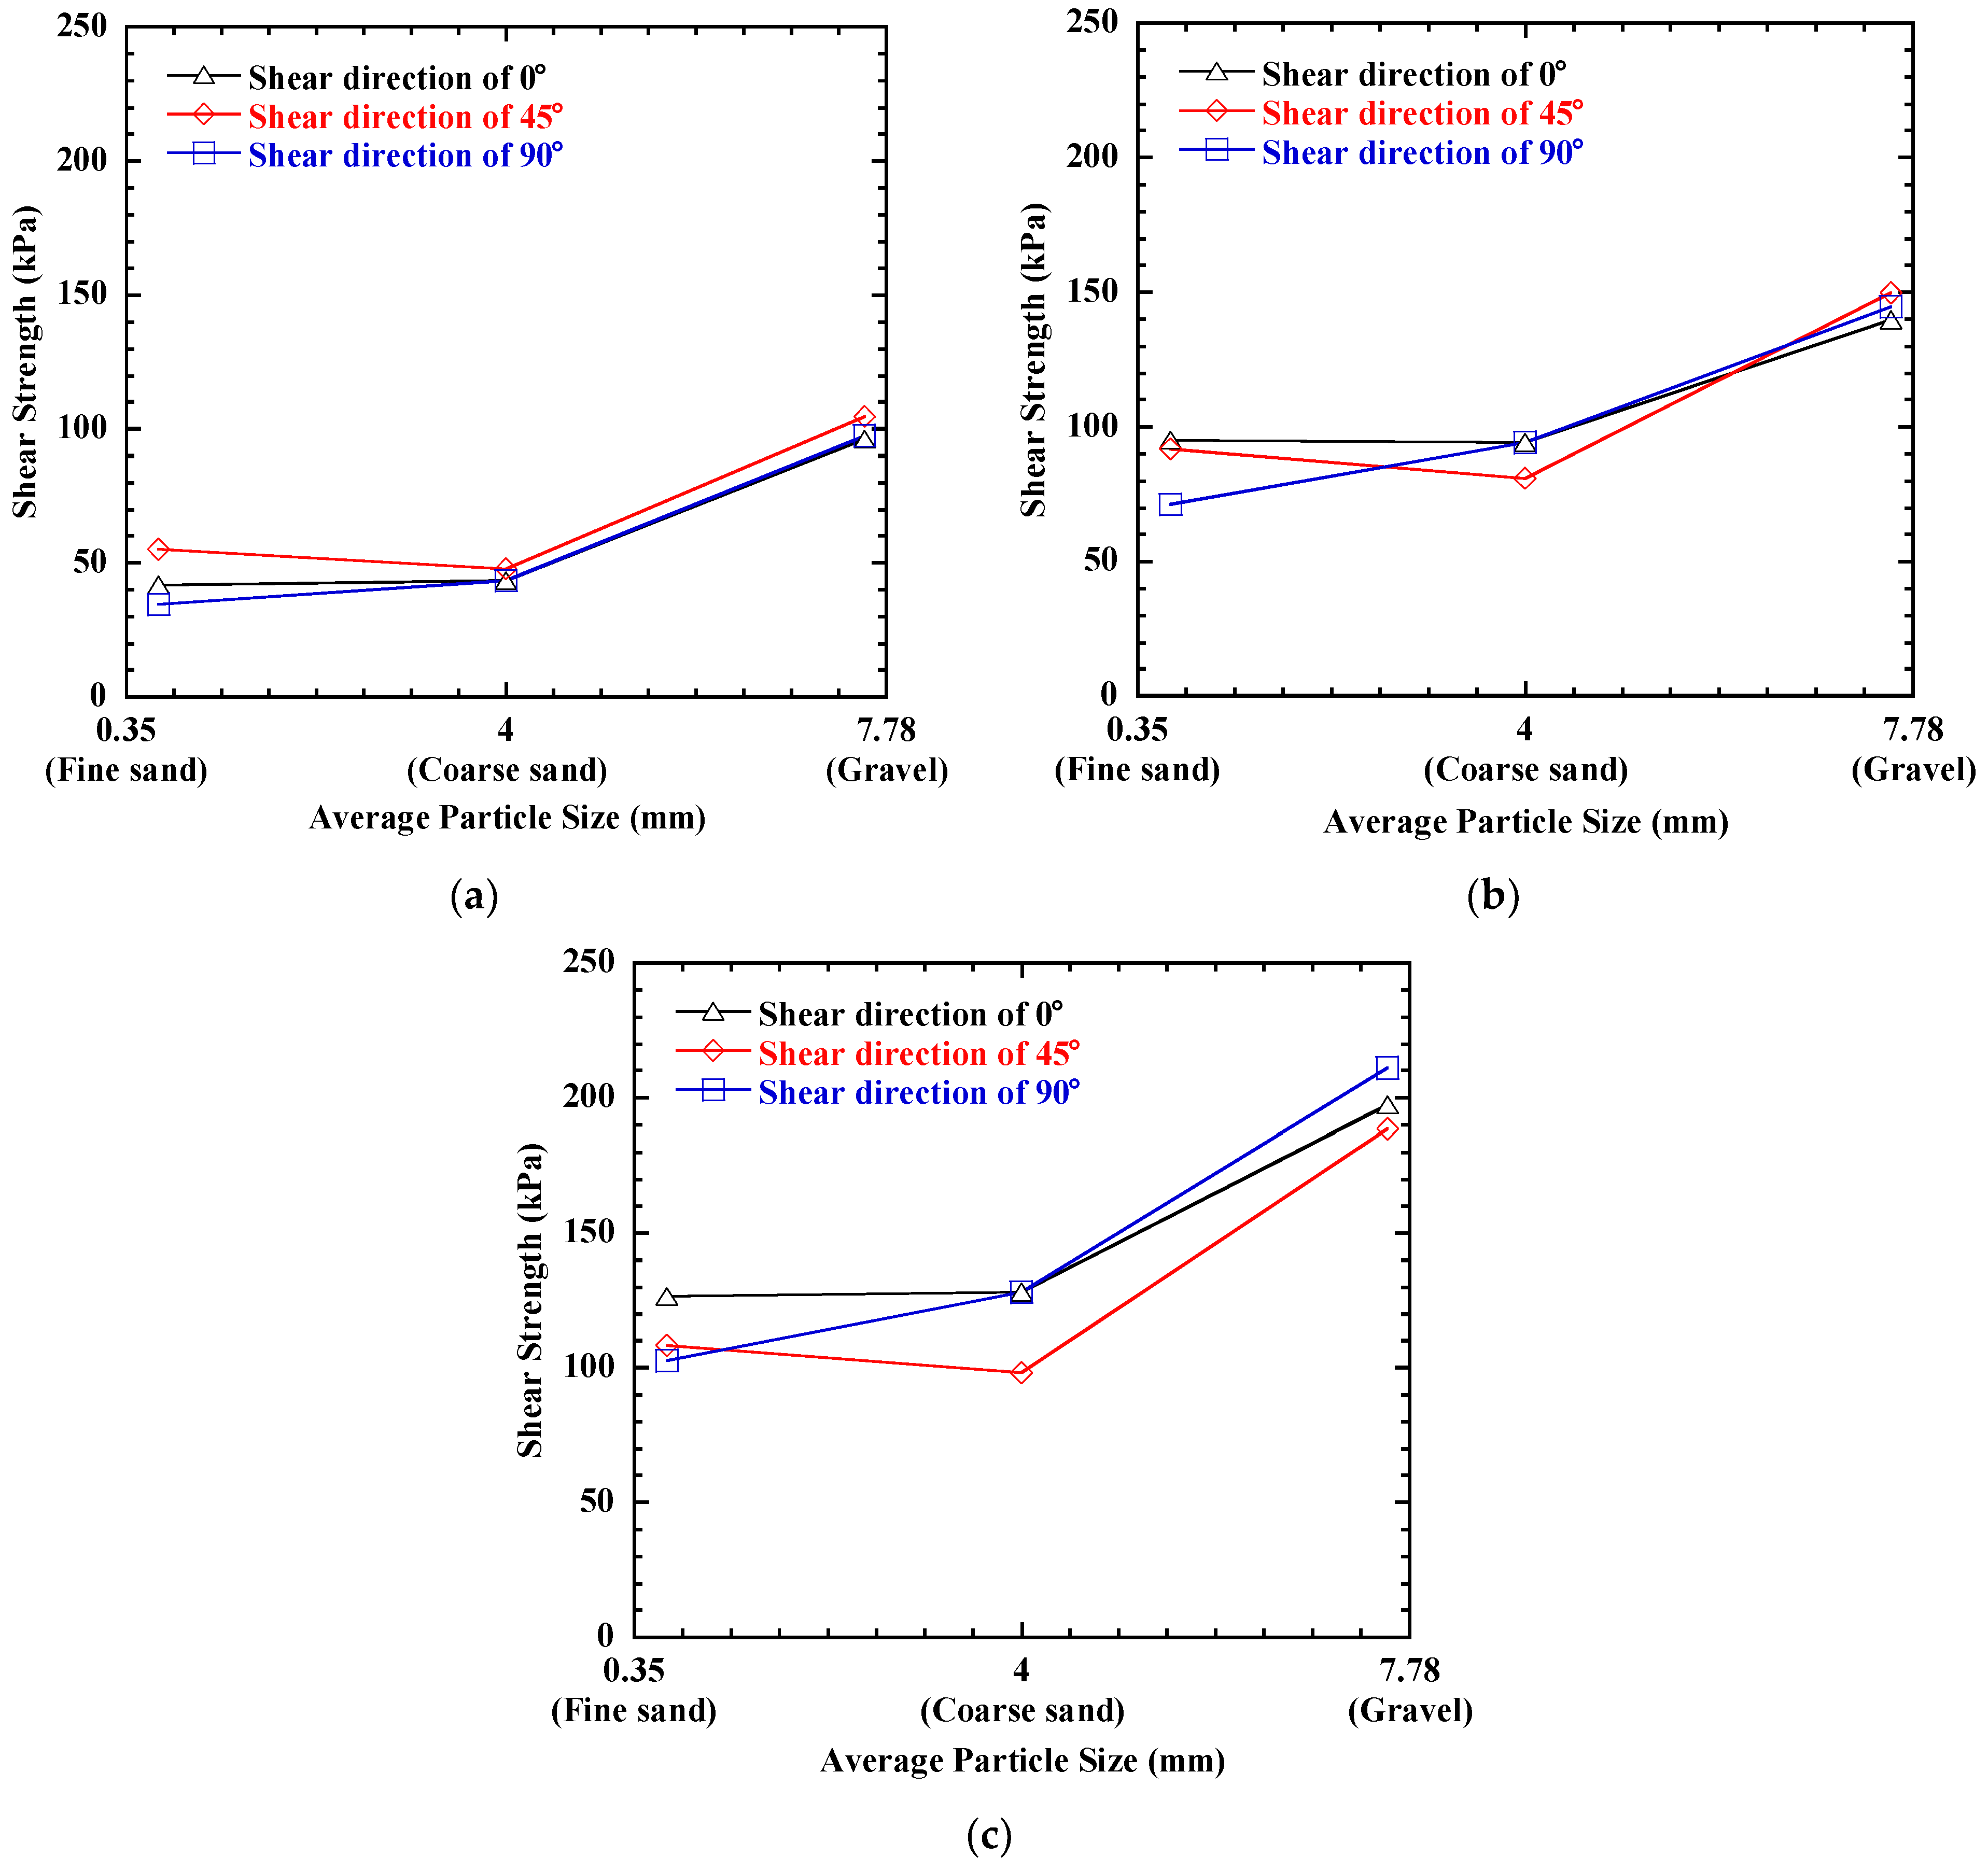
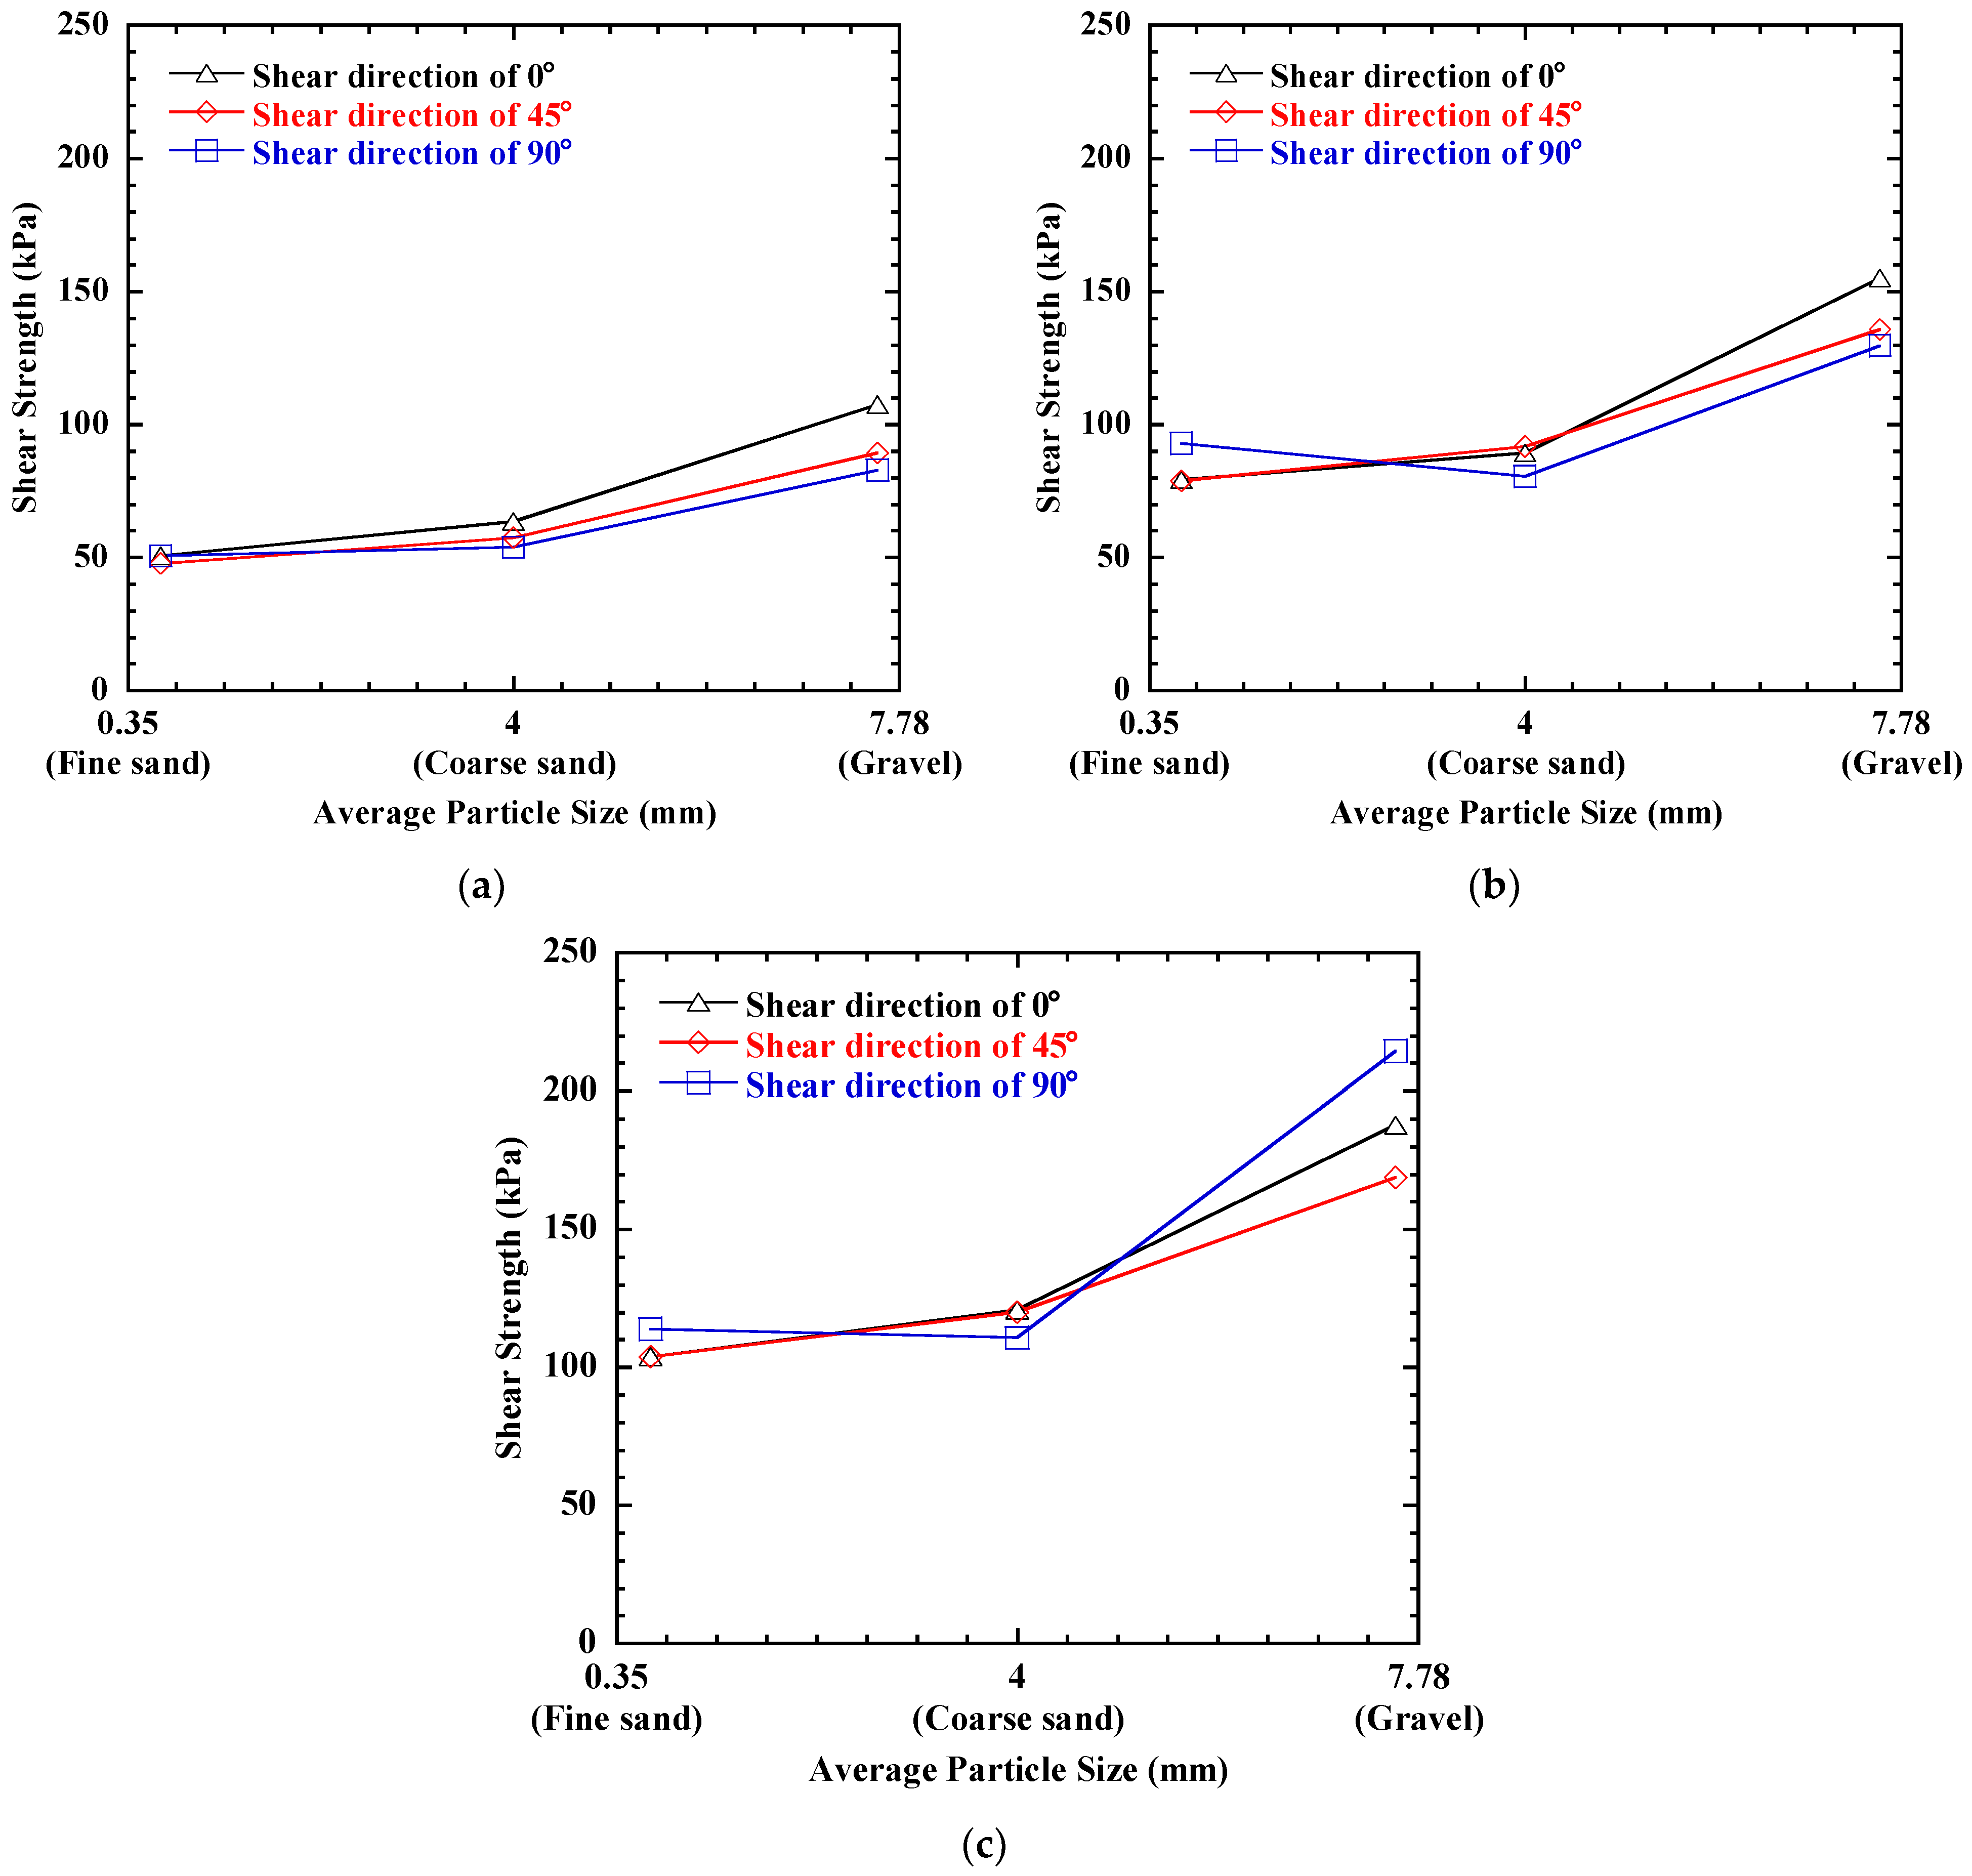
3.3. Influence of Particle Size

The results for coarse sand and gravel are presented to evaluate the influence of particle size on the anisotropic shear strength behavior of soil–geogrid interfaces. For the coarse sand, taking the biaxial geogrid SS40 and the triaxial geogrid TX150 as examples, the interface shear test results of coarse sand in different shear directions are shown in Figure 9 and Figure 10, respectively. The shear stress–shear strain curves of the coarse sand–biaxial geogrid (SS40) interface and the coarse sand–triaxial geogrid (TX150) interface both show that the shear stress remains stable, or has slight strain softening, after reaching the peak values, and that the strain softening behavior becomes more obvious with the increase in normal stress. However, the strain softening behavior of the shear stress–shear strain curves of the coarse sand–triaxial geogrid (TX150) interface is not as obvious as that of the coarse sand–biaxial geogrid (SS40).
The interface shear test results of gravel in different shear directions are shown in Figure 11 and Figure 12, respectively. The shear stress–shear strain curves of the gravel–biaxial geogrid (SS40) interface and gravel–triaxial geogrid (TX150) interface are nearly consistent with those for the coarse sand, with both showing different behavior between the soil–biaxial geogrid (SS40) interface and soil–triaxial geogrid (TX150) interface, which may be affected by the shape of the geogrid aperture. By comparing the shear stress–shear strain curves of fine sand, coarse sand and gravel, it can be observed that particle size has a significant influence on the interface stress–strain behavior. The shear stress–shear strain curves of the fine sand–geogrid interface show stress hardening, while the coarse sand–geogrid interface and gravel–geogrid interface show a certain degree of strain softening. This may be because the shear strength of the soil–geogrid interface largely depends on the interlocking effect between the geogrid aperture and soil particles, and this interlocking effect is closely related to particle size. Athanasopoulos [34] showed that with the improvement in the matching degree between the average particle size and the aperture size of the geotextile, the shear strength of the soil–geogrid interface obtained in the direct shear test also increases. In this study, the matching degree of the fine sand and the aperture size of the geogrid are obviously smaller than those of the coarse sand and gravel, resulting in a weaker interlocking effect. Due to the small particle size of fine sand, this interlocking effect is weak, and it gradually develops with the progress of shearing, it does not reach the peak value, and it manifests as strain hardening. However, for coarse sand and gravel with a larger particle size, this interlocking effect is strong, and reaches the peak value quickly with the progress of shearing. However, after reaching the peak value, the original interlocking mechanism is destroyed due to the continuous shear action, resulting in the reduction in shear strength, showing a certain degree of strain softening.
Figure 13 and Figure 14 show the influence of shear direction on the shear strength of coarse sand–geogrid interfaces and gravel–geogrid interfaces, respectively. The interface shear strength under the same normal stress varies with shear directions for all the biaxial and triaxial geogrids, which indicates anisotropic shear strength behavior of coarse sand–geogrid interfaces and gravel–geogrid interfaces. As the normal stress increases, the anisotropic shear strength behavior becomes more obvious. This is the opposite of the findings regarding fine sand. Because the particle size of fine sand is small, with increasing normal stress, the friction between the geogrid and soil interface plays a dominant role, while the friction along different shear directions has little difference, resulting in less obvious anisotropy. However, for coarse sand and gravel with a larger particle size, with the increase in normal stress, the interlocking between the geogrid and soil interface plays a dominant role, while the interlocking along different shear directions is greatly affected by the contact condition of the particles, resulting in more obvious anisotropy.
Figure 15 shows the influence of particle size on the shear strength of soil–biaxial geogrid (SS40) interfaces. It can be observed from Figure 15 that the interface shear strength of the three types of soils with different particle sizes all show anisotropy. As the particle size increases, the anisotropy behavior becomes less obvious. In Table 3, the percentages of shear strength variation range from 22.97% to 59.29% for fine sand–biaxial geogrid interfaces, and from 7.36% to 11.95% for gravel–biaxial geogrid interfaces.
Figure 16 shows the influence of particle size on the shear strength of soil–triaxial geogrid (TX150) interfaces, and the data are presented in Table 4. It can be observed that the anisotropy behavior of the interface shear strength becomes more obvious with the increase in particle size. As shown in Table 4, the percentages of shear strength variation range from 6.01% to 9.85% for fine sand–triaxial geogrid interfaces, and from 19.44% to 30.06% for gravel–triaxial geogrid interfaces. For the shear strength of soil–triaxial geogrid (TX150) interfaces and soil–biaxial geogrid (SS40) interfaces, this anisotropy behavior has the opposite law, which may be due to the influence of the geogrid aperture shape. Existing studies have shown that geogrids with triangular apertures are more effective than rectangular apertures due to the uniform stress distribution [31]. In addition, the triangular aperture has a more stable interlocking mechanism [29]. For biaxial geogrids, the stability of the square aperture structure is low. With the increase in particle size, the interlocking effect also increases, which restricts the deformation of the aperture structure, enhances the stability of the aperture structure, and reduces the anisotropy. However, the triangular aperture of the triaxial geogrid is more stable than that of the biaxial geogrid, and the restraint effect on soil particles is stronger. With the increase in particle size and the increasing interlocking effect, the damage effect on ribs and nodes is strengthened, which reduces the stability of the mesh structure and enhances the anisotropy. In conclusion, it can still be concluded that the particle size has a great influence on the anisotropy behavior of soil–geogrid interfaces.

4. Conclusions

This paper presented an experimental study on the anisotropic shear strength behavior of soil–geogrid interfaces. A series of interface shear tests were carried out for different biaxial geogrids and triaxial geogrids under the shear directions of 0°, 45° and 90°. The results, concerning the influences of shear direction and particle size on the shear strength behavior of soil–geogrid interfaces, are presented and discussed. The following conclusions are reached from the conditions of the study:
(1)
The interface shear strength under the same normal stress varies with shear directions for all biaxial and triaxial geogrids, which indicates the anisotropic shear strength behavior of soil–geogrid interfaces. The anisotropy decreases with the increase in normal stress because greater normal stress could generate a more stable interlocking structure between the soil particles and the geogrid aperture.
(2)
The percentages of shear strength variation could be relatively large (e.g., 59.59% for the soil–biaxial geogrid interface and 37.99% for the soil–triaxial geogrid interface). These large values indicate strong anisotropic shear strength behavior of soil–geogrid interfaces, which is ignored in the current soil–geosynthetic interface testing standard, but could be important for the safe design of reinforced soil structures.
(3)
The soil–biaxial geogrid interface shows stronger anisotropic shear strength behavior than the soil–triaxial geogrid interface. This is because the triangular aperture of the triaxial geogrid is more stable than the rectangular aperture of the biaxial geogrid, which makes the soil–triaxial geogrid interaction less sensitive to shear direction. The stable aperture shape of the triaxial geogrid could improve the interlocking effect between the soil particles and geogrid apertures, and thus show less anisotropic shear strength behavior for the soil–triaxial geogrid interface.
(4)
As the particle size increases, the friction and interlocking between the soil and geogrid plays a more significant role. Particle size also has a great influence on the anisotropy behavior of soil–geogrid interfaces. With the increase in particle size, the anisotropy behavior of the soil–triaxial geogrid interface becomes stronger, but the anisotropy behavior of the soil–biaxial geogrid interface becomes weaker.

Author Contributions

Conceptualization, J.Z.; methodology, M.J.; formal analysis, Y.J.; investigation, C.W.; resources, C.M.; data curation, Y.J.; writing—original draft preparation, J.Z.; writing—review and editing, M.J. and Y.Z.; supervision, Y.Z.; project administration, Z.Z.; funding acquisition, J.Z. All authors have read and agreed to the published version of the manuscript.

Funding

This work is funded by the National Key R&D Program of China (Grant Number: 2018YFB1600100).

Institutional Review Board Statement

Not applicable.

Informed Consent Statement

Not applicable.

Data Availability Statement

Not applicable.

Acknowledgments

This work is funded by the National Key R&D Program of China (Grant Number: 2018YFB1600100). The authors are grateful for the financial support.

Conflicts of Interest

The authors declare no conflict of interest.

References

  1. Han, J.; Gabr, M.A. Numerical analysis of geosynthetic-reinforced and pile-supported earth platforms over soft soil. J. Geotech. Geoenviron. Eng. 2002, 128, 44–53. [Google Scholar] [CrossRef]
  2. Ling, H.I.; Mohri, Y.; Leshchinsky, D.; Burke, C.; Matsushima, K.; Liu, H. Large-scale shaking table tests on modular block reinforced soil retaining walls. J. Geotech. Geoenviron. Eng. 2005, 131, 465–476. [Google Scholar] [CrossRef]
  3. Bathurst, R.J.; Vlachopoulos, N.; Walters, D.L.; Burgess, P.G.; Allen, T.M. The influence of facing stiffness on the performance of two geosynthetic reinforced soil retaining walls. Can. Geotech. J. 2006, 43, 1225–1237. [Google Scholar] [CrossRef]
  4. Leshchinsky, B.; Xie, Y. MSE walls as bridge abutments: Optimal reinforcement density. Geotext. Geomembr. 2015, 43, 128–138. [Google Scholar]
  5. Rowe, R.K.; Liu, K.W. Three-dimensional finite element modelling of a full-scale geosynthetic-reinforced, pile-supported embankment. Can. Geotech. J. 2015, 52, 2041–2054. [Google Scholar] [CrossRef]
  6. Zheng, Y.; McCartney, J.S.; Shing, P.B.; Fox, P.J. Physical model tests of half-scale geosynthetic reinforced soil bridge abutments. II: Dynamic loading. J. Geotech. Geoenviron. Eng. 2019, 145, 04019095. [Google Scholar] [CrossRef] [Green Version]
  7. Palmeira, E.M. Soil-geosynthetic interaction: Modelling and analysis. Geotext. Geomembr. 2009, 27, 368–390. [Google Scholar] [CrossRef]
  8. Wang, Z.; Jacobs, F.; Ziegler, M. Experimental and DEM investigation of geogrid-soil interaction under pullout loads. Geotext. Geomembr. 2016, 44, 230–246. [Google Scholar] [CrossRef]
  9. Lopes, M.L.; Ladeira, M. Role of specimen geometry, soil height, and sleeve length on the pull-out behaviour of geogrids. Geosynth. Int. 1996, 3, 701–719. [Google Scholar] [CrossRef]
  10. Palmeira, E.M. Loading force mobilisation in pull-out tests on geogrids. Geotext. Geomembr. 2004, 22, 481–509. [Google Scholar] [CrossRef]
  11. Vieira, C.S.; Lopes, M.L.; Caldeira, L.M. Sand-geotextile interface characterisation through monotonic and cyclic direct shear tests. Geosynth. Int. 2013, 20, 26–38. [Google Scholar] [CrossRef]
  12. Hatami, K.; Esmaili, D. Unsaturated soil–woven geotextile interface strength properties from small-scale pullout and interface tests. Geosynth. Int. 2015, 22, 161–172. [Google Scholar] [CrossRef]
  13. Mosallanezhad, M.; Alfaro, M.C.; Hataf, N.; Sadat Taghavi, S.H. Performance of the new reinforcement system in the increase of shear strength of typical geogrid interface with soil. Geotext. Geomembr. 2016, 44, 457–462. [Google Scholar] [CrossRef]
  14. Morsy, A.M.; Zornberg, J.G.; Han, J.; Leshchinsky, D. A new generation of soil-geosynthetic interaction experimentation. Geotext. Geomembr. 2019, 47, 459–476. [Google Scholar] [CrossRef]
  15. Morsy, A.M.; Zornberg, J.G.; Han, J.; Leshchinsky, D.; Han, J. Soil-reinforcement interaction: Effect of reinforcement spacing and normal stress. J. Geotech. Geoenviron. Eng. 2019, 145, 04019115. [Google Scholar] [CrossRef]
  16. Swan, R.H., Jr.; Lovell, C.W. Interaction between tire shreds, rubber-sand and geosynthetics. Geosynth. Int. 1997, 4, 623–643. [Google Scholar]
  17. Perkins, S.W.; Cuelho, E.V. Soil-geosynthetic interface strength and stiffness relationships from pullout tests. Geosynth. Int. 1999, 6, 321–346. [Google Scholar] [CrossRef]
  18. Lee, K.M.; Manjunath, V.R. Soil-geotextile interface friction by direct shear tests. Can. Geotech. J. 2000, 37, 238–252. [Google Scholar] [CrossRef]
  19. Abu-Farsakh, M.; Coronel, J.; Tao, M. Effect of soil moisture content and dry density on cohesive soil-geosynthetic interactions using large direct shear tests. J. Mater. Civ. Eng. 2007, 19, 540–549. [Google Scholar] [CrossRef]
  20. Liu, C.N.; Ho, Y.H.; Huang, J.W. Large scale direct shear tests of soil/PET-yarn geogrid interfaces. Geotext. Geomembr. 2009, 27, 19–30. [Google Scholar] [CrossRef]
  21. Liu, C.N.; Zornberg, J.G.; Chen, T.C.; Ho, Y.H.; Lin, B.H. Behavior of geogrid-sand interface in direct shear mode. J. Geotech. Geoenviron. Eng. 2009, 135, 1863–1871. [Google Scholar] [CrossRef]
  22. Sayeed, M.M.A.; Ramaiah, B.J.; Rawal, A. Interface shear characteristics of jute/polypropylene hybrid nonwoven geotextiles and sand using large size direct shear test. Geotext. Geomembr. 2014, 42, 63–68. [Google Scholar] [CrossRef]
  23. Ferreira, F.B.; Vieira, C.S.; Lopes, M.L. Direct shear behaviour of residual soil-geosynthetic interfaces-influence of soil moisture content, soil density and geosynthetic type. Geosynth. Int. 2015, 22, 257–272. [Google Scholar] [CrossRef]
  24. Vangla, P.; Gali, M.L. Effect of particle size of sand and surface asperities of reinforcement on their interface shear behaviour. Geotext. Geomembr. 2016, 44, 254–268. [Google Scholar] [CrossRef]
  25. Abdi, M.R.; Mirzaeifar, H. Experimental and PIV evaluation of grain size and distribution on soil-geogrid interactions in pullout test. Soils Found. 2017, 57, 1045–1058. [Google Scholar] [CrossRef]
  26. Wang, H.L.; Chen, R.P.; Liu, Q.W.; Kang, X.; Wang, Y.W. Soil–geogrid interaction at various influencing factors by pullout tests with applications of FBG sensors. J. Mater. Civ. Eng. 2019, 31, 04018342. [Google Scholar] [CrossRef]
  27. Liu, F.Y.; Wang, P.; Geng, X.; Wang, J.; Lin, X. Cyclic and post-cyclic behaviour from sand–geogrid interface large-scale direct shear tests. Geosynth. Int. 2016, 23, 129–139. [Google Scholar] [CrossRef]
  28. Wang, J.; Liu, F.Y.; Wang, P.; Cai, Y.Q. Particle size effects on coarse soil-geogrid interface response in cyclic and post-cyclic direct shear tests. Geotext. Geomembr. 2016, 44, 854–861. [Google Scholar] [CrossRef]
  29. Sweta, K.; Hussaini, S.K.K. Effect of shearing rate on the behavior of geogrid-reinforced railroad ballast under direct shear conditions. Geotext. Geomembr. 2018, 46, 251–256. [Google Scholar] [CrossRef]
  30. ASTM International. ASTM D5321-20. In Standard Test Method for Determining the Shear Strength of Soil-Geosynthetic and Geosynthetic-Geosynthetic Interfaces by Direct Shear; ASTM International: West Conshohocken, PA, USA, 2021. [Google Scholar]
  31. Dong, Y.L.; Han, J.; Bai, X.H. Numerical analysis of tensile behavior of geogrids with rectangular and triangular apertures. Geotext. Geomembr. 2011, 29, 83–91. [Google Scholar] [CrossRef]
  32. Zornberg, J.G.; Ferreira, J.A.Z.; Roodi, G.H. Experimental Results on Soil-Geosynthetic Interaction Stiffness; Report No. FHWA/TX-12/5-4829-01-3; Center for Transportation Research (CTR): Austin, TX, USA, 2012. [Google Scholar]
  33. Roodi, G.H.; Zornberg, J.G.; Aboelwafa, M.M.; Phillips, J.R.; Zheng, L.; Martinez, J. Soil-Geosynthetic Interaction Test to Develop Specifications for Geosynthetic Stabilized Roadways; Report No. FHWA/TX-18/5-4829-03-1; Center for Transportation Research (CTR): Austin, TX, USA, 2018. [Google Scholar]
  34. Athanasopoulos, G.A. Effect of particle size on the mechanical behavior of sand-geotextile composite. Geotext. Geomembr. 1993, 12, 255–273. [Google Scholar] [CrossRef]
  35. Lopes, M.J.; Lopes, M.L. Soil-geosynthetic interaction—Influence of soil particle size and geosynthetic structure. Geosynth. Int. 1999, 6, 261–282. [Google Scholar] [CrossRef]
Figure 1. Gravel used in the direct shear test.
Applsci 11 11387 g001
Figure 2. Interface shear test apparatus.
Applsci 11 11387 g002
Figure 3. Geogrid specimen and shear direction. (a) Biaxial geogrid, (b) triaxial geogrid.
Applsci 11 11387 g003
Figure 4. Shear stress–strain curves for fine sand–biaxial geogrid (SS30) interfaces. (a) Shear direction of 0°, (b) shear direction of 45°, (c) shear direction of 90°.
Applsci 11 11387 g004
Figure 5. Shear stress–strain curves for fine sand–triaxial geogrid (TX160) interfaces. (a) Shear direction of 0°, (b) shear direction of 45°, (c) shear direction of 90°.
Applsci 11 11387 g005
Figure 6. Strength envelopes for fine sand–biaxial geogrid (SS30) interfaces and fine sand–triaxial geogrid (TX160) interfaces. (a) SS30, (b) TX160.
Applsci 11 11387 g006
Figure 7. The influence of shear direction on the shear strength of fine sand–biaxial geogrid interfaces. (a) SS20, (b) SS30, (c) SS40.
Applsci 11 11387 g007aApplsci 11 11387 g007b
Figure 8. The influence of shear direction on the shear strength of fine sand–triaxial geogrid interfaces. (a) TX150, (b) TX160, (c) TX170.
Applsci 11 11387 g008
Figure 9. Shear stress–strain curves for coarse sand–biaxial geogrid (SS40) interfaces. (a) Shear direction of 0°, (b) shear direction of 45°, (c) shear direction of 90°.
Applsci 11 11387 g009
Figure 10. Shear stress–strain curves for coarse sand–triaxial geogrid (TX150) interfaces. (a) Shear direction of 0°, (b) shear direction of 45°, (c) shear direction of 90°.
Applsci 11 11387 g010
Figure 11. Shear stress–strain curves for gravel–biaxial geogrid (SS40) interfaces. (a) Shear direction of 0°, (b) shear direction of 45°, (c) shear direction of 90°.
Applsci 11 11387 g011
Figure 12. Shear stress–strain curves for gravel–triaxial geogrid (TX150) interfaces. (a) Shear direction of 0°, (b) shear direction of 45°, (c) shear direction of 90°.
Applsci 11 11387 g012
Figure 13. The influence of shear direction on the shear strength of coarse sand–biaxial geogrid (SS40) and coarse sand–triaxial geogrid (TX150) interfaces. (a) SS40, (b) TX150.
Applsci 11 11387 g013
Figure 14. The influence of shear direction on the shear strength of gravel–biaxial geogrid (SS40) and gravel–triaxial geogrid (TX150) interfaces. (a) SS40, (b) TX150.
Applsci 11 11387 g014
Figure 15. The influence of particle size on the shear strength of soil–biaxial geogrid (SS40) interfaces. (a) Normal stress of 50 kPa, (b) normal stress of 100 kPa, (c) mormal stress of 150 kPa.
Applsci 11 11387 g015
Figure 16. The influence of particle size on the shear strength of soil–triaxial geogrid (TX150) interfaces. (a) Normal stress of 50 kPa, (b) normal stress of 100 kPa, (c) normal stress of 150 kPa.
Applsci 11 11387 g016
Table 1. Tensile strength of geogrids for loading in different directions (kN/m).
GeogridDirection of Tensile Loading
22.5°45°67.5°90°
SS2026.2917.9010.7217.9826.68
SS3033.9722.1412.9521.5034.58
SS4048.2628.2917.9829.5347.82
TX15015.9713.1512.8312.2617.55
TX16021.5716.2013.4713.8119.28
TX17023.8221.4322.3921.7125.15
Table 2. Percentages of shear strength variation (%) for fine sand–biaxial geogrid interfaces and fine sand–triaxial geogrid interfaces.
GeogridNormal Stress (kPa)
50100150200
SS2041.5518.1413.590.68
SS3011.7229.0111.6511.52
SS4059.2933.1922.9736.15
TX1506.0118.039.8514.00
TX16037.9916.2022.6010.20
TX17029.3911.627.8311.42
Table 3. Percentages of shear strength variation (%) for fine sand–biaxial geogrid, coarse sand–biaxial geogrid and gravel–biaxial geogrid interfaces.
ParticleNormal Stress (kPa)
50100150
Fine sand59.2933.1822.97
Coarse sand10.5116.2130.67
Gravel8.747.3611.95
Table 4. Percentages of shear strength variation (%) for fine sand–triaxial geogrid, coarse sand–triaxial geogrid and gravel–triaxial geogrid interfaces.
ParticleNormal Stress (kPa)
50100150
Fine sand6.0118.039.85
Coarse sand17.5414.259.12
Gravel30.0619.4427.24
Publisher’s Note: MDPI stays neutral with regard to jurisdictional claims in published maps and institutional affiliations.

