Article

A Method for Gradient Differentiable Network Architecture Search by Selecting and Clustering Candidate Operations

Department of Computer Engineering, Hongik University, Seoul 04066, Korea
Appl. Sci. 2021, 11(23), 11436; https://doi.org/10.3390/app112311436
Submission received: 25 October 2021 / Revised: 26 November 2021 / Accepted: 29 November 2021 / Published: 2 December 2021
(This article belongs to the Section Computing and Artificial Intelligence)

Abstract

:
The current evolution of deep learning requires further optimization in terms of accuracy and time. From the perspective of new requirements, AutoML is an area that could provide possible solutions. AutoML has a neural architecture search (NAS) field. DARTS is a widely used approach in NAS and is based on gradient descent; however, it has some drawbacks. In this study, we attempted to overcome some of the drawbacks of DARTS by improving the accuracy and decreasing the search cost. The DARTS algorithm uses a mixed operation that combines all operations in the search space. The architecture parameter of each operation comprising a mixed operation is trained using gradient descent, and the operation with the largest architecture parameter is selected. The use of a mixed operation causes a problem called vote dispersion: similar operations share architecture parameters during gradient descent; thus, there are cases where the most important operation is disregarded. In this selection process, vote dispersion causes DARTS performance to degrade. To cope with this problem, we propose a new algorithm based on DARTS called DG-DARTS. Two search stages are introduced, and the clustering of operations is applied in DG-DARTS. In summary, DG-DARTS achieves an error rate of 2.51% on the CIFAR10 dataset, and its search cost is 0.2 GPU days because the search space of the second stage is reduced by half. The speed-up factor of DG-DARTS to DARTS is 6.82, which indicates that the search cost of DG-DARTS is only 13% that of DARTS.

1. Introduction

Neural architecture search (NAS) is an algorithm that automatically finds the optimal model architecture, and it is a field of automatic machine learning (AutoML), which has been recently gaining attention. NAS enables automatic design of the model architecture rather than manually running hyperparameters of models. NASNet [1], which laid the foundation of NAS, searches architecture with 500 GPUs in four days (1800 GPU-days) among 10 15 possibly generatable architectures. Therefore, current NAS algorithms have evolved to reduce the search space and select operations with changes in criteria to decrease the search cost and increase performance.
Early NAS algorithms, including reinforcement learning [2] and evolutionary algorithms [1], had huge search costs, up to thousands and hundreds of GPU days, whereas gradient-descent-based DARTS [3] have shown a remarkable accuracy with only four GPU days over one 1 GPU compared to existing methods. DARTS uses the idea of a cell-based architecture defined in NASNet [1] to find the best network architecture. The final architecture found by DARTS has multiple stacks of the same struct cell, which is composed of multiple nodes. Each node is connected by operations selected from the candidate operations. DART aims to determine the shape of the directed acyclic graph (DAG) of the nodes composing the cell architecture, and to select the operations used on each edge. Mixed operations, which include every candidate operation, are generated and used on the edges connecting the nodes. With the progression of the training step, each operation comprising a mixed operation is changed. When the training is completed, one of the operations that has the largest architecture parameter is selected, and then the cell architecture is decided. The stacks of the cells comprise the final model.
The current DARTS experiences the problem of vote dispersion, as described in Section 3.1. In this study, our goal was to solve the vote dispersion problem in DARTS in order to reduce the error in the final model and decrease the GPU cost. Therefore, we propose differential group-differentiable architecture search (DG-DARTS ) in this paper.
The rest of this article is organized as follows: Section 2 describes related works, especially focusing on DARTS. Section 3 provides a description of DARTS and discusses previous works, along with their relationships. In Section 4, we present the experimental environment details and results. Section 5 discusses the major benefits of our research in comparison to existing results. Finally, in Section 6, we conclude the paper.

2. Related Works

With the rapid development of deep learning, an area of AutoML has emerged. Neural architecture search (NAS), which is an automated design of artificial neural networks, is replacing the manual design of neural networks in order to solve desired tasks. NAS initially uses early reinforcement learning [1,2,4], with the evolutionary algorithm [5] and Bayesian optimization [6] being the major methodologies employed.
DARTS [3] based on gradient descent is one of the bases for our research. The model weights w and architecture parameters are toggled, and gradient descent is used for training in DARTS; however, DARTS has several drawbacks owing to its training method. Studies on overcoming these limitations are ongoing.
P-DARTS [7] continuously searches architectures for the number of cells in three stages to solve the depth gap problem. The depth gap problem occurs because DARTS finds a 20-cell model from an 8-cell search network. PC-DARTS [8] decreases the memory burden by partially connecting the channels in the networks; then, it can increase the batch four times, thus decreasing the search cost to one-quarter. DART+ [9] prevents the collapse phenomenon, which dramatically increases the number of skip connections by analyzing the number of skip connections and the final architecture performance. This means that the number of skip connections and the number of training epochs are decreased using methods such as early stopping.
Fair DARTS [10] applies methods such as changing the activation and loss functions to solve the selection of skip connections due to an unfair advantage in an exclusive competition. StacNAS [11] attempts to solve the bi-level optimization of DARTS. Before training, the feature maps of the candidate operations are acquired by creating a feature-map-focused model and then a correlation coefficient among the feature maps of each operation to group operations. Subsequently, representative operations of each group and operations of the winner operation groups are used to train the model weight and architecture parameters.
The abovementioned related works can be divided into two branches in order to overcome shortages of DARTS: adopting a new architecture search algorithm [7,8,9] or changing the activation or loss functions for DARTS [10,11]. Our method can be categorized into the former branch. Our method reuses most of the features of DARTS such as search space, methodology, functions, hyperparameter, and so on.
We focused on the stage division of existing DARTS and operation selection in order to find a solution to the vote dispersion problem and to obtain reliable results with minimum changes to the existing DARTS methodology.
We suppose the goal of DG-DARTS, unlike StacNAS, which pre-changes the search space, is to create a new search space in the process of training based on NASNet [1]. Through this approach, we can solve the vote dispersion problem by grouping operations for a new dataset and a new candidate operations set. By solving the vote dispersion problem, we can avoid eliminating the required operations. In other words, the types of required operations are selected using the weight sum per group, even though similar types of operations exist in the search space.

3. DG-DARTS

3.1. Vote Dispersion Problem

For architecture search, DARTS [3] generates a search network with a stack of eight cells in which every operation in the search space is combined, and this combination of operations is the mixed operation. There can be multiple instances of mixed operations in DARTS. Using the search network, the architecture parameter α of the mixed operations changes as the training of the dataset progresses. When the training is complete, the operation with the largest α is selected among k operations in the search space, where k is the number of predefined operations; k = 8 in this study. In other words, the operation of the cells is decided with the largest α .
o i , j = a r g max o O ,   o n o n e α o i , j
For the sake of the reader’s convenience, Algorithm 1 for DARTS is cited from [3].
Algorithm 1 DARTS—Differentiable Architecture Search
1:
Create operation search space o ¯ ( i , j ) parameterized by α ( i , j ) for each edge ( i , j )
2:
while  not converged  do
3:
    Update architecture α by descending α L v a l ( w α L t r a i n ( w , α ) , α )
4:
    Update weights w by descending w L t r a i n ( w , α )
5:
end while
6:
Derive the final architecture based on learned α .
A negative phenomenon can occur: the weights of the appropriate operation could be dispersed, and irrelevant operations for an edge can be selected. This occurs because an invalid operation can have a higher weight than an adequate operation. The weights of several similar, adequate operations are divided once all such operations are considered important. In this paper, we refer to these phenomena as the vote dispersion problem.
Definition 1.
Vote Dispersion: Votes for the weight of meaningful but similar operations happen to be dispersed, and the weight of a meaningful operation becomes lower than that of a meaningless operation.
Thus, the possibility exists that meaningless operations can be selected because of the vote dispersion problem.
Many NAS algorithms, including NASNet [1], search the search spaces to determine appropriate operations composing cells. Examples of such operations are convolution, pooling, and skip connections. There are groups of operations with similar computation outputs in the search space, such as {max pool and average pool}. The possibility exists of a vote dispersion problem under such conditions, and DARTS cannot avoid this problem because it uses the same search space as NASNet. In this study, our goals were to solve the vote dispersion problem experienced by DARTS, to increase the performance of the final architecture, and to decrease the search cost.

3.2. DG-DARTS Method

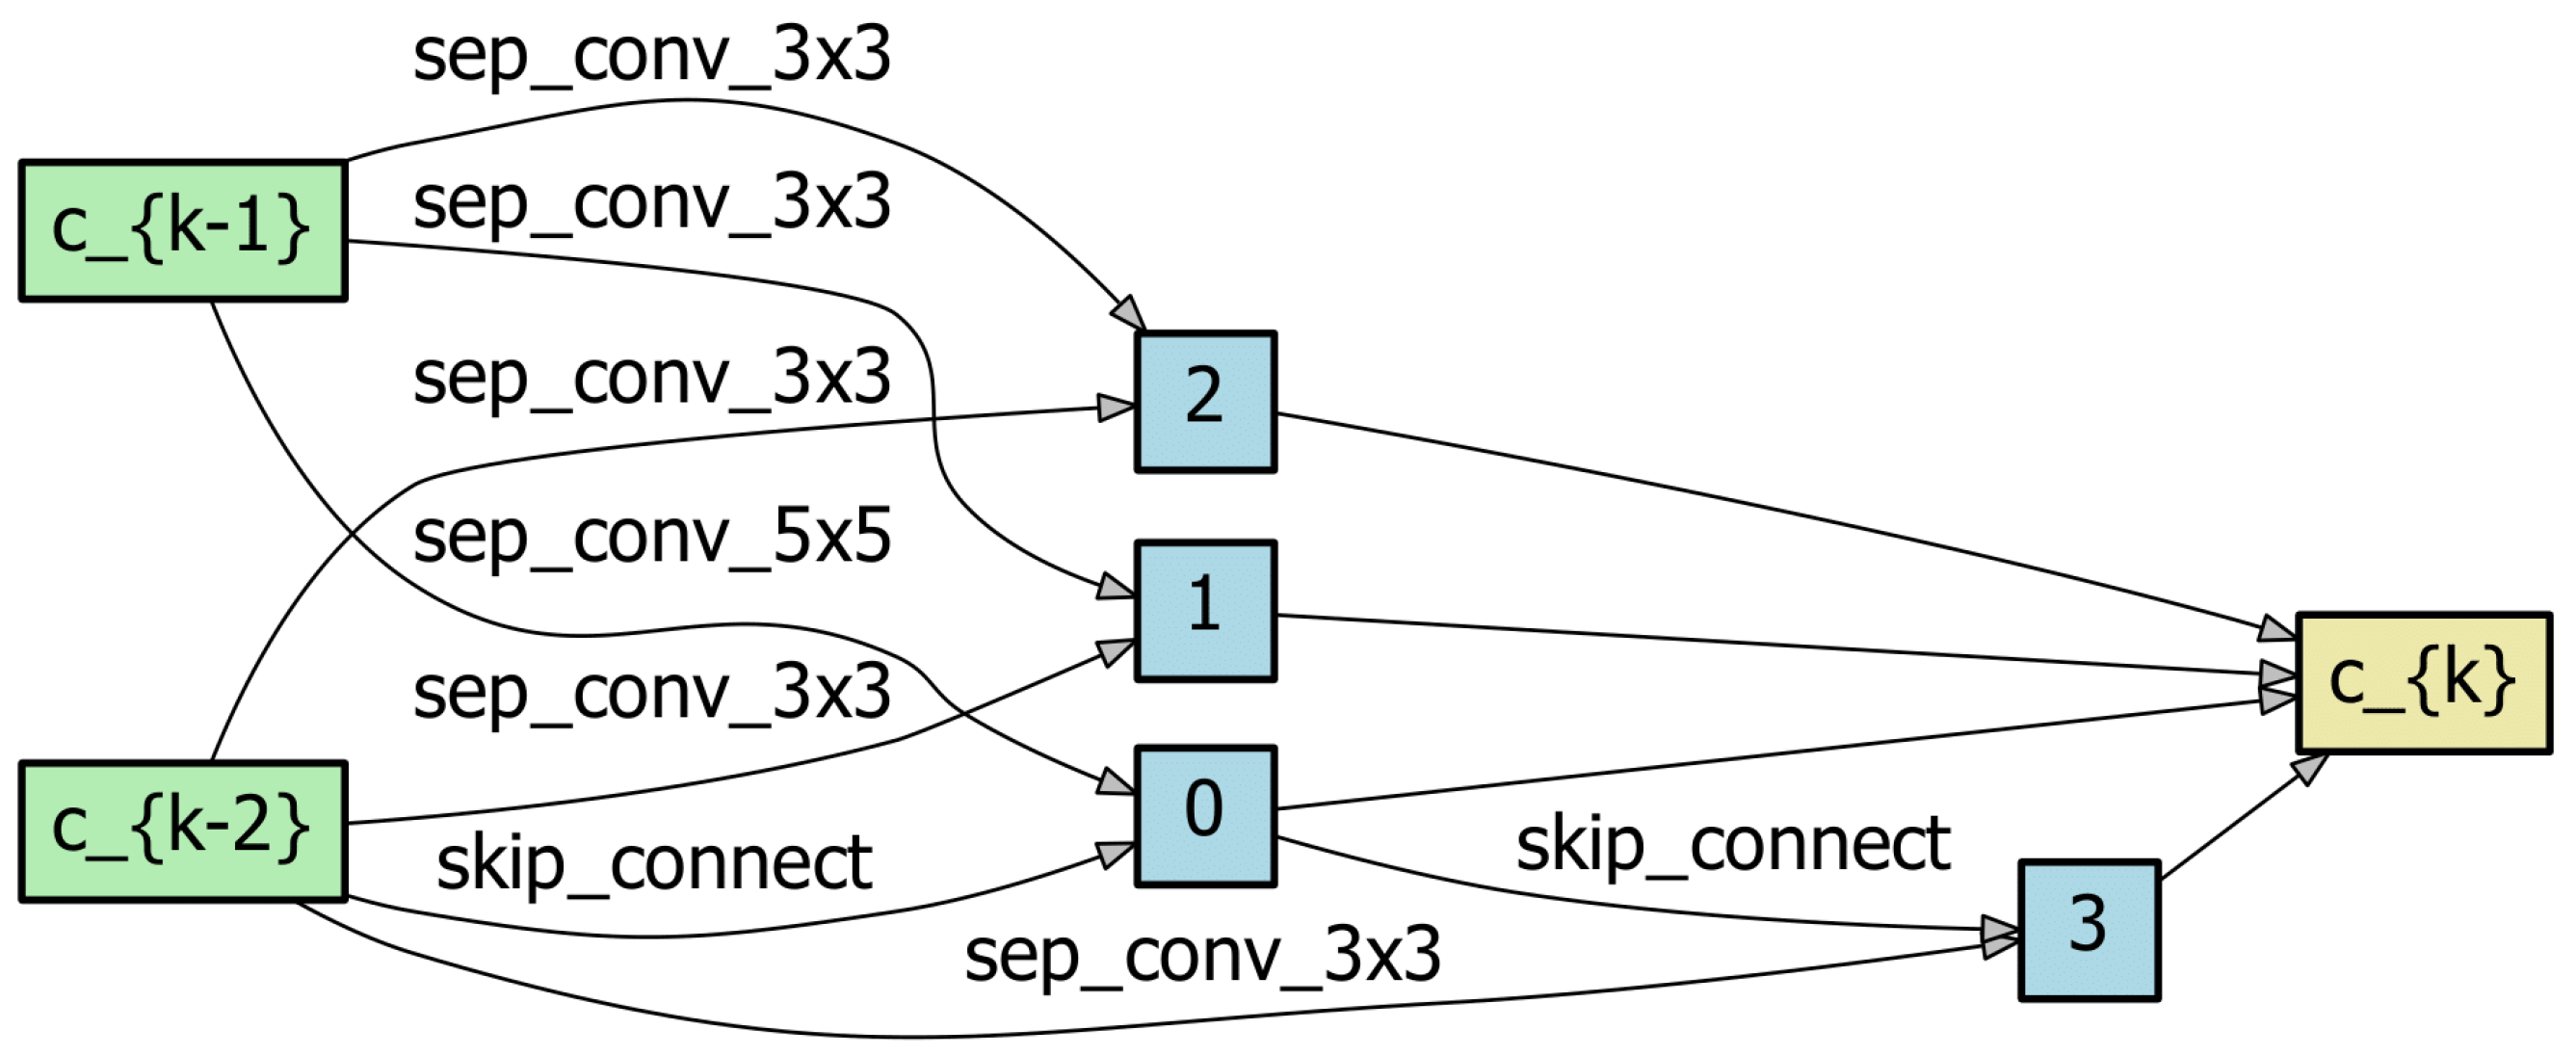
Figure 1 and Algorithm 2 show the process of DG-DART developed in this study. DG-DARTS has parameters and search space that are the same as those of DARTS. Applying Algorithm 2, the top-k operations with the largest architecture parameter are selected, and then, the final cells are decided. In this study, k = 1, as shown in 
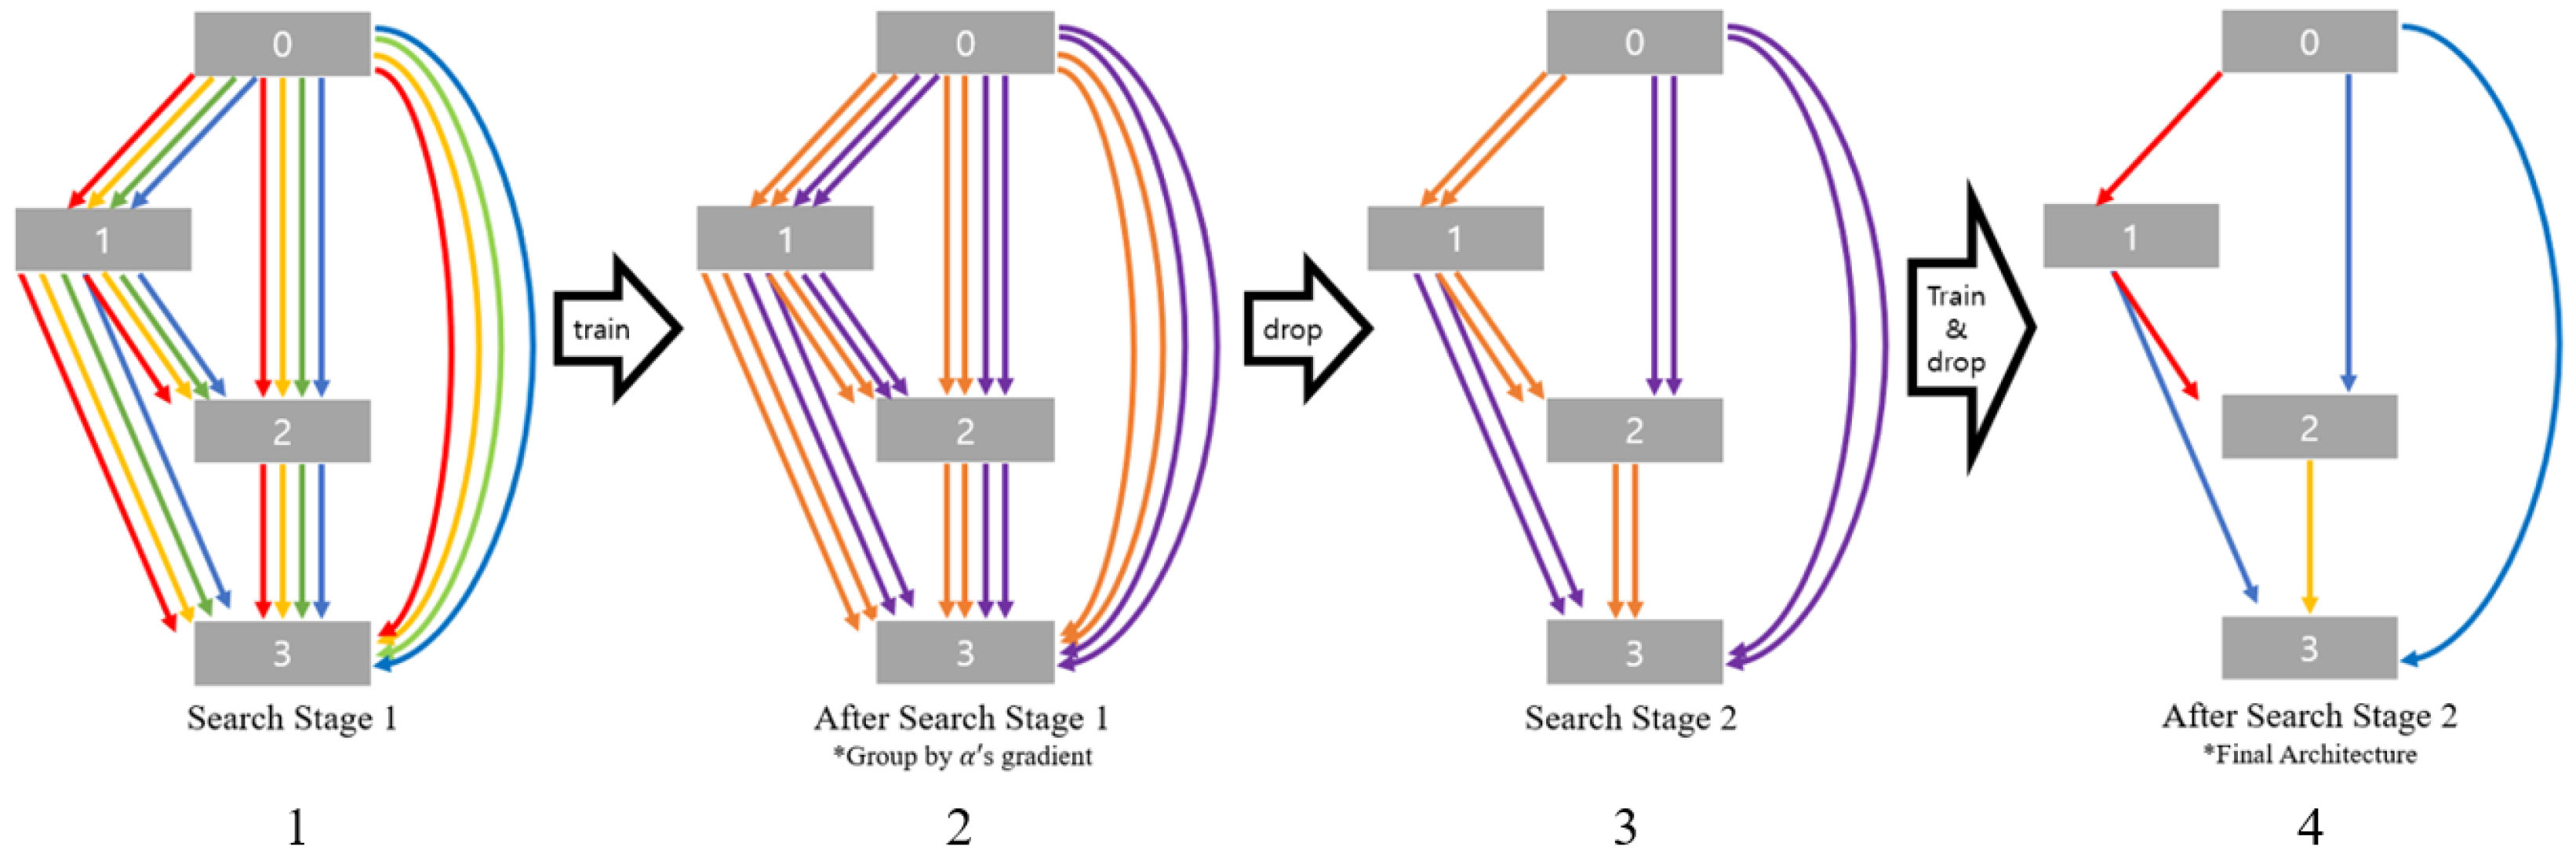
Figure 1. Another view of the DG-DARTS algorithm is shown in Figure 2. The following are the primary distinctions between Algorithm 1 of DARTS and Algorithm 2 of DG-DARTS:
  • DARTS does not use separate stages, whereas DG-DARTS has two stages.
  • Operations in DG-DARTS are clustered between stages 1 and 2, whereas DARTS does not use the concept of clustering.
  • In DG-DARTS, operation search space is newly created for stage 2 by clustering results.
  • In DG-DARTS, total epochs are divided by two, and each half of the total epochs is separated into two stages.
Figure 1. Process of architecture search with multiple search stages.
Applsci 11 11436 g001
Algorithm 2 Process of DG-DARTS
1:
Create operation search space O
2:
Determine number of epochs to be processed (epochs = 50 in this experiment)
3:
initial epoch = 0
4:
Stage 1 by using O
5:
while  e p o c h < e p o c h s / 2   do
6:
    Update architecture α by descending α L v a l ( w , α )
7:
    Update weights w by descending w L t r a i n ( w , α )
8:
    epoch = epoch + 1
9:
end while
10:
Cluster by criteria of gradient of architecture parameter α over training epochs
11:
Sum each α of clusters
12:
Select one-half of the operations from O , prioritizing the cluster with a larger sum of α
13:
Create a new operation search space O by selecting | O | / 2 operations in  O
14:
Stage 2 by using O
15:
while  e p o c h < e p o c h s  do
16:
    Update architecture α by descending α L v a l ( w , α )
17:
    Update weights w by descending w L t r a i n ( w , α )
18:
    epoch = epoch + 1
19:
end while
20:
Derive the final architecture based on the learned α
An example of a vote dispersion problem and its resolution by DG-DARTS can be addressed as follows: We suppose a case in which an edge between nodes 1 and 2 is a convolutional operation that minimizes the loss function. In this case, as the training is processed, the architecture parameter ratio of the convolutional operation is increased by the SoftMax function, as described in Equation (2), while the remaining operations are decreased.
f i , j ( x i ) = o O i , j e x p ( α o ( i , j ) ) o O e x p ( α o ( i , j ) ) o ( x i )
where x i is the node output and α i , j is the architecture parameter.
If there are four types of convolution operations, each of the four operations shares the largest weight; thus, the weight of each operation is eventually lower than those of the other operations. Therefore, other operations, such as skip connections, can be selected as the final operation.
Figure 2. Another view of the DG-DARTS algorithm.
Applsci 11 11436 g002
Such problems are critical once operations in the search space of DARTS [3] are added or changed. For example, once a good and meaningful operation that was found in another study is added to the existing search space, the newly added operation can have its own shares of weights in the existing search space. If DARTS is applied to a new dataset, a new search space is also composed, then the ratio of the operation group needs to be tuned by analyzing the relations of each operation; otherwise, a vote dispersion problem may occur. To resolve the vote dispersion problem, DG-DARTS was constructed in this study.

3.2.1. Clustering Criteria: Gradient of Architecture Parameter

DG-DART uses a gradient, i.e., a derivative, of the architecture parameter α in order to determine the relationship between operations in the search space, apart from previous works. DG-DARTS repeats the epochs of the training, and α is updated in each epoch. Figure 3 and Figure 4 show the gradient of the weight over epochs,. The gradient of α can be used as a hint to determine the relationship between operations because it varies with the training epochs. For example, if one specific edge requires a 5 × 5 filter for the convolution operation, d i l _ c o n v _ 5 × 5 and s e p _ c o n v _ 5 × 5 also have higher weights in the search space of DARTS, while the weights of the other operations decrease. Thus, the Elkan K-means cluster [12] algorithm is introduced to cluster operations based on the criteria of the gradient of the weight. Since each operation has several gradient changes of α with respect to the epochs, operations without n o n e are considered labels, and their gradients are considered data. After clustering, the weight sum for each cluster is used to add clusters with large weights to the search space O for use in the next stage. Once we have a deficient number of operations for the next stage, higher-ranked operations from the second-ranked clusters are also added to the search space. With this new search space O composed, which is a subset of O , stage 2 is processed in the same manner as stage 1.
Here, we present a detailed example. Table 1 shows the detailed weights of the clusters, especially for the seventh mixed operation after stage 1. According to the methods described in Section 3.2.1, cluster numbers, operation names, architecture parameters, and the sum of the architectures for each cluster are shown. In the case of DARTS, d i l _ c o n v _ 5 × 5 with 0.1059 is selected, and the architecture search is completed, as n o n e has the largest architecture parameter is excluded by DART’s policy. In the case of DG-DARTS, half of the operations from the search space of stage 1 are selected, and a new search space is generated for stage 2. In other words, according to the policy of DG-DARTS, four operations among eight operations of the search space are selected: n o n e , d i l _ c o n v _ 5 × 5 , s e p _ c o n v _ 5 × 5 , d i l _ c o n v _ 3 × 3 .
Without grouping of the operations, s e p _ c o n v _ 3 × 3 might be selected with a third-ranked weight; on the contrary, grouping of operations discards s e p _ c o n v _ 3 × 3 from the search space for stage 2 per the criteria of the sum of clusters. As mentioned in Section 3.2.1, n o n e is excluded for clustering but is included in the selection process of the new search space.
Figure 5 shows a virtualization of Figure 3b according to the clusters, along with the PCA results. The operations in the clusters are as follows: Cluster 1: m a x _ p o o l _ 3 × 3 , a v g _ p o o l _ 3 × 3 , s k i p _ c o n n e c t ; Cluster 2: s e p _ c o n v _ 3 × 3 , s e p _ c o n v _ 5 × 5 ; Cluster 3: d i l _ c o n v _ 3 × 3 , d i l _ c o n v _ 5 × 5 . The PCA results show that similar operations are grouped, which are similar to the K-means results.
Figure 6 depicts a visualization of Figure 4b according to the clusters, along with the PCA results. The operations in the clusters are as follows: Cluster 1: m a x _ p o o l _ 3 × 3 , a v g _ p o o l _ 3 × 3 , s k i p _ c o n n e c t ; Cluster 2: s e p _ c o n v _ 5 × 5 , d i l _ c o n v _ 3 × 3 , d i l _ c o n v _ 5 × 5 ; Cluster 3: s e p _ c o n v _ 3 × 3 .
Figure 6 shows that s e p _ c o n v _ 3 × 3 is an extraordinary operation, as clearly observed in Figure 6c,d operation d i l _ c o n v _ 3 × 3 has a lower α but a larger sum of α , such that it includes a new search space per the DG-DARTS policy.

3.2.2. Bebefit: Regularization and Search Cost Decrease

The major advantage of DG-DARTS is twofold. The first is the regularization of a specific operation, and the second is the reduced search cost. The benefits of DG-DARTS are obtained from the two-stage architecture search and operation clustering.
DARTS [3] shows a negative phenomenon in which the number of skip connections is dramatically increased, known as collapse [9], as the epochs progress. Empirically, once the number of skip connections is greater than three, the performance of the final architecture decreases significantly [7,9]. Recent DARTS-based approaches have focused on solving the weight monopoly problem of the skip connection [7,8,10,11,13].
P-DARTS [7] uses drop-out in units of operation, tries to regulate the skip connection’s amount of training, and the number of skip connections of the final architecture is manually limited to two. Fair-DARTS [10] uses a sigmoid activation function instead of SoftMax to overcome the unfair competition of the over-selection of skip connection. PC-DARTS [8] applies regularization weight-free operations, such as skip connection and max-pooling, using edge normalization. DARTS+ [9] prevents excessive skip connections because the final architecture has two skip connections that produce the best performance. To prevent additional selection of skip connections, DARTS+ limits the number of skip connections or performs an early stop using the architecture parameter; here, DARTS+ used two stages of 25 epochs, which produced an effect similar to the early stopping of DARTS+.

3.2.3. Relationship to Previous Work

Several features of previous studies inspired this study. DG-DARTS has a similar concept to StacNAS [11] in that similar types of operations are grouped. StacNAS clusters operations with the criteria from the feature map by calculating candidate operations regarding the dataset before the architecture search. From the four clusters, one representative operation was selected, and the n o n e operation was added. Five operations, m a x _ p o o l _ 3 × 3 , s k i p _ c o n n e c t , s e p _ c o n v _ 3 × 3 , d i l _ c o n v _ 3 × 3 , and n o n e , compose the search space for stage 1, and the selected operations are used in stage 2. Several studies have focused on the feature map of the operations to improve the search space, and all of them require pre-calculation to obtain the feature map [10,11,13].
In comparison, DG-DARTS does not require pre-calculation of the feature map; therefore, DG-DARTS requires no additional calculation time. Both the relationships between the positions of the operations and the relationships of the operations inside the cell are considered because clustering in DG-DARTS is performed for all edges, for example, mixed operation. Therefore, the dynamic nature of DG-DARTS can help obtain dynamic and situation-oriented clusters, apart from predefined clustering. For example, mixed operation number 0 is clustered with s e p _ c o n v , d i l _ c o n v clustering, whereas mixed operation number 13 can have clusters with 3 × 3 and 5 × 5 according to the filter size criteria.
Dividing stages to reduce the search space is one of the ideas of P-DARTS [7]. P-DARTS has three stages, each with 25 epochs, and the number of cells in the search network increases with the number of stages, thus solving the depth-gap problem. In this process, a negative phenomenon can occur where the skip connection is over-selected, eventually leading to the poor performance of the model. To regularize this phenomenon, drop-out is introduced in terms of operations and limits the number of skip connections by two to select the final architecture. DG-DARTS regularizes skip connections by operation clustering, and collapse [9] can be prevented without additional work.

4. Experiments and Results

4.1. Experimental Environment and Data Set

CIFAR10 [14] was the base dataset used in our experiment. The CIFAR10 dataset contains 60,000 images spanning 10 categories with a resolution of 32 × 32 pixels. Among these images, 50,000 images were classified for training and 10,000 images for testing. In this study, 25,000 images were used for group network weight training and 25,000 images for architecture parameter training.

4.2. Architecture Search

4.2.1. Implementation Detail

The architecture parameter α is a criterion. Every parameter used in this experiment was the same as that of DARTS, except for the batch size and epochs. The search space O is also the same as that of DARTS; in other words, DG-DART uses eight operations: ( n o n e , m a x _ p o o l _ 3 × 3 , a v g _ p o o l _ 3 × 3 , s k i p _ c o n n e c t , s e p _ c o n v _ 3 × 3 , s e p _ c o n v _ 5 × 5 , d i l _ c o n v _ 3 × 3 , and d i l _ c o n v _ 5 × 5 ) , which are obtained from the operation search space of NASNet [1]. The batch size was set to 96. Two stages with 25 epochs each in this experiment had a total of 50 epochs, which is the same value as the 50 epochs per 1 training in DARTS. Initially, 16 channels and eight cells composed of six normal cells and two reductions constituted the search network. To train the network weight, the stochastic gradient descent (SGD) optimizer [15] was used, and we set the initial learning rate as 0.025, momentum as 0.9, and weight decay as 3 × 10 4 as the parameter values. To train the architecture parameter, the Adam optimizer [16] was used, and we set the initial learning rate to 3 × 10 4 , momentum in ( 0.5 , 0.999 ) , and weight decay to 0.001. The Elkan K-means clustering algorithm [12] was used to cluster operations with an initial iterator of 30, max iterator of 300, and tolerance of 10 4 . With such clustering parameters, clustering was performed for 1~4 clusters.

4.2.2. Result of Architecture Search

Table 2 shows the search cell performance for each number of clusters. If the number of clusters is four, too many skip connections are selected, and the number of skip connections is set to two. In other cases, there are 1~3 clusters, and skip connections were well-regulated. As shown in Table 3, the best case can be found when the number of clusters is three. For the architecture search, 0.22 GPU days (5.35 h) are consumed with 1 Tesla P100 GPU.
Clustering is performed after finishing stage 1, and clustering is used to solve the vote dispersion problem. Based on the number of clusters, the final model performance can be described as follows: one cluster indicates that all operations are in the same cluster, and it is the same result produced by DARTS searching the architecture twice with 25 epochs.
With a larger number of clusters, the final model performance increases and we found the best performance when the number of clusters was three, since more clusters led the same structure as the DARTS structure with unregulated operations.
For example, seven clusters of operations create the same structure as that of DARTS without the effect of clustering.
With our clusters, as we experienced, s k i p _ c o n n e c t is not well-regulated; thus, too many s k i p _ c o n n e c t were selected, which caused the collapse phenomenon [9]. It is clear that models with five s k i p _ c o n n e c t operations out of eight will perform poorly, so two s k i p _ c o n n e c t operations were selected manually as is performed by P-DARTS [7].
This model from DG-DARTS showed a test error of 2.71%, whereas the three-cluster model achieved a test error of 2.51%, which is the best results.
We provide another result of our experiment for better verification of our strategy. Table 4 shows the effect of α . In our research, cluster 2, which has the largest sum of α , was selected for the next stage. Instead of choosing operation s e p _ c o n v _ 3 × 3 from cluster 2, the operations from clusters 1 and 3 were chosen to proove our strategy. Operation s k i p _ c o n n e c t from cluster 1 had an accuracy of 97.06%, and operation d i l _ c o n v _ 3 × 3 from cluster 3 had an accuracy of 96.94%. Operation s e p _ c o n v _ 3 × 3 from cluster 1 achieved the best accuracy of 97.49% as intended by our strategy.

4.3. Implementation Details of Architecture

Implementation Details

The model for the final evaluation was composed of 20 cells and 36 initial channels. A total of 20 cells were composed of 18 normal cells and 2 reduction cells. The other parameters, which are the same as those in DARTS [3], are defined as follows:
  • Cutout regularization [20]: 16;
  • Drop-path [22] of probability: 0.2;
  • Auxiliary towers [23] of weight: 0.4;
  • SGD [15] optimizer’s weight decay: 0.0003;
  • Momentum: 0.9;
  • Initial learning rate: 0.025;
  • Batch size: 96’
  • Number of training data: 50,000;
  • Total epochs: 600.
An example cell architecture found by DG-DARTS is shown in Figure 7 for the CIFAR10 data set.

5. Discussion

Here, we discuss the outcome of the architecture’s evaluation. The evaluation results are summarized in Table 2. DG-DARTS has a test error of 2.51 on the CIFAR10 [14] data set. ProxylessNAS [19] uses a different search space than NASNet [1] and incurs a large GPU cost. StacNAS [11] requires pre-calculation and has a structure of 17 cells for a search network using a high-performance GPU, whereas DARTS [3] and DG-DARTS have an eight-cell structure. In the case of P-DARTS [7], the number of cells is increased in three stages, for example, 5, 11, and 17, and limits exist on the additional regularization; finally, in order to limit the skip connections, DG-DARTS uses the same size search space and architecture as DARTS. In terms of the clustering calculation time, DG-DARTS consumes 0.22 days, without additional work and methodology. In other words, compared to DARTS, we applied the minimum of changes in DG-DARTS. Thus, DG-DARTS has sufficient potential for the NAS of AutoML, with a test error of 2.51%. This is due to reducing the amount of total computation by solving the vote dispersion problem.

6. Conclusions

In this study, we solved one of the possible problems faced by DARTS [3], which is vote dispersion. With the proposed DG-DARTS, the total amount of computation is reduced, so the total computation compared to DARTS is decreased with significantly lower GPU days while reasonably increasing accuracy. The vote dispersion problem, which is latent in the DARTS methodology, is solved by the operations of the search space being grouped based on the criteria of the gradient of the architecture parameter α over the training epochs. By the weights of the grouped operations and selections, useful operations that are discarded by DARTS survive and are used. With this AutoML approach, without manually changing the size of the search network, the test accuracy is increased to 97.49% on the CIFAR10 dataset [14]. For the same training epochs, the search cost is lower than that required for DARTS because DG-DARTS uses fewer operations in stage 1. In summary, DG-DARTS required 0.22 days in comparison to the 1.5 GPU days required for DARTS, representing a seven-fold increase in speed. Our future research will include experimental results on different datasets, such as CFAR100 [14] and ImageNet [24], to verify the effect of DG-DARTS on such datasets. In addition, we will apply DG-DART to other types of models, such as graph convolution [25] and RNN [3], to determine its effectiveness for search spaces with other types of operations. The application domains of DG-DARTS include natural language processing (NLP), EdgeML, and so on, with the concise models generated by DG-DARTS. For example, machine learning on edge devices may require simpler models given the restrictions of computational resources and communication bandwidth. Even though ARM Corex processors, which are usually used for edge devices, have relatively higher computation power, it is still impossible to achieve high-performance GPUs for edge devices; therefore, restrictions on computational power is still a problem for machine learning on edge devices. Additionally, low-power and low-bandwidth network technologies for IoT devices, such as LoRa, place another restriction on communication between edge devices. The simpler models generated by DG-DARTS provides one solution to these environmental restrictions.

Funding

This work was supported by the National Research Foundation of Korea (NRF) grant funded by the Korean government (MEST) (NRF-2019R1F1A1056123).

Institutional Review Board Statement

Not applicable.

Informed Consent Statement

Not applicable.

Data Availability Statement

Not applicable.

Acknowledgments

The author is deeply appreciative of special help provided by Seongjin Park for their efforts to initialize this research. The author also thanks those who helped with formatting, proofreading, and other support in preparing this research paper.

Conflicts of Interest

To the best of my knowledge, regarding this research article, I have no conflict of interest with any other researcher or funding institute. My research is based on pure academic motivation. The funding institute did not provide any academic guidance and only performed management activities.

References

  1. Zoph, B.; Vasudevan, V.; Shlens, J.; Le, Q.V. Learning transferable architectures for scalable image recognition. In Proceedings of the IEEE Conference on Computer Vision and Pattern Recognition, Salt Lake City, UT, USA, 18–22 June 2018; pp. 8697–8710. [Google Scholar]
  2. Zoph, B.; Le, Q.V. Neural architecture search with reinforcement learning. arXiv 2016, arXiv:1611.01578. [Google Scholar]
  3. Liu, H.; Simonyan, K.; Yang, Y. DARTS: Differentiable architecture search. In Proceedings of the International Conference on Learning Representations, Vancouver, BC, Canada, 30 April–3 May 2018. [Google Scholar]
  4. Baker, B.; Gupta, O.; Naik, N.; Raskar, R. Designing neural network architectures using reinforcement learning. arXiv 2016, arXiv:1611.02167. [Google Scholar]
  5. Real, E.; Aggarwal, A.; Huang, Y.; Le, Q.V. Regularized evolution for image classifier architecture search. In Proceedings of the Aaai Conference on Artificial Intelligence, Honolulu, HI, USA, 27 January–1 February 2019; Volume 33, pp. 4780–4789. [Google Scholar]
  6. Pham, H.; Guan, M.; Zoph, B.; Le, Q.; Dean, J. Efficient neural architecture search via parameters sharing. In Proceedings of the International Conference on Machine Learning, Stockholm, Sweden, 10–15 July 2018; pp. 4095–4104. [Google Scholar]
  7. Chen, X.; Xie, L.; Wu, J.; Tian, Q. Progressive differentiable architecture search: Bridging the depth gap between search and evaluation. In Proceedings of the IEEE International Conference on Computer Vision, Seoul, Korea, 27 October–2 November 2019; pp. 1294–1303. [Google Scholar]
  8. Xu, Y.; Xie, L.; Zhang, X.; Chen, X.; Qi, G.-J.; Tian, Q.; Xiong, H. PC-DARTS: Partial channel connections for memory-efficient architecture search. In Proceedings of the International Conference on Learning Representations, New Orleans, LA, USA, 6–9 May 2019. [Google Scholar]
  9. Liang, H.; Zhang, S.; Sun, J.; He, X.; Huang, W.; Zhuang, K.; Li, Z. DARTS+: Improved differentiable architecture search with early stopping. arXiv 2019, arXiv:1909.06035. [Google Scholar]
  10. Chu, X.; Zhou, T.; Zhang, B.; Li, J. Fair DARTS: Eliminating unfair advantages in differentiable architecture search. In Proceedings of the European Conference on Computer Vision, Glasgow, UK, 23–28 August 2020; Springer: Berlin/Heidelberg, Germany, 2020; pp. 465–480. [Google Scholar]
  11. Li, G.; Zhang, X.; Wang, Z.; Li, Z.; Zhang, T. STACNAS: Towards stable and consistent optimization for differentiable neural architecture search. arXiv 2019, arXiv:1909.11926. [Google Scholar]
  12. Hamerly, G.; Elkan, C. Alternatives to the k-means algorithm that find better clusterings. In Proceedings of the Eleventh International Conference on Information and Knowledge Management, McLean, VA, USA, 4–9 November 2002; pp. 600–607. [Google Scholar]
  13. Hong, W.; Li, G.; Zhang, W.; Tang, R.; Wang, Y.; Li, Z.; Yu, Y. Dropnas: Grouped operation dropout for differentiable architecture search. In Proceedings of the International Joint Conference on Artificial Intelligence, Yokohama, Japan, 11–17 July 2020. [Google Scholar]
  14. Krizhevsky, A.; Hinton, G. Learning Multiple Layers of Features from Tiny Images; Citeseer: Princeton, NJ, USA, 2009. [Google Scholar]
  15. Loshchilov, I.; Hutter, F. SGDR: Stochastic gradient descent with warm restarts. arXiv 2016, arXiv:1608.03983. [Google Scholar]
  16. Kingma, D.P.; Ba, J. Adam: A method for stochastic optimization. arXiv 2014, arXiv:1412.6980. [Google Scholar]
  17. Huang, G.; Liu, S.; der Maaten, L.V.; Weinberger, K.Q. Condensenet: An efficient densenet using learned group convolutions. In Proceedings of the IEEE Conference on Computer Vision and Pattern Recognition, Salt Lake City, UT, USA, 18–22 June 2018; pp. 2752–2761. [Google Scholar]
  18. Xie, S.; Zheng, H.; Liu, C.; Lin, L. SNAS: Stochastic neural architecture search. In Proceedings of the International Conference on Learning Representations, Vancouver, BC, Canada, 30 April–3 May 2018. [Google Scholar]
  19. Cai, H.; Zhu, L.; Han, S. Proxylessnas: Direct neural architecture search on target task and hardware. In Proceedings of the International Conference on Learning Representations, Vancouver, BC, Canada, 30 April–3 May 2018. [Google Scholar]
  20. DeVries, T.; Taylor, G.W. Improved regularization of convolutional neural networks with cutout. arXiv 2017, arXiv:1708.04552. [Google Scholar]
  21. Cubuk, E.D.; Zoph, B.; Mane, D.; Vasudevan, V.; Le, Q.V. Autoaugment: Learning augmentation policies from data. arXiv 2018, arXiv:1805.09501. [Google Scholar]
  22. Larsson, G.; Maire, M.; Shakhnarovich, G. FractalNet: Ultra-deep neural networks without residuals. arXiv 2016, arXiv:1605.07648. [Google Scholar]
  23. Szegedy, C.; Liu, W.; Jia, Y.; Sermanet, P.; Reed, S.; Anguelov, D.; Erhan, D.; Vanhoucke, V.; Rabinovich, A. Going deeper with convolutions. In Proceedings of the IEEE Conference on Computer Vision and Pattern Recognition, Boston, MA, USA, 12 June 2015; pp. 1–9. [Google Scholar]
  24. Deng, J.; Dong, W.; Socher, R.; Li, L.-J.; Li, K.; Li, F.-F. Imagenet: A large-scale hierarchical image database. In Proceedings of the 2009 IEEE Conference on Computer Vision and Pattern Recognition, Miami, FL, USA, 20–24 June 2009; pp. 248–255. [Google Scholar]
  25. Kipf, T.N.; Welling, M. Semi-supervised classification with graph convolutional networks. arXiv 2016, arXiv:1609.02907. [Google Scholar]
Figure 3. First mixed operation over stage 1 epoch. (a) Architecture parameter. (b) Gradient of the architecture parameter.
Applsci 11 11436 g003
Figure 4. Seventh mixed operation over stage 1 epoch. (a) Architecture parameter. (b) Gradient of the architecture parameter.
Applsci 11 11436 g004
Figure 5. Gradient over stage 1 epoch progression: First mixed operation of a cell. (a) Cluster 1: First mixed operation’s gradient in a normal cell. (b) Cluster 2: First mixed operation’s gradient in a normal cell. (c) Cluster 3: First mixed operation’s gradient in a normal cell. (d) PCA by first mixed operation’s gradient in a normal cell.
Applsci 11 11436 g005
Figure 6. Gradient over stage 1 epoch progression: seventh mixed operation of cell. (a) Cluster 1: Seventh mixed operation’s gradient in a normal cell. (b) Cluster 2: Seventh mixed operation’s gradient in a normal cell. (c) Cluster 3: Seventh mixed operation’s gradient in a normal cell. (d) PCA by seventh mixed operation’s gradient in a normal cell.
Applsci 11 11436 g006
Figure 7. Architecture found by DG-DART on the CIFAR10 data set. (a) Normal cell. (b) Reduction cell.
Applsci 11 11436 g007aApplsci 11 11436 g007b
Table 1. Cluster and weight for the seventh mixed operation after stage 1.
Cluster NumberOperation Name α Sum of α
max_pool_3 × 30.0447
Cluster 1avg_pool_3 × 30.03740.1606
skip_connect0.0784
sep_conv_5 × 50.0945
Cluster 2dil_conv_3 × 30.08360.2841
dil_conv_5 × 50.1059
Cluster 3sep_conv_3 × 30.08580.0858
Nonenone0.46930.4693
Table 2. Comparison of state-of-the-art architectures with on the CIFAR 10 data set.
ArchitectureTest Error (%)Parameter (M)Search Cost (GPU Days)Search Method
DenseNet-BC [17]3.4625.6-manual
NASNet-A [1] + cutout 1 2.653.31800RL
DARTS (1st order)  [3] + cutout3.003.31.5Gradient
DARTS (2nd order)  [3] + cutout2.763.34Gradient
SNAS (moderate)  [18] + cutout2.832.81.5Gradient
ProxylessNAS [19]2.085.74Gradient
P-DARTS [7] + cutout2.503.40.3Gradient
PC-DARTS [8] + cutout2.573.60.1Gradient
DART +  [9] + cutout + AA 2 2.204.30.4Gradient
StacNAS [11] + cutout2.333.90.8Gradient
DG-DARTS (ours) + cutout2.513.80.2Gradient
DG-DARTS (ours) + cutout + AA 2 2.213.80.2Gradient
cutout 1 : apply cutout augmentation [20], AA 2 : apply AutoAugment [21].
Table 3. Performance of the final model with respect to the number of clusters.
Number of ClustersNumber of Skip ConnectionsFinal Model Test Error
122.73%
212.66%
322.51% (best)
452.71% *
* The number of skip connections was forced to be set to 2.
Table 4. Cluster and weight for first mixed operation after stage 1.
Cluster NumberOperation Name α Sum of α
max_pool_3 × 30.0617
Cluster 1avg_pool_3 × 30.04550.1824
skip_connect0.0752
Cluster 2sep_conv_3 × 30.15270.3027
sep_conv_5 × 50.1450
Cluster 3dil_conv_3 × 30.12530.2501
dil_conv_5 × 50.1248
Nonenone0.26480.2648
Publisher’s Note: MDPI stays neutral with regard to jurisdictional claims in published maps and institutional affiliations.

