Article

U-SSD: Improved SSD Based on U-Net Architecture for End-to-End Table Detection in Document Images

Department of Intelligent Commerce, National Kaohsiung University of Science and Technology, Kaohsiung 824, Taiwan
*
Author to whom correspondence should be addressed.
Appl. Sci. 2021, 11(23), 11446; https://doi.org/10.3390/app112311446
Submission received: 24 September 2021 / Revised: 29 November 2021 / Accepted: 30 November 2021 / Published: 2 December 2021
(This article belongs to the Special Issue Integrated Artificial Intelligence in Data Science)

Abstract

:
Tables are an important element in a document and can express more information with fewer words. Due to the different arrangements of tables and texts, as well as the variety of layouts, table detection is a challenge in the field of document analysis. Nowadays, as Optical Character Recognition technology has gradually matured, it can help us to obtain text information quickly, and the ability to accurately detect table structures can improve the efficiency of obtaining text content. The process of document digitization is influenced by the editor’s style on the table layout. In addition, many industries rely on a large number of people to process data, which has high expense, thus, the industry imports artificial intelligence and Robotic Process Automation to handle simple and complicated routine text digitization work. Therefore, this paper proposes an end-to-end table detection model, U-SSD, as based on the object detection method of deep learning, takes the Single Shot MultiBox Detector (SSD) as the basic model architecture, improves it by U-Net, and adds dilated convolution to enhance the feature learning capability of the network. The experiment in this study uses the dataset of accident claim documents, as provided by a Taiwanese Law Firm, and conducts table detection. The experimental results show that the proposed method is effective. In addition, the results of the evaluation on open dataset of TableBank, Github, and ICDAR13 show that the SSD-based network architectures can achieve good performance.

1. Introduction

In recent years, driven by industry 4.0, data-driven enterprises have become a global trend. The pandemic has changed the way companies work, and contents on the internet and paper documents are growing exponentially. The demand for document digitization by commercial and non-commercial institutions (such as banks, enterprises, educational institutions, or libraries) is gradually increasing, which can greatly improve the availability of data. However, extracting text data manually is a complicated, time-consuming, and impractical process to obtain reliable information from paper documents [1,2,3]. Office Automation is essential to the contemporary pursuit of a paperless work environment, and in most cases, it is completed by scanning and mail transmission. As the number of documents to be processed increases, the demand for automatic text information extraction will also grow rapidly [4], and using Optical Character Recognition (OCR) to automate the process of text information acquisition can reduce human work and greatly improve the overall speed [5]. Although OCR performs automatic retrieval of information in the text area of a document, the current technology is suitable only for simple text data, thus, it will easily result in recognition errors for complex information [6,7]. Data formats are mainly structured, semi-structured, and unstructured. Structured data are data processed for easy analysis; unstructured data are unprocessed data, such as common emails, images, and PDFs; semi-structured data refers to data between structured data and unstructured data. In addition, due to the improvement and development of the Internet of Things technology, a large amount of text data can be received and exchanged in a variety of ways in the future. In this case, it is important to protect personal privacy and protect shared data [8]. Lin et al. [9] proposed an ant colony optimization (ACO) method that uses multiple goals and uses transaction deletion to protect confidential and hide sensitive information. Wu et al. [10] proposed a genetic algorithm (GA)-based framework for privacy in the field of data mining through sensitive patterns of different lengths, in order to hide sensitive information for data sanitization. When dealing with documents, privacy and sensitivity towards information in the text will be considered. Therefore, the realization of automatic text information acquisition faces various challenges.
Robotic Process Automation (RPA) is a concept that automates repetitive and tedious tasks [11], and the concept of rules-based or knowledge-based RPA has existed for a long time, and with the development of artificial intelligence, its concepts, methods, and technology have more flexible availability [12]. Over the past decade, advances in artificial intelligence have changed the operation mode of most businesses in dealing with business processes, thus, companies are beginning to apply artificial intelligence to many business processes, which can significantly reduce costs, improve efficiency, and increase profits. IT, finance, insurance, medical care, education, government, and other industries spend a lot of manpower on document processing [13]; however, the difficulty of processing unstructured images, texts, documents, voices, and films is greatly increased [14]. Therefore, automated document management systems (ADMS) and intelligent document processing (IDP) are receiving great attention. As the demand for digital documents to replace paper documents is growing rapidly [15], the development of automatic document analysis focuses on Natural Language Processing (NLP) [16]. Although words are the basic means of conveying information, tables are used in many documents to help convey information faster; therefore, effective automatic document processing methods to obtain text information from tables and charts are essential [17], as most documents combine text and charts. When converting paper documents, converting charts into digital documents is particularly labor-intensive. As an important element in a document, tables can express more information in fewer words; however, due to the different arrangement of tables and words, detection of tables is still a major challenge, although a number of methods have been proposed [18].
In recent years, Deep Convolution Neural Networks have been proved to be applicable to highly complex visual recognition. Object detection, which is widely used in natural scenes and forms the basis of many other visual detection models [19], has been widely applied in various fields, such as automatic driving [20] and object tracking [21]. In the field of document analysis, the combination of Support Vector Machine and Deep Neural Network initially replaced traditional machine learning to promote RPA to help solve unstructured document data [22], thus, the convolution model has been gradually used for document analysis [23,24]. Hao et al. [25] applied Deep Convolution Neural Networks to detect forms in PDF files. Saha et al. [26] used graphical object detection and transfer learning to locate graphic objects in documents. As object detection is scalable and flexible, it has been used in unnatural scenes, and its detection effect is remarkable. With the popularity of object detection algorithms based on deep learning in recent years, the object detection method can be used to detect images, tables, and formulas in document images. Documents are composed of text areas and charts, which are complex text data. The tables in a document are rows and columns that represent relevant information content, which is convenient for readers to understand and analyze the text. However, the appearance, typesetting, and layout of tables vary greatly, and the size and style depend on the habits of the writer, thus, during document analysis, the wide variety of sizes, colors, and fonts can produce very different results. Therefore, this study used the object detection method Single Shot Detector (SSD) [27] to identify complex table areas, and integrated U-Net [28], which is an image segmentation model that merges and retains marginal information through its autoencoder features. In addition, dilated convolution was added to compensate for the slight loss of feature information and maximize the retention of table features. Accurate edge information can minimize errors of table detection, facilitate subsequent OCR operation, and improve the overall process efficiency.
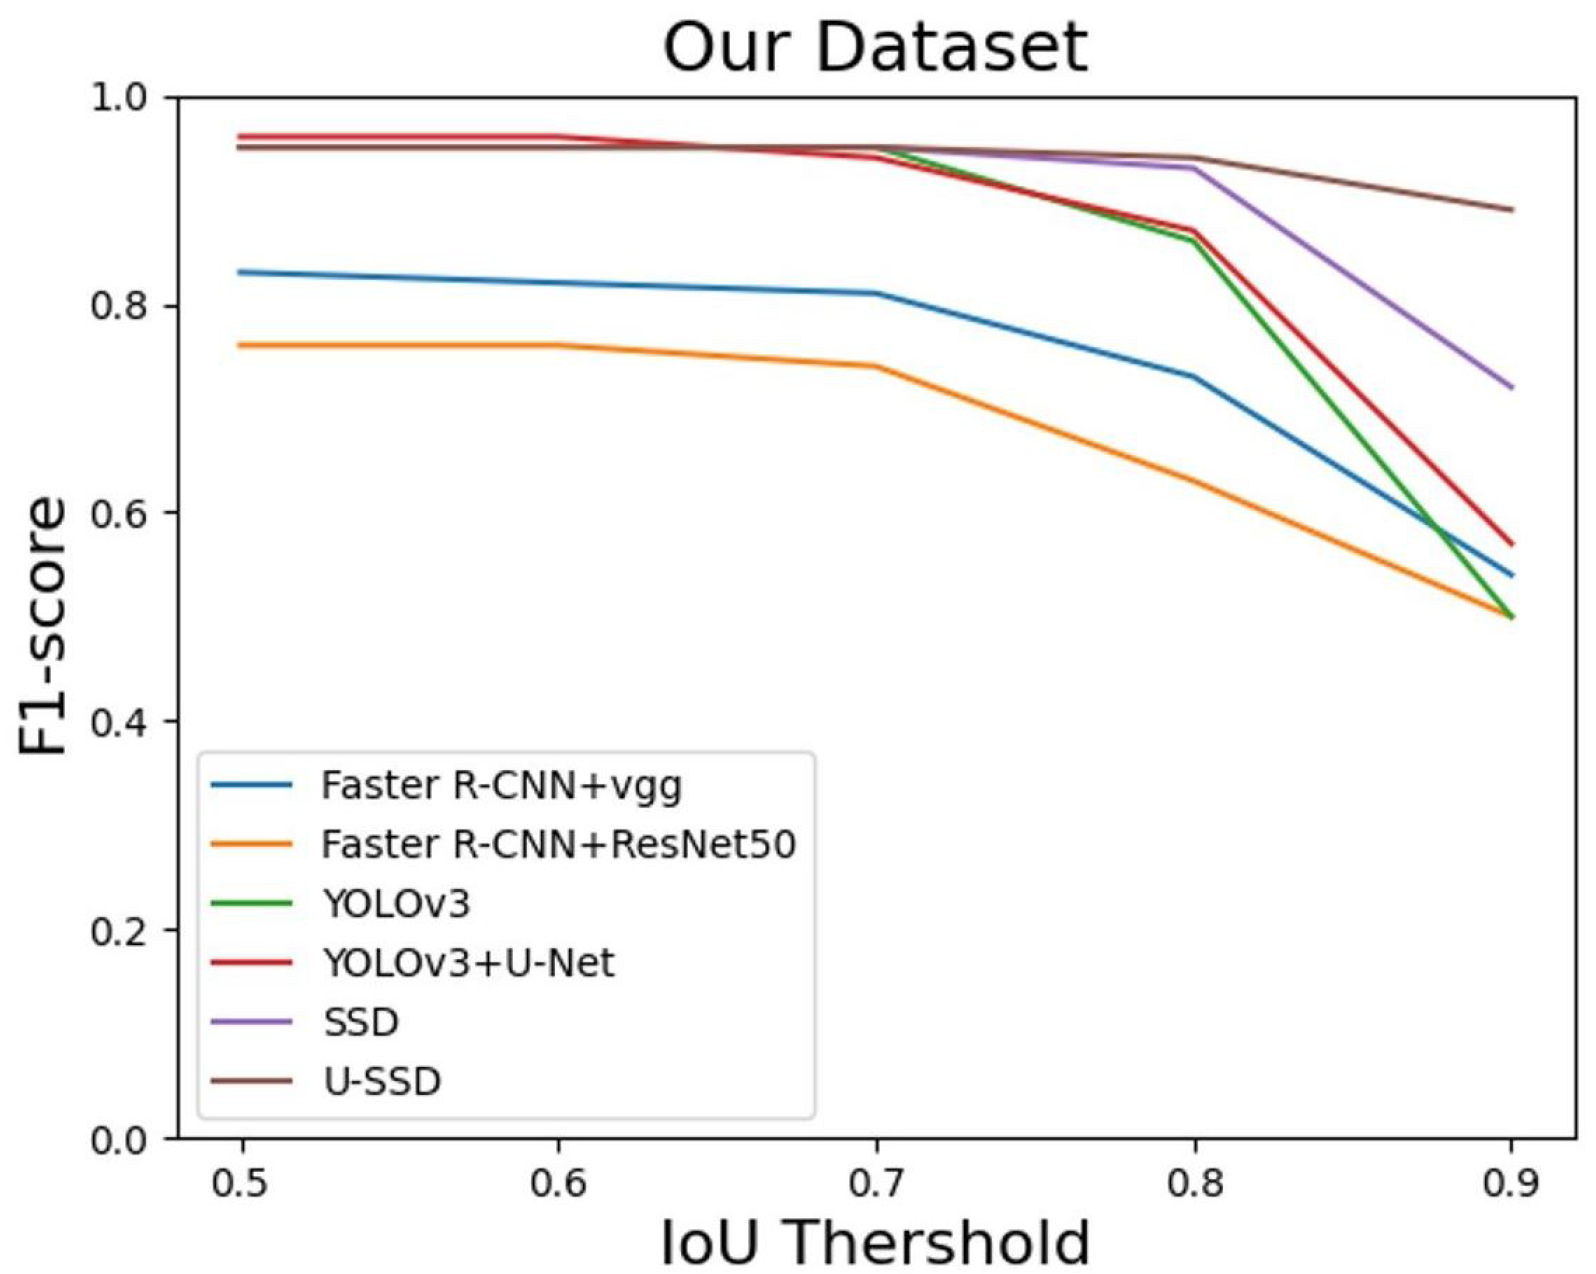
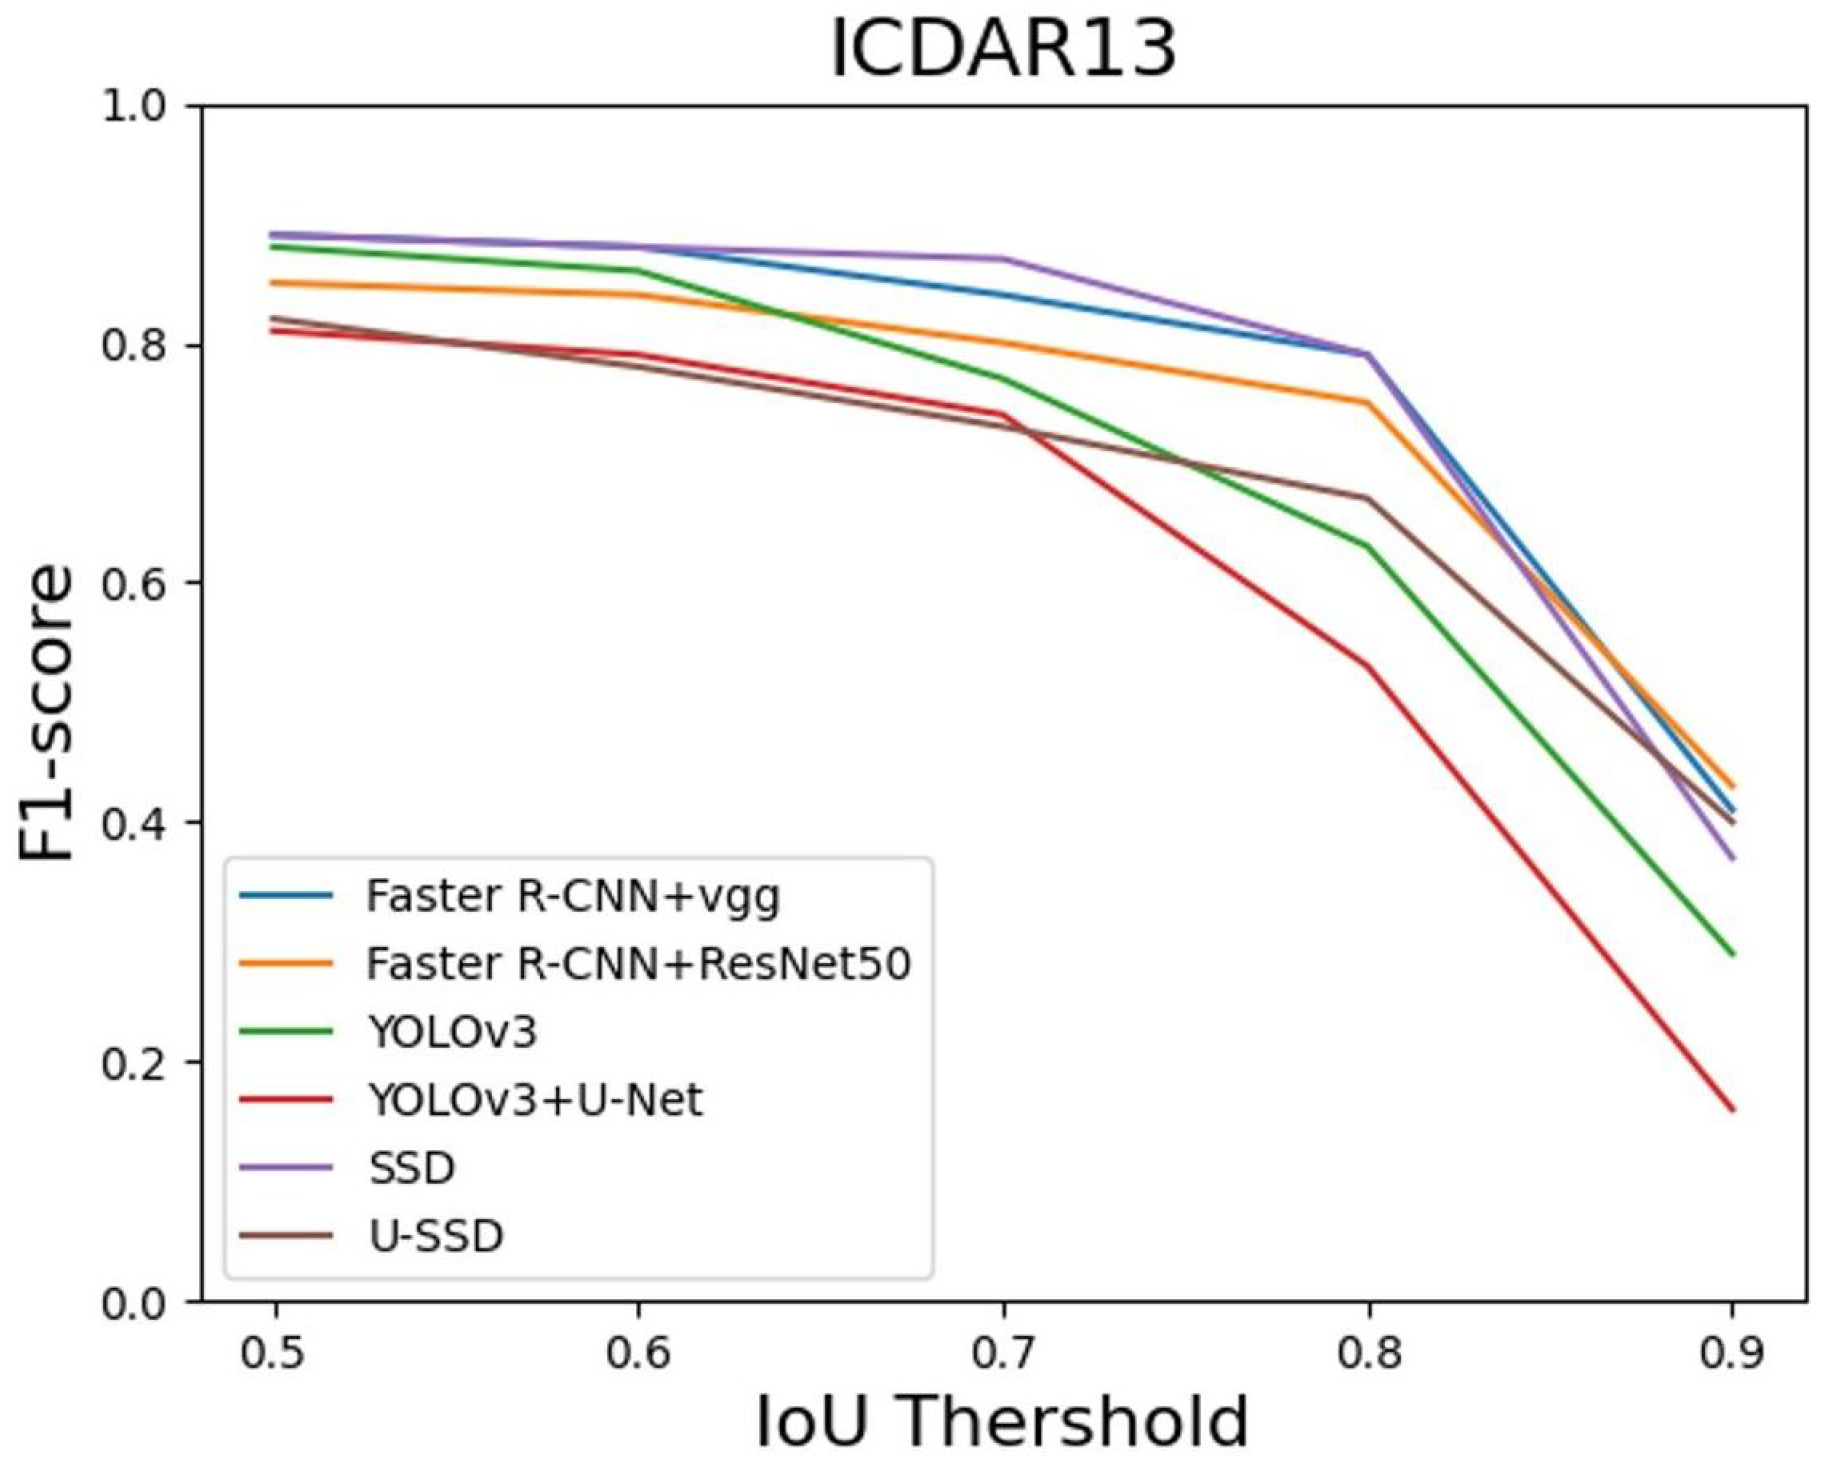
The contributions of this study include improved SSD and the end-to-end table detection model. VGG in the original SSD architecture was replaced with U-Net to increase edge features, and 8 additional convolution layers were added to increase feature extraction. In addition, the concept of dilated convolution was introduced to reduce information loss during feature transmission. Finally, six feature maps of different scales were selected to detect targets of different sizes. The edge prediction errors of the table are greatly reduced by the proposed method and the detection effect is remarkable. This experiment used the dataset of accident claim documents, as provided by a Taiwanese law firm, and the performance of proposed method was also evaluated on TableBank, Github, and ICDAR13 datasets. The results show that the network architecture based on SSD can achieve good performance.

2. Related Work

2.1. Object Detection Methods and U-Net

Object detection can be divided into two types: One-stage and two-stage models. The earlier algorithms mostly used two-stage models, which separate object position detection and classification and have limitations in speed. One-stage object position detection and classification are carried out simultaneously to improve the speed of two-stage detection. The object detection algorithm based on Region Proposal is improved based on Fast R-CNN [29]. In 2016, Girshick et al. proposed Faster R-CNN [30], which can be divided into two parts: Region Proposal Network (RPN) and Fast R-CNN object detection network. The former is a fully convolutional network, and the latter uses the area extracted by RPN for object detection. The main process is to extract feature maps from input images through basic convolutional networks, generate related candidate boxes through RPN, transform feature images and candidate boxes into uniform size after RoI Pooling, and finally, input data to the classifier for classification and generate object position. Although the accuracy of Faster R-CNN is good in object detection, its calculation amount is large. Therefore, Joseph Redmon et al. proposed You Only Look Once (YOLO) [31], as based on a single neural network algorithm, which can simultaneously detect multiple positions and categories to achieve end-to-end object detection. Darknet can be used as the basic architecture to achieve lightweight, highly efficient, and good results in detection. The overall architecture of YOLO consists of 24 convolution layers and two fully connected layers, the activation function is Leaky ReLU, and the last layer is the linear activation function. The input image size is 448 × 448 pixels, and input images are divided into grids to detect the existence of target objects in each grid and predict the bounding box, as well as the probability of its category. As each grid generates multiple prediction boxes, Non-Maximum Suppression (NMS) is adopted to filter the redundant prediction boxes with a high repetition rate, and finally, the most appropriate prediction object is selected. YOLOv2 [32] uses the new network structure Darknet-19, the size of the input image is a multiple of 32, and multi-scale training is adopted to change the size of the output feature map to 13 × 13. Then, a Batch Normalization (BN) layer is added after each convolutional layer to improve convergence. In addition, the anchor box is introduced to predict the bounding box, and its offset position is predicted and obtained. Compared with YOLOv1, the overall speed is faster and the effect is better. With Darknet-53 as the backbone, YOLOv3 [33] has a total of 53 convolutional layers, a residual network is added to avoid the gradient caused by deepening the network, and the last layer of the activation function is Logistic. In addition, the Feature Pyramid Network (FPN) [34] is introduced to detect objects of different sizes using multi-scale feature maps, and the sizes of the three output feature maps are 13 × 13, 26 × 26, and 52 × 52, thus, YOLOv3 has better accuracy and speed than the previous two versions.
Liu et al. proposed SSD [27] and a one-stage deep neural network for end-to-end object detection, where the output space of the bounding boxes was discretized into default boxes according to the different feature map positions of different scales and different aspect ratios. In the prediction stage, the network obtains the probability of the existence of each object category in each default box, as well as the box that best matches the object shape. The SSD network can detect objects of different sizes more effectively by combining multiple feature maps of different resolutions. Moreover, SSD does not need to generate proposals, pixels, or feature re-sampling stages, but encapsulates all calculations within a network, thus, SSDs have good accuracy even when the input image size is small. The main network structure of SSD is VGG16 [35], which replaces two full-connection layers with the convolution layer and adds four convolution layer network structures. Regarding the feature maps output by the five different convolution layers, the convolution layers of two 3 × 3 convolution kernels are used to process them separately. One of the convolution layers outputs the confidence for classification, and each default box generates an N + 1 confidence value. The other convolutional layer outputs regression localization. Thus, SSD is highly accurate in real-time object detection and highly flexible in a network architecture. Therefore, this paper chose this architecture as the core, replaced VGG16 with U-Net, and the edge information was merged and retained through the autoencoder feature.
The image segmentation network based on the encoder–decoder structure was proposed by Ronneberger et al. [28] in 2015, which is mainly applied in medical imaging. As the network structure is similar to U, it is called U-Net. Its network structure is a classical full convolutional network, which is divided into two parts. The first part is the Encoder, which performs feature extraction through down-sampling of the contracting path to obtain feature maps of different sizes, and a 32 × 32 feature map is output. The second part is the Decoder. After up-sampling and feature extraction of the expansive path, the overlap-tile strategy is used to merge with corresponding sizes to overcome the problem of feature loss during feature transmission. This paper introduced this architecture to enhance the ability of feature retention.

2.2. Dilated Convolution

In Fully Convolution Neural Networks [36], convolution is performed for data before pooling, and when the reduced feature map is enlarged back to its original size, part of the feature information is lost; therefore, Long et al. proposed dilated convolution [37] for image segmentation. As dilated convolution can add reception fields without pooling loss information, each convolutional output contains a wide range of image information [38,39]. Dilated convolution can achieve good results when the image requires global information or a voice text requires a long sequence [40,41,42]. In order to fully collect more features, dilated convolution uses the expansion rates of different sizes for convolution layers of different scales without increasing the number of parameters [43]. In addition, dilated convolution can play an effective role in image recognition, object detection, and image segmentation [44,45,46]. Therefore, this study added dilated convolution to compensate for slightly lost feature information and maximize the retention of table features.

2.3. Table Detection

Kim and Huang [47] proposed a rule-based detection method for application to text and web pages, which was divided into two stages; first, features were extracted from the table, and then, grid pattern recognition was carried out by tree structures. Kasar et al. [48] proposed the use of a SVM classifier to divide an image area into a table area and a non-table area, and then, detected crossed horizontal lines, vertical lines, and low-level features to achieve the extraction and recognition of table information. The application of deep learning in an image has good performance, which makes table detection have better robustness and development. In recent years, Gilani et al. [23] proposed the use of Faster R-CNN to detect tables. Schreiber et al. [24] proposed that DeepDeSRT could conduct table detection and structure identification, as based on Faster R-CNN, to identify the positions of rows, columns, and cells in a table. Yang et al. [49] proposed a vision that treats documents as pixels and extracts semantic structures using Multimodal Fully Convolutional Neural Networks. Paliwal et al. [50] used an encoder–decoder combined with VGG as the infrastructure to detect tables and columns, where the two shared the encoder. Decoders train in two separate parts; first, they obtain the result of table detection from the model, and then, obtain columns from the table area through the semantic method. Li et al. [18] proposed a feature generator based on a Generative Adversarial Network (GAN) for table detection to improve the performance of table detection with fewer rules. Huang et al. [51] proposed YOLOv3 as the basic architecture for table detection, and adaptive adjustments and optimization according to specific characteristics. Riba et al. [52] used the image-based method to detect tables in documents and extract the repetitive structure information in the documents by focusing on the structure without relying on words. Prasad et al. [15] proposed that CascadeTabNet use Cascade-RCNN combined with transfer learning, and data enhancement to improve the process and detect tables and their structures.

3. Proposed Method

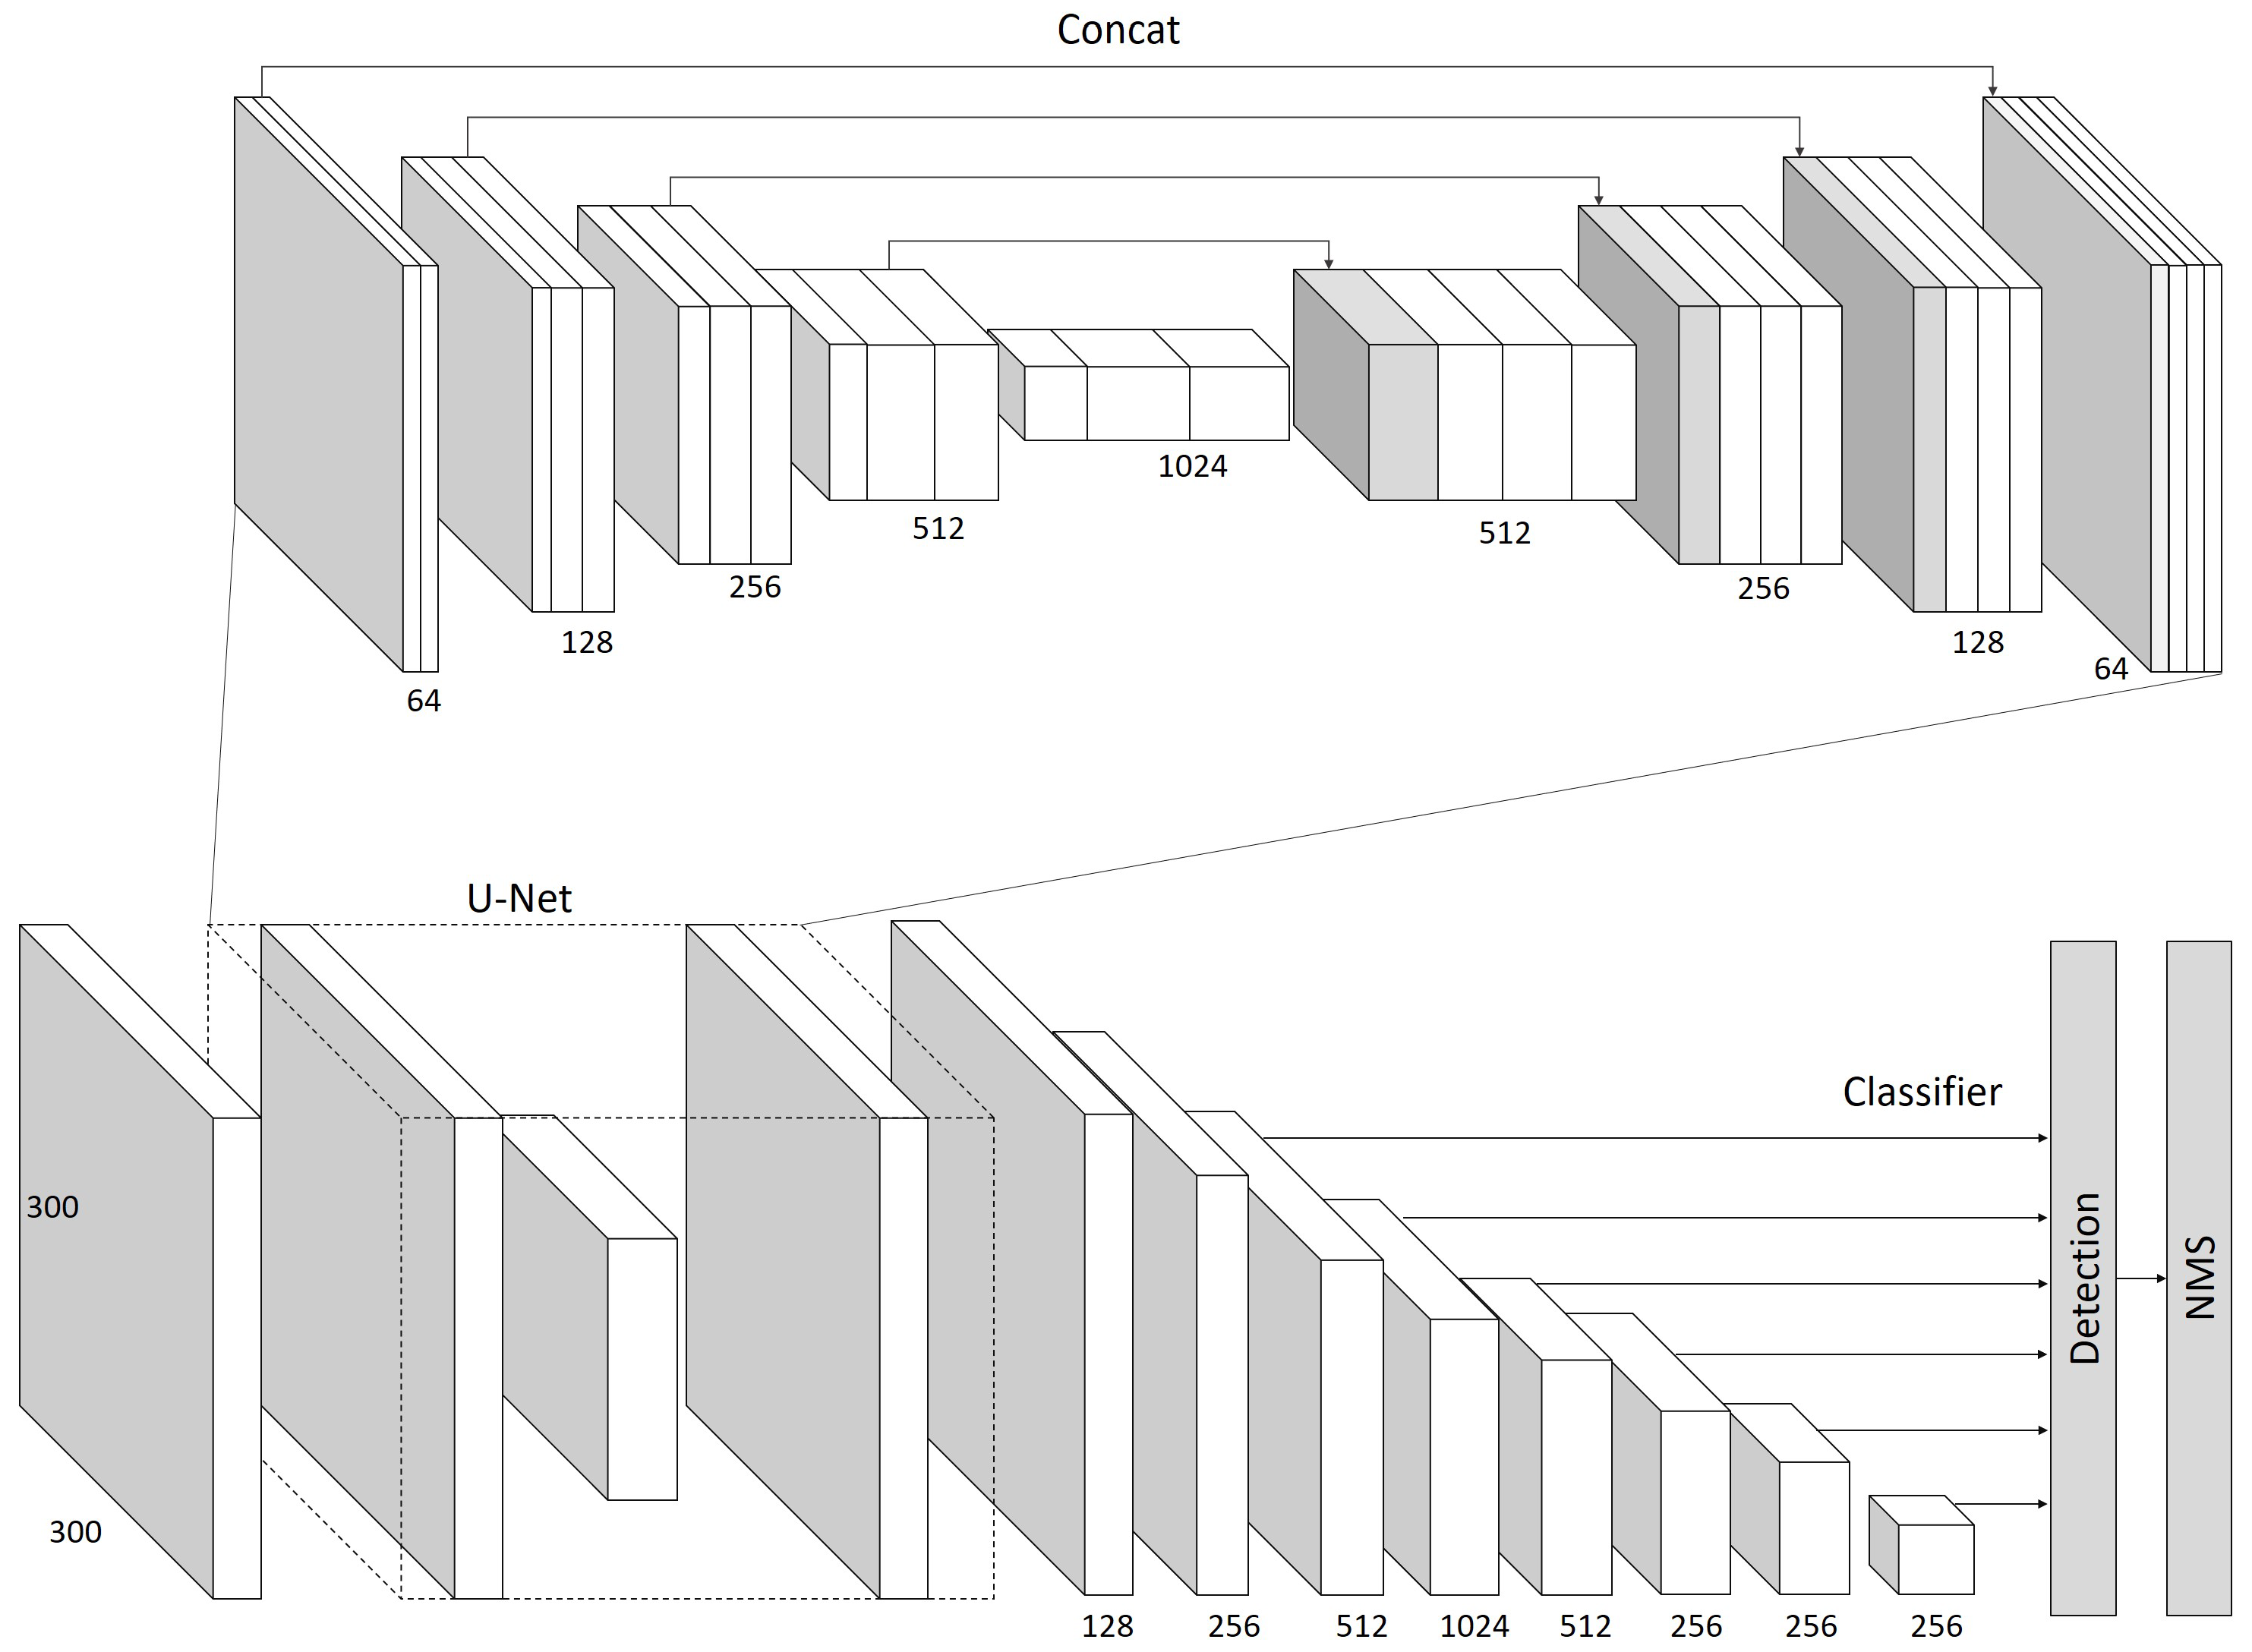
The model architecture proposed in this paper is based on SSD, and the original VGG model was improved by U-Net, which is called U-SSD, as shown in 
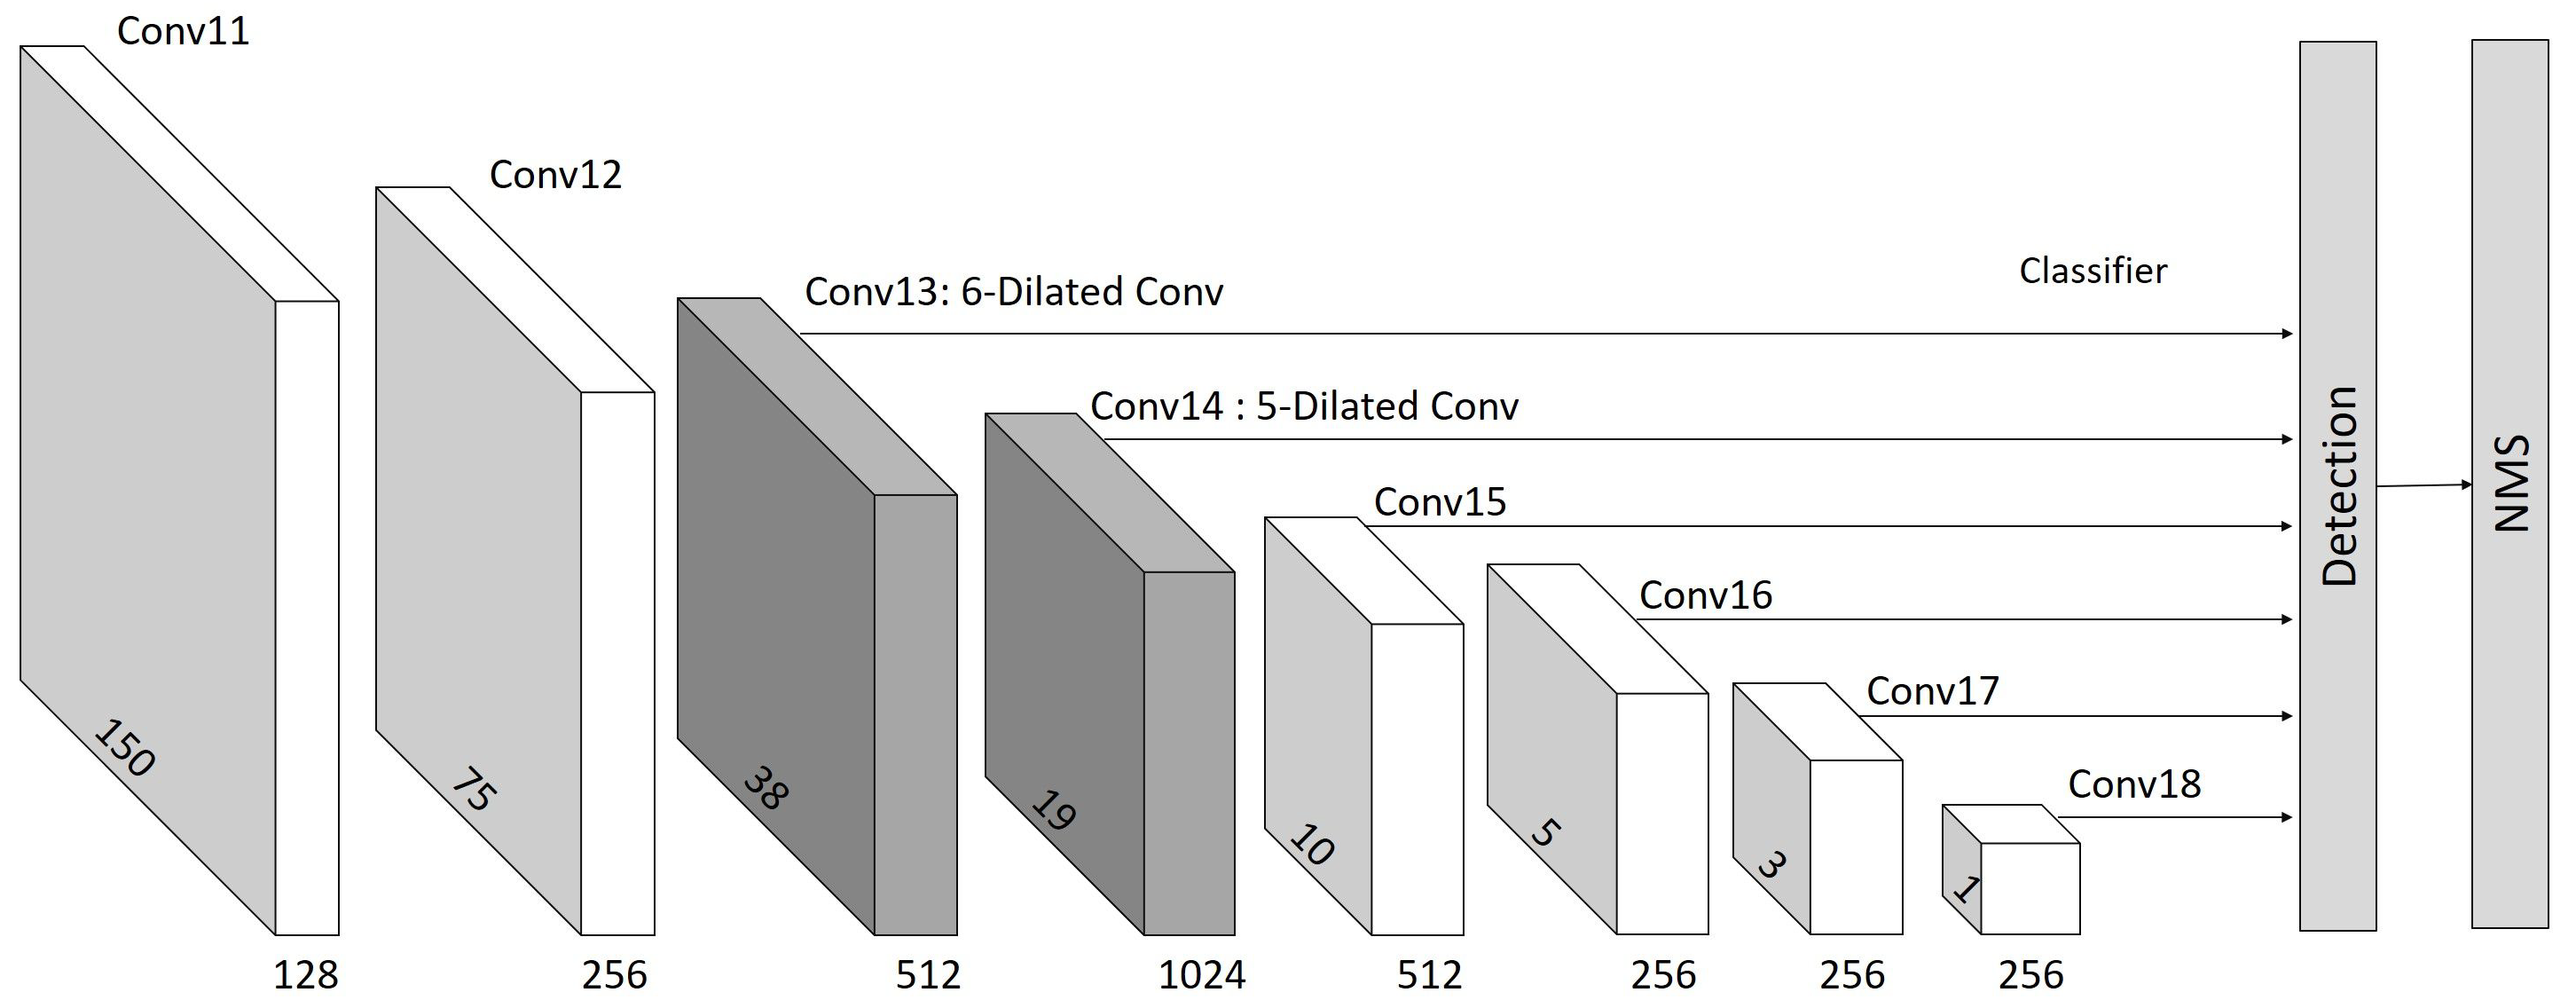
Figure 1. In the data input layer, the size of 300 × 300 was maintained, and VGG16 was replaced by U-Net in the basic network layer. As the model architecture of VGG is highly similar to the feature extraction part of the contracting path (Encoder Part) of U-Net, feature extraction was carried out by the convolution layer. In the process of downsampling, some image edge information will be lost during the convolution operation. The other part of the U-Net network architecture is the expansive path (Decoder Part). In the decoder stage, the overlap-tile strategy was used to mirror the feature map, and the feature map, as generated by upsampling, was combined with the feature map of the same size, as generated in the encoder stage. In addition, in order to greatly reduce feature loss during feature transmission and complete the lost image edge information, multi-scale feature fusion was used to splice feature dimensions. Therefore, replacing VGG16 with U-Net improved the effect of feature map extraction. In the feature layer of the latter half of the original SSD, Conv4_3 and the output of the last layer in VGG16 are used as the starting point of the multi-scale feature map. In the latter part of the feature layer of U-SSD, as part of image information would be lost in the process of feature map scaling down and amplification in the U-Net encoder stage, this study added two additional convolutional layers, for a total of 8 convolutional layers (originally 6 in SSD), as shown in Figure 2. In addition, similar to the original SSD, this study maintained the last six layers of feature maps with different scales (38 × 38, 19 × 19, 10 × 10, 5 × 5, 3 × 3, 1 × 1) for detection of different scale targets and field of vision, and there was a L2 normalization layer after Conv13. The loss function and ground-truth matching optimization are based SSD. The loss function L is a weighted sum of the localization loss (loc) and the confidence loss (conf), seen in Equation (1). x i j p = { 1 , 0 } is an indicator for matching the i-th default box to the j-th ground truth box of category p. N is the number of matched default boxes. The localization loss is a smooth L1 loss L l o c between the predicted box (l) and the ground truth box (g) parameters. The weight term α is used for cross validation. The confidence loss L c o n f is the softmax loss over multiple classes confidences (c).
L ( x , c , l , g ) = α L l o c ( x , l , g ) + 1 N ( L c o n f ( x , c ) )
Smooth L1 loss can avoid the gradient explosion caused by the wrong offset when the ground-truth and predicted box are too different. The L l o c is defined in Equation (2). We regress to offsets for the center ( c x , c y ) of the default bounding box (d) and for its width (w) and height (h). The confidence loss is defined in Equation (3).
L l o c ( x , l , g ) = i P o s N m { c x , c y , w , h } x i j k s m o o t h L 1 ( l i m g ^ j m ) g ^ j c x = ( g j c x ) d i c x d i w g ^ j c y = ( g j c y ) d i c y d i h g ^ j w = log ( g j w d i w ) g j h = log ( g j h d i h )
L c o n f ( x , c ) = i P o s N x i j p log ( c ^ i p ) i N e g log ( c ^ i o ) where c i p = exp ( c i p ) p exp ( c i p )

Dilated Convolution

This paper added dilated convolution to Conv13 and Conv14, as shown in Figure 2. Dilated convolution increases the perceived field of convolution without reducing the spatial feature resolution or increasing model and parameter complexity, meaning it compensates for the lost feature information in the first half and adds more global information to the feature map. Figure 3 shows the difference between ordinary convolution and dilated convolution. The blue dots represent the 3 × 3 convolution kernel, and the yellow area represents the perceived field of vision after the convolution operation. Figure 3a shows the general convolution process, which is preset to 1 and performs the sliding operation closely on the feature map. Figure 3b shows that the dilated convolution is 2, and the perceived field of vision is 5 × 5. Figure 3c shows that the dilated convolution is 3, and the perceived field of vision is 7 × 7. Figure 3 shows that the benefit of dilated convolution is that without pooling loss information, the perceived field of vision is enlarged and each convolutional output contains a wide range of information. In this paper, the values of dilated convolution added to Conv13 and Conv14 were 6 and 5, respectively.

4. Experiment

4.1. Dataset and Data Pre-Processing

The training and testing dataset used in this study were provided by a Taiwanese Law Firm, with a total of 1378 tabular data, including diagnostic certificates, accident site maps, and preliminary accident analysis tables. The data are image files, which are mostly composed of large object tables and a few text areas, include scanned images and filmed images. The images were shot from different angles and under different lighting. The cutting ratio of training, validation, and test data was 8:1:1. In addition, open dataset TableBank [53], Github open dataset [54], and ICDAR13 [55] were used for comparison. TableBank, provided by Microsoft Research Asia, is an open dataset for table detection and recognition, which includes a large number of Word documents and LaTex documents consisting of text areas and charts, for a total of 410,000 table data. The Github open dataset, which contains 400 table file images, is publicly provided by Sgrpanchal31 on Github, and is composed of text areas and charts, and most of the tables have no outer frame. The ICDAR13 dataset, which is used for table detection and structure recognition, is provided by the International Conference on Document Analysis and Recognition, and is composed of PDFs, and documents must be converted into images for use in the research model. Data from the EU and US governments consists of text areas and charts, which contain 150 tables and a total of 238 charts.
The quality of data determines the quality of model training, thus, in order to make a model more accurate, data are often transformed and pre-processed before model training, and image size, rotation, and color conversion are often used. As the dataset of this study was symmetrical and neat, the influence of the commonly used methods on this study was limited. According to Prasad, D. et al. [15], this paper proposed data conversion for document images, including the text, tables, and blank areas in the document; therefore, the model can better understand the data by thickening the text areas and reducing the blank areas. This paper adopted the image dilation method for image transformation, and the black part in the original image was dilated. Before the dilation, the original image was converted into a gray scale image, binarization was carried out, and the dilation image was generated, as shown in Figure 4.

4.2. Evaluation Method and Parameter Settings

As it can calculate the overlap range between the predicted target and the ground-truth target, Intersection over Union (IoU) is one of the basic measurement standards for object detection. When the overlap area is larger, the IoU value is higher, which indicates a more accurate prediction, as shown in Figure 5. As it is actually quite a strict index, the results will be relatively poor if there is a slight deviation. In general, good prediction results can be obtained if the IoU is greater than 0.5.
True Positive (TP) is actually positive; if it is predicted to be positive, the prediction result is correct. False Positive (FP) is actually negative; if it is predicted to be positive, the prediction result is wrong. False Negative (FN) is actually positive; if it is predicted to be negative, the prediction result is wrong. True Negative (TN) is actually negative; if it is predicted to be negative, the prediction result is correct. Precision and recall are used as the evaluation indices in this paper.
There is a tradeoff between precision and recall. Usually, when precision is high, recall is low, and vice versa. When there is a contradiction between the two indices, the F1-score is the most commonly used measurement index, as shown in Equation (4), as it can fully consider precision and recall, especially in the case of category imbalance.
F 1 - s c o r e = 2 * P r e c i s i o n * R e c a l l P r e c i s i o n + R e c a l l
The Precision-Recall Curve takes Precision as the Y-axis and Recall as the X-axis, and each point represents Precision and Recall under different threshold values. Average Precision (AP), which calculates the average accuracy of a single category, is the area under the PR curve.
The experimental environment settings are shown in Table 1. This paper scaled the image input of the dataset to 300 × 300 pixels, the same as SSD, and used the Adam optimizer. After 100 times of Epochs training, the learning rate of the first 50 times was 0.0005, and the batch size was 8, and the learning rate of the last 50 times was 0.0001, and the batch size was 4.

4.3. Evaluation

This paper tested three different datasets: TableBank, Github open dataset, and ICDAR2013, as well as the dataset provided by a Taiwanese law firm, and compared them with the Faster R-CNN, YOLOv3, and SSD detection models. Faster R-CNN was divided into two types with VGG and ResNet50 as the backbone. In addition, the combination of YOLOv3 and U-Net was compared with the U-SSD model, as proposed in this paper.

4.3.1. Evaluation on Our Dataset

The dataset provided by a Taiwanese Law Firm was evaluated, and the results of the model under IoU = 0.5 are shown in Table 2. Regarding precision, while the one-stage object detection model was much higher than the two-stage model, the difference was not significant. On the contrary, while the recall of the two-stage model was relatively high, the values were not far apart. In terms of the comprehensive performance of F1-score and AP, when IoU is 0.5, all the above six models can perform well, among which U-SSD received good scores. The Precision-Recall Curve is shown in Figure 6.
Due to the large difference between the Table and the natural object, the higher the overlap rate between the predicted position and the real position, the better. Therefore, the results of the model under IoU = 0.8 are quite important, as shown in Table 3. The one-stage model performed better than the two-stage model in precision, recall, F1-score, and AP. The U-SSD model, as proposed in this paper, performed better than the other models in comprehensive comparison. The Precision-Recall Curve is shown in Figure 7.
Generally, as the IoU threshold increases, the performance of detection decreases; however, the smaller the position offset of the predicted table, the higher the accuracy, which is more important for Table detection, as shown in Table 4. The average precision of U-SSD can achieve over 90% performance at IoU = 0.5 to 0.9. Figure 8 shows that when the IoU threshold was set below 0.7, the performance of all models was relatively average. As the threshold was increased, with the exception of U-SSD, the other models obviously decreased, while U-SSD remained relatively stable and accurate, which shows that its performance is more robust compared with other models.

4.3.2. Evaluation on Open Dataset

The layout of documents will vary according to the editor’s style. The layout of public datasets are mostly composed of text areas, tables, or pictures, among which the styles of ICDAR2013 are more diverse, while the data of this study mostly consist of large object tables and a few text areas, similar to TableBank and Github. Therefore, the detection results of ICDAR13 were slightly poorer than those of the other three datasets, as shown in Table 5. Although the validation results of the proposed model in public datasets show that there was no significant effect at the IoU threshold of 0.7, there was little difference between the models. When IoU was 0.9, the F1-score of each model decreased significantly, and as the IoU threshold increased, the detection performance decreased. Thus, it is very important for the table to predict as little position offset as possible and as accurately as possible. Our model was almost higher than the other five models when the IoU was 0.9, and the average IoU was quite close to the optimal result. As can be seen from Figure 9, Figure 10, Figure 11 and Figure 12, U-SSD (brown line) has a lower decline than the other five models, and this result illustrates that the stability and model detection performance of U-SSD are very good, and the network architecture based on SSD shows good performance.

4.4. Ablation Experiment

Dilated convolution increases feature information without losing resolution, and U-Net has great influence in the field of image segmentation, as it can extract feature maps through the encoder and combine the obtained feature maps with the original maps in the decoder to reduce feature loss. This paper evaluated whether adding dilated convolution and improving U-Net under the SSD architecture would have an effective impact on the model. The evaluation was based on the dataset provided by a Taiwanese Law Firm, and used the IoU thresholds of 0.5, 0.6, 0.7, 0.8, and 0.9, and the results show that the detection capability decreased as the IoU threshold increased. Table 6 shows that adding dilated convolution using SSD improved the result, and if the main SSD structure VGG is replaced by U-Net, the result will drop slightly. U-Net loses some edge features in the process of zooming in after the feature map size is reduced, which has great influence on table detection. Therefore, when dilated convolution was added and the convolution perception field was improved, feature loss was complete. The experimental results show that when VGG in SSD was replaced by U-Net and dilated convolution was added, the result F1-score under the average IoU reached 0.94. When the threshold was increased, its detection ability did not decrease too much, but remained at a certain level; therefore, the robustness and performance of the proposed model are good.

4.5. Performance of Inference Time

The two-stage model consumed more time in detection speed than the one-stage model. Table 7 shows the detection time of different models. It can be seen that the detection time of models based on Faster R-CNN was longer than that of models based on YOLOv3 and SSD. Although the detection time of YOLOv3+ U-Net and U-SSD were increased by adding U-Net to the original model, compared with Faster R-CNN, it still had a higher detection speed.

5. Conclusions

This paper proposed an end-to-end network model for table detection, U-SSD, which was improved by U-Net that is a classical image segmentation model. Edge information was added by combining feature maps, and dilated convolution was added to increase the perceived field of feature extraction to supplement the lost features. In addition, the dataset provided by a Taiwanese Law Firm was used as the training sample, thus, the object detection model and image segmentation model were initially trained with natural data. The experimental results show that the improved U-SSD can further improve the accuracy of table detection and minimize the prediction error at table edges, and the public dataset verification results show that the detection effect is good. Therefore, using an image segmentation model for object detection can also achieve good results, and adding dilated convolution can effectively improve feature information.
This paper focused on tables with large objects, and the layout was mostly tables with a few text areas; therefore, the detection of small object tables, cells, text areas, and charts in documents was limited. In the future, we will extend the optimization model to include text areas, different styles of cells, and pictures, in order to detect small object cells and further identify table structures in documents.

Author Contributions

Conceptualization and investigation, S.-H.L.; Formal analysis, S.-H.L. and H.-C.C.; methodology, S.-H.L. and H.-C.C.; writing—original draft preparation, S.-H.L.; writing—review and editing, S.-H.L. All authors have read and agreed to the published version of the manuscript.

Funding

This research is financially supported by the Ministry of Science and Technology of Taiwan (under grants No. 110-2622-E-992-024).

Acknowledgments

The authors would like to thank Editor-in-Chief, Editors, and anonymous Reviewers for their valuable reviews.

Conflicts of Interest

The authors declare no conflict of interest.

References

  1. El-Kassas, W.S.; Salama, C.R.; Rafea, A.A.; Mohamed, H.K. Automatic text summarization: A comprehensive survey. Expert Syst. Appl. 2021, 165, 113679. [Google Scholar] [CrossRef]
  2. Bhatt, J.; Hashmi, K.A.; Afzal, M.Z.; Stricker, D. A Survey of Graphical Page Object Detection with Deep Neural Networks. Appl. Sci. 2021, 11, 5344. [Google Scholar] [CrossRef]
  3. Younas, J.; Siddiqui, S.A.; Munir, M.; Malik, M.I.; Shafait, F.; Lukowicz, P.; Ahmed, S. Fi-Fo Detector: Figure and Formula Detection Using Deformable Networks. Appl. Sci. 2020, 10, 6460. [Google Scholar] [CrossRef]
  4. Gorai, M.; Nene, M.J. Layout and Text Extraction from Document Images using Neural Networks. In Proceedings of the 2020 5th International Conference on Communication and Electronics Systems (ICCES), Coimbatore, India, 10–12 June 2020; pp. 1107–1112. [Google Scholar]
  5. Ling, X.; Gao, M.; Wang, D. Intelligent document processing based on RPA and machine learning. In Proceedings of the 2020 Chinese Automation Congress, Shanghai, China, 6–8 November 2020; pp. 1349–1353. [Google Scholar]
  6. Subramani, N.; Matton, A.; Greaves, M.; Lam, A. A Survey of Deep Learning Approaches for OCR and Document Understanding. arXiv 2020, arXiv:2011.13534. [Google Scholar]
  7. Jun, C.; Suhua, Y.; Shaofeng, J. Automatic classification and recognition of complex documents based on Faster RCNN. In Proceedings of the 2019 14th IEEE International Conference on Electronic Measurement and Instruments (ICEMI), Changsha, China, 1–3 November 2019; pp. 573–577. [Google Scholar]
  8. Lin, J.C.-W.; Yeh, K.-H. Security and Privacy Techniques in IoT Environment. Sensors 2021, 21, 1. [Google Scholar] [CrossRef] [PubMed]
  9. Lin, J.C.-W.; Srivastava, G.; Zhang, Y.; Djenouri, Y.; Aloqaily, M. Privacy-Preserving Multiobjective Sanitization Model in 6G IoT Environments. IEEE Internet Things J. 2020, 8, 5340–5349. [Google Scholar] [CrossRef]
  10. Wu, J.M.-T.; Srivastava, G.; Jolfaei, A.; Fournier-Viger, P.; Lin, J.C.-W. Hiding sensitive information in eHealth datasets. Future Gener. Comput. Syst. 2021, 117, 169–180. [Google Scholar] [CrossRef]
  11. Kadhim, A.I. Survey on supervised machine learning techniques for automatic text classification. Artif. Intell. Rev. 2019, 52, 273–292. [Google Scholar] [CrossRef]
  12. Houy, C.; Hamberg, M.; Fettke, P. Robotic process automation in public administrations. In Digitalisierung von Staat und Verwaltung; Köllen: Bonn, Germany, 2019; pp. 62–74. [Google Scholar]
  13. Kajrolkar, A.; Pawar, S.; Paralikar, P.; Bhagat, N. Customer Order Processing using Robotic Process Automation. In Proceedings of the 2021 International Conference on Communication information and Computing Technology, Mumbai, India, 25–27 June 2021; pp. 1–4. [Google Scholar]
  14. Guha, A.; Samanta, D. Hybrid Approach to Document Anomaly Detection: An Application to Facilitate RPA in Title Insurance. Int. J. Autom. Comput. 2021, 18, 55–72. [Google Scholar] [CrossRef]
  15. Prasad, D.; Gadpal, A.; Kapadni, K.; Visave, M.; Sultanpure, K. CascadeTabNet: An approach for end to end table detection and structure recognition from image-based documents. In Proceedings of the IEEE/CVF Conference on Computer Vision and Pattern Recognition Workshops, Seattle, WA, USA, 14–19 June 2020; pp. 572–573. [Google Scholar]
  16. Hassan, F.U.; Le, T. Automated requirements identification from construction contract documents using natural language processing. J. Leg. Aff. Dispute Resolut. Eng. Constr 2020, 12, 04520009. [Google Scholar] [CrossRef]
  17. Kavasidis, I.; Pino, C.; Palazzo, S.; Rundo, F.; Giordano, D.; Messina, P.; Spampinato, C. A saliency-based convolutional neural network for table and chart detection in digitized documents. In Proceedings of the 2019 20th International Conference on Image Analysis and Processing, Trento, Italy, 9–13 September 2019; pp. 292–302. [Google Scholar]
  18. Li, Y.; Gao, L.; Tang, Z.; Yan, Q.; Huang, Y. A GAN-based feature generator for table detection. In Proceedings of the 2019 15th International Conference on Document Analysis and Recognition, Sydney, NSW, Australia, 20–25 September 2019; pp. 763–768. [Google Scholar]
  19. Zou, Z.; Shi, Z.; Guo, Y.; Ye, J. Object detection in 20 years: A survey. arXiv 2019, arXiv:1905.05055. [Google Scholar]
  20. Zhai, X.; Liu, K.; Nash, W.; Castineira, D. Smart autopilot drone system for surface surveillance and anomaly detection via customizable deep neural network. In Proceedings of the International Petroleum Technology Conference, Dhahran, Saudi Arabia, 13–15 January 2020. [Google Scholar]
  21. Yu, H.; Li, G.; Zhang, W.; Huang, Q.; Du, D.; Tian, Q.; Sebe, N. The unmanned aerial vehicle benchmark: Object detection, tracking and baseline. Int. J. Comput. Vis. 2020, 128, 1141–1159. [Google Scholar] [CrossRef]
  22. Baidya, A. Document Analysis and Classification: A Robotic Process Automation (RPA) and Machine Learning Approach. In Proceedings of the 2021 4th International Conference on Information and Computer Technologies, HI, USA, 11–14 March 2021; pp. 33–37. [Google Scholar]
  23. Gilani, A.; Qasim, S.R.; Malik, I.; Shafait, F. Table Detection Using Deep Learning. In Proceedings of the 2017 14th IAPR International Conference on Document Analysis and Recognition (ICDAR), Kyoto, Japan, 9–15 November 2017; pp. 771–776. [Google Scholar]
  24. Schreiber, S.; Agne, S.; Wolf, I.; Dengel, A.; Ahmed, S. DeepDeSRT: Deep Learning for Detection and Structure Recognition of Tables in Document Images. In Proceedings of the 2017 14th IAPR International Conference on Document Analysis and Recognition (ICDAR), Kyoto, Japan, 9–15 November 2017; pp. 1162–1167. [Google Scholar]
  25. Hao, L.; Gao, L.; Yi, X.; Tang, Z. A table detection method for pdf documents based on convolutional neural networks. In Proceedings of the 2016 12th IAPR Workshop on Document Analysis Systems, Santorini, Greece, 11–14 April 2016; pp. 287–292. [Google Scholar]
  26. Saha, R.; Mondal, A.; Jawahar, C.V. Graphical object detection in document images. In Proceedings of the 2019 15th International Conference on Document Analysis and Recognition, Sydney, NSW, Australia, 20–25 September 2019; pp. 51–58. [Google Scholar]
  27. Liu, W.; Anguelov, D.; Erhan, D.; Szegedy, C.; Fu, C.; Berg, A.C. Ssd: Single shot multibox detector. In Proceedings of the European Conference on Computer Vision, Amsterdam, The Netherlands, 8–16 October 2016; pp. 21–37. [Google Scholar]
  28. Ronneberger, O.; Fischer, P.; Brox, T. U-net: Convolutional networks for biomedical image segmentation. In Proceedings of the International Conference on Medical Image Computing and Computer-Assisted Intervention, Munich, Germany, 5–9 October 2015; pp. 234–241. [Google Scholar]
  29. Girshick, R. Fast r-cnn. In Proceedings of the 2015 IEEE International Conference on Computer Vision (ICCV), Santiago, Chile, 7–13 December 2015; pp. 1440–1448. [Google Scholar]
  30. Ren, S.; He, K.; Girshick, R.; Sun, J. Faster R-CNN: Towards Real-Time Object Detection with Region Proposal Networks. IEEE Trans. Pattern Anal. Mach. Intell. 2017, 39, 1137–1149. [Google Scholar] [CrossRef] [Green Version]
  31. Redmon, J.; Divvala, S.; Girshick, R.; Farhadi, A. You only look once: Unified, real-time object detection. In Proceedings of the IEEE Conference on Computer Vision and Pattern Recognition (CVPR 2016), Las Vegas, NV, USA, 26 June–1 July 2016; pp. 779–788. [Google Scholar]
  32. Redmon, J.; Farhadi, A. YOLO9000: Better, faster, stronger. In Proceedings of the 2017 IEEE Conference on Computer Vision and Pattern Recognition (CVPR), Honolulu, HI, USA, 21–26 July 2017; pp. 7263–7271. [Google Scholar]
  33. Redmon, J.; Farhadi, A. Yolov3: An incremental improvement. arXiv 2018, arXiv:1804.02767. [Google Scholar]
  34. Lin, T.Y.; Dollár, P.; Girshick, R.; He, K.; Hariharan, B.; Belongie, S. Feature pyramid networks for object detection. In Proceedings of the 2017 IEEE Conference on Computer Vision and Pattern Recognition (CVPR), Honolulu, HI, USA, 21–26 July 2017; pp. 2117–2125. [Google Scholar]
  35. Simonyan, K.; Zisserman, A. Very Deep Convolutional Networks for Large-Scale Image Recognition. In Proceedings of the International Conference on Learning Representations, San Diego, CA, USA, 7–9 May 2015. [Google Scholar]
  36. Smys, S.; Chen, J.I.Z.; Shakya, S. Survey on Neural Network Architectures with Deep Learning. J. Soft Comput. Paradig. 2020, 2, 186–194. [Google Scholar] [CrossRef]
  37. Long, J.; Shelhamer, E.; Darrell, T. Fully convolutional networks for semantic segmentation. In Proceedings of the IEEE conference on computer vision and pattern recognition, Boston, MA, USA, 7–12 June 2015; pp. 3431–3440. [Google Scholar]
  38. Chen, L.C.; Papandreou, G.; Kokkinos, I.; Murphy, K.; Yuille, A.L. Semantic image segmentation with deep convolutional nets and fully connected crfs. arXiv 2014, arXiv:1412.7062. [Google Scholar]
  39. Yu, F.; Koltun, V. Multi-scale context aggregation by dilated convolutions. arXiv 2015, arXiv:1511.07122. [Google Scholar]
  40. Oord, A.V.D.; Dieleman, S.; Zen, H.; Simonyan, K.; Vinyals, O.; Graves, A.; Kalchbrenner, N.; Senior, A.; Kavukcuoglu, K. Wavenet: A generative model for raw audio. arXiv 2016, arXiv:1609.03499. [Google Scholar]
  41. Kalchbrenner, N.; Espeholt, L.; Simonyan, K.; Oord, A.V.D.; Graves, A.; Kavukcuoglu, K. Neural machine translation in linear time. arXiv 2016, arXiv:1610.10099. [Google Scholar]
  42. Wang, P.; Chen, P.; Yuan, Y.; Liu, D.; Huang, Z.; Hou, X.; Cottrell, G. Understanding convolution for semantic segmentation. In Proceedings of the 2018 IEEE winter conference on applications of computer vision (WACV), Lake Tahoe, NV, USA, 12–15 March 2018; pp. 1451–1460. [Google Scholar]
  43. Li, C.; Qiu, Z.; Cao, X.; Chen, Z.; Gao, H.; Hua, Z. Hybrid Dilated Convolution with Multi-Scale Residual Fusion Network for Hyperspectral Image Classification. Micromachines 2021, 12, 545. [Google Scholar] [CrossRef]
  44. Liu, R.; Cai, W.; Li, G.; Ning, X.; Jiang, Y. Hybrid dilated convolution guided feature filtering and enhancement strategy for hyperspectral image classification. IEEE Geosci. Remote Sens. Lett. 2021. [Google Scholar] [CrossRef]
  45. Nguyen, T.N.; Nguyen, X.T.; Kim, H.; Lee, H.J. A lightweight yolov2 object detector using a dilated convolution. In Proceedings of the 2019 34th International Technical Conference on Circuits/Systems, Computers and Communications, JeJu, Korea, 23–26 June 2019; pp. 1–2. [Google Scholar]
  46. Chen, K.B.; Xuan, Y.; Lin, A.J.; Guo, S.H. Lung computed tomography image segmentation based on U-Net network fused with dilated convolution. Comput. Methods Programs Biomed. 2021, 207, 106170. [Google Scholar] [CrossRef] [PubMed]
  47. Kim, J.; Hwang, H. A rule-based method for table detection in website images. IEEE Access 2020, 8, 81022–81033. [Google Scholar] [CrossRef]
  48. Kasar, T.; Bhowmik, T.K.; Belaid, A. Table information extraction and structure recognition using query patterns. In Proceedings of the 2015 13th International Conference on Document Analysis and Recognition, Tunis, Tunisia, 23–26 August 2015; pp. 1086–1090. [Google Scholar]
  49. Yang, X.; Yumer, E.; Asente, P.; Kraley, M.; Kifer, D.; Lee Giles, C. Learning to Extract Semantic Structure from Documents Using Multimodal Fully Convolutional Neural Networks. In Proceedings of the IEEE Conference on Computer Vision and Pattern Recognition, Honolulu, HI, USA, 21–26 July 2017; pp. 5315–5324. [Google Scholar]
  50. Paliwal, S.S.; Vishwanath, D.; Rahul, R.; Sharma, M.; Vig, L. Tablenet: Deep learning model for end-to-end table detection and tabular data extraction from scanned document images. In Proceedings of the 2019 15th International Conference on Document Analysis and Recognition, Sydney, NSW, Australia, 20–25 September 2019; pp. 128–133. [Google Scholar]
  51. Huang, Y.; Yan, Q.; Li, Y.; Chen, Y.; Wang, X.; Gao, L.; Tang, Z. A YOLO-Based Table Detection Method. In Proceedings of the 2019 15th International Conference on Document Analysis and Recognition, Sydney, NSW, Australia, 20–25 September 2019; pp. 813–818. [Google Scholar]
  52. Riba, P.; Dutta, A.; Goldmann, L.; Fornés, A.; Ramos, O.; Lladós, J. Table detection in invoice documents by graph neural networks. In Proceedings of the 2019 15th International Conference on Document Analysis and Recognition, Sydney, NSW, Australia, 20–25 September 2019; pp. 122–127. [Google Scholar]
  53. Li, M.; Cui, L.; Huang, S.; Wei, F.; Zhou, M.; Li, Z. Tablebank: Table benchmark for image-based table detection and recognition. In Proceedings of the 12th Language Resources and Evaluation Conference, Marseille, France, 11–16 May 2020; pp. 1918–1925. [Google Scholar]
  54. Table-Detection-Dataset. Available online: https://github.com/sgrpanchal31/table-detection-dataset (accessed on 24 September 2021).
  55. Göbel, M.; Hassan, T.; Oro, E.; Orsi, G. ICDAR 2013 table competition. In Proceedings of the 2013 12th International Conference on Document Analysis and Recognition, Washington, DC, USA, 25–28 August 2013; pp. 1449–1453. [Google Scholar]
Figure 1. The proposed architecture of U-SSD.
Applsci 11 11446 g001
Figure 2. The detailed of multi-scale feature maps.
Applsci 11 11446 g002
Figure 3. The convolution and dilated convolution.
Applsci 11 11446 g003
Figure 4. Data pre-processing.
Applsci 11 11446 g004
Figure 5. The measurement of intersection over union (IoU).
Applsci 11 11446 g005
Figure 6. P-R curve at IoU = 0.5 on our dataset.
Applsci 11 11446 g006
Figure 7. P-R curve at IoU = 0.8 on our dataset.
Applsci 11 11446 g007
Figure 8. The average precision from IoU = 0.5 to IoU = 0.9 on our dataset.
Applsci 11 11446 g008
Figure 9. The F1-score from IoU = 0.5 to IoU = 0.9 on our dataset.
Applsci 11 11446 g009
Figure 10. The F1-score from IoU = 0.5 to IoU = 0.9 on Github open dataset.
Applsci 11 11446 g010
Figure 11. The F1-score from IoU = 0.5 to IoU = 0.9 on TableBank.
Applsci 11 11446 g011
Figure 12. The F1-score from IoU = 0.5 to IoU = 0.9 on ICDAR13.
Applsci 11 11446 g012
Table 1. The system information of experiment environment.
ItemSpecification
Operating SystemLinux Ubuntu 18.04.3
CPUIntel ® Core™ i7-9700 CPU @ 3.00 GHz × 8
GPUGeForce RTX 2080 Ti/PCle/SSE2
Programming LanguagePython
Deep learning frameworkPyTorch
Table 2. The comparison at IoU = 0.5 on our dataset.
ModelIoU = 0.5
PrecisionRecallF1-ScoreAP
Faster R-CNN + VGG62.50%98.48%0.7696.80%
Faster R-CNN + ResNet5071.13%98.48%0.8397.40%
YOLOv396.85%93.18%0.9596.20%
YOLOv3 + U-Net96.18%95.45%0.9696.93%
SSD98.37%91.67%0.9595.61%
U-SSD98.39%92.42%0.9596.85%
Table 3. The comparison at IoU = 0.8 on our dataset.
ModelIoU = 0.8
PrecisionRecallF1-ScoreAP
Faster R-CNN + VGG51.44%81.06%0.6375.20%
Faster R-CNN + ResNet5062.64%86.36%0.7383.45%
YOLOv387.40%84.09%0.8682.63%
YOLOv3 + U-Net87.79%87.12%0.8785.62%
SSD96.75%90.15%0.9390.10%
U-SSD96.77%90.91%0.9492.69%
Table 4. The comparison from IoU = 0.5 to 0.9 on our dataset.
ModelAvg. [@IoU 0.5:0.9]
PrecisionRecallF1-ScoreAP
Faster R-CNN + VGG55.39%82.27%0.6882.57%
Faster R-CNN + ResNet5064.23%88.63%0.7586.11%
YOLOv385.83%82.57%0.8480.60%
YOLOv3 + U-Net86.41%85.76%0.8683.54%
SSD93.33%86.97%0.9087.22%
U-SSD96.45%90.61%0.9492.58%
Table 5. The F1-scores from IoU = 0.5 to 0.9 on open dataset.
DatasetModelIoUAvg.
0.50.60.70.80.9
OursFaster R-CNN + VGG0.830.820.810.730.540.75
Faster R-CNN + ResNet500.760.760.740.630.500.68
YOLOv30.950.950.950.860.500.84
YOLOv3 + U-Net0.960.960.940.870.570.86
SSD0.950.950.950.930.720.90
U-SSD0.950.950.950.940.890.94
GithubFaster R-CNN + VGG0.880.870.850.800.380.76
Faster R-CNN + ResNet500.820.810.800.740.320.70
YOLOv30.920.910.860.700.260.73
YOLOv3 + U-Net0.900.890.810.550.180.67
SSD0.890.890.880.800.310.75
U-SSD0.870.850.820.780.440.75
TableBankFaster R-CNN + VGG0.960.960.960.920.500.86
Faster R-CNN + ResNet500.930.930.960.800.490.82
YOLOv30.970.970.900.790.410.81
YOLOv3 + U-Net0.960.940.890.660.330.76
SSD0.920.900.900.830.520.81
U-SSD0.930.930.920.860.600.85
ICDAR13Faster R-CNN + VGG0.890.880.840.790.410.76
Faster R-CNN + ResNet500.850.840.800.750.430.73
YOLOv30.880.860.770.630.290.69
YOLOv3 + U-Net0.810.790.740.530.160.61
SSD0.890.880.870.790.370.76
U-SSD0.820.780.730.670.40.68
Table 6. The F1-scores in ablation experiment of dilation and U-Net on our dataset.
ModelIoUAvg.
0.50.60.70.80.9
SSD0.950.950.950.930.720.90
SSD + Dilation0.950.950.950.950.850.90
SSD + U-Net0.950.950.950.930.720.93
SSD + Dilation + U-Net0.950.950.950.940.890.94
Table 7. The performance of inference and the usage of GPU memory under IoU = 0.5 on our dataset.
ModelInference TimeMemory (MB)Memory (MB)
(ms/per Image)Allocated for Modelfor Inference
Faster R-CNN(VGG)405503347
Faster R-CNN(ResNet50)4426165387
YOLOv3109704289
YOLOv3 + U-Net2513047619
SSD123254793
U-SSD306893663
Publisher’s Note: MDPI stays neutral with regard to jurisdictional claims in published maps and institutional affiliations.

