Article

Experimental Investigation on Thermal Comfort of COVID-19 Nucleic Acid Sampling Staff in Hot and Humid Environment: A Pilot Study of University Students

1
School of Thermal Engineering, Shandong Jianzhu University, Jinan 250101, China
2
Department of Civil Engineering and Energy Technology, Oslo Metropolitan University, 0130 Oslo, Norway
*
Author to whom correspondence should be addressed.
Appl. Sci. 2021, 11(23), 11492; https://doi.org/10.3390/app112311492
Submission received: 17 August 2021 / Revised: 26 November 2021 / Accepted: 29 November 2021 / Published: 4 December 2021
(This article belongs to the Special Issue Indoor Environmental Quality and Thermal Comfort)

Abstract

:
The current situation of Coronavirus Disease 2019 (COVID-19) prevention and control coupled with the need to work in high-temperature harsh environments makes it necessary to ensure the health and efficiency of medical staff. An experimental outdoor work tent was set up and university students were used to study the thermal comfort of personnel wearing protective clothing in hot and humid environments. The experiment was carried out simultaneously through subjective and objective field tests and physiological tests of personnel. The wet bulb globe temperature (WBGT) index was investigated to divide the outdoor thermal environment into four working conditions: 21–23 °C, 23–25 °C, 25–27 °C and 27–29 °C. Under the different thermal environment intensities, the variations of physiological parameters of test personnel were monitored. The results showed that when WBGT was increased to 27–29 °C, 100% of the participants expected the external temperature to become cooler and the humidity to decrease after one hour. When the temperature was close to 30 °C and the relative humidity was close to 60%, it was necessary to take cooling measures to reduce the thermal stress of the participants. Moreover, relationships between subjective feelings and physiological parameters of the nucleic acid sampling personnel were obtained. Results also found that the forehead, chest and back were the highest skin temperature parts, so it is most effective to give priority to improving the thermal comfort of these three locations. As an early attempt to conduct the real outdoor experimental study on the thermal comfort of COVID-19 nucleic acid sampling staff, this study provided a theoretical basis for follow-up research to develop cooling strategies for protective clothing in hot and humid outdoor environments.

1. Introduction

Since the end of 2019, COVID-19 has been relentless, resulting in the deaths of many medical staff members. As the basic protective equipment for nucleic acid sampling personnel, medical protective clothing provides good barrier performance and can effectively prevent an external virus from infecting the human body [1]. Protective clothing components include working overalls, gloves, goggles and shoe covers, the use of which can bring great physiological and psychological pressure to the wearer. It is often difficult to give consideration or priority to the comfort of wearing such clothing, and so a general deficiency of disposable medical protective clothing is currently their poor comfort [2,3,4].
Figure 1 shows typical work sites for nucleic acid sampling personnel [5]. Such staff wearing protective clothing soon become wet all over from sweating, and their skin can suffer other effects after being covered [6,7], which can seriously affect their working efficiency and their health and increase the risk of heat stress [8,9,10,11]. Therefore, more attention should be paid to high-temperature environments of nucleic acid sampling personnel, and it is necessary to study and analyze the thermal comfort of sampling personnel.
At present, there are few studies of the thermal comfort of medical staff wearing protective clothing in high-temperature environments. Some studies have focused on the impact of protective clothing design and material composition on human thermal comfort [12,13,14]. Troynikov et al. [13] discussed the performance attributes related to the thermal physiology and comfort of a wearer in relation to the protective clothing’s functions, conducted comprehensive testing and analysis of the constituent materials and conducted thermal mannequin testing of experimental surgical clothing. Other studies have mainly focused on the thermal comfort of other types of protective equipment such as fire protection and mascot clothing in high-temperature environments [15,16,17]. By monitoring the temperature of firefighters wearing different types of protective clothing, Roossien et al. [15] concluded that new concepts in protective clothing manufacture had significantly higher internal temperatures. Wang et al. [16] compared the effect of cooling suits on the heat stress of mascot actors in hot and humid environments.
Some studies have focused on different experimental cabin environments, using different thermal stress evaluation indicators to describe the degree of human heat stress [18,19,20,21]. Fang et al. [22] compared several commonly used outdoor thermal indices through experimental tests and surveys and concluded that there was a high correlation between predicted mean vote (PMV) and other indices, indicating that there was a significant difference between the original thermal stress and thermal comfort. Chong et al. [23] studied the relationship between physiological responses and subjective perceptions of workers wearing thermal protective clothing in extreme heat environments and proposed a new continuous graphical index for heat strain assessment under simulated working conditions in a climate chamber. This index is suitable for assessing thermal strain and efficiency of workers wearing thermal protective clothing in extremely hot environments. Few studies have systematically investigated the thermal comfort of medical staff in high-temperature environments [24,25,26]. For example, Potter et al. [25,26] proposed that the impermeable design of protective clothing in hot and humid environments could cause the risk of thermal stress, which could be used to manage the safety of medical staff responding to the Ebola outbreak.
In view of the current level of knowledge, this study considers for the first time the thermal comfort of COVID-19 nucleic acid sampling staff in hot and humid outdoor environments. The experimental method uses actual outdoor natural environments, and hence the experimental data are more real and reliable than studies conducted in thermal chambers. Combined with environmental testing and human physiological and psychological testing, the thermal comfort of outdoor nucleic acid sampling staff exposed to high temperatures is analyzed. The objectives of the study are to investigate the correlation between thermal stress and physiological parameters of the human body, to determine the importance and significance of the thermal comfort of epidemic prevention personnel and to provide a theoretical basis for follow-up research to develop cooling strategies for protective clothing in hot and humid outdoor environments.

2. Experimental Methods

2.1. Experimental Environment

The tests were conducted on the campus of Shandong Jianzhu University in July 2020 and lasted for 14 days. Environmental conditions during the test are presented in Table 1. The location and general arrangements of the experimental site are shown in Figure 2. Temporary tents were set up in an outdoor area with good ventilation and lighting. The tents had ventilation on all sides. The tent had a length, width and height of 3 m, 3 m and 1.9 m, respectively. As a typical Chinese tent that can shield wind, rain and sunlight, this experimental equipment was used to simulate typical working environments of epidemic prevention workers. The layout of an individual experimental tent is shown in Figure 3.

2.2. Experimental Instruments

The protective clothing used in the experiment was of the typical nonwoven medical disposable type, which can effectively block the penetration of bacterial particles and liquids. Several sets of different sizes were used to fit each test participant in the experiment. Test participants also wore disposable pure cotton surgical gowns, face masks, goggles and medical rubber gloves (Figure 4). The cotton surgical gowns had good sweat absorption performance, providing a convenient way to calculate the sweat production of the test personnel. The surgical gowns were reused after cleaning.
Full details of the physiological and environmental testing instrumentation used in the experiment are given in Table 2.

2.3. Index and Calculation Methods

The wet bulb globe temperature (WBGT) index is the most commonly used index to evaluate environmental thermal stress. It is mainly used to determine safe exposure limits in hot and humid environments. This index is calculated using three parameters: black globe temperature (tg) which reflects the solar radiation, wet bulb temperature (tw) and dry bulb temperature (ta). The calculation formula of WBGT in an outdoor environment with solar radiation is as follows [27]:
W B G T = 0.7 t w + 0.2 t g + 0.1 t a
An 8-point weighted method with high reliability and sensitivity was used to estimate the mean skin temperature (Tsk) of the test human bodies [28]:
T s k = 0.07 t f o r e h e a d + 0.07 t u p p e r   a r m + 0.07 t l o w e r   a r m + 0.05 t h a n d + 0.175 t b a c k + 0.175 t c h e s t + 0.19 t t h i g h + 0.2 t c a l f
Tsk and heart rate (HR) were recorded every one second, and averages and standard deviations were calculated every five minutes to obtain values to monitor variation over time. A weighing method was used to measure sweat production (SWp), determined by the change in clothing weight before and after the experiment. Due to the barrier properties of the protective clothing, evaporation of sweat discharged by the human body is difficult, and hence the amount of evaporative loss is very small and can be ignored. Hence, sweat production was estimated by the weight gain of the absorbing surgical gown and protective suit before and after the experiment and the weight gain of a towel that was used to wipe residual sweat which remained on the body after the experiment. In order to reduce errors, an average value was obtained using multiple measurements. The formula for the estimation of sweat production (SWp) is as follows [29]:
S W p = W P C 2 + W S G 2 + W T 2 + W G 2 W P C 1 W S G 1 W T 1 W G 1
where WPC1 and WPC2 are the weight of the protective suit before and after the experiment (g), WSG1 and WSG2 are the weight of the surgical gown before and after the experiment (g), WT1 and WT2 are the weight of the towel before and after the experiment (g) and WG1 and WG2 are the weight of the protective disposable gloves before and after the experiment (g).
The metabolic rate is generally obtained by direct measurement of oxygen consumption [30]. However, it was difficult to measure the oxygen consumed by the participants in this experiment. Considering these constraints, a simpler method was adopted to directly calculate the weight loss due to the metabolism of the human body. The metabolic weight-loss (M) was estimated using the weight difference of a test participant, i.e., the difference between the total weight of a participant before the beginning of the experiment and the total weight of the participant after the end of the experiment, as follows [31]:
M = M 1 M 2
where M1 and M2 are the total weight of participants before and after the experiment (g).
The physiological strain index (PSI), which reflects the body temperature regulation system and the cardiovascular system, is one of the most widely used indicators to describe heat strain in the human body [16]. PSI ranges from 0 (no heat strain) to 10 (maximum heat strain), with 1 indicating no/little heat strain, 2 and 3 indicating low heat strain, 4 and 5 indicating moderate heat strain, 6 and 7 indicating high heat strain and 8 and 9 indicating very high heat strain. The PSI at time t (PSIt) is calculated as follows [16]:
P S I t = 5 × T c o r e , t T c o r e , 0 39.5 T c o r e , 0 + 5 × H R t H R 0 180 H R 0
where Tcore,0 (°C) and HR0 (bpm) are the mean core temperature and heart rate measured before the experiment; Tcore,t (°C) and HRt (bpm) are the mean core temperature and heart rate obtained at any time t; and 39.5 °C and 180 bpm are the highest acceptable core temperature and heart rate for human health, respectively.

2.4. Experimental Conditions

In order to compare the degree of influence of different thermal stress levels on human thermal comfort, the WBGT index was used to categorize the thermal environmental states experienced during the experiment. Taking into account the wider distribution of WBGT, we integrated the experimental data, and the associated values of WBGT ranged from 21 to 29 °C. Hence, the experiment was divided into four thermal environmental categories: 21–23 °C, 23–25 °C, 25–27 °C and 27–29 °C. These thermal categories represent four different working conditions. Details of the basis for the division of the sampled environmental conditions into the four categories are shown in Figure 5. Each scatter point in the figure corresponds to a different participant. Twelve participants were selected under each working condition, half being male and half being female. Table 3 shows the corresponding environmental conditions in the four categories. It can be seen from the table that the larger the WBGT index was, the higher the ambient temperature was and the lower the relative humidity was.

2.5. Participants and Survey

The participants were mainly university students. A total of 12 participants were recruited into the study, aged between 23 and 25. They were required to be healthy and had no diseases related to the experiment. The basic details describing the participants are shown in Table 4. The average value (AVE) and overall standard deviation (STDEVP) for age, height, weight and body mass index (BMI) are provided.
Subjective feelings were recorded using thermal sensation votes (TSV), humid sensation votes (HSV), thermal comfort votes (TCV) and thermal acceptance votes (TAV). Specific evaluation scales are shown in Figure 6.
Besides, with the increase in heat exposure time (0, 15, 30, 45 and 60 min), the temperature expectation vote was assessed using a continuous 3-point scale ranging from −1 (getting hot) to 1 (getting cold), with 0 being a neutral vote. The humidity expectation vote was assessed using a continuous 3-point scale ranging from −1 (getting wet) to 1 (drying), with 0 being a neutral vote. The voting of humidity expectation is mainly subjective voting based on the inner space of clothing and the situation of sweating.
Moreover, the sweating position voting and uncomfortable position voting with the increase in heat exposure time (0, 15, 30, 45 and 60 min) were also recorded, including the hand, forehand, face, neck, chest, abdomen, back, buttock, forearm, upper arm, thigh, calf and foot.
In summary, the principal survey data included the basic personal information of each participant; the total weight of clothes, towels and gloves before and after the test; and subjective feelings of the test participants.

2.6. Experimental Procedures

Details of the experimental steps and process are shown in Figure 7. Before the experiment, the participants sat in an air-conditioned room with an ambient temperature of 25–26 °C and rested for 20 min. The initial physiological parameters of the participants were tested and the test clothes were weighed. The participants were then provided with the test sensors, heart rate band, surgical gown, protective clothing, masks and goggles to ensure that the skin would not directly contact the outside world. Next, the body weight was measured to record the weight of the participants before the experiment, and they walked into the test tent. Note that the participants were not allowed to drink water or eat any food unless the participants chose to give up the experiment due to extremely uncomfortable conditions.
The whole test process lasted for 1 h, and a subjective feeling survey was filled in every 15 min, hence a total of 5 times. During the test, the participants stood or walked slowly. After the test, the participants quickly returned to the air-conditioned room and were kept in the same condition as their weight was measured at the end of the experiment. After data collection was complete, IBM SPSS Statistics 25 and Origin 9.1 data processing software were used to sort and analyze the data.

3. Experimental Results and Analysis

3.1. Physiological Parameters

The variations of the average values of Tsk and HR over time under the four working conditions are shown in Figure 8. It can be seen from the figure that Tsk rose rapidly for the first 15 min. Subsequently, there was a significant correlation between Tsk and WBGT (p ≤ 0.01). When working conditions changed from category 1 to category 2, category 2 to category 3 and category 3 to category 4, the mean skin temperature increased by 0.57, 1.04 and 1.94 °C, respectively. This indicates that the higher the thermal stress level was, the more obvious the skin temperature rise was.
In this study, when the WBGT was 25–27 °C, the average ambient temperature was 29.85 °C and the average humidity was 57.83%. The mean skin temperature of the test participants rose from 33.87 to 35.47 °C, and the participants began to feel uncomfortable. When the WBGT was 27–29 °C, the average ambient temperature was 35.12 °C, the average humidity was 39.30% and the mean skin temperature of the participants fluctuated from 33.89 to 36.40 °C. When this occurred, the temperature of human skin was high and the thermal sensation was obvious.
After the first 15 min, HR and WBGT also were significantly correlated (p ≤ 0.01). When working conditions were in category 1, category 2, category 3 and category 4, the average HR of the test participants were 91.27, 93.66, 98.95 and 106.12 bpm, respectively. With the increase in thermal stress level, the rising trend of HR was obvious. In the high-temperature environment of 27–29 °C, the heart rate of the participants who stood for rest was more than 100 bpm.
Figure 9 shows the variation of skin temperature at the eight body locations (forehead, chest, back, upper arm, lower arm, hand, thigh and calf) of the test participants under the four working conditions. As can be seen from the figure, with the increase in thermal stress level, the skin temperature of each part increases to varying degrees. The forehead skin temperature was the highest, and the average forehead temperature reached 36.99 °C at 27–29 °C. The second was the back and chest, with average temperatures of 36.79 and 36.43 °C, respectively. The skin temperature of the thigh was the lowest. The skin temperature of the hands was significantly greater than that of the lower and upper arm. The main reason is that the medical rubber gloves blocked heat dissipation from the hand.
Figure 10 shows the average amount of sweat production and metabolism of the test participants under the four working conditions. It can be seen from the figure that there were significant differences in sweat production and metabolic rate between the different thermal stress levels. Between working condition level 1 (21–23 °C) and level 4 (27–29 °C), sweat production increased 113.67 g and metabolic rate increased 118.08 g. Sweat could not be evaporated from the protective clothing and hot air could not be discharged quickly, resulting in an increase in temperature and humidity in a microclimate inside the clothing. Hence, the thermal environment under the clothing was more extreme than the external thermal environment, which increased the physiological pressure on the test participants. Figure 11 shows typical sweat patterns after the experiment, confirming that sweat production was obvious.

3.2. Physiological Strain Index

Figure 12 shows the variation of the mean PSI value with time under the four different heat stress levels. With the increase in exposure time and environmental thermal intensity, the PSI increased from 0 (no heat strain) to 4.1 (moderate heat strain). At 27–29 °C, the PSI index increased the most, which indicated that under the same exercise intensity, the greater the environmental stress index was, the more the physiological strain index increased.

3.3. Relationships between WBGT and Physiological Parameters

To examine the correlation between the physiological parameters and the WBGT index, Pearson correlation analysis was performed using the IBM SPSS Statistics 25 software (Table 5). It can be seen from the table that there was a significant positive correlation between Tsk, HR, SWp, M and WBGT (p ≤ 0.01), and the correlation degree r value was above 0.6, indicating that the physiological parameters were significantly affected by the thermal environment and all increased with increasing WBGT. The correlation coefficient of Tsk was the highest (r = 0.854 **), indicating that Tsk was more significantly affected by the external thermal stress.

3.4. Gender Differences

Independent sample t-tests were conducted using the SPSS software to examine the influence of gender difference on the human physiological parameters (Table 6). Taking Tsk as an example, its significance was 0.741 (p >0.05), which belongs to homogeneity of variance. According to the t-test results in the first row listed in the table, the p(Sig.) was 0.587 (p > 0.05); hence, it is considered that there was no significant difference in Tsk between male and female samples. It can also be seen that there was no significant difference in HR between male and female samples. However, there were significant differences in the SWp and M between male and female samples (p < 0.05).

4. Questionnaire Results and Analysis

4.1. Comprehensive Subjective Evaluation

Figure 13 presents the overall subjective evaluation voting values under the four different thermal stress levels. With the increase in heat exposure duration, the thermal sensation votes increased (Figure 13a). For the 21–23 °C working conditions, the overall average TSV values were distributed between 1 (slightly warm) and 2 (warm). Under the 23–27 °C conditions, the overall TSV values were between 1 (slightly warm) and 3 (hot), For the 27–29 °C conditions, the environmental thermal intensity obviously influenced the overall thermal sensation. The average thermal sensation voting value was 3.1, and the subjective thermal sensation was relatively hot.
At the beginning of the experiment, HSV was between 0 (neutral) and 3 (slightly wet) (Figure 13b). Within 30 min, the skin wetness sensation of the participants rose, and after 30 min, the skin wetness sensation tended to stabilize. In the thermal range 27–29 °C, HSV reached a very wet state. This suggests that at the beginning of the experiment, the body secreted sweat to increase the skin moisture. After half an hour, the stability of the feeling of skin humidity did not mean that the sweating had stopped. It was rather because the sweat had soaked the surgical gown and the outer protective clothing increased the resistance to sweat evaporation. The clothes stuck to the participants’ skin and enhanced their wetness sensation.
Figure 13c shows the change in TCV. The overall average TCV was between −0.5 (neutral) and −2.5 (very uncomfortable). As the thermal stress level increased, the participants’ discomfort increased. Under the hot conditions of 27–29 °C, the TCV was between −1 and −2.5, and the discomfort was the most intense.
Figure 13d shows the change in thermal acceptability. As the level of thermal stress increased, the thermal acceptability in each case gradually decreased, and the thermal acceptability was the lowest for the hot working conditions of 27–29 °C.

4.2. Relationships between Subjective Evaluation and Physiological Parameters

Table 7 shows Pearson correlation coefficients between the physiological parameters and the subjective evaluation indexes. It can be seen from the table that the p(sig.) values between TSV and various parameters were all less than 0.05, and there was a significant positive correlation between physiological parameters and TSV. The correlation between Tsk and TSV was greater (r = 0.534 **). It can be seen that skin temperature was the main factor affecting the evaluation of human subjective thermal sensation. There was also a significant positive correlation between HSV and physiological parameters (p < 0.01). The correlation between SWp and HSV was greater (r = 0.509 **), followed by the mean skin temperature. This suggests that as sweat increases the moisture of the human skin, the more the human body sweats, the higher the participant’s HSV.
There was a significant negative correlation between TCV and various physiological parameters (p < 0.05). Among them, Tsk had the highest correlation with TCV (r = −0.510 **). Hence, skin temperature had a major impact on the subjective thermal comfort evaluation.

4.3. Sweating Position Voting

Figure 14 shows the sweating position voting and uncomfortable position voting under the four different working conditions. With the increase in thermal stress level, the proportion of participants’ sweating votes increased significantly, and the number of votes for sweating parts increased. Among them, the proportion of sweating voting of head, face, neck, chest and back was relatively large. These areas were obviously sensitive to sweating and had a greater impact on the overall sweating vote. For the hip, thigh, leg and foot, the proportion of the sweating vote was small, suggesting that the thermal regulation range of each of these body parts is not the same, and the sweating situation of each part is significantly different. The head and face sweat vote was high due to the use of goggles and masks which wrap the head very closely and hinder heat dissipation from the head. In addition, the heat dissipation from human breathing is also blocked, which increased the discomfort of the head and face. The head, face, neck, chest and back also accounted for the largest number of uncomfortable voting, which shows that sweat has a significant impact on human discomfort, and a large amount of sweat increases skin adhesion. Wet skin increased the friction between skin and clothing, which aggravated the discomfort of the participants.

4.4. Temperature and Humidity Expectation Votes

Figure 15 shows the voting chart of participants’ expectations of ambient temperature with the increase in heat exposure time. It can be seen from the figure that under the four different working conditions, the expected value of external environment heating is 0, and the expected value of personnel temperature is above 0.2. As the level of thermal stress increased, the degree of expected external environment cooling increased. The average expected vote of personnel temperature was 0.63, 0.72, 0.72 and 0.85 °C for each of the four working conditions, respectively. As the duration of heat exposure increased, the proportion of people expecting to become cooler also increased. When WBGT was 27–29 °C, almost all participants expected the temperature to become cooler, and as the exposure time increased, 100% of the participants finally expected the outside temperature to become colder with expected values of 0.5–1. At this time, the temperature expected average vote was 0.85. This suggests that under the thermal intensity of this environment, a control method must be adopted to improve the thermal sensation and comfort of the participants.
Figure 16 shows the voting chart of participants’ expectations of ambient humidity with the increase in exposure time under the four different experimental conditions. When WBGT rose from 21–23 °C to 27–29 °C, the proportion of expected humidity drying increased, with the average voting value increasing from 0.61 to 0.84, which indicates that the high heat intensity environment led to the aggravation of human discomfort. At 27–29 °C, up to 92% of the participants had a strong desire to reduce the humidity. As the experiment progressed, 100% of the participants finally expected the humidity to decrease. This indicates that for medical staff who work for a long time in a high-heat and humid environment, it is urgent to take measures to reduce the dampness of the human skin in order to improve the comfort of the human body.

5. Discussion

The experiments presented here were different from those that utilize experimental cabins or chambers as they used the outdoor natural environment as the experimental site. A lot of work has been done from the perspective of physiological reaction and subjective perception of real participants. This study mainly conducted a preliminary evaluation of the current situation in relation to the influence of medical protective clothing on human thermal comfort in hot and humid environments. The degree of thermal stress damage to the human body under different thermal stress levels was determined. Combined with the surveys of participants, the correlation analysis of participants’ subjective feelings and physiological parameters under different environments and gender conditions was analyzed. When the WBGT index is between 25 and 27 °C, it is necessary to take cooling measures to reduce the thermal stress damage to the human body. Based on the current research and as a comparative experiment, the future experiments mainly focuse on the cooling strategy of wearing protective clothing and choosing different cooling methods, and propose a set of optimal cooling strategies. There are several aspects of the study that can be improved upon:
(1) The research participants in the experiment were all university students in the context of various epidemic prevention measures, so the conclusions may have some limitations due to the physical condition and age of the participants. A wider sample range should be considered in the future.
(2) Considering the human body’s heat stress response, the test time of the participants was relatively short, and a follow-up study should consider longer test times appropriate to the study of the tolerance of the human body.
(3) The experiment mainly focused on the study of human thermal comfort under four different cases of WBGT index. Considering the problem of an equal number of people and the proportion of men and women under each case, the sample size of participants under each case was relatively small [32]; hence, the sample size needs to be expanded in later studies. As a comprehensive indicator, WBGT cannot completely reflect the real environmental conditions; therefore, an independent variable, e.g., air temperature or relative humidity, may be used as the evaluation index to analyze human thermal comfort in further studies.
(4) Due to the stress and danger experienced by nucleic acid sampling personnel, it is difficult to achieve real on-site testing. If conditions permit at a later stage, we should use real nucleic acid detection workers as the participants to increase the validity and objectivity of the experiment.
(5) Due to the limitation of the experiment itself and the urgency of time, the measurement method of body weight difference was used to calculate the metabolic rate, mainly considering that the participants wore masks, which limits the measurement of oxygen consumption. This could be improved upon in future studies.

6. Conclusions

An experimental outdoor work tent was used to study the thermal comfort of personnel in hot and humid environments. Using the wet bulb globe temperature (WBGT) index, the thermal environment was divided into four working conditions: 21–23 °C, 23–25 °C, 25–27 °C and 27–29 °C. Changes in physiological parameters of the test personnel were analyzed, and relationships between subjective feelings and physiological parameters of the simulated nucleic acid sampling personnel were investigated. The following main conclusions were drawn:
(1) When the WBGT index was between 25 and 27 °C, the human test participants had uncomfortable thermal sensations. When the WBGT index was between 27 and 29 °C, the test participants’ mean skin temperature was between 33.82 and 36.48 °C, their mean heart rate was 106.12 bpm, their mean sweat production in the test period (one hour) was 135.24 g and their PSI index reached 4.1 (moderate heat strain), all suggesting a relatively high level of discomfort.
(2) In terms of gender differences, there was no significant difference in Tsk and HR between male and female samples. There were significant differences in the SWp and M between male and female samples (p < 0.05). The mean skin temperature and sweating of the human body were the main factors affecting the subjective voting of participants. The correlation degree between Tsk and TSV and TCV was the most significant (p ≤ 0.01), and the correlation between sweating and HSV was significant (p ≤ 0.01).
(3) The forehead, chest and back were the three body locations with the highest skin temperature. From the participants’ voting of sweating and uncomfortable positions, the forehead, face, neck, chest and back accounted for the highest proportion of discomfort. When the WBGT increased to 27–29 °C, 100% of the participants expected the external temperature to be cooler and the humidity to be less, with expected values of 0.5–1. This shows that measures must be taken to reduce the temperature and humidity of the human skin surface in order to improve the thermal feeling and comfort of personnel.

Author Contributions

Conceptualization, Y.Z. and J.L.; methodology, J.L.; formal analysis, Y.Z. and J.L.; investigation, Y.Z., J.L., Y.D. and S.Z.; writing—original draft preparation, Y.Z.; writing—review and editing, J.L., M.K.K. and S.Z.; supervision, J.L. and M.K.K.; project administration, J.L. All authors have read and agreed to the published version of the manuscript.

Funding

This work was funded by the Support Plan for Outstanding Youth Innovation Team in Colleges and Universities of Shandong Province (2019KJG005) and Natural Science Foundation of Shandong Province (ZR2020ME211, ZR2021ME199).

Institutional Review Board Statement

The study was conducted according to the guidelines of the Declaration of Helsinki and approved by the Ethics Committee (represented by Science and Technology Department) of Shandong Jianzhu University (Project: ‘Experimental study on thermal comfort of COVID-19 nucleic acid sampling staff in hot and humid environment’, supervised by Jiying Liu, approved on 16 June 2020).

Informed Consent Statement

Informed consent was obtained from all subjects involved in the study.

Acknowledgments

This work acknowledges the support of the Plan of Introduction and Cultivation for Young Innovative Talents in Colleges and Universities of Shandong Province, as well as the graduate students as participants from Shandong Jianzhu University.

Conflicts of Interest

The authors declare no conflict of interest.

Nomenclature

COVID-19Coronavirus Disease 2019
WBGTwet bulb globe temperature
twwet bulb temperature, °C
tadry bulb temperature, °C
RHrelative humidity, %
tgblack globe temperature, °C
Tskmean skin temperature
SWpsweat production, g
Mmetabolic weight-loss, g
TSVthermal sensation votes
HRheart rate
HSVhumid sensation votes
TCVthermal comfort votes
Subscripts
1before the experiment
2after the experiment
PCprotective clothing
SGsurgical gown
Ttowel
Gglove

References

  1. Zhang, J.C.; Hao, X.M.; Zhou, G.T. A study on medical protective clothing and it’s properties of protectivity for SARS. J. Xian Univ. Eng. Ence Technol. 2003, 17, 7. [Google Scholar]
  2. Loibner, M.; Hagauer, S.; Schwantzer, G.; Berghold, A.; Zatloukal, K. Limiting factors for wearing personal protective equipment (PPE) in a health care environment evaluated in a randomised study. PLoS ONE 2019, 14, e0210775. [Google Scholar] [CrossRef] [PubMed]
  3. Rissanen, S.; Jousela, I.; Jeong, J.R.; Rintamaeki, H. Heat stress and bulkiness of chemical protective clothing impair performance of medical personnel in basic lifesaving tasks. Ergonomics 2008, 51, 1011–1022. [Google Scholar] [CrossRef]
  4. Laird, I.S.; Goldsmith, R.; Pack, R.J.; Vitalis, A. The Effect on Heart Rate and Facial Skin Temperature of Wearing Respiratory Protection at Work. Ann. Occup. Hyg. 2002, 46, 143–148. [Google Scholar] [CrossRef] [PubMed] [Green Version]
  5. Huaxia. More Than 1750 Construction Workers in Beijing Receive COVID-19 Nucleic Acid Tests on Friday. 2020. Available online: http://www.xinhuanet.com/english/2020-06/26/c_139168537.htm (accessed on 1 July 2021).
  6. Kumar, S.; Mathur, A.; Singh, M.K.; Rana, K. Adaptive thermal comfort study of workers in a mini-industrial unit during summer and winter season in a tropical country, India. Build. Environ. 2021, 197, 107874. [Google Scholar] [CrossRef]
  7. Du, C.; Li, B.; Yu, W.; Liu, H.; Li, C.; Yao, R. Moisture in clothing and its transient influence on human thermal responses through clothing microenvironment in cold environments in winter. Build. Environ. 2019, 150, 1–12. [Google Scholar] [CrossRef]
  8. Chen, Y.; Tao, M.; Liu, W. High temperature impairs cognitive performance during a moderate intensity activity. Build. Environ. 2020, 186, 107372. [Google Scholar] [CrossRef]
  9. Zhang, S.; Zhu, N.; Lu, S. Responses of human perception and skin temperature to directed thermal radiation in hot environments. Build. Environ. 2021, 197, 107857. [Google Scholar] [CrossRef]
  10. Yokota, M.; Bathalon, G.P.; Berglund, L.G. Assessment of male anthropometric trends and the effects on simulated heat stress responses. Graefe’s Arch. Clin. Exp. Ophthalmol. 2008, 104, 297–302. [Google Scholar] [CrossRef] [PubMed]
  11. Yokota, M.; Berglund, L.G.; Bathalon, G.P. Female anthropometric variability and their effects on predicted thermoregulatory responses to work in the heat. Int. J. Biometeorol. 2011, 56, 379–385. [Google Scholar] [CrossRef] [PubMed]
  12. Zhao, M.; Gao, C.; Li, J.; Wang, F. Effects of two cooling garments on post-exercise thermal comfort of female subjects in the heat. Fibers Polym. 2015, 16, 1403–1409. [Google Scholar] [CrossRef]
  13. Troynikov, O.; Nawaz, N.; Watson, C. Medical protective clothing. Protective Clothing 2014, 20, 192–224. [Google Scholar] [CrossRef]
  14. Celcar, D.; Meinander, H.; Geršak, J. Heat and moisture transmission properties of clothing systems evaluated by using a sweating thermal manikin under different environmental conditions. Int. J. Cloth. Sci. Technol. 2008, 20, 240–252. [Google Scholar] [CrossRef]
  15. Roossien, C.; Heus, R.; Reneman, M.; Verkerke, G. Monitoring core temperature of firefighters to validate a wearable non-invasive core thermometer in different types of protective clothing: Concurrent in-vivo validation. Appl. Ergon. 2020, 83, 103001. [Google Scholar] [CrossRef]
  16. Wang, F.; Chow, C.S.-W.; Zheng, Q.; Ke, Y.; Yang, B.; Zheng, X.; Noor, N.; Zhang, Q.; Zhang, C.; Zhou, H. On the use of personal cooling suits to mitigate heat strain of mascot actors in a hot and humid environment. Energy Build. 2019, 205, 109561. [Google Scholar] [CrossRef]
  17. Hertleer, C.; Rogier, H.; Vallozzi, L.; van Langenhove, L. A Textile Antenna for Off-Body Communication Integrated Into Protective Clothing for Firefighters. IEEE Trans. Antennas Propag. 2009, 57, 919–925. [Google Scholar] [CrossRef]
  18. Du, C.; Li, B.; Li, Y.; Xu, M.; Yao, R. Modification of the Predicted Heat Strain (PHS) model in predicting human thermal responses for Chinese workers in hot environments. Build. Environ. 2019, 165, 106349. [Google Scholar] [CrossRef]
  19. Sakoi, T.; Mochida, T. Concept of the equivalent wet bulb globe temperature index forindicating safe thermal occupational environments. Build. Environ. 2013, 67, 167–178. [Google Scholar] [CrossRef]
  20. Xu, J.; Psikuta, A.; Li, J.; Annaheim, S.; Rossi, R.M. Influence of human body geometry, posture and the surrounding environment on body heat loss based on a validated numerical model. Build. Environ. 2019, 166, 106340. [Google Scholar] [CrossRef]
  21. Sajad, Z.; Naser, H.; Elahi, S.H.; Rasoul, H.; Keyvan, S.; Saeid, A. Comparing Universal Thermal Climate Index (UTCI) with selected thermal indices/environmental parameters during 12 months of the year. Weather. Clim. Extrem. 2018, 19, 49–57. [Google Scholar]
  22. Fang, Z.; Feng, X.; Liu, A.J.; Lin, Z.; Mak, C.M.; Niu, J.; Tse, K.-T.; Xu, X. Investigation into the differences among several outdoor thermal comfort indices against field survey in subtropics. Sustain. Cities Soc. 2019, 44, 676–690. [Google Scholar] [CrossRef]
  23. Chong, D.; Zhu, N.; Zheng, G. Developing a continuous graphical index to assess heat strain in extremely hot environments. Build. Environ. 2018, 138, 283–292. [Google Scholar] [CrossRef]
  24. Bongers, C.C.; De Korte, J.Q.; Catoire, M.; Greefhorst, J.; E Hopman, M.T.; Kingma, B.; Eijsvogels, T.M.H. Infographic. Cooling strategies to attenuate PPE-induced heat strain during the COVID-19 pandemic. Br. J. Sports Med. 2021, 55, 69–70. [Google Scholar] [CrossRef]
  25. Potter, A.W.; Blanchard, L.A.; Friedl, K.E.; Cadarette, B.S.; Hoyt, R.W. Mathematical prediction of core body temperature from environment, activity, and clothing: The heat strain decision aid (HSDA). J. Therm. Biol. 2017, 64, 78–85. [Google Scholar] [CrossRef] [PubMed]
  26. Potter, A.W.; Gonzalez, J.A.; Karis, A.J.; Xu, X. Biophysical Assessment and Predicted Thermophysiologic Effects of Body Armor. PLoS ONE 2015, 10, e0132698. [Google Scholar] [CrossRef]
  27. Francesca, D.A.A.; Jacques, M.; Igor, P.B.; Giuseppe, R. WBGT index revisited after 60 years of use. Ann. Occup. Hyg. 2014, 58, 955–970. [Google Scholar]
  28. Mochida, T.; Shimakura, K.; Yoshida, N. Comparison of Formulas for Calculating Average Skin Temperature and their Characteristics. Ann. Physiol. Anthr. 1994, 13, 357–373. [Google Scholar] [CrossRef] [PubMed] [Green Version]
  29. Stofan, J.R.; Baker, L.B.; Hamilton, A.A.; Horswill, C.A. Comparison of Regional Patch Collection vs. Whole-body Washdown for Measuring Sweat Sodium Loss during Exercise: 2107: Board #248 May 28 9:00 AM–10:30 AM. Med. Sci. Sports Exerc. 2009, 41, 235. [Google Scholar]
  30. ISO 8993 2004. Ergonomics of the Thermal Environment-Determination of Metabolic Rate; International Organization for Standardization (ISO): Geneva, Switzerland, 2004. [Google Scholar]
  31. Pokorný, J.; Fišer, J.; Fojtlín, M.; Kopečková, B.; Toma, R.; Slabotínský, J.; Jícha, M. Verification of Fiala-based human thermophysiological model and its application to protective clothing under high metabolic rates. Build. Environ. 2017, 126, 13–26. [Google Scholar] [CrossRef]
  32. Li, L.; Lian, Z. Application of statistical power analysis—How to determine the right sample size in human health, comfort and productivity research. Build. Environ. 2010, 45, 1202–1213. [Google Scholar]
Figure 1. Typical working environments and protective clothing for COVID-19 nucleic acid sampling personnel.
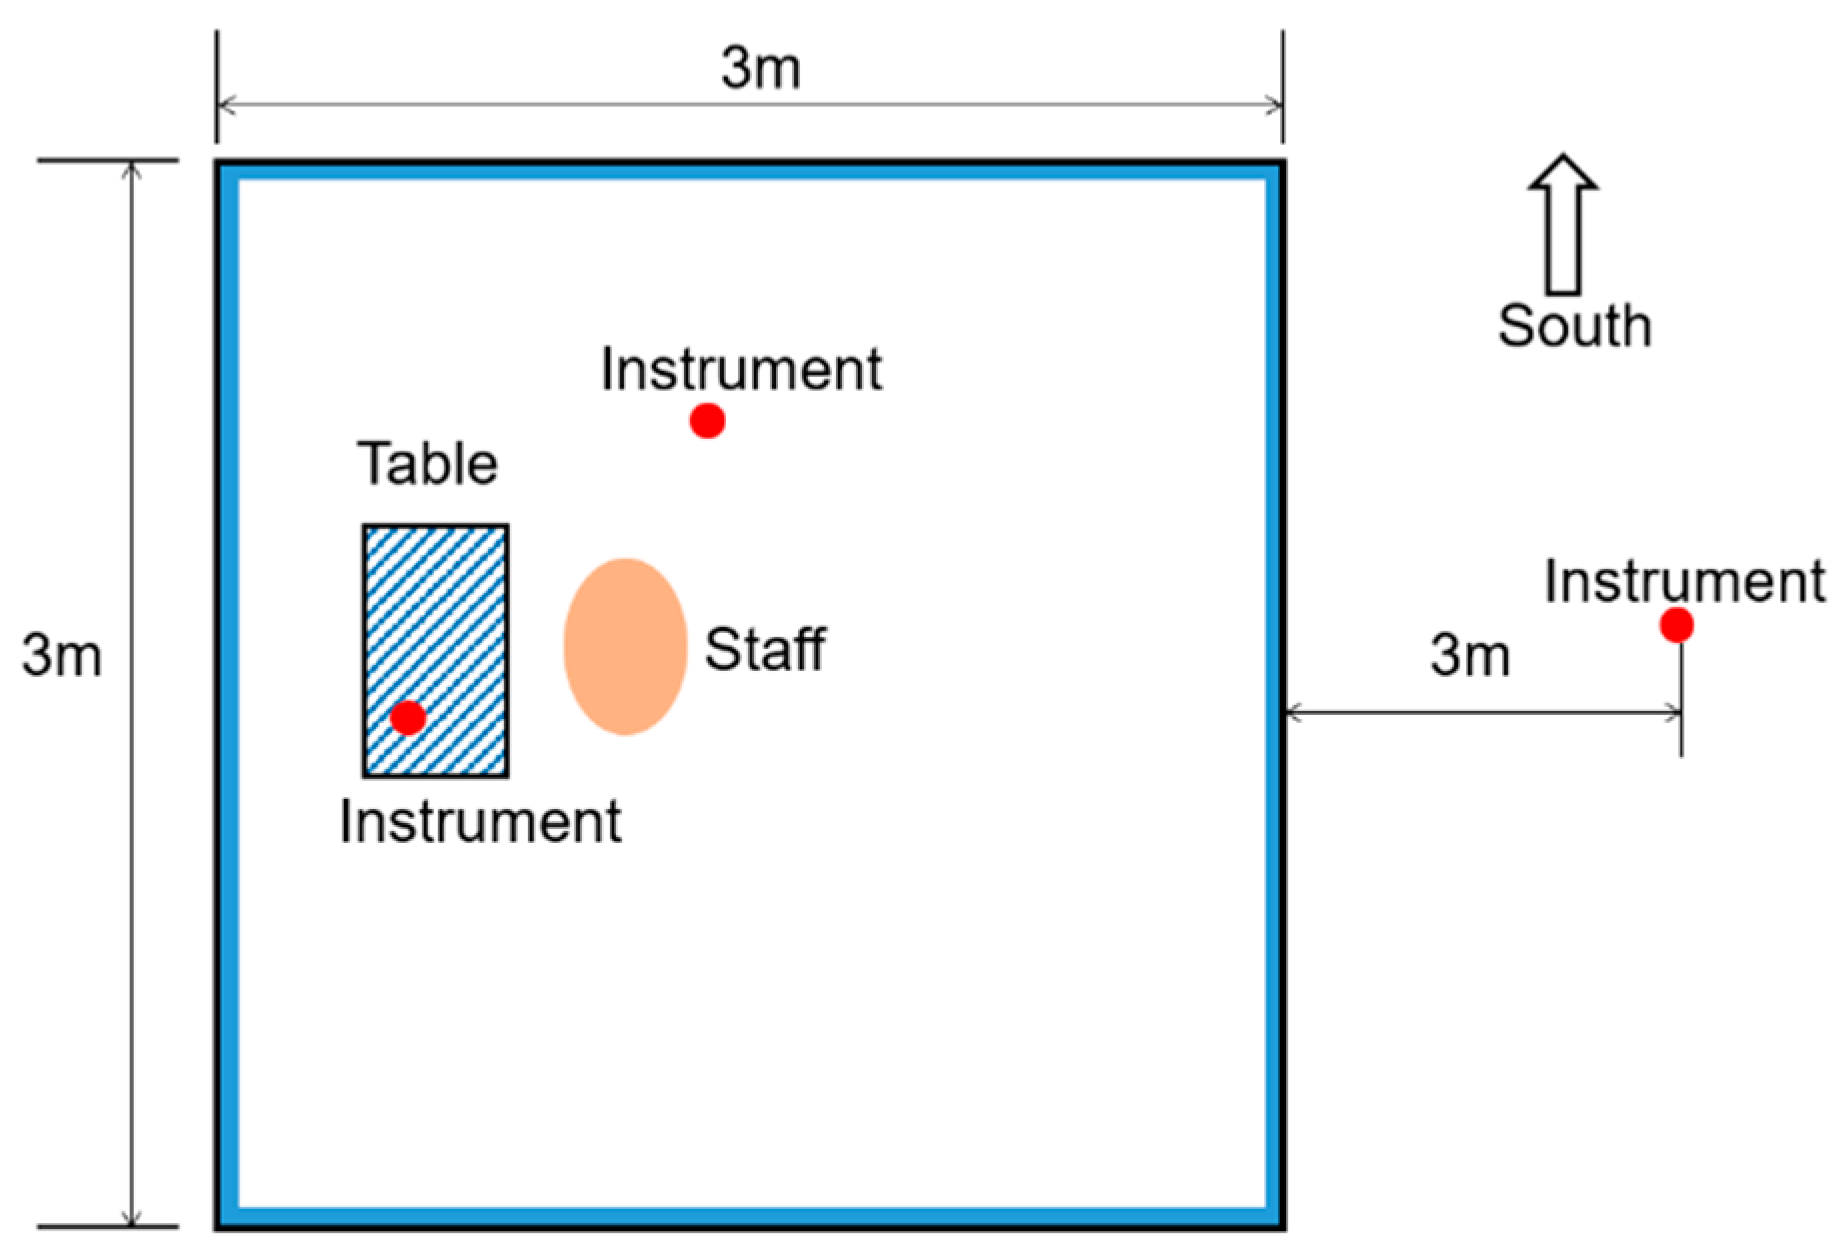
Applsci 11 11492 g001
Figure 2. The location and general arrangements of the experimental site.
Applsci 11 11492 g002
Figure 3. Details of the experimental tent layout.
Applsci 11 11492 g003
Figure 4. Participants wearing the experimental clothes: (a) full-body nonwoven disposable protective clothing, face mask, goggles and gloves; (b) surgical gown.
Applsci 11 11492 g004
Figure 5. Details of the basis for the division of the sampled working conditions into four thermal categories. (Note: The colored ovals represent the sample range selected under different working conditions).
Applsci 11 11492 g005
Figure 6. The subjective feeling voting scales.
Applsci 11 11492 g006
Figure 7. Schematic diagram of the experimental procedures.
Applsci 11 11492 g007
Figure 8. Variation of Tsk and HR with time under four different working conditions (i.e., 21–23 °C, 23–25 °C, 25–27 °C and 27–29 °C). (a) Mean skin temperature, (b) Heart Rate. Note: * and ** represent the correlation between WBGT and various parameters; * p < 0.05, ** p < 0.01.
Applsci 11 11492 g008
Figure 9. Average skin temperatures for eight different locations on the body of test participants under four different working conditions (i.e., 21–23 °C, 23–25 °C, 25–27 °C and 27–29 °C).
Applsci 11 11492 g009
Figure 10. The amount of sweat production and metabolic rate under four different working conditions (i.e., 21–23 °C, 23–25 °C, 25–27 °C and 27–29 °C). (a) Sweat production, (b) Metabolic weight-loss.
Applsci 11 11492 g010
Figure 11. Typical sweating patterns of test participants.
Applsci 11 11492 g011
Figure 12. Changes of physiological strain index with time under four different working conditions (i.e., 21–23 °C, 23–25 °C, 25–27 °C and 27–29 °C).
Applsci 11 11492 g012
Figure 13. Comprehensive subjective evaluation voting (thermal sensation votes, humid sensation votes, thermal comfort votes, thermal acceptance votes) under four different working conditions (i.e., 21–23 °C, 23–25 °C, 25–27 °C and 27–29 °C). (a) TSV, (b) HSV, (c) TCV, (d) Thermal acceptability.
Applsci 11 11492 g013
Figure 14. Voting of participants’ sweating and uncomfortable position under four different working conditions (i.e., 21–23 °C, 23–25 °C, 25–27 °C and 27–29 °C). (a) Sweating position voting, (b) Uncomfortable position voting.
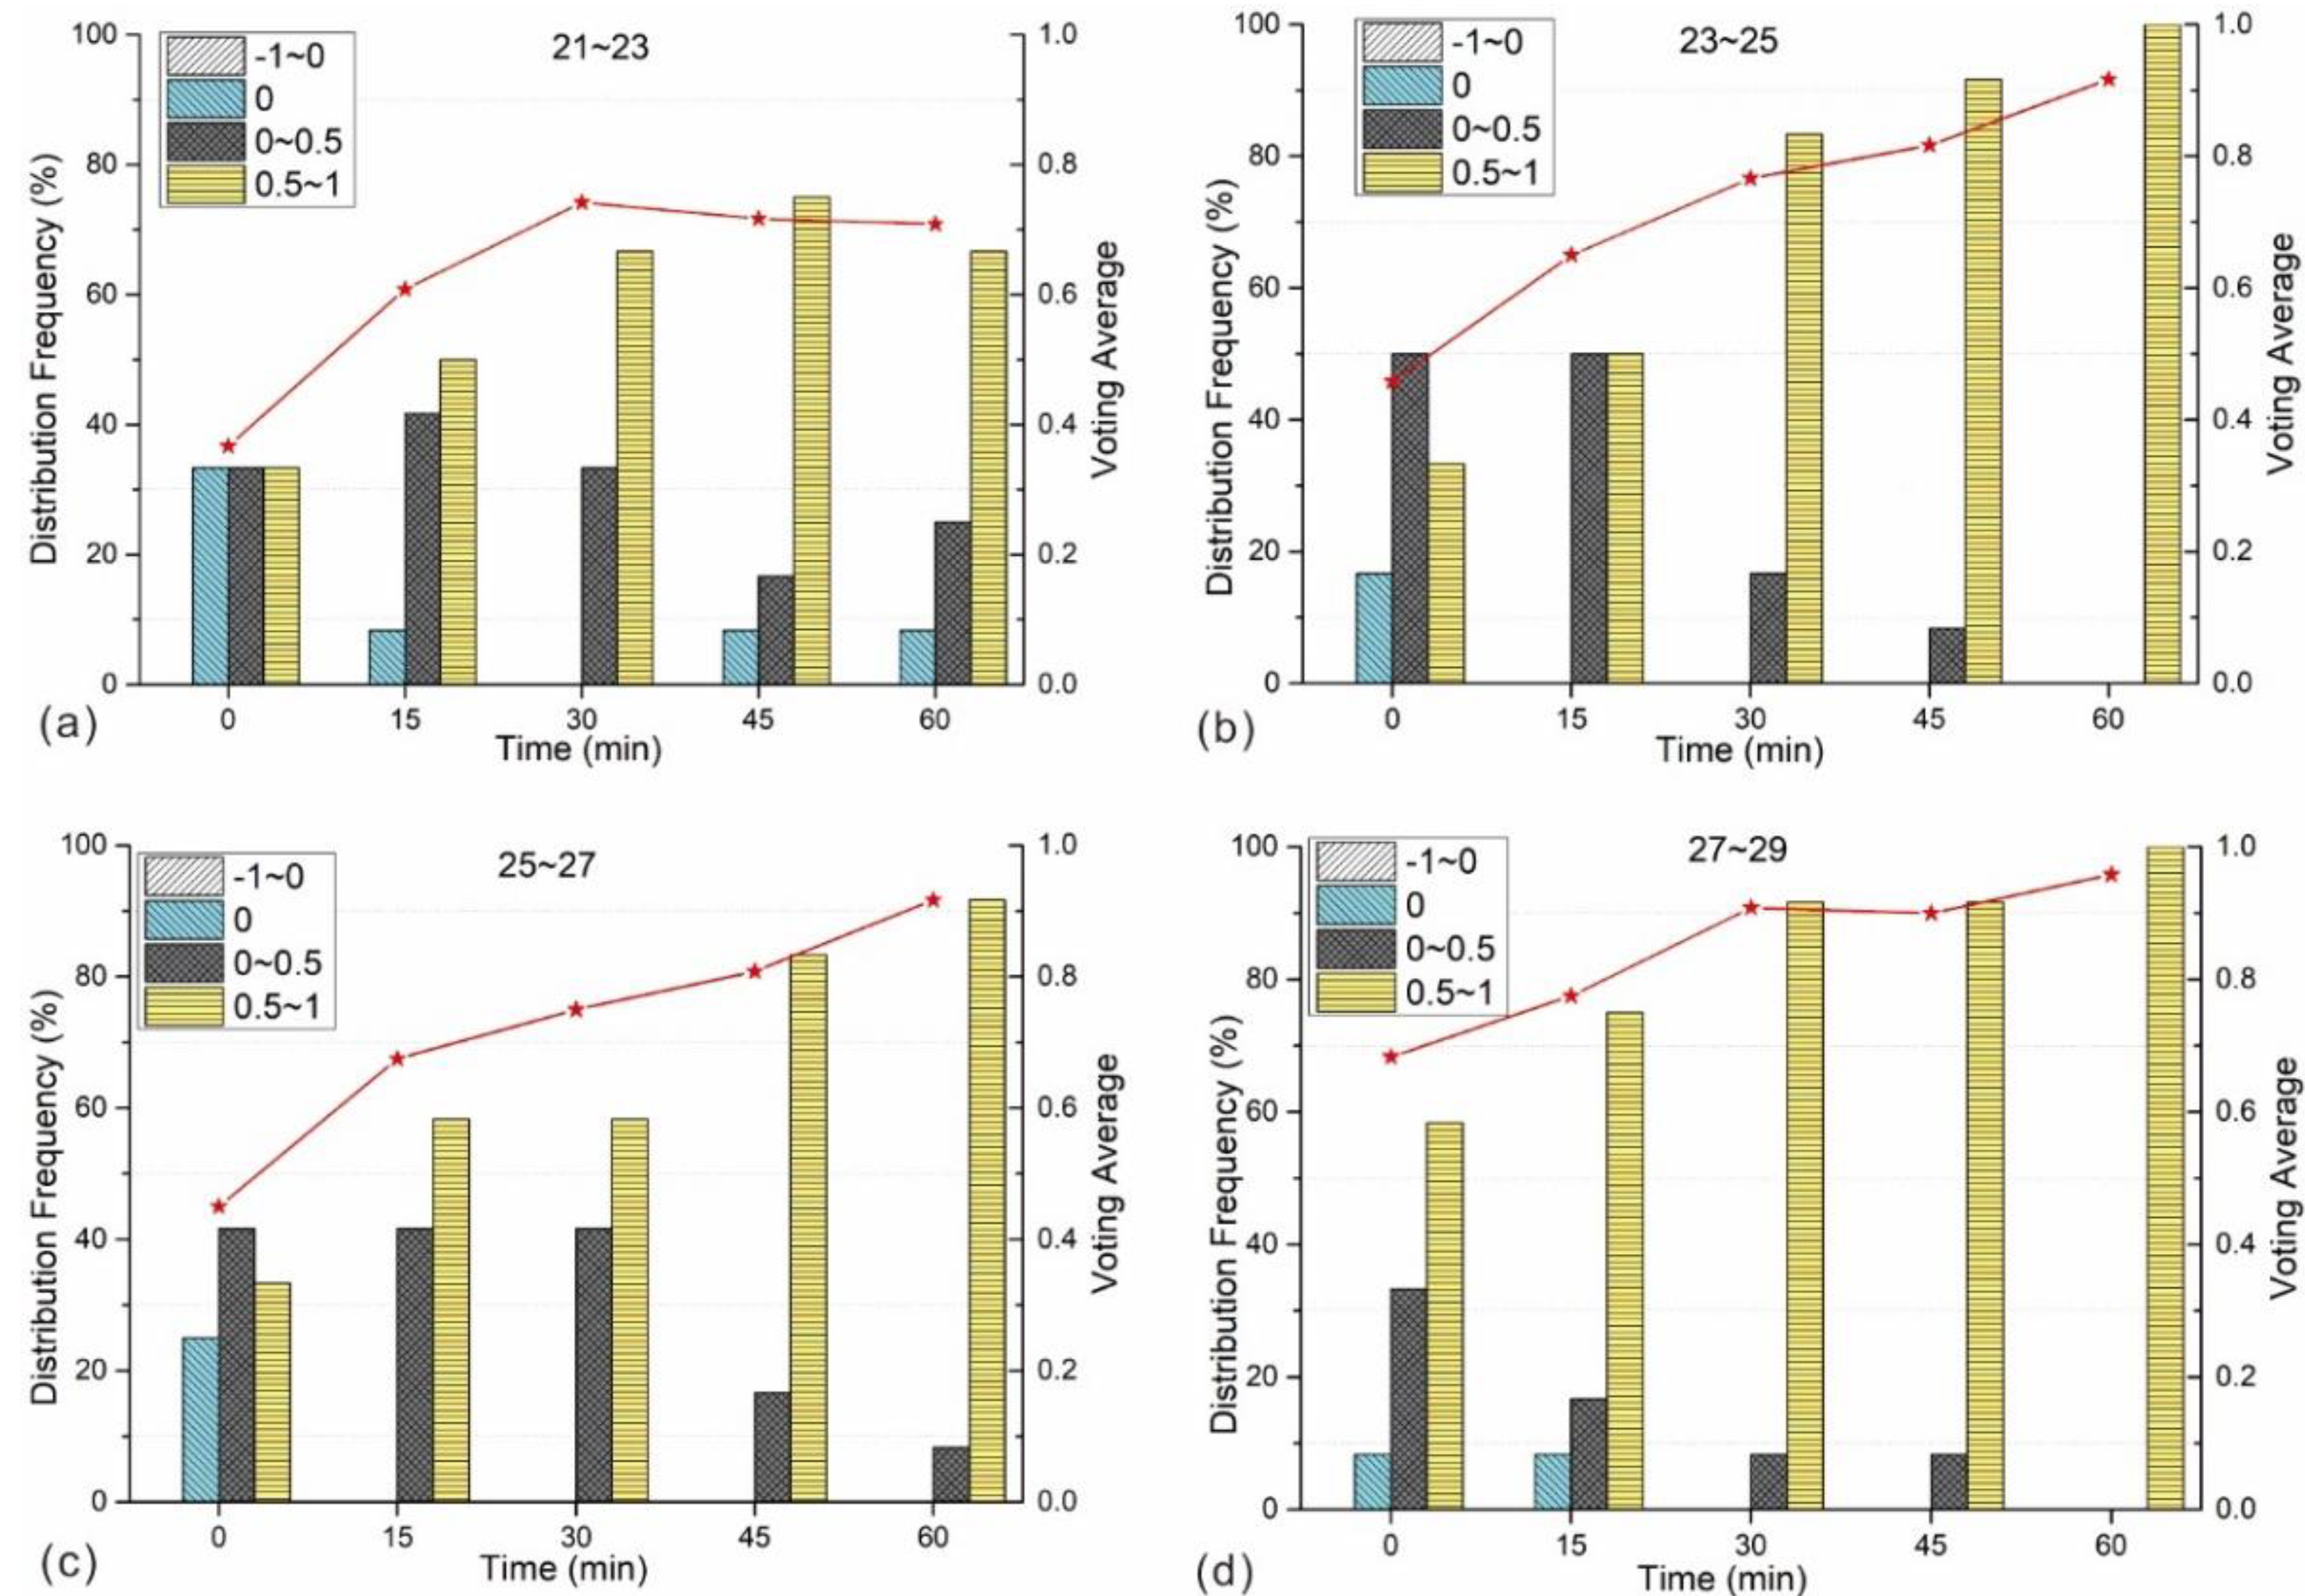
Applsci 11 11492 g014
Figure 15. The variation of the temperature expectation vote with time under four different working conditions (i.e., 21–23 °C, 23–25 °C, 25–27 °C and 27–29 °C). (a) Working condition: 21–23 °C, (b) Working condition: 23–25 °C, (c) Working condition: 25–27 °C, (d) Working condition: 27–29 °C.
Applsci 11 11492 g015
Figure 16. The variation of the humidity expectation vote with time under four different working conditions (i.e., 21–23 °C, 23–25 °C, 25–27 °C and 27–29 °C). (a) Working condition: 21–23 °C, (b) Working condition: 23–25 °C, (c) Working condition: 25–27 °C, (d) Working condition: 27–29 °C.
Applsci 11 11492 g016
Table 1. Environmental conditions experienced during the test period.
DateTemperature (°C)Weather ConditionHumidity (%)Solar Radiation (W/m2)
30 June24.0–29.5Cloudy52–74165–1096
1 July27.1–35.1Cloudy30–55221–1053
2 July26.6–29.8Overcast49–58248–819
3 July24.8–28.2Overcast59–6650–418
4 July25.6–30.8Sunny51–66126–980
5 July25.5–33.3Sunny47–69117–1080
6 July26.0–29.4Cloudy59–70279–829
7 July27.5–37.1Sunny34–64115–965
8 July28.5–36.7Cloudy30–63131–993
9 July21.9–27.7Cloudy54–8030–296
10 July25.2–31.8Cloudy50–65104–814
11 July27.1–31.4Drizzly52–6743–735
20 July25.7–38.0Sunny36–74250–978
27 July25.3–29.0Cloudy54–77101–1081
Table 2. The details of the physiological and environmental testing instrumentation used in the experiment.
ParameterInstrument
Type
Parameter RangeAccuracyResolutionInstrument
Air temperatureHOBO MX2301A−40 to 70 °C±0.2 °C0.02 °C Applsci 11 11492 i001
Air humidity0–100% RH±2.5%0.01%
Globe temperatureJI-IAQ-50−20 to 85 °C±0.5 °C0.1 °C Applsci 11 11492 i002
Skin temperatureiButton−20 to 85 °C±0.0625 °C0.1 °C Applsci 11 11492 i003
Core temperatureDigi-sense 20250-93−40 to 125 °C±0.5 °C0.1 °C Applsci 11 11492 i004
Heart ratePOLAR30–240 bpm±1 bpm1 bpm Applsci 11 11492 i005
Human body scaleES-100KT-50.005–100 kg±10 g5 g Applsci 11 11492 i006
Electronic balanceMeilen-MTB0–3 kg±0.01 g0.01 g Applsci 11 11492 i007
Table 3. Average environmental parameters for each of the four working conditions.
Working ConditionWBGT (°C)ta (°C)RH (%)
21–2323.0424.7877.02
23–2524.7928.2260.35
25–2726.4529.8557.83
27–2928.6035.1239.30
Table 4. Basic information for the experimental participants.
Age (Years)Height (cm)Weight (kg)BMI
AllAVE23.73171.0062.6921.24
STDEVP0.757.8713.423.28
MaleAVE23.50176.3372.6723.35
STDEVP0.763.309.043.05
FemaleAVE24.00164.6050.8018.70
STDEVP0.636.955.270.77
Table 5. Correlation between WBGT index and various physiological parameters.
TskHRSWpM
WBGTPearson0.854 **0.739 **0.670 **0.623 **
p(sig.)0.0000.0000.0000.000
Note: 0.01 < p ≤ 0.05, * significant correlation; p ≤ 0.01, ** significant correlation.
Table 6. Results of t-test analyses of the physiological parameters of male and female test participants.
FSignificancetp(Sig.)Mean Difference
TskEqual variances assumed0.1100.741−0.5470.5870.248
Equal variances not assumed −0.5470.5870.248
HREqual variances assumed2.7580.1060.8700.3912.464
Equal variances not assumed 0.9060.3712.464
SWpEqual variances assumed12.9920.0012.7730.00846.674
Equal variances not assumed 2.7730.00946.674
MEqual variances assumed2.3130.1352.3740.0224.713
Equal variances not assumed 2.3740.0234.713
Note: p(Sig.) < 0.05 is significant.
Table 7. Pearson correlation analysis between subjective evaluation and physiological parameters.
TskHRSWpM
TSVPearson0.534 **0.495 **0.416 **0.318 *
p(sig.)0.0000.0020.0030.028
HSVPearson0.494 **0.375 **0.509 **0.407 **
p(sig.)0.0090.0020.0000.004
TCVPearson−0.510 **−0.335 *−0.379 **−0.319 **
p(sig.)0.0010.0460.0080.002
Note: 0.01 < p ≤ 0.05,* significant correlation; p ≤ 0.01, ** significant correlation.
Publisher’s Note: MDPI stays neutral with regard to jurisdictional claims in published maps and institutional affiliations.

