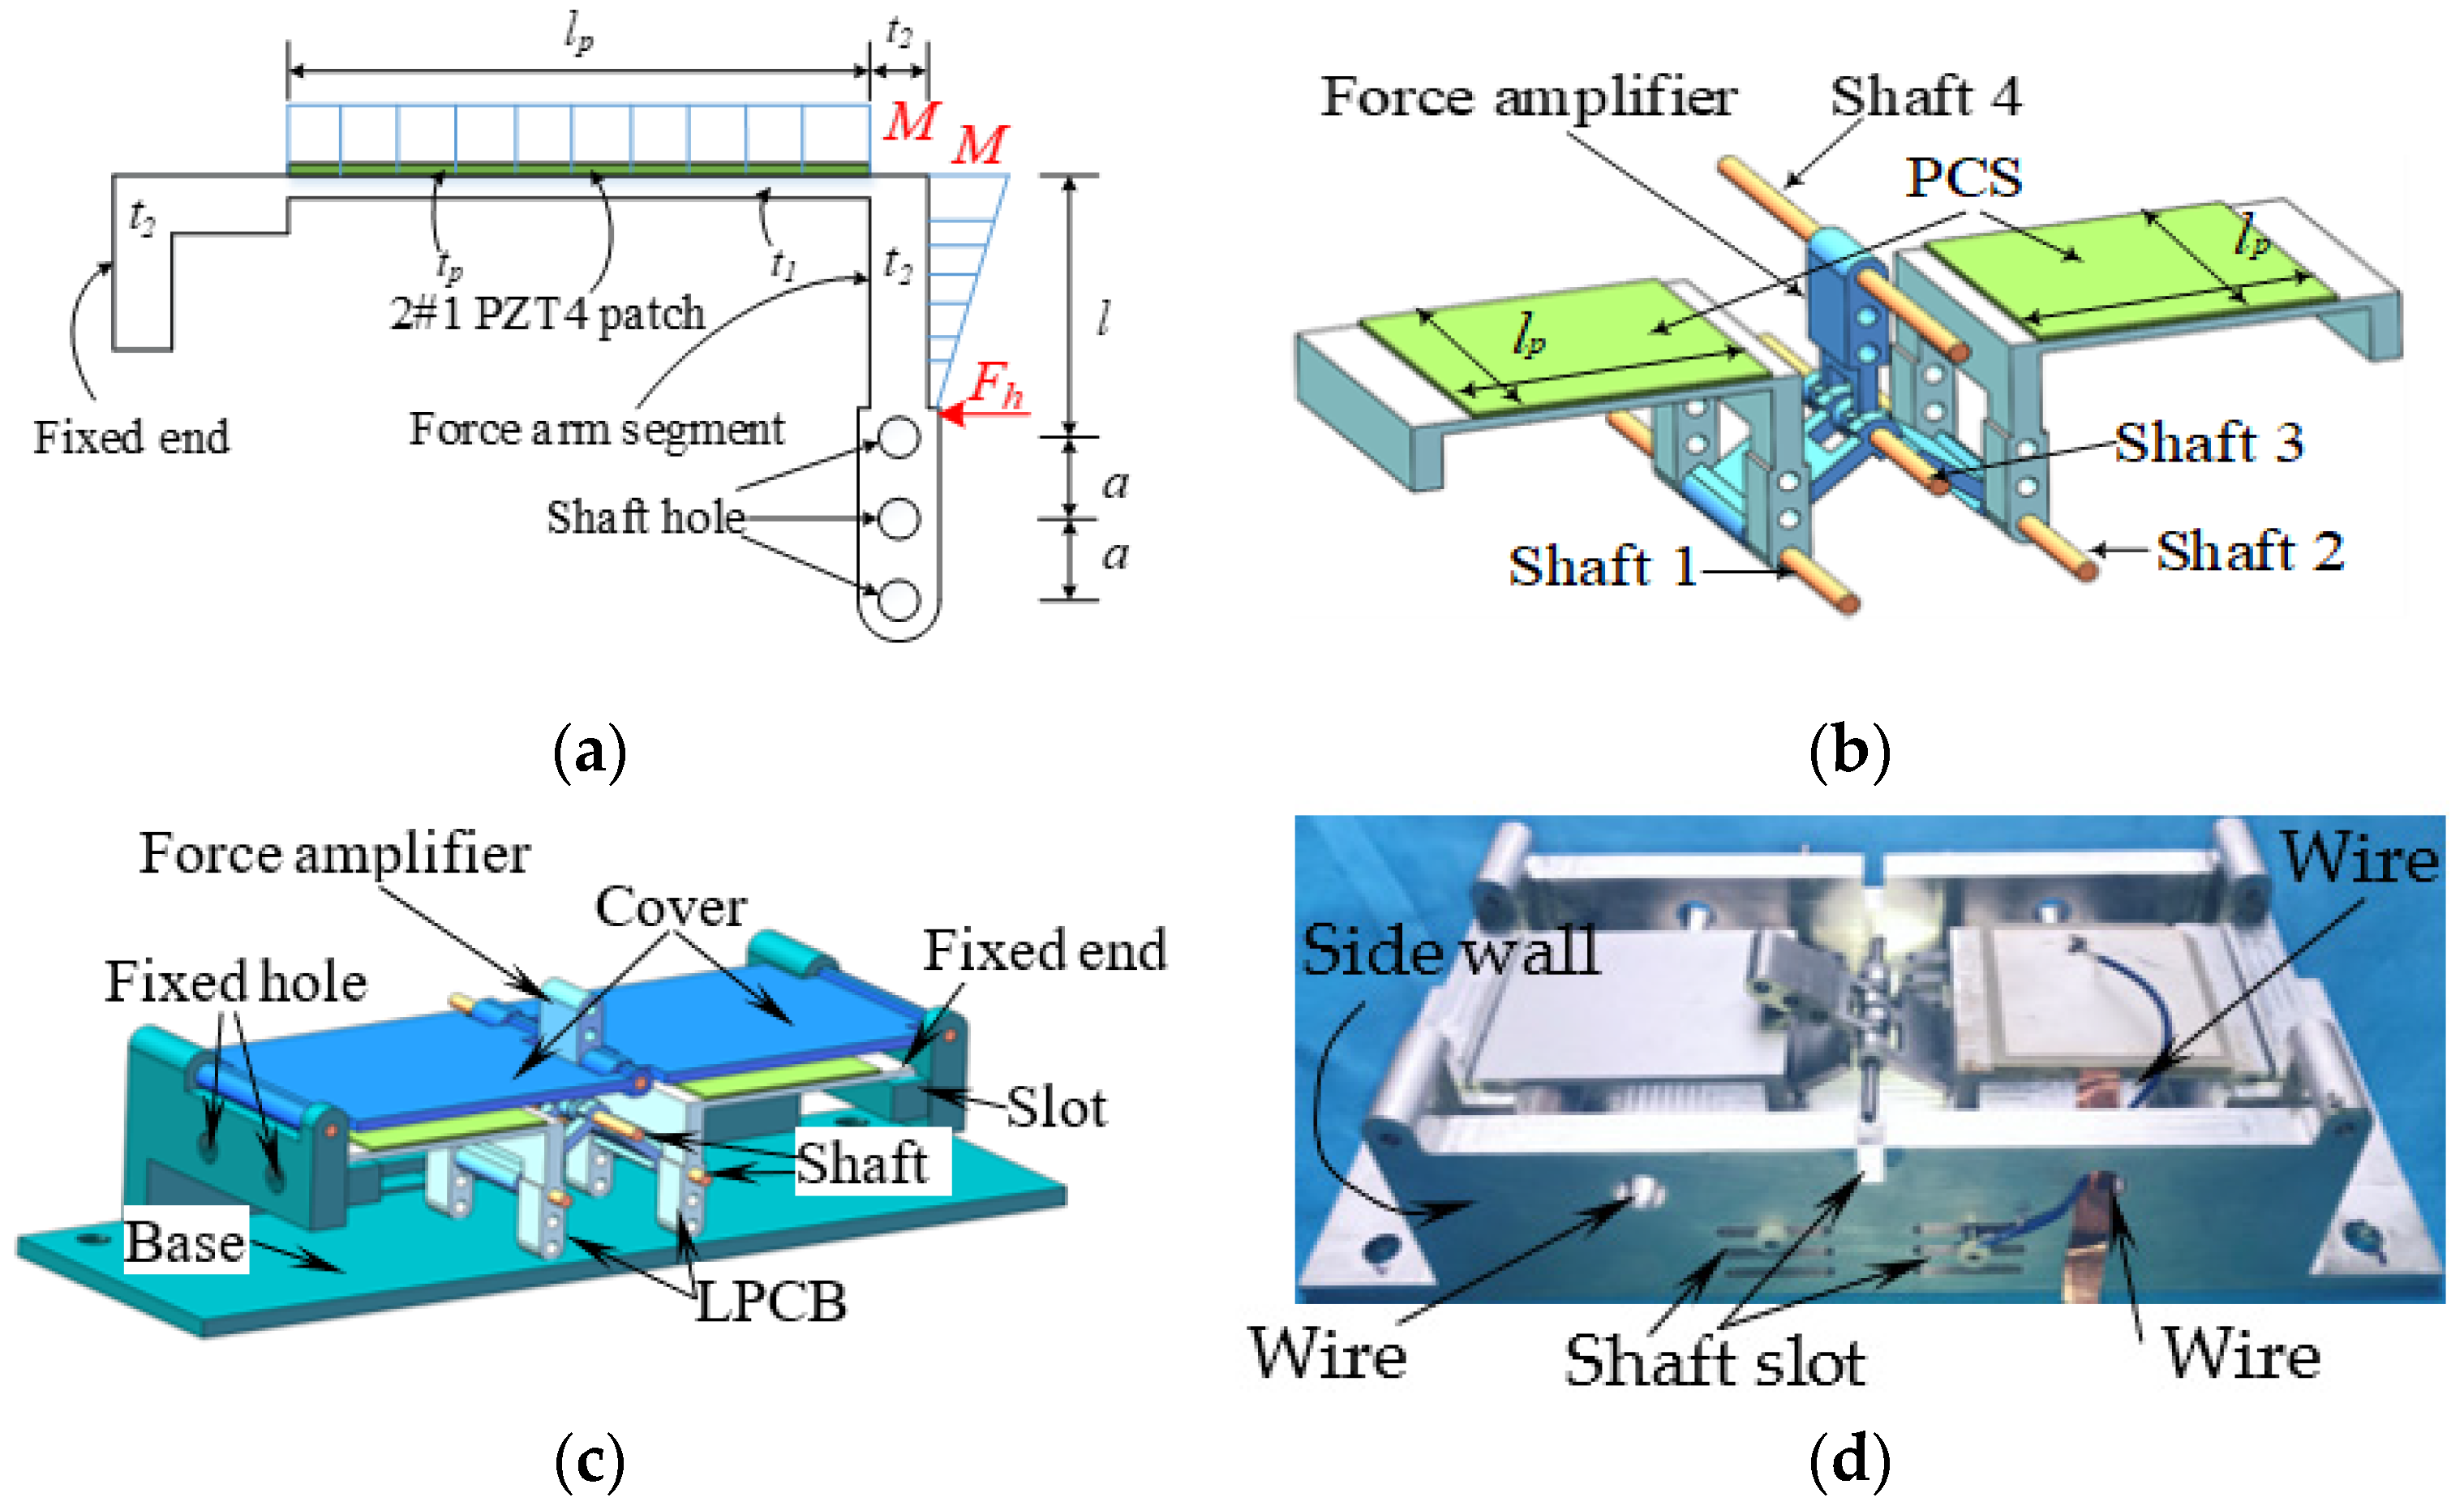
Figure 1.
1# piezoelectric brick made of a pair of LPCBs with one PCS. (a) A section view of an LPCB; (b) An assembly diagram; (c) A section view of 1# piezoelectric brick; (d) An experiment specimen of a piezoelectric brick.
Figure 1.
1# piezoelectric brick made of a pair of LPCBs with one PCS. (a) A section view of an LPCB; (b) An assembly diagram; (c) A section view of 1# piezoelectric brick; (d) An experiment specimen of a piezoelectric brick.
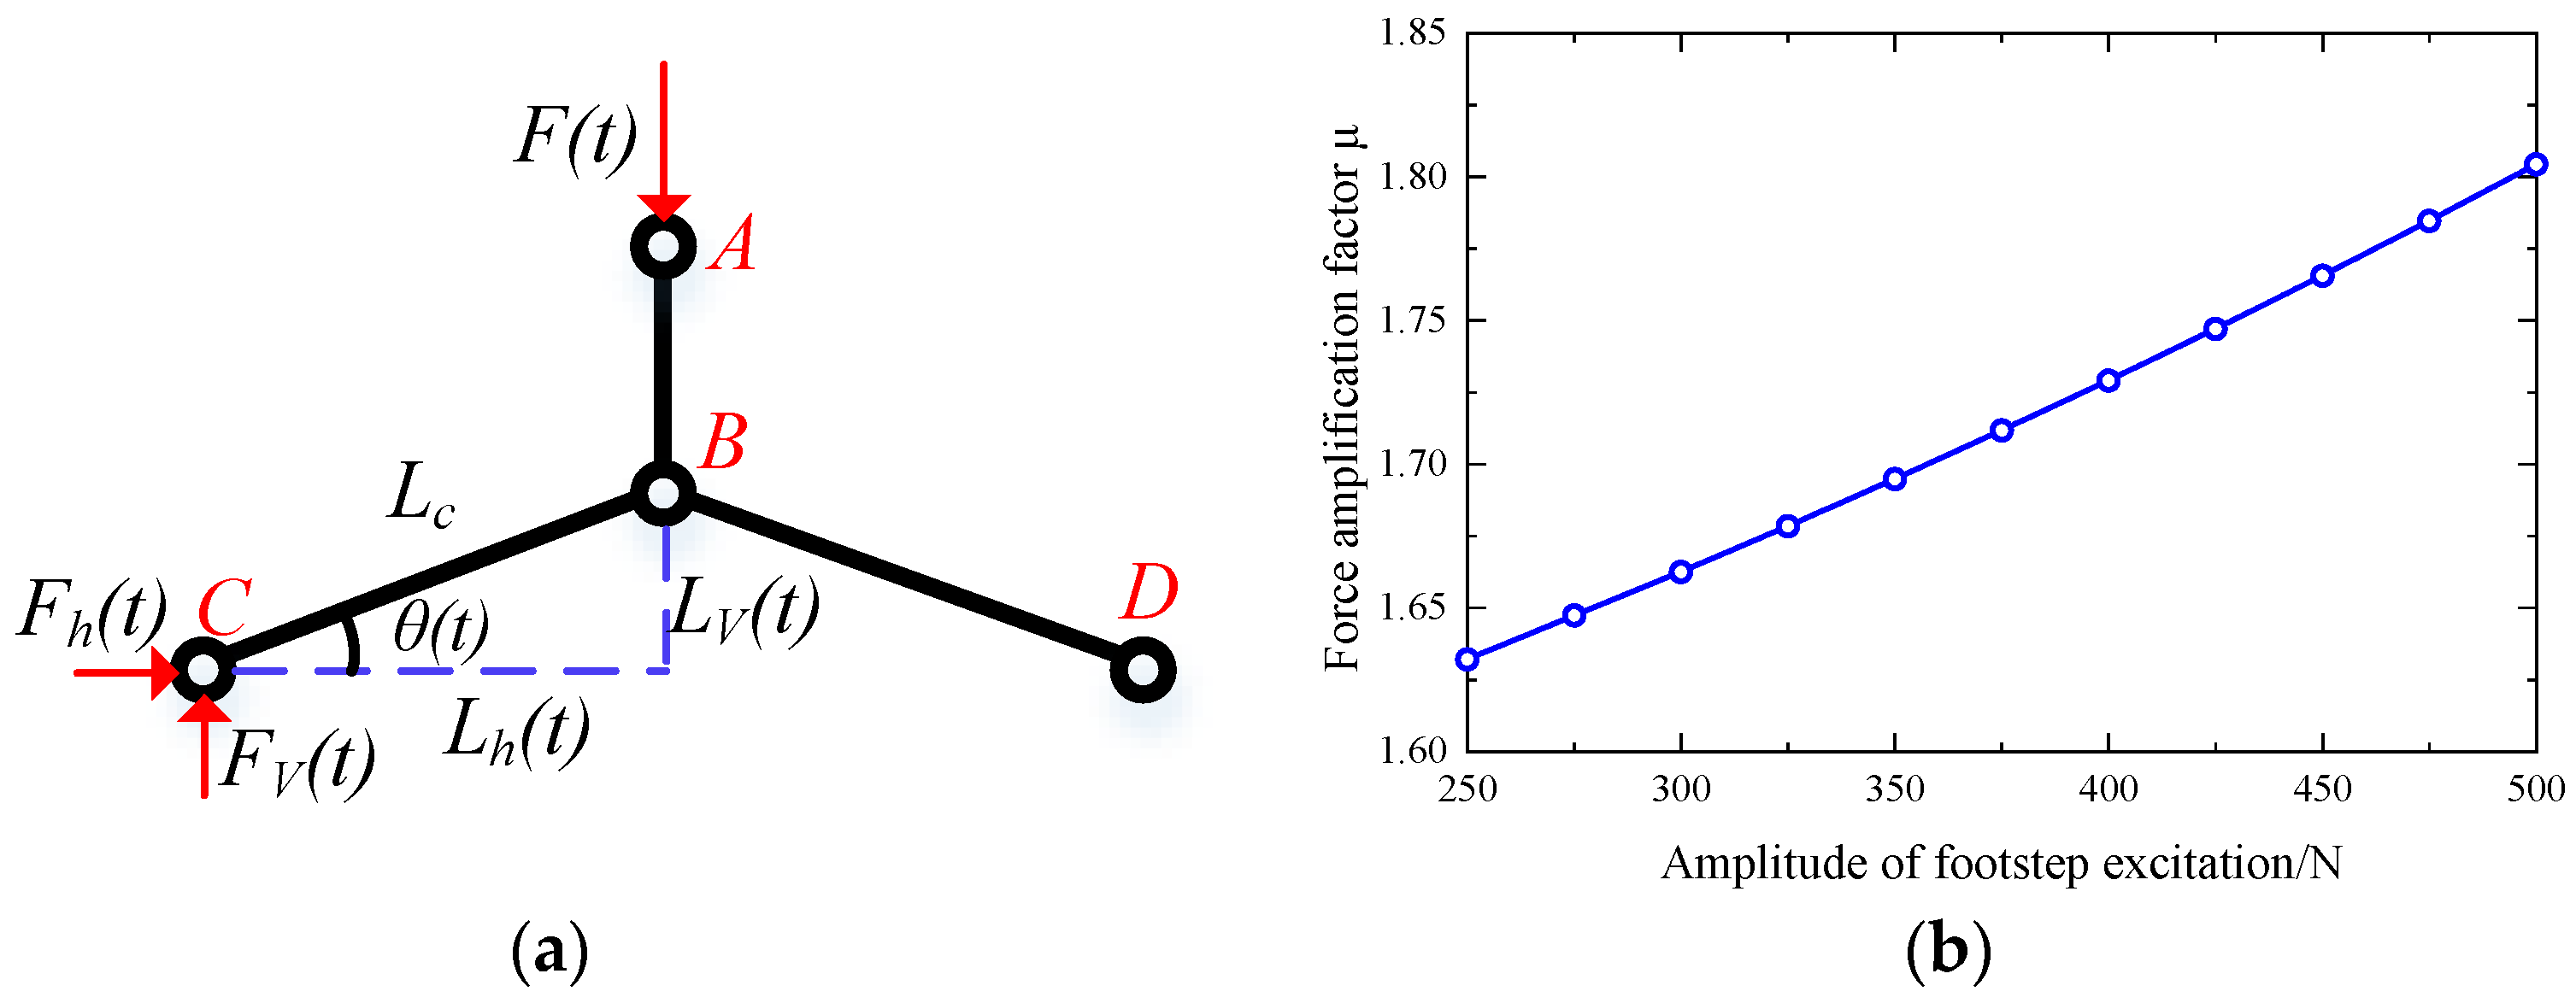
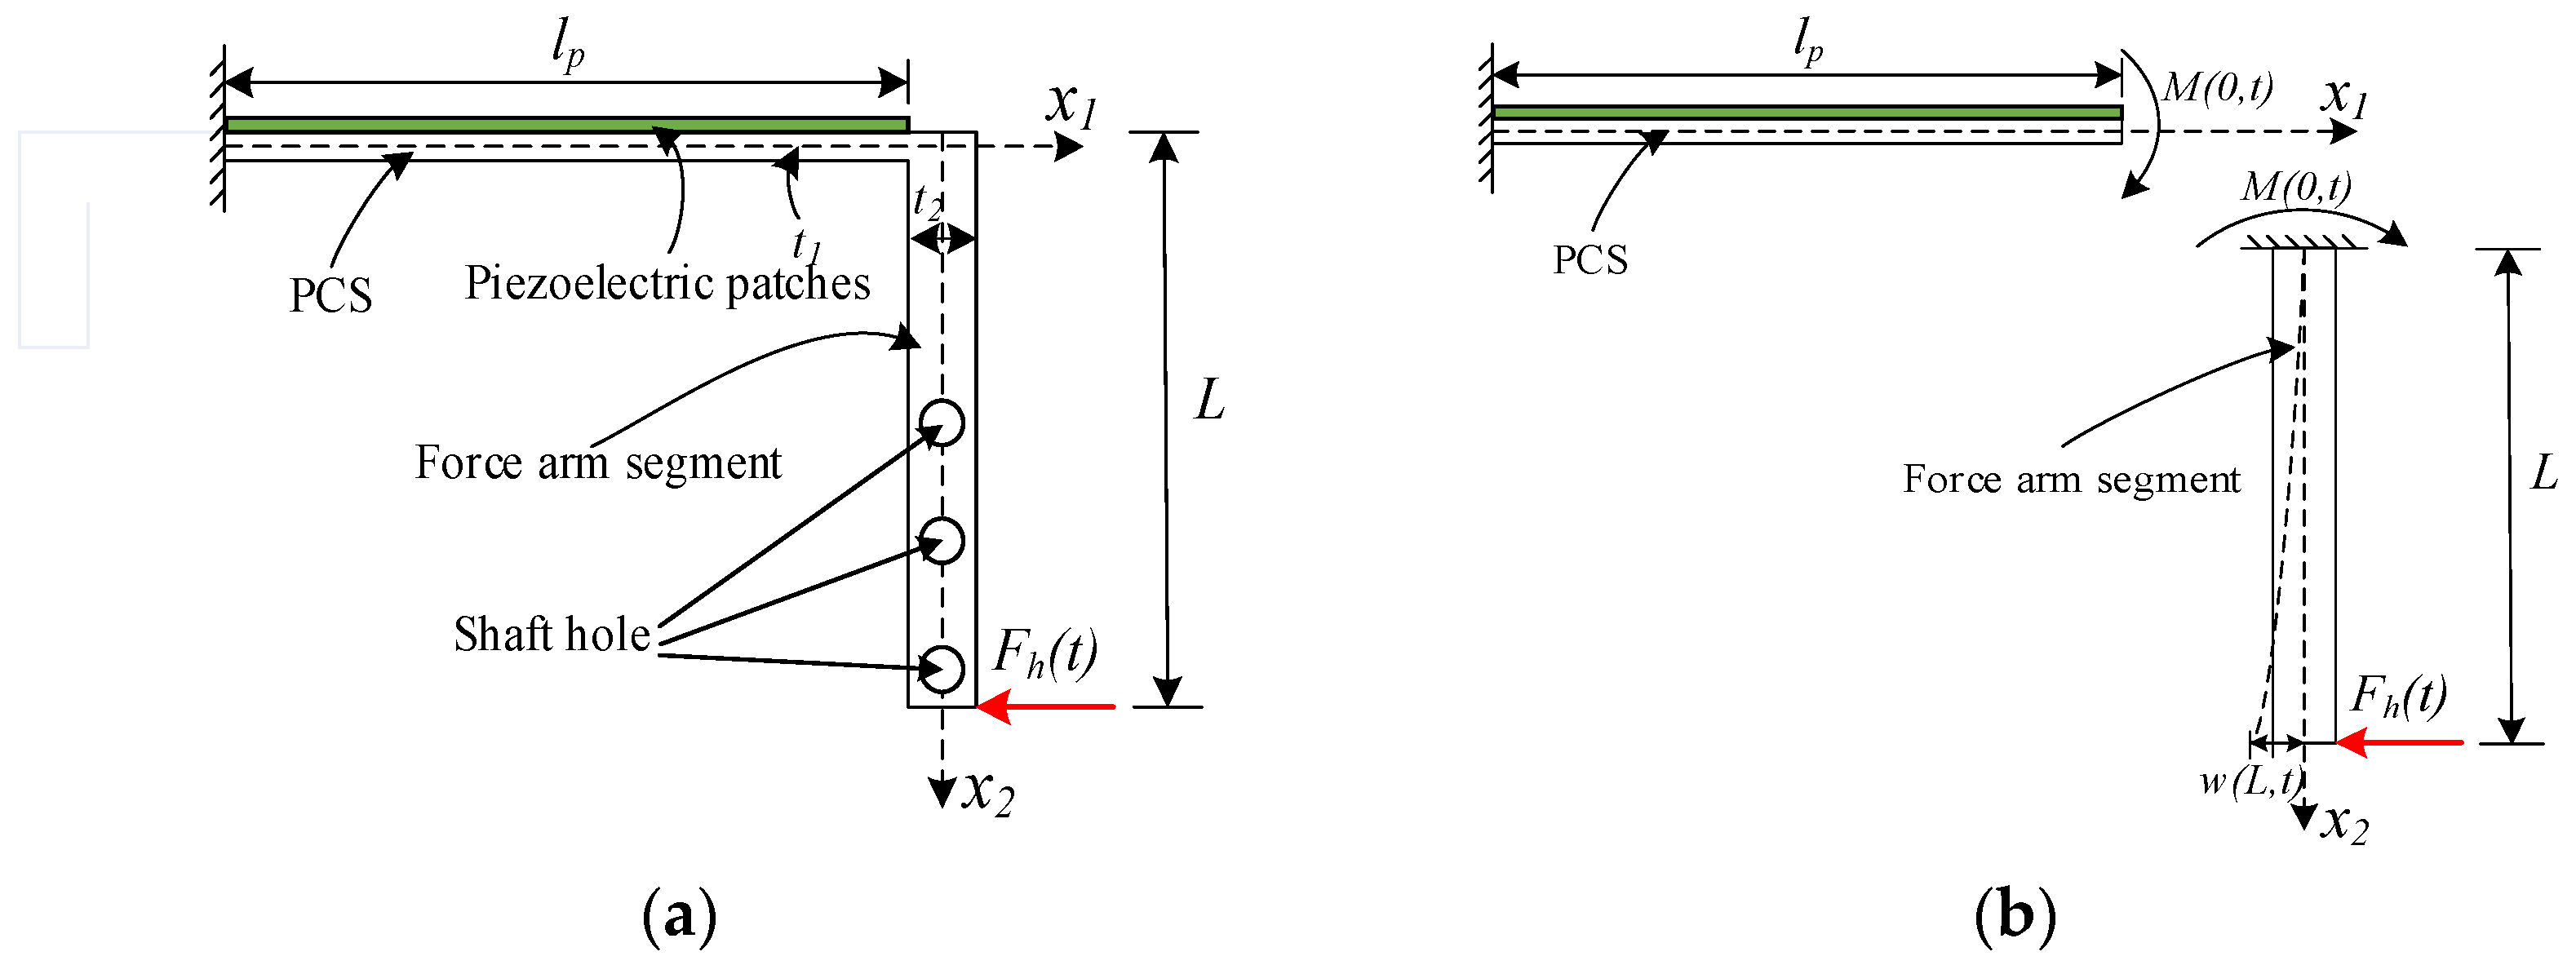
Figure 2.
Physical simplified model of the force amplifier and the force amplification factor versus the footstep excitation amplitude. (a) Simplified model of force amplifier; (b) Force amplification factor (L = 33.5 mm).
Figure 2.
Physical simplified model of the force amplifier and the force amplification factor versus the footstep excitation amplitude. (a) Simplified model of force amplifier; (b) Force amplification factor (L = 33.5 mm).
Figure 3.
2# piezoelectric brick made of a pair of LPCBs with two PCSs. (a) A section view of an LPCB with two PCSs; (b) An experiment specimen of 2# piezoelectric brick.
Figure 3.
2# piezoelectric brick made of a pair of LPCBs with two PCSs. (a) A section view of an LPCB with two PCSs; (b) An experiment specimen of 2# piezoelectric brick.
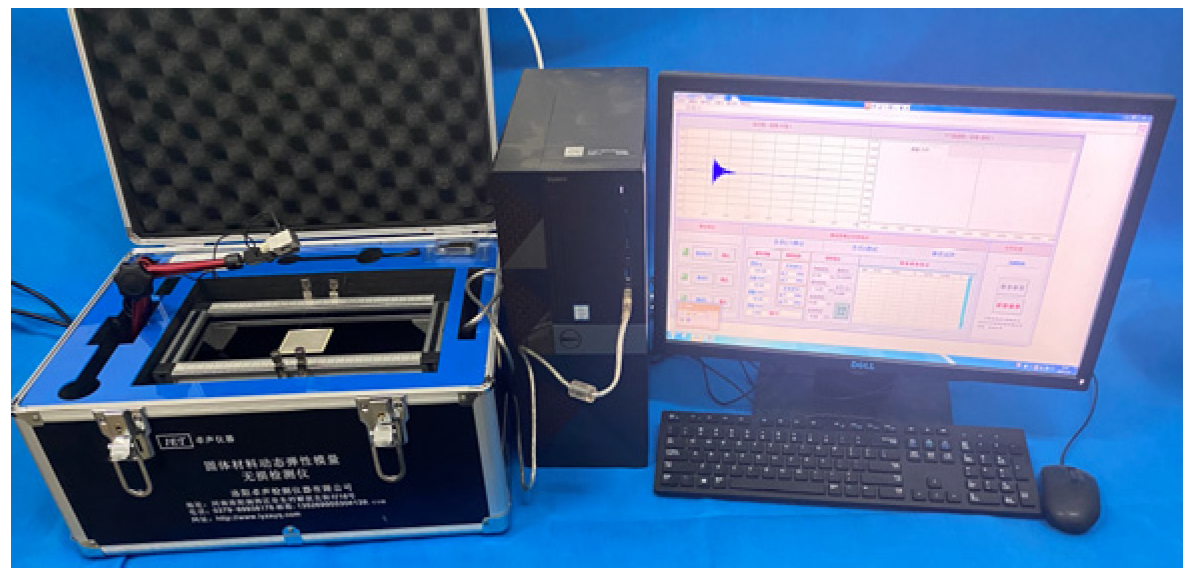
Figure 4.
A non-destructive detector (ET-01).
Figure 4.
A non-destructive detector (ET-01).
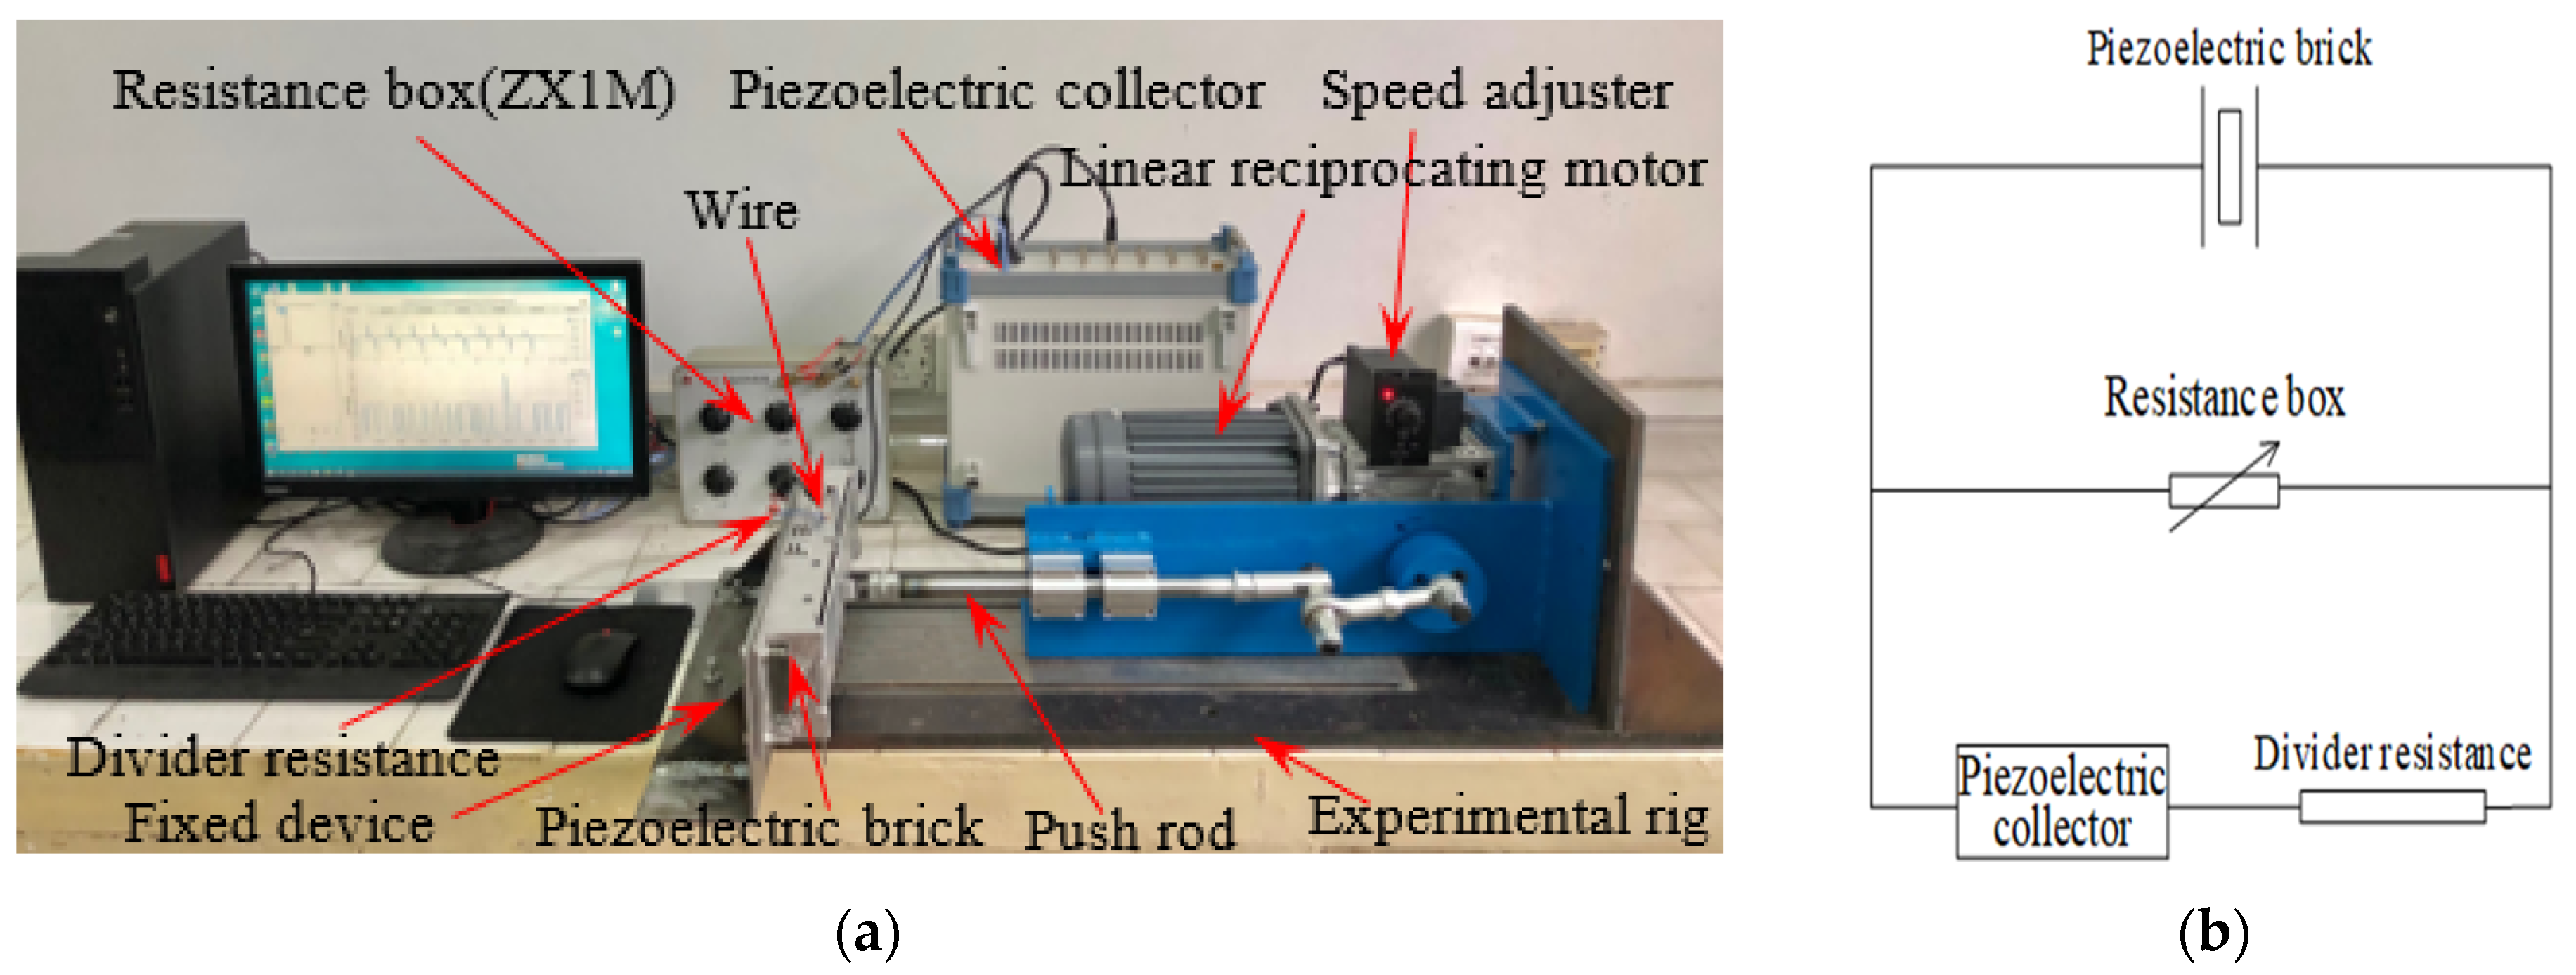
Figure 5.
The view of the experimental setup and the electric circuit of piezoelectric brick made of a pair of LPCBs. (a) Experimental setup; (b) Electric circuit.
Figure 5.
The view of the experimental setup and the electric circuit of piezoelectric brick made of a pair of LPCBs. (a) Experimental setup; (b) Electric circuit.
Figure 6.
The physical model of LPCB of 1 # piezoelectric brick. (a) Model of LPCB; (b) Simplified model of LPCB.
Figure 6.
The physical model of LPCB of 1 # piezoelectric brick. (a) Model of LPCB; (b) Simplified model of LPCB.
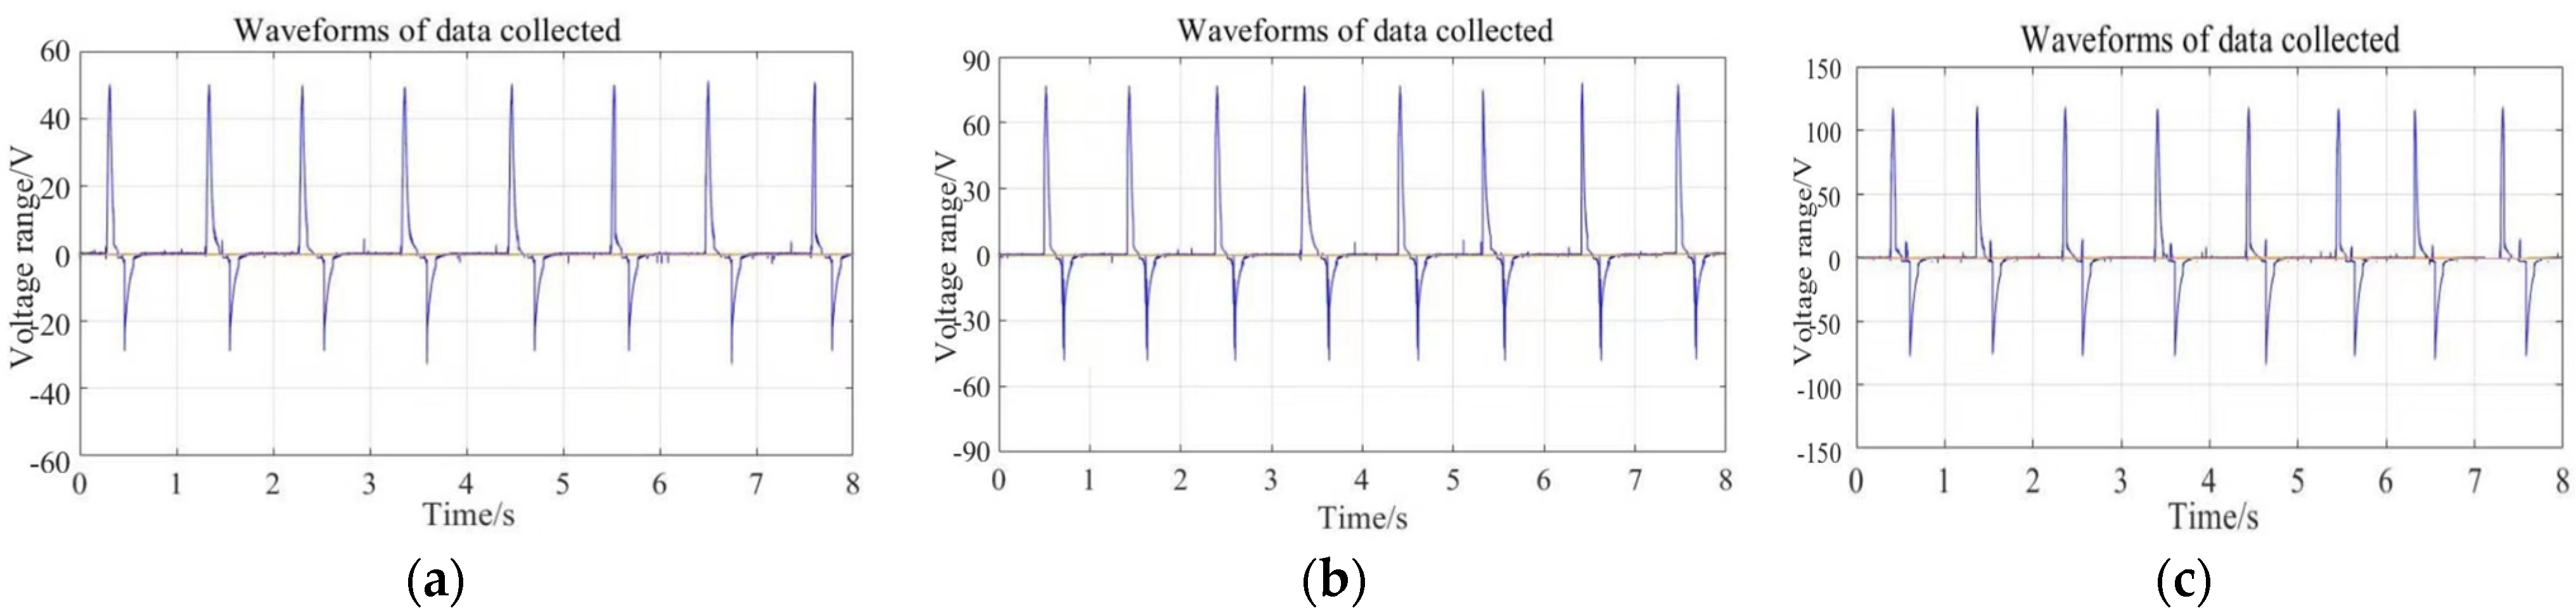
Figure 7.
Reported voltages from 1#1 PZT4 patch on unimorph PCS of 1# piezoelectric brick (F = 500 N, f = 1 Hz). (a) L = 19.5 mm; (b) L = 26.5 mm; (c) L = 33.5 mm.
Figure 7.
Reported voltages from 1#1 PZT4 patch on unimorph PCS of 1# piezoelectric brick (F = 500 N, f = 1 Hz). (a) L = 19.5 mm; (b) L = 26.5 mm; (c) L = 33.5 mm.
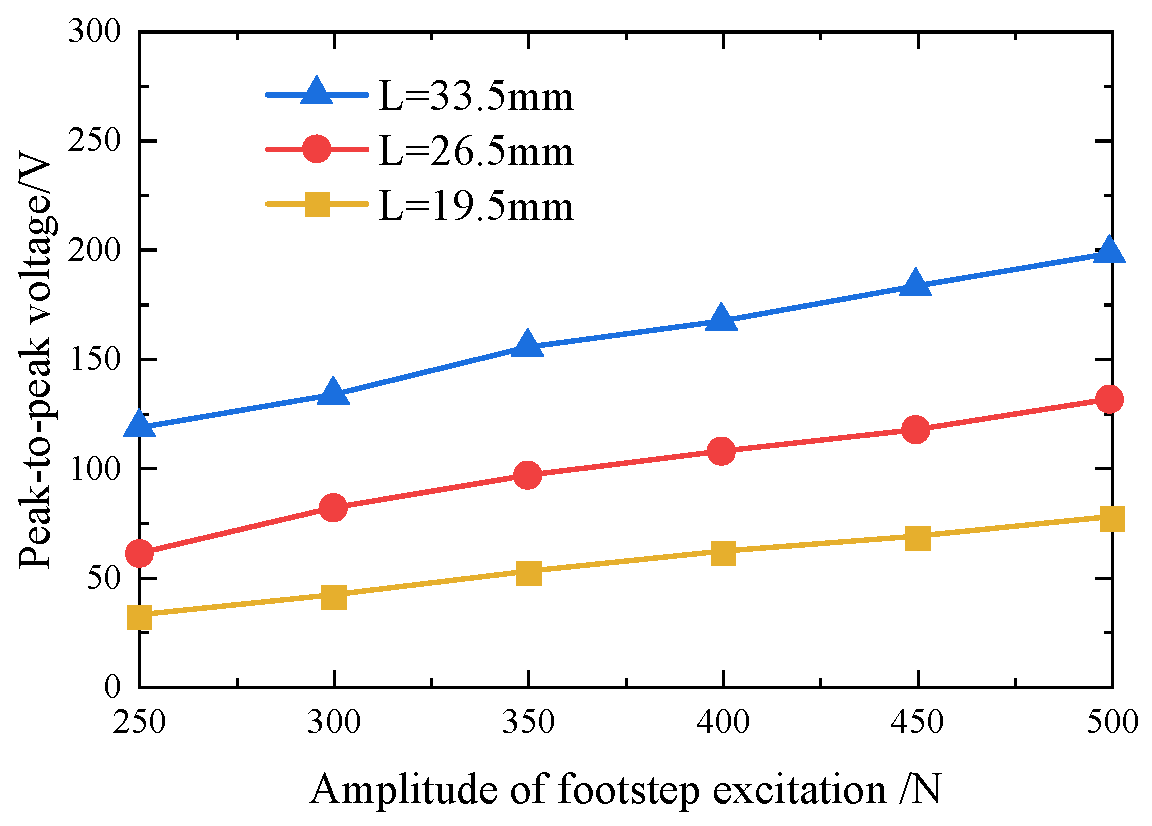
Figure 8.
Peak-to-peak voltages from 1#1 PZT4 patch on unimorph PCS of 1# piezoelectric brick versus the amplitude of footstep excitation (f = 1 Hz).
Figure 8.
Peak-to-peak voltages from 1#1 PZT4 patch on unimorph PCS of 1# piezoelectric brick versus the amplitude of footstep excitation (f = 1 Hz).
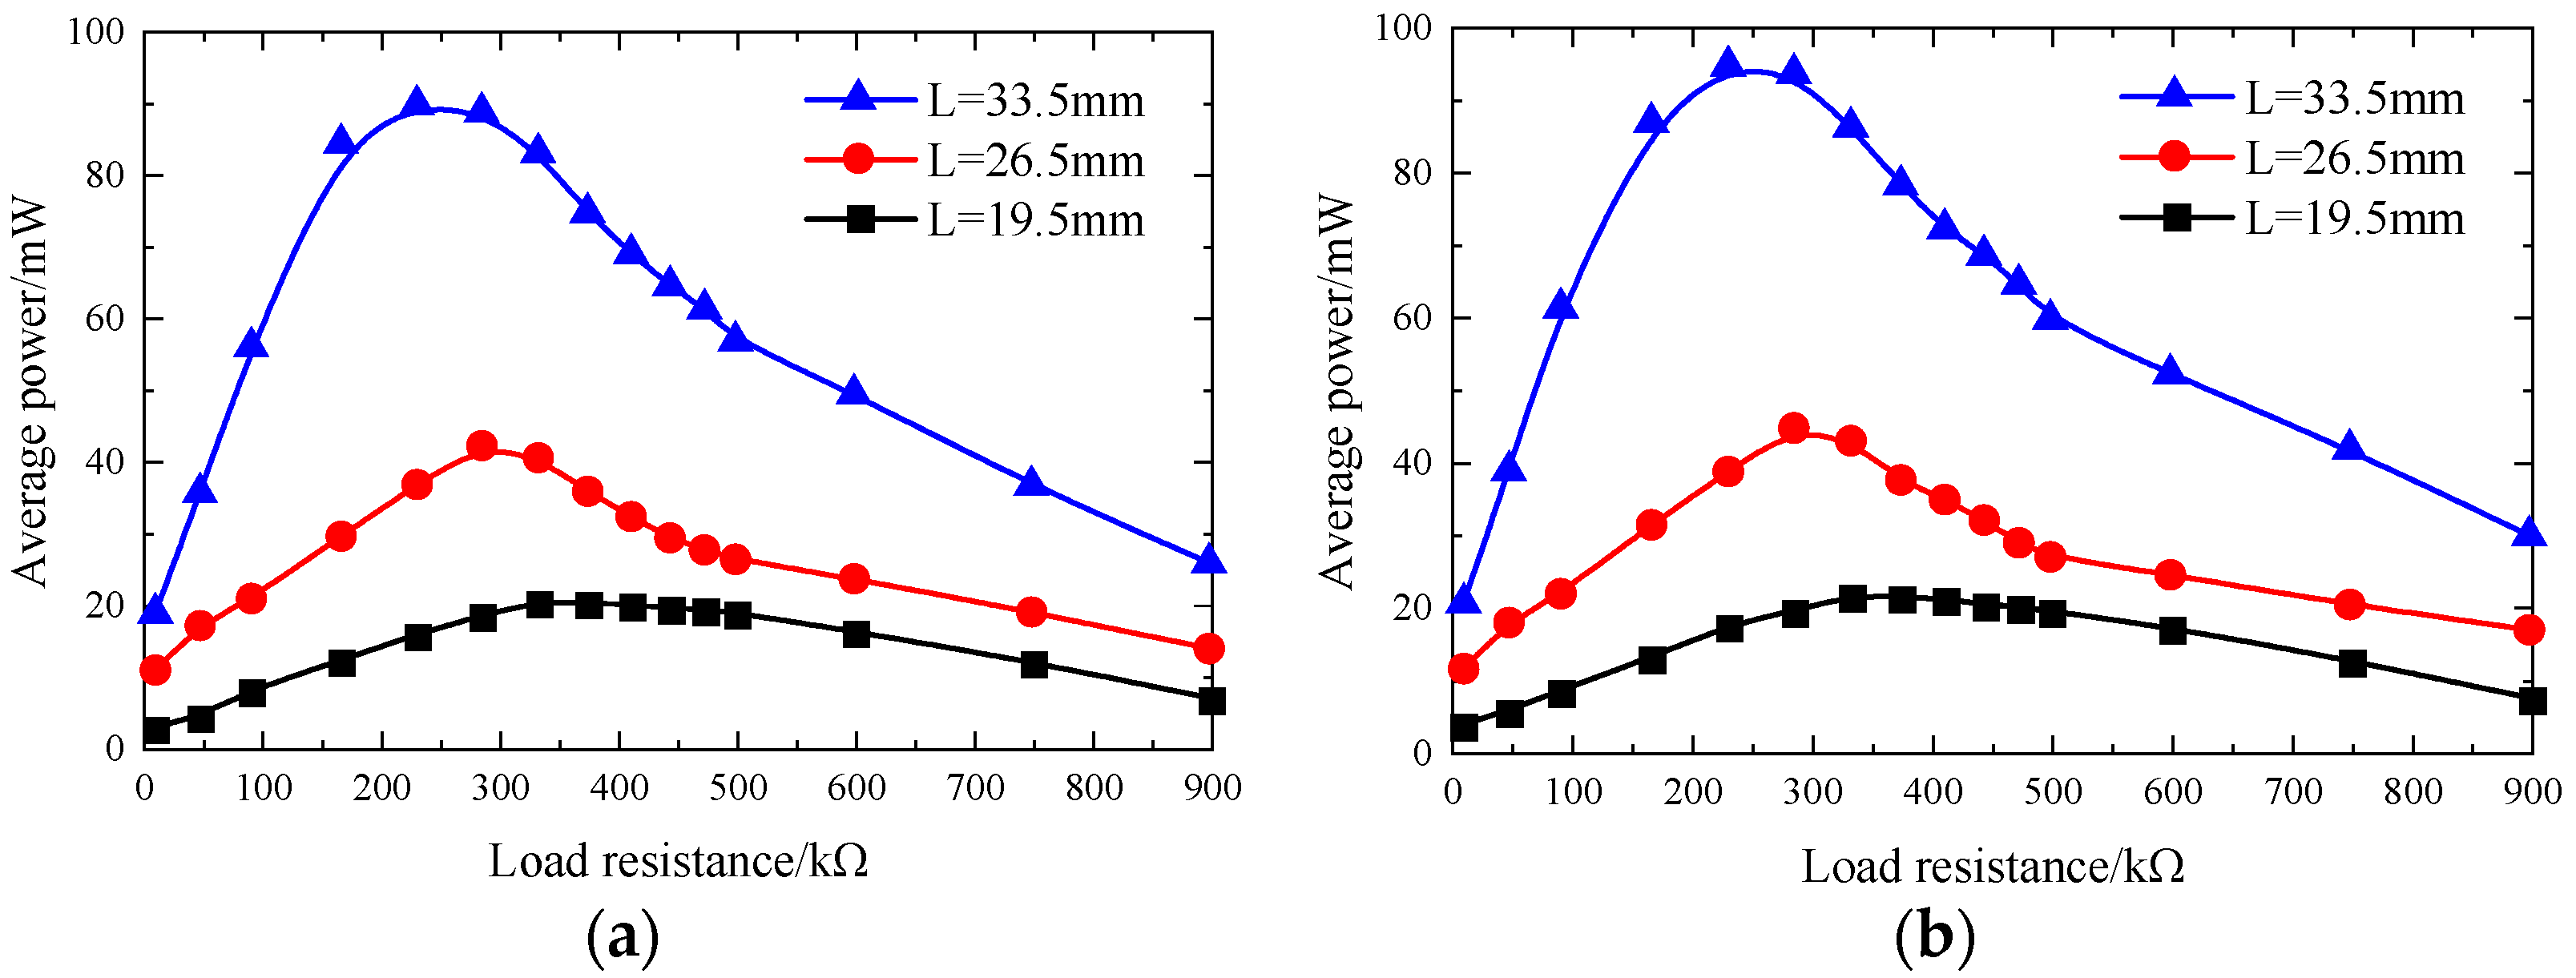
Figure 9.
Average powers from PZT4 patch of 1#1 on unimorph PCS of 1# piezoelectric brick versus the load resistance and the force arm length (F = 500 N, f = 1 Hz).
Figure 9.
Average powers from PZT4 patch of 1#1 on unimorph PCS of 1# piezoelectric brick versus the load resistance and the force arm length (F = 500 N, f = 1 Hz).
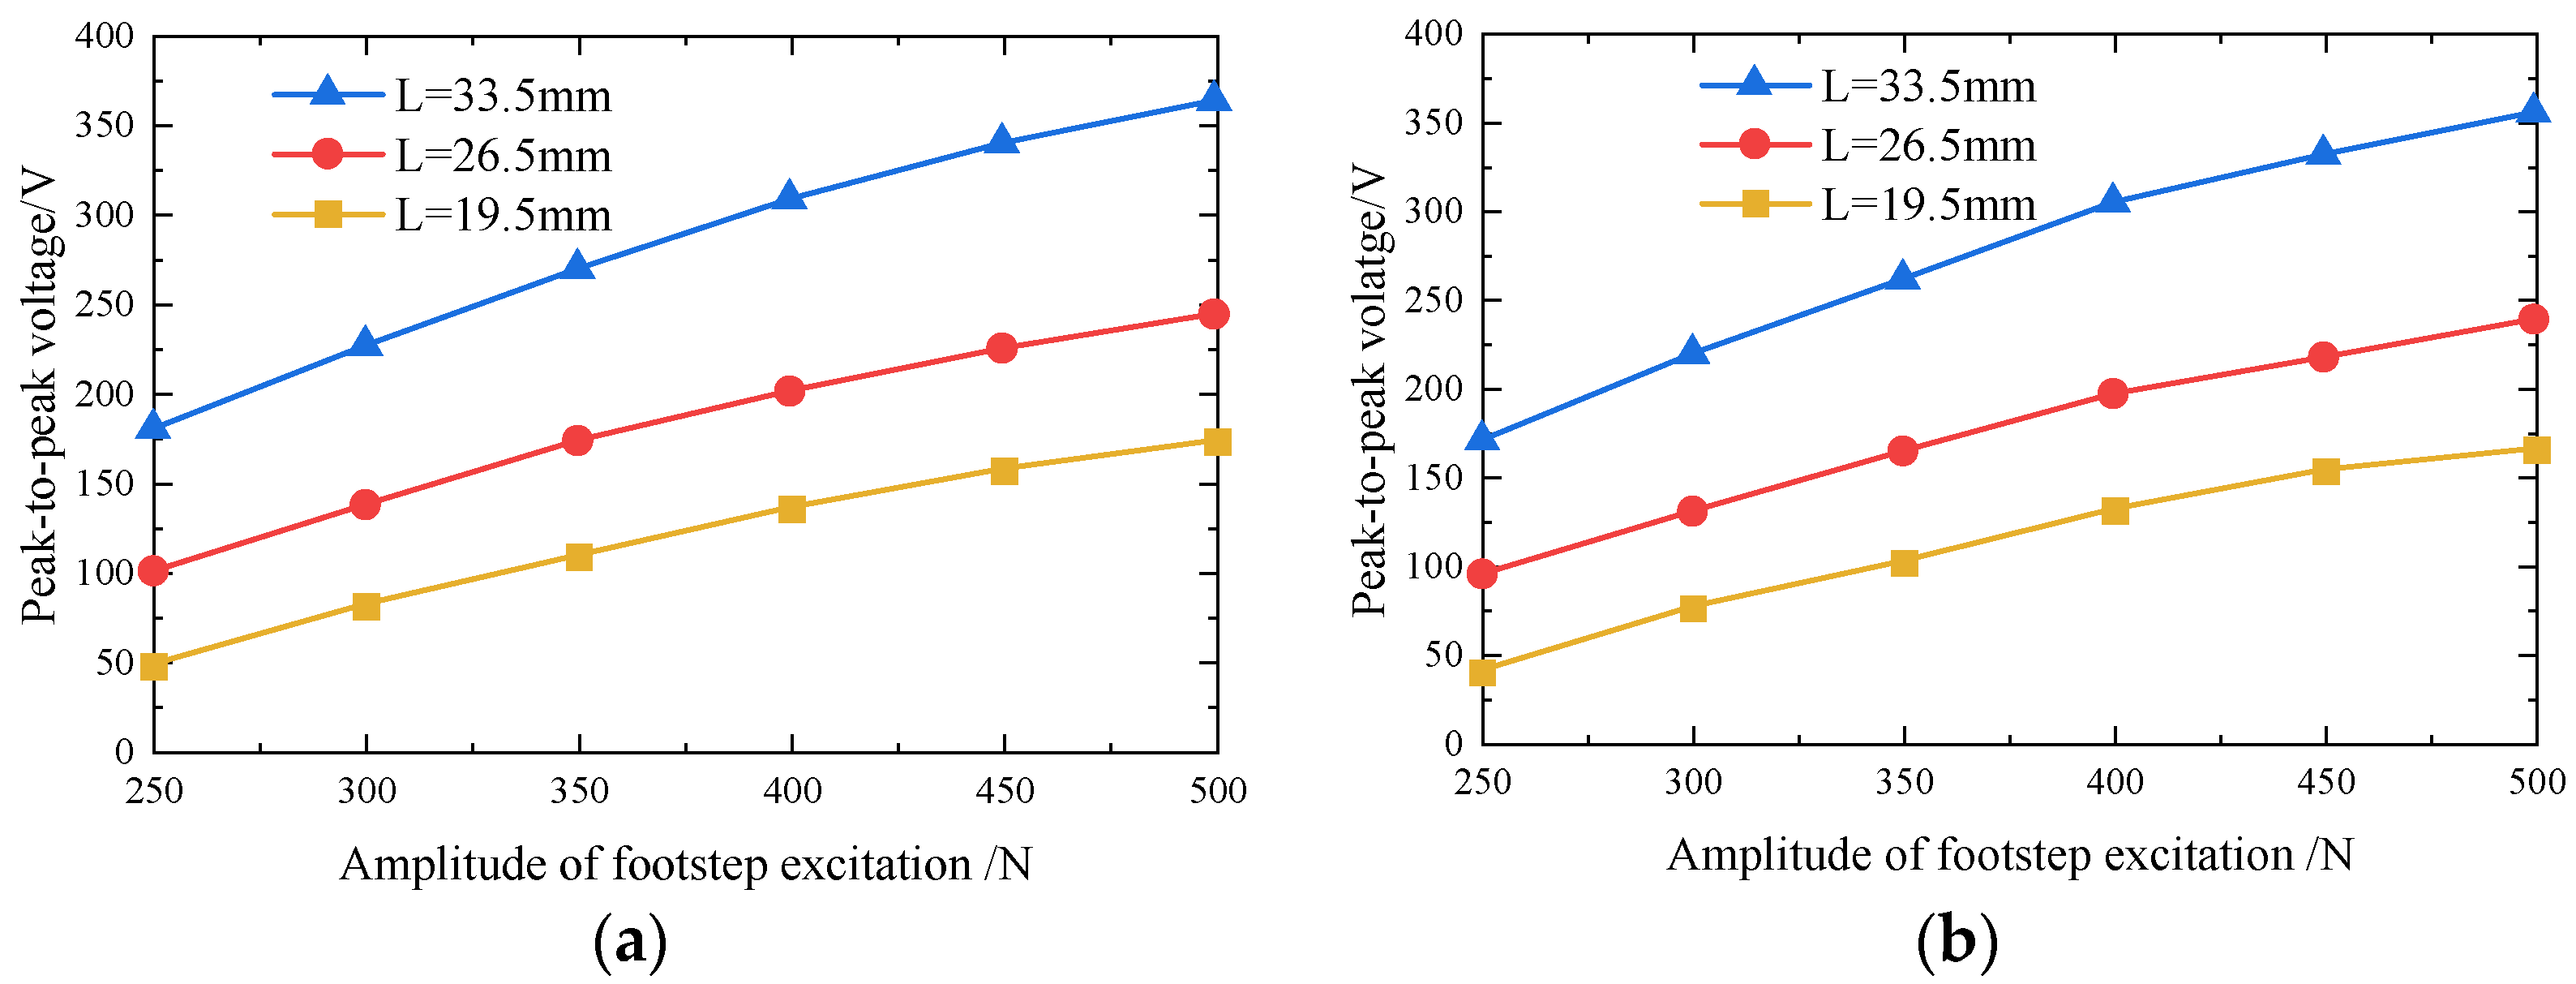
Figure 10.
Peak-to-peak voltages from PZT4 patches of 2#1 on unimorph PCS1 and 2#3 on unimorph PCS2 of 2# piezoelectric brick versus the amplitude of footstep excitation (f = 1 Hz). (a) 2#1 PZT4 patch; (b) 2#3 PZT4 patch.
Figure 10.
Peak-to-peak voltages from PZT4 patches of 2#1 on unimorph PCS1 and 2#3 on unimorph PCS2 of 2# piezoelectric brick versus the amplitude of footstep excitation (f = 1 Hz). (a) 2#1 PZT4 patch; (b) 2#3 PZT4 patch.
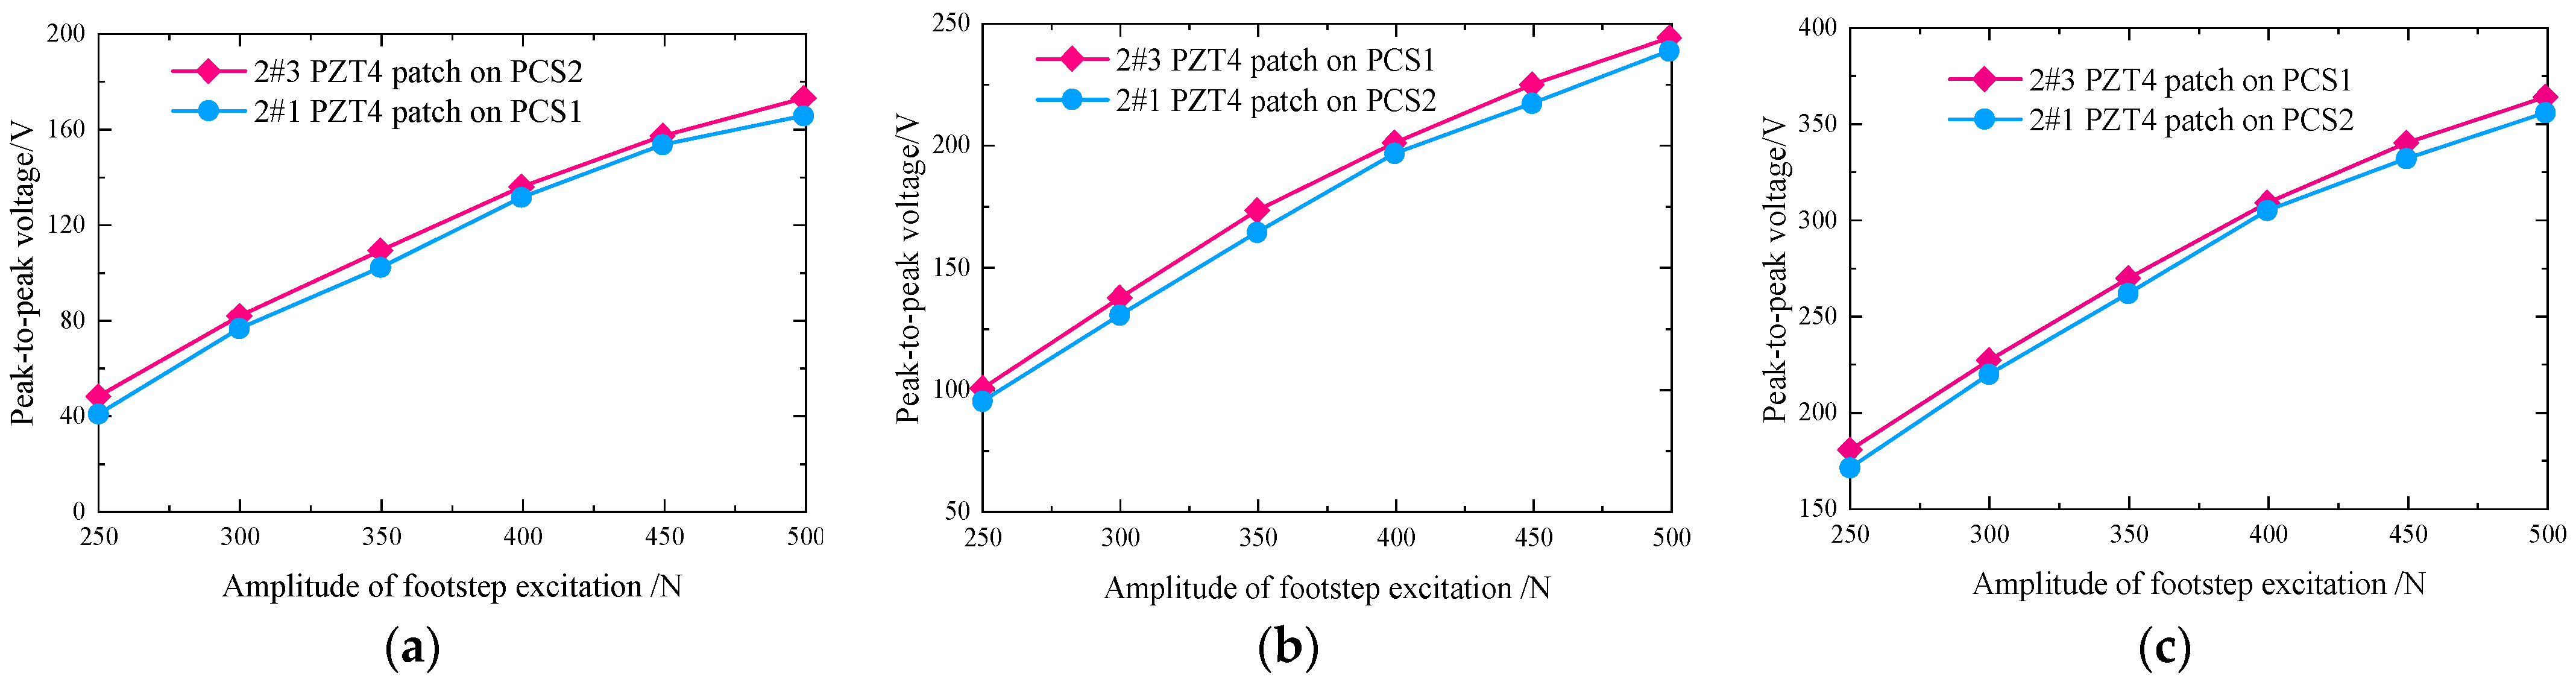
Figure 11.
Comparison of peak-to-peak voltages from PZT4 patches of 2#1 on unimorph PCS1 and 2#3 on unimorph PCS2 of 2# piezoelectric brick versus the amplitude of footstep excitation (f = 1 Hz). (a) L = 19.5 mm; (b) L = 26.5 mm; (c) L = 33.5 mm.
Figure 11.
Comparison of peak-to-peak voltages from PZT4 patches of 2#1 on unimorph PCS1 and 2#3 on unimorph PCS2 of 2# piezoelectric brick versus the amplitude of footstep excitation (f = 1 Hz). (a) L = 19.5 mm; (b) L = 26.5 mm; (c) L = 33.5 mm.
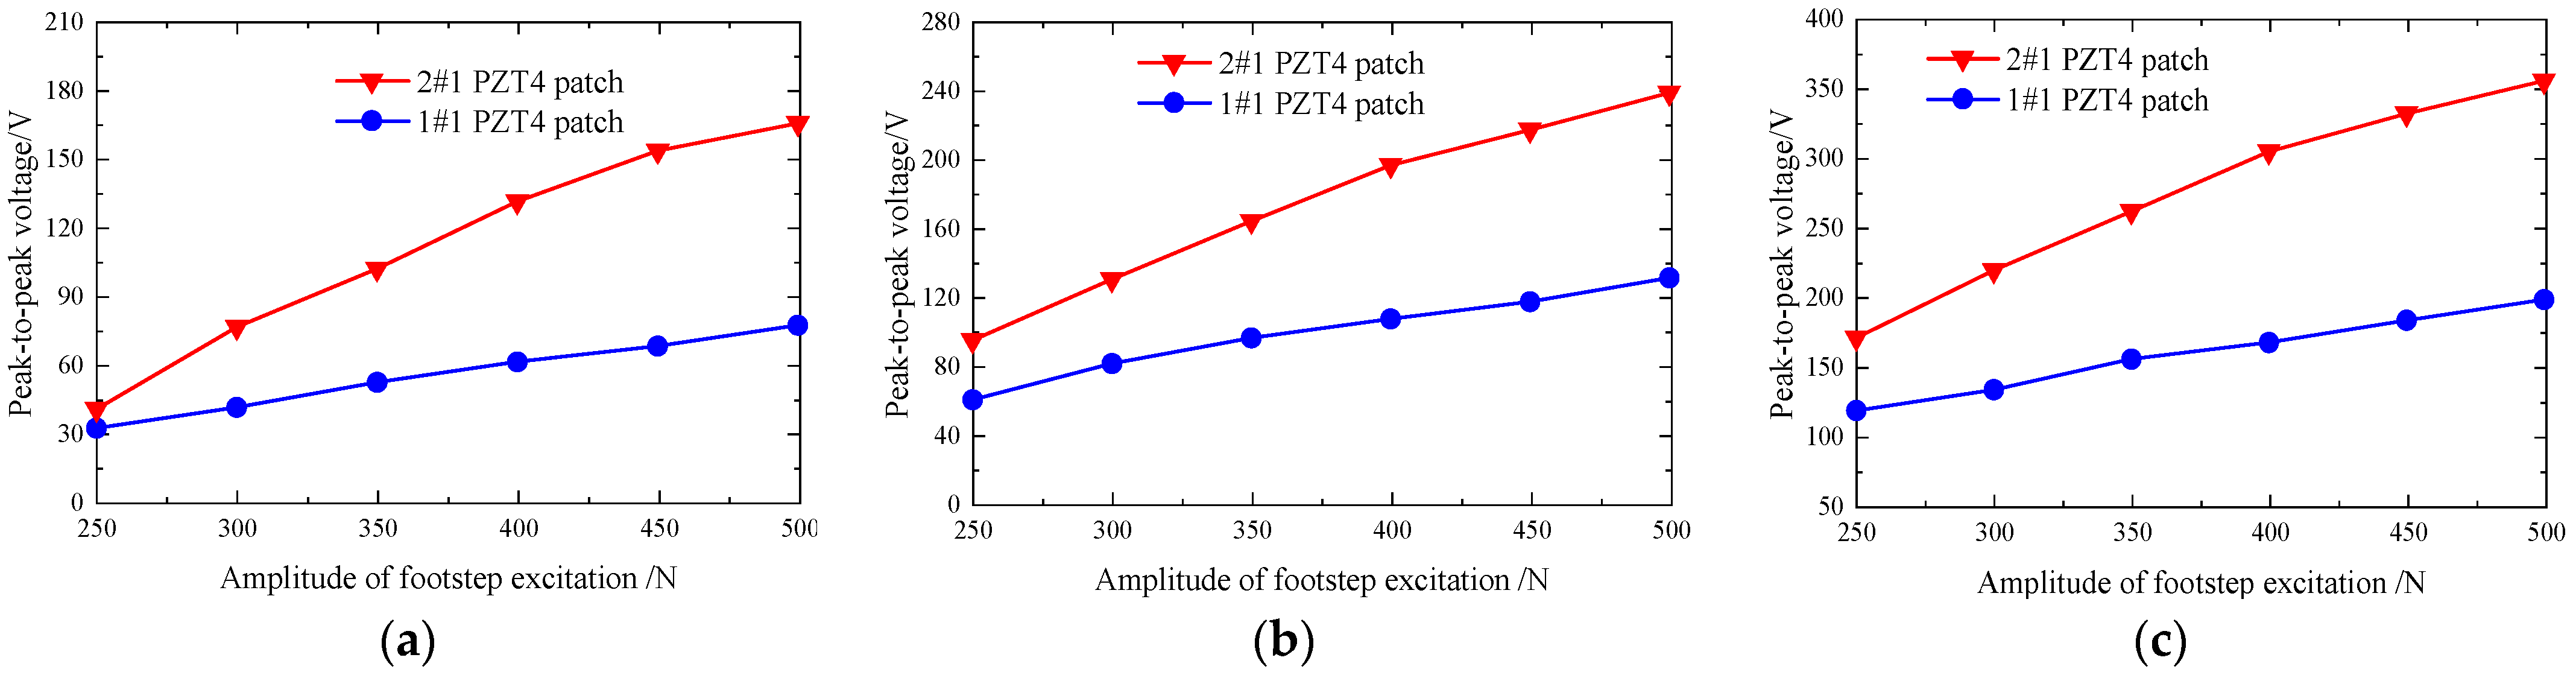
Figure 12.
Comparison of peak-to-peak voltages from PZT4 patches of 1#1 on unimorph PCS of 1# piezoelectric brick and 2#1 on unimorph PCS1 of 2# piezoelectric brick versus the amplitude of footstep excitation (f = 1 Hz). (a) L = 19.5 mm; (b) L = 26.5 mm; (c) L = 33.5 mm.
Figure 12.
Comparison of peak-to-peak voltages from PZT4 patches of 1#1 on unimorph PCS of 1# piezoelectric brick and 2#1 on unimorph PCS1 of 2# piezoelectric brick versus the amplitude of footstep excitation (f = 1 Hz). (a) L = 19.5 mm; (b) L = 26.5 mm; (c) L = 33.5 mm.
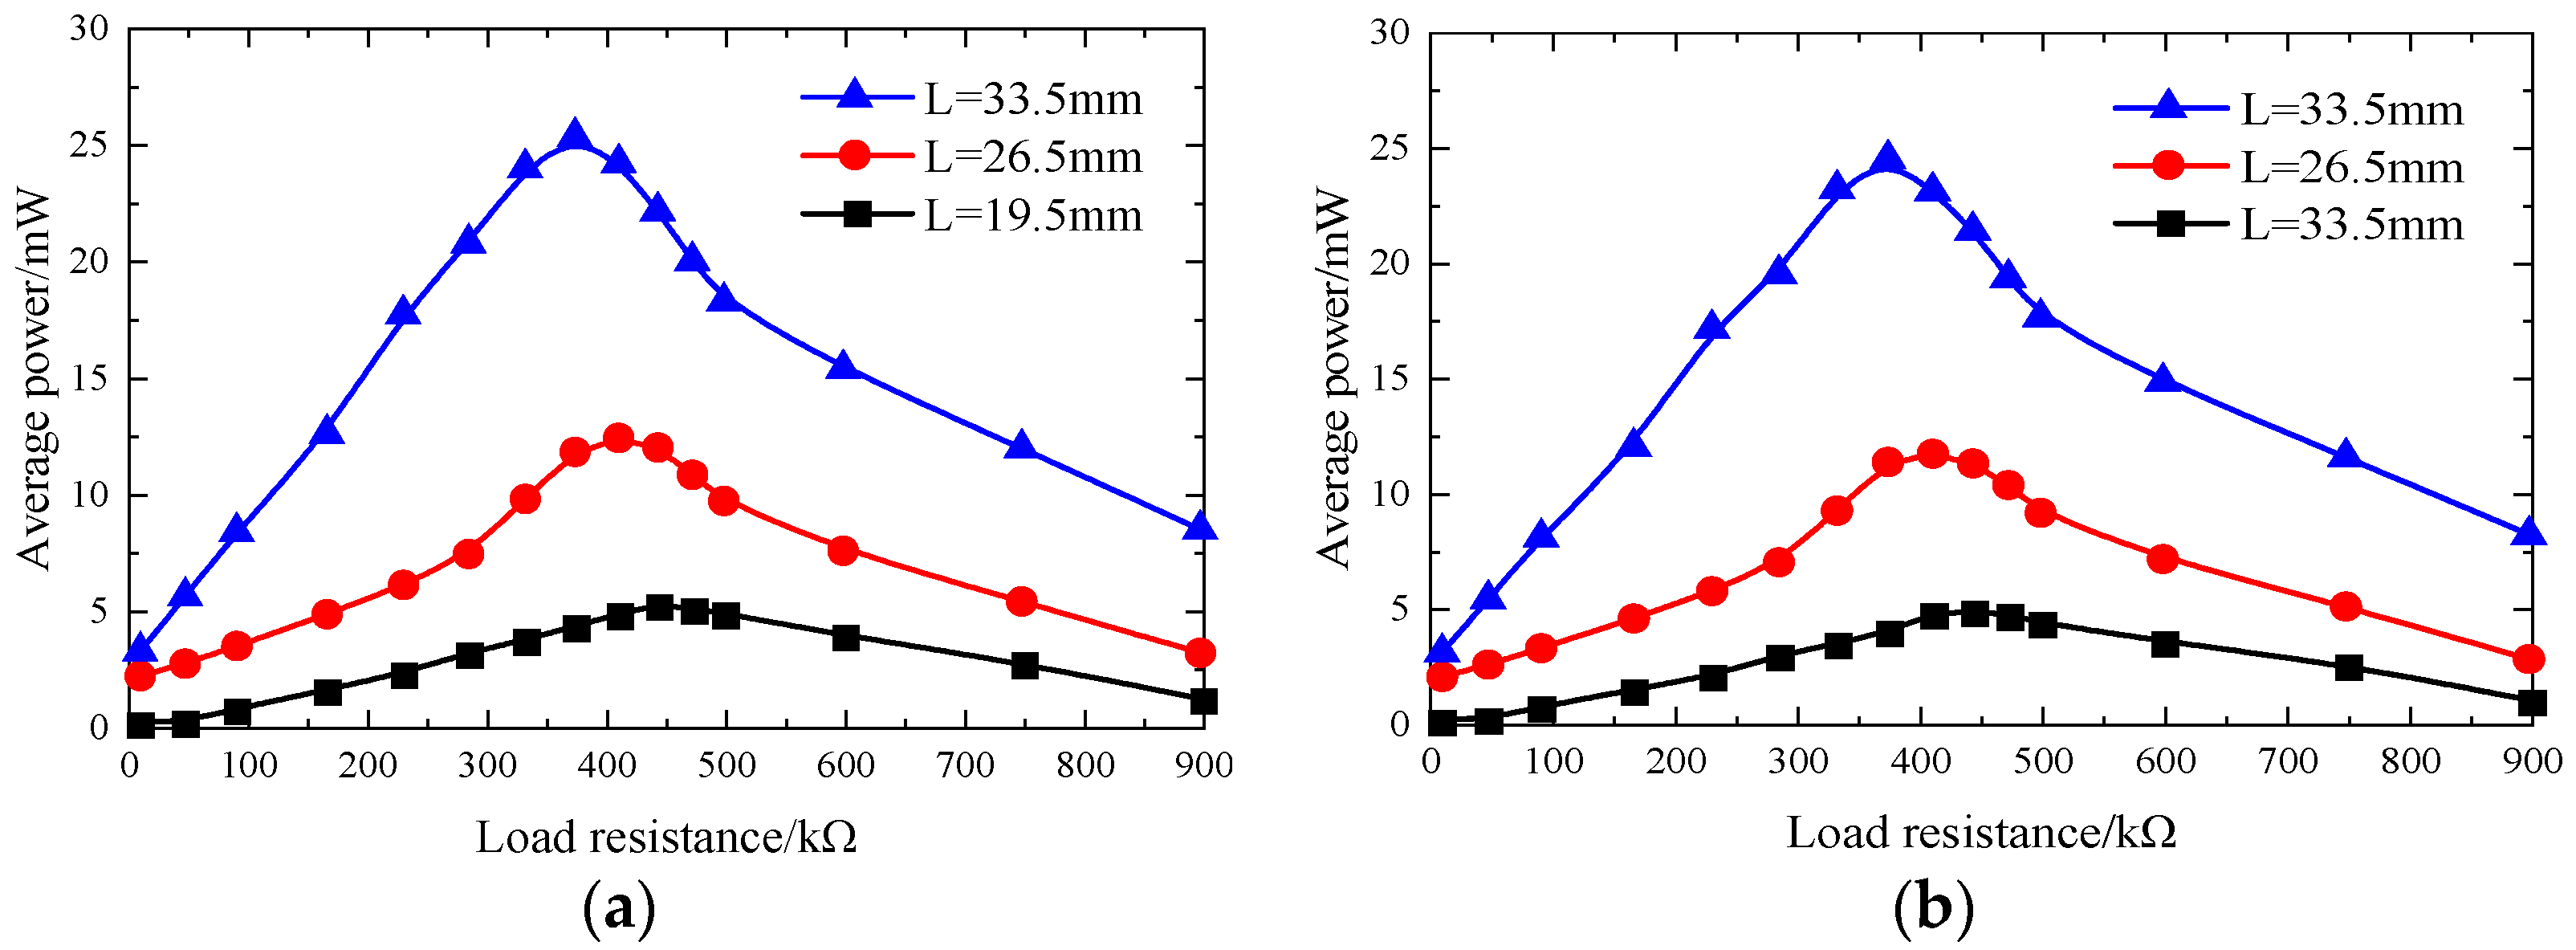
Figure 13.
Average powers from unimorph PCSs of 2# piezoelectric brick versus the load resistance and force arm length (F = 500 N, f = 1 Hz). (a) 2#1 PZT4 patch on PCS1; (b) 2#3 PZT4 patchon PCS2.
Figure 13.
Average powers from unimorph PCSs of 2# piezoelectric brick versus the load resistance and force arm length (F = 500 N, f = 1 Hz). (a) 2#1 PZT4 patch on PCS1; (b) 2#3 PZT4 patchon PCS2.
Figure 14.
Average powers from bimorph PCS1 of 2# piezoelectric brick versus the load resistance and force arm length (F = 500 N, f = 1 Hz). (a) 2#1 PZT4 patch; (b) 2#2 PZT4 patch.
Figure 14.
Average powers from bimorph PCS1 of 2# piezoelectric brick versus the load resistance and force arm length (F = 500 N, f = 1 Hz). (a) 2#1 PZT4 patch; (b) 2#2 PZT4 patch.
Figure 15.
Average powers from bimorph PCS2 of 2# piezoelectric brick versus the load resistance and force arm length (F = 500 N, f = 1 Hz). (a) 2#3 PZT4 patch; (b) 2#4 PZT4 patch.
Figure 15.
Average powers from bimorph PCS2 of 2# piezoelectric brick versus the load resistance and force arm length (F = 500 N, f = 1 Hz). (a) 2#3 PZT4 patch; (b) 2#4 PZT4 patch.
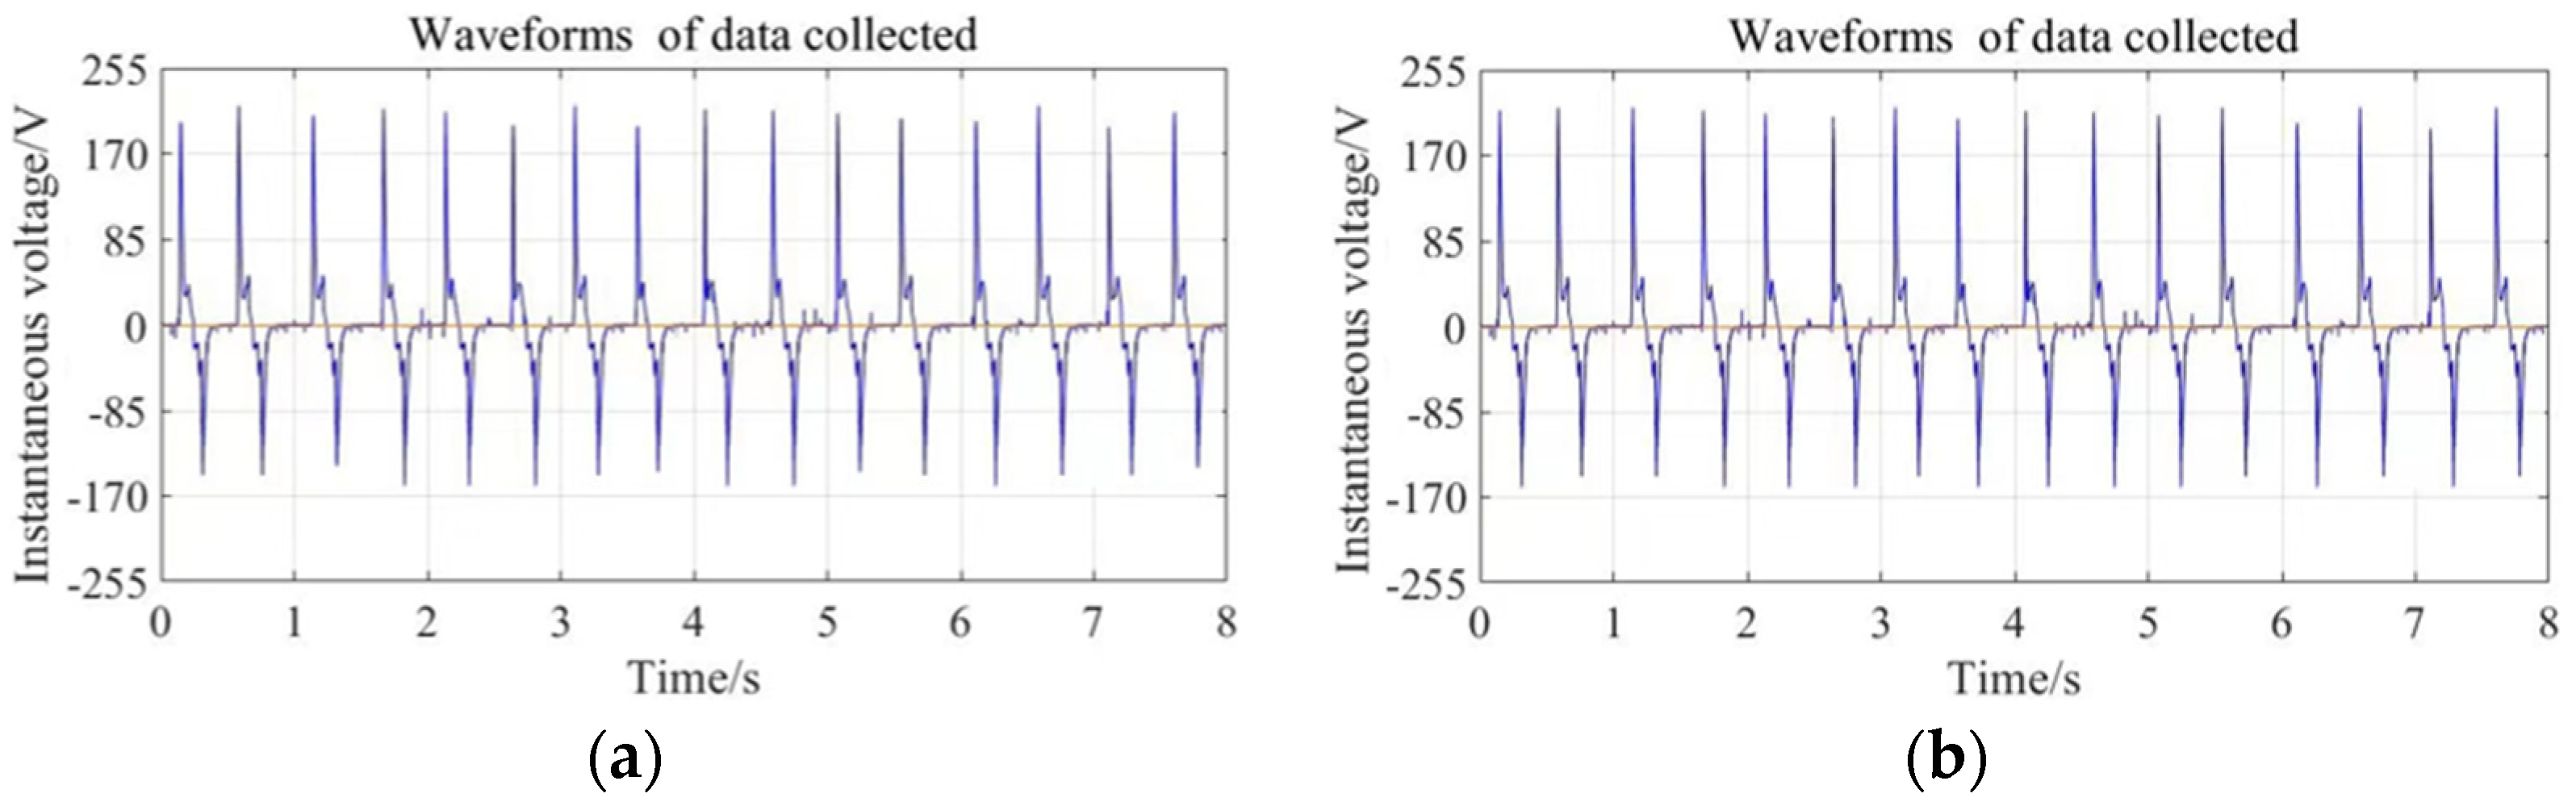
Figure 16.
Reported voltages from 2#1 and 2#3 PZT4 patch on unimorph PCS1 and PCS2 of 2# piezoelectric brick (F = 500 N, f = 2 Hz, and L = 33.5 mm). (a) 2#1 PZT4 patch on PCS1; (b) 2#3 PZT4 patch on PCS2.
Figure 16.
Reported voltages from 2#1 and 2#3 PZT4 patch on unimorph PCS1 and PCS2 of 2# piezoelectric brick (F = 500 N, f = 2 Hz, and L = 33.5 mm). (a) 2#1 PZT4 patch on PCS1; (b) 2#3 PZT4 patch on PCS2.
Figure 17.
Average powers from unimorph PCSs of #2 piezoelectric brick versus the load resistance and force arm length (F = 500 N, f = 2 Hz). (a) 2#1 PZT4 patch on PCS1; (b) 2#3 PZT4 patch on PCS2.
Figure 17.
Average powers from unimorph PCSs of #2 piezoelectric brick versus the load resistance and force arm length (F = 500 N, f = 2 Hz). (a) 2#1 PZT4 patch on PCS1; (b) 2#3 PZT4 patch on PCS2.
Figure 18.
Peak-to-peak voltages of 1#1 PZT4 patch of unimorph PCS from simulation and experiment versus the amplitude of footstep excitation.
Figure 18.
Peak-to-peak voltages of 1#1 PZT4 patch of unimorph PCS from simulation and experiment versus the amplitude of footstep excitation.
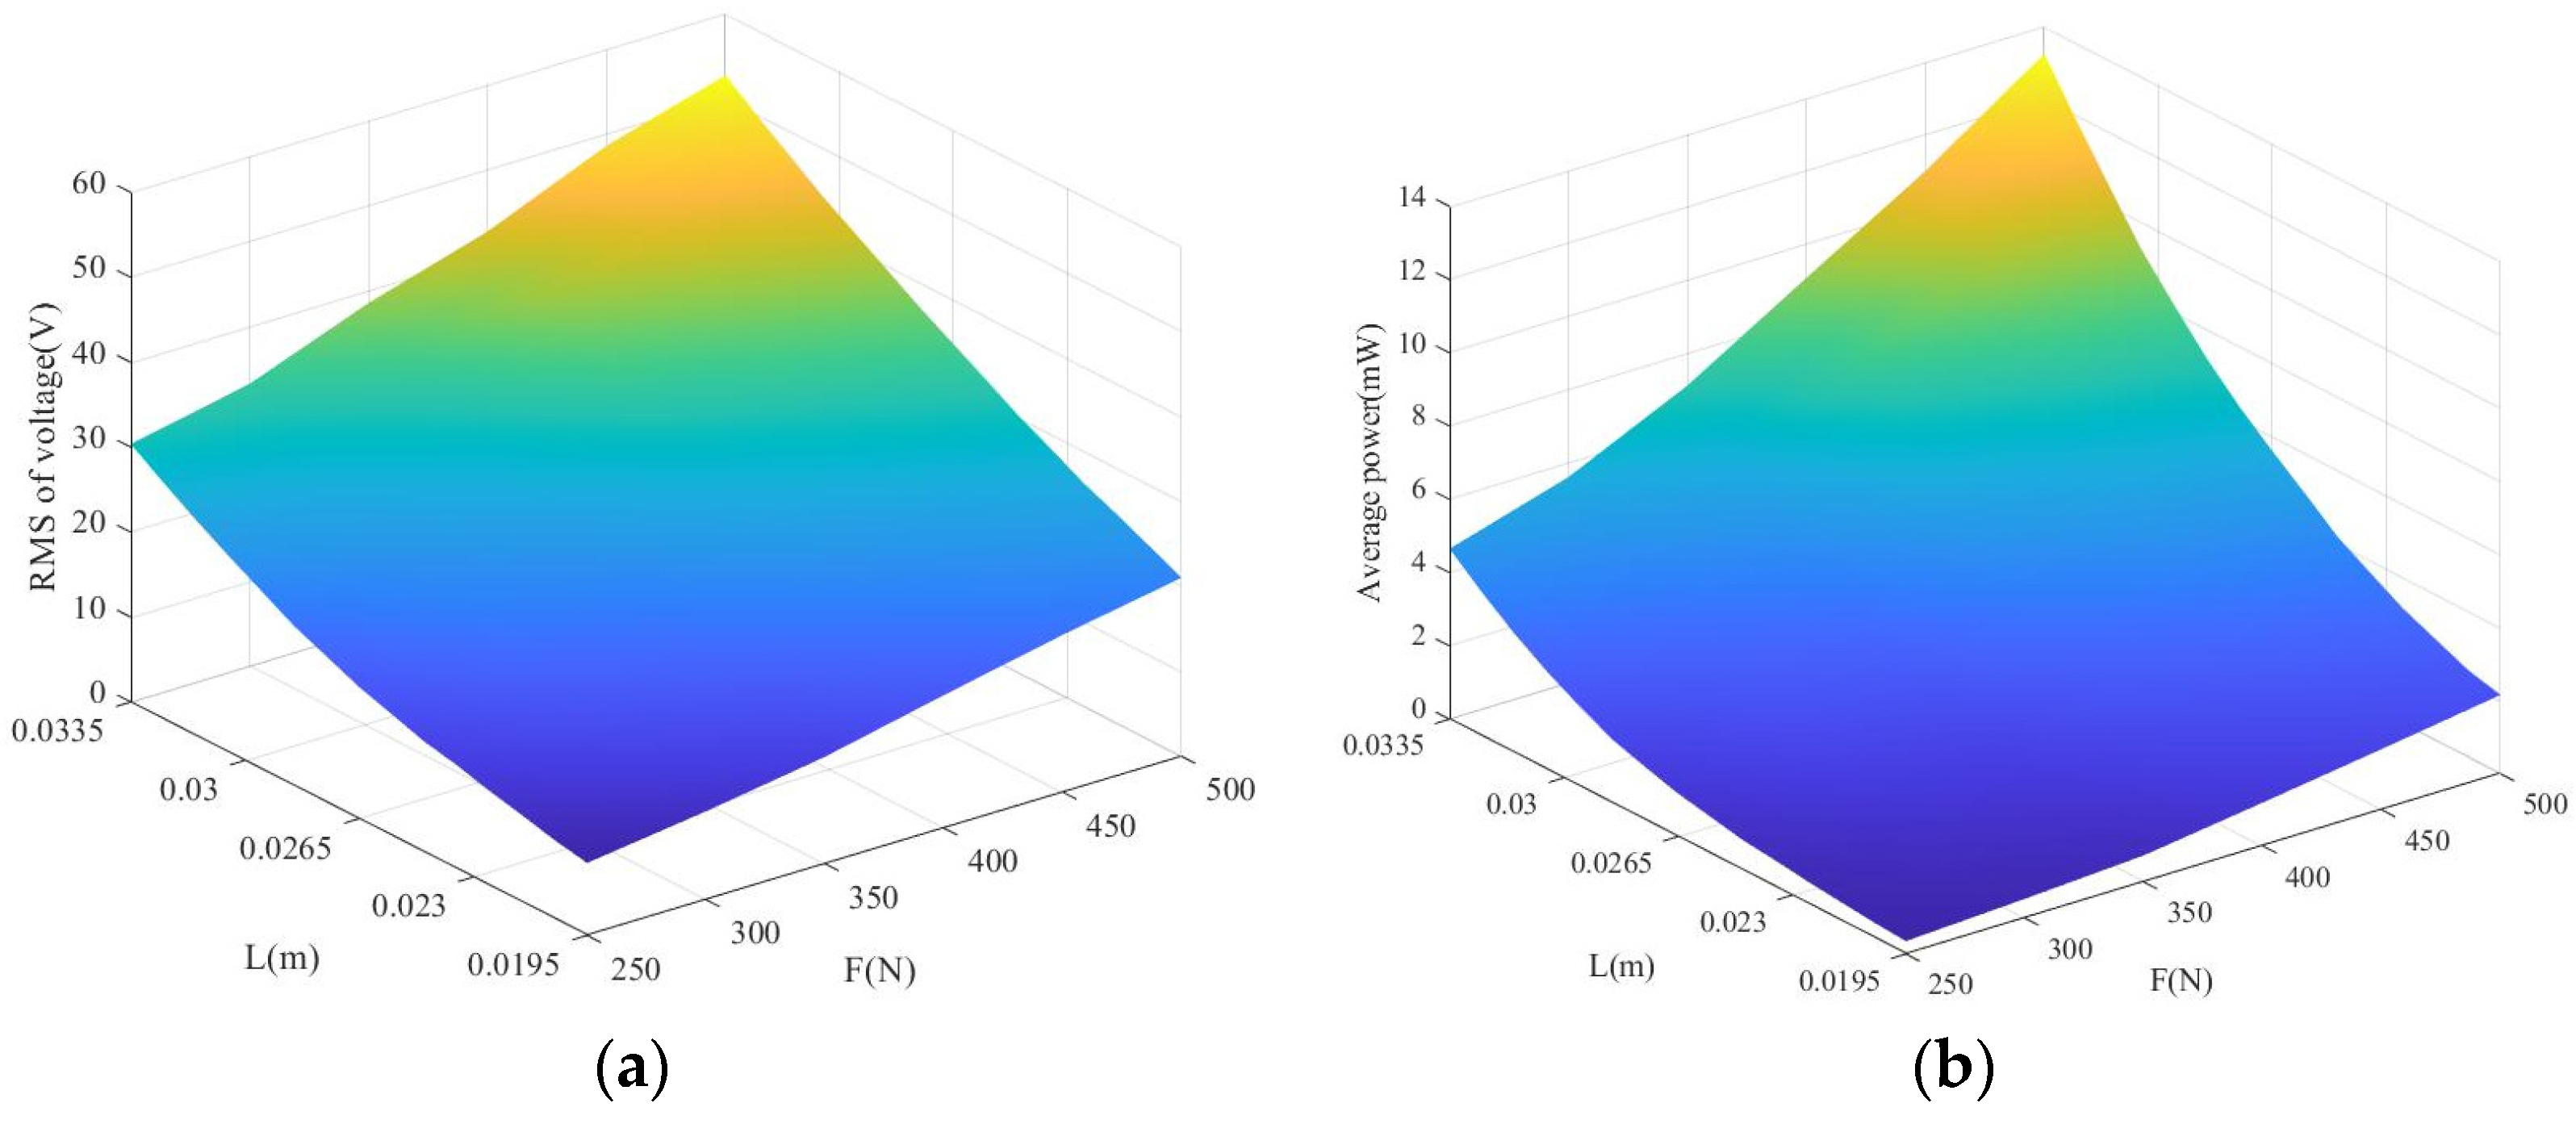
Figure 19.
RMS of voltages and average powers from 1#1 PZT4 patch of 1# piezoelectric brick with Aluminum alloy substrate versus the force arm length of LPCB and the footstep excitation amplitude. (a) RMS of voltages; (b) Average powers.
Figure 19.
RMS of voltages and average powers from 1#1 PZT4 patch of 1# piezoelectric brick with Aluminum alloy substrate versus the force arm length of LPCB and the footstep excitation amplitude. (a) RMS of voltages; (b) Average powers.
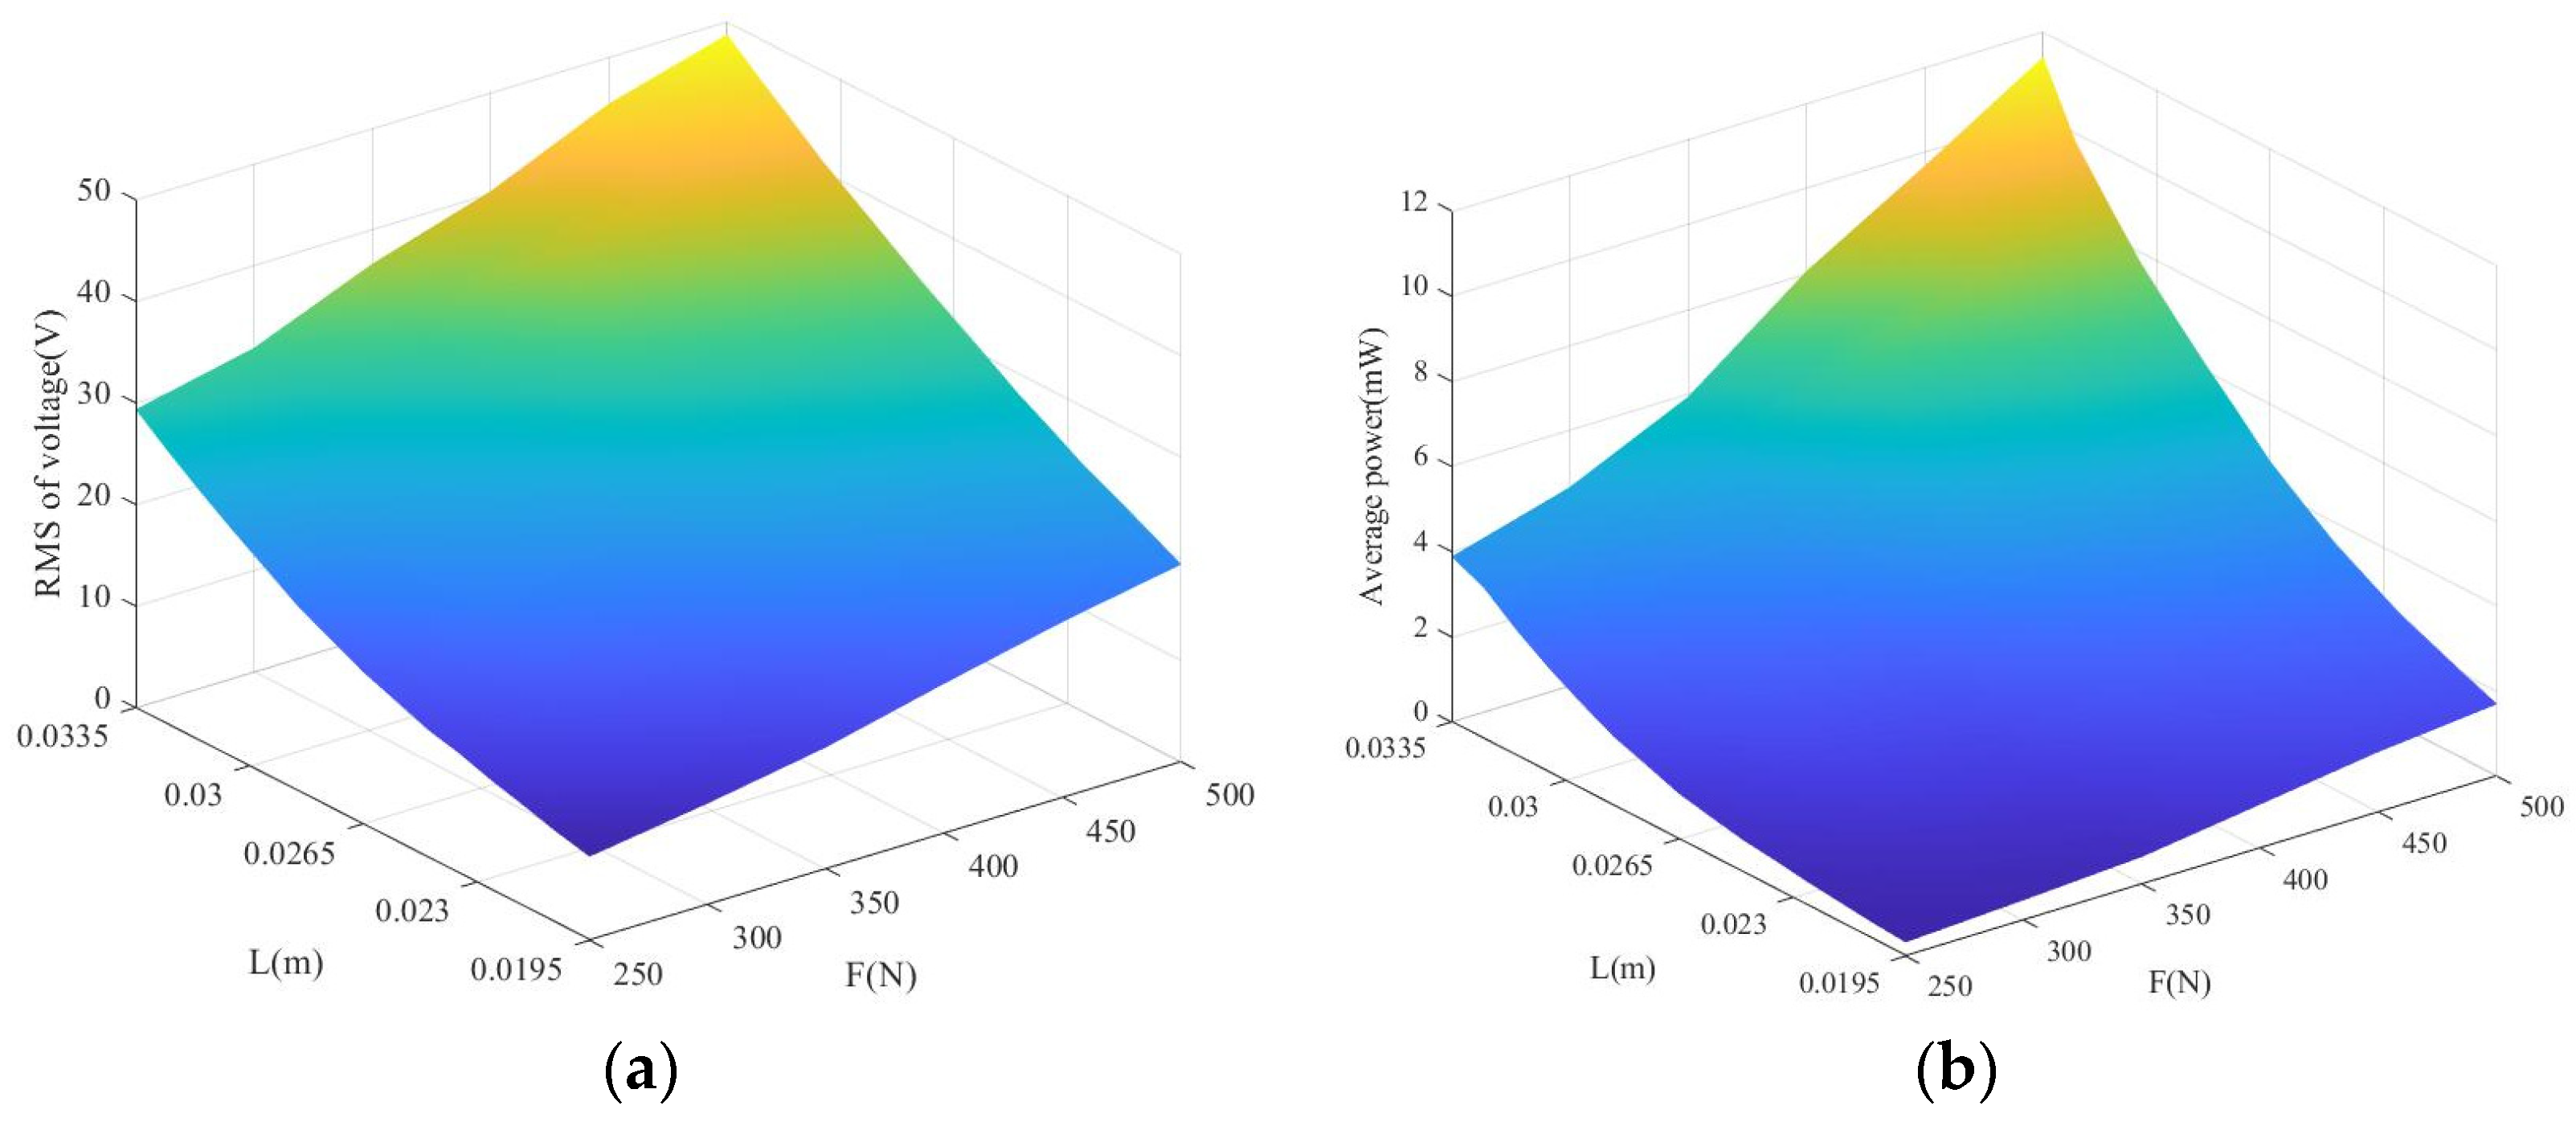
Figure 20.
RMS of voltages and average powers from 1#1 PZT4 patch of 1# piezoelectric brick with Spring steel substrate versus the force arm length of LPCB and the footstep excitation amplitude. (a) RMS of voltages; (b) Average powers.
Figure 20.
RMS of voltages and average powers from 1#1 PZT4 patch of 1# piezoelectric brick with Spring steel substrate versus the force arm length of LPCB and the footstep excitation amplitude. (a) RMS of voltages; (b) Average powers.
Figure 21.
RMS of voltages and average powers from 1#1 PZT4 patch of 1# piezoelectric brick with Babbitt metal substrate versus the force arm length of LPCB and the footstep excitation amplitude. (a) RMS of voltages; (b) Average powers.
Figure 21.
RMS of voltages and average powers from 1#1 PZT4 patch of 1# piezoelectric brick with Babbitt metal substrate versus the force arm length of LPCB and the footstep excitation amplitude. (a) RMS of voltages; (b) Average powers.
Table 1.
Dimensions and physical parameters of piezoelectric bricks.
Table 1.
Dimensions and physical parameters of piezoelectric bricks.
| Parameters | Substrate Beam | Piezoelectric Patches (PZT4) |
|---|
| L (mm) | 19.5 | |
| A (mm) | 7 | |
| t1 (mm) | 1.5 | |
| t2 (mm) | 5 | |
| t3 (mm) | 4 | |
| lp (mm) | | 50 |
| tp (mm) | | 1 |
| Young’s modulus E (GPa) | 72 | 75.1~77.3 |
| Mass density (kg/m3) | 2742 | 7640~7683 |
| C (nF) | | 42.4~43.5 |
| d31(pC/N) | | 615~623 |
Table 2.
Peak-to-peak voltages (V) from 1#1 and 2#1 PZT4 patches (f = 1 Hz).
Table 2.
Peak-to-peak voltages (V) from 1#1 and 2#1 PZT4 patches (f = 1 Hz).
| Amplitude of Footstep Excitation/N | 250 | 300 | 350 | 400 | 450 | 500 |
|---|
| 1#1 unimorph | 19.5 mm | 32 | 41 | 54 | 61 | 68 | 77 |
| 26.5 mm | 60 | 81 | 96 | 107 | 117 | 131 |
| 33.5 mm | 118 | 133 | 155 | 167 | 183 | 198 |
| 2#1 unimorph | 19.5 mm | 40 | 76 | 101 | 131 | 153 | 165 |
| 26.5 mm | 94 | 130 | 164 | 196 | 217 | 238 |
| 33.5 mm | 170 | 219 | 261 | 304 | 331 | 355 |
Table 3.
The maximum average powers from 2#1–2#4 PZT4 patches on bimorph PCSs and the corresponding optimal load resistances (F = 500 N, f = 1 Hz).
Table 3.
The maximum average powers from 2#1–2#4 PZT4 patches on bimorph PCSs and the corresponding optimal load resistances (F = 500 N, f = 1 Hz).
| Force Arm | L = 19.5 mm | L = 26.5 mm | L = 33.5 mm |
|---|
| 2#1 | 4.62 mW | 444.4 KΩ | 10.68 mW | 411.8 KΩ | 24.11 mW | 375 KΩ |
| 2#2 | 4.16 mW | 444.4 KΩ | 9.93 mW | 411.8 KΩ | 22.18 mW | 375 KΩ |
| 2#3 | 5.18 mW | 444.4 KΩ | 12.36 mW | 411.8 KΩ | 25.35 mW | 375 KΩ |
| 2#4 | 4.81 mW | 444.4 KΩ | 11.68 mW | 411.8 KΩ | 24.51 mW | 375 KΩ |
Table 4.
Output electric parameters from 2#1 and 2#3 PZT4 patches on unimorph PCSs in different frequency of exerted force (F = 500 N, L = 33.5 mm).
Table 4.
Output electric parameters from 2#1 and 2#3 PZT4 patches on unimorph PCSs in different frequency of exerted force (F = 500 N, L = 33.5 mm).
| | Peak-to-Peak Voltages | Maximum Average Powers | Optimal Load Resistance |
|---|
| 2 Hz | 2#1 | 362 V | 89.47 mW | 230.77 kΩ |
| 2#3 | 376 V | 94.72 mW | 230.77 kΩ |
| 1 Hz | 2#1 | 355 V | 41.23 mW | 333.33 kΩ |
| 2#3 | 363 V | 43.65 mW | 333.33 kΩ |
Table 5.
The maximum average power density of the piezoelectric harvesters.
Table 5.
The maximum average power density of the piezoelectric harvesters.
| Piezoelectric Harvesters | Maximum Average Power Density |
|---|
| Piezoelectric brick in this research | 37.39 μW/mm3 |
| Footstep harvester [49] | 1.6 μW/mm3 |
| Footwear harvester [51] | 3.9 μW/mm3 |
| L-shaped harvester [55] | 2.1 μW/mm3 |
| U-shaped harvester [56] | 28.1 μW/mm3 |
Table 6.
Output electric parameters of 1#1 PZT4 patches on unimorph PCS with different substrate materials.
Table 6.
Output electric parameters of 1#1 PZT4 patches on unimorph PCS with different substrate materials.
| Substrate Material | Young’s Modulus (GPa) | Mass Density (kg/m3) | Maximum RMS of Voltage (V) | Maximum Average Power (mW) |
|---|
| Spring steel | 210 | 7820 | 48 | 11.39 |
| Aluminum alloy | 72 | 2742 | 53 | 13.24 |
| Babbitt metal | 58.8 | 7170 | 58 | 16.01 |


