
An Experimental Study on Efficient Piezoelectric Coupled Beams and Corresponding Piezoelectric Bricks


Abstract
:1. Introduction
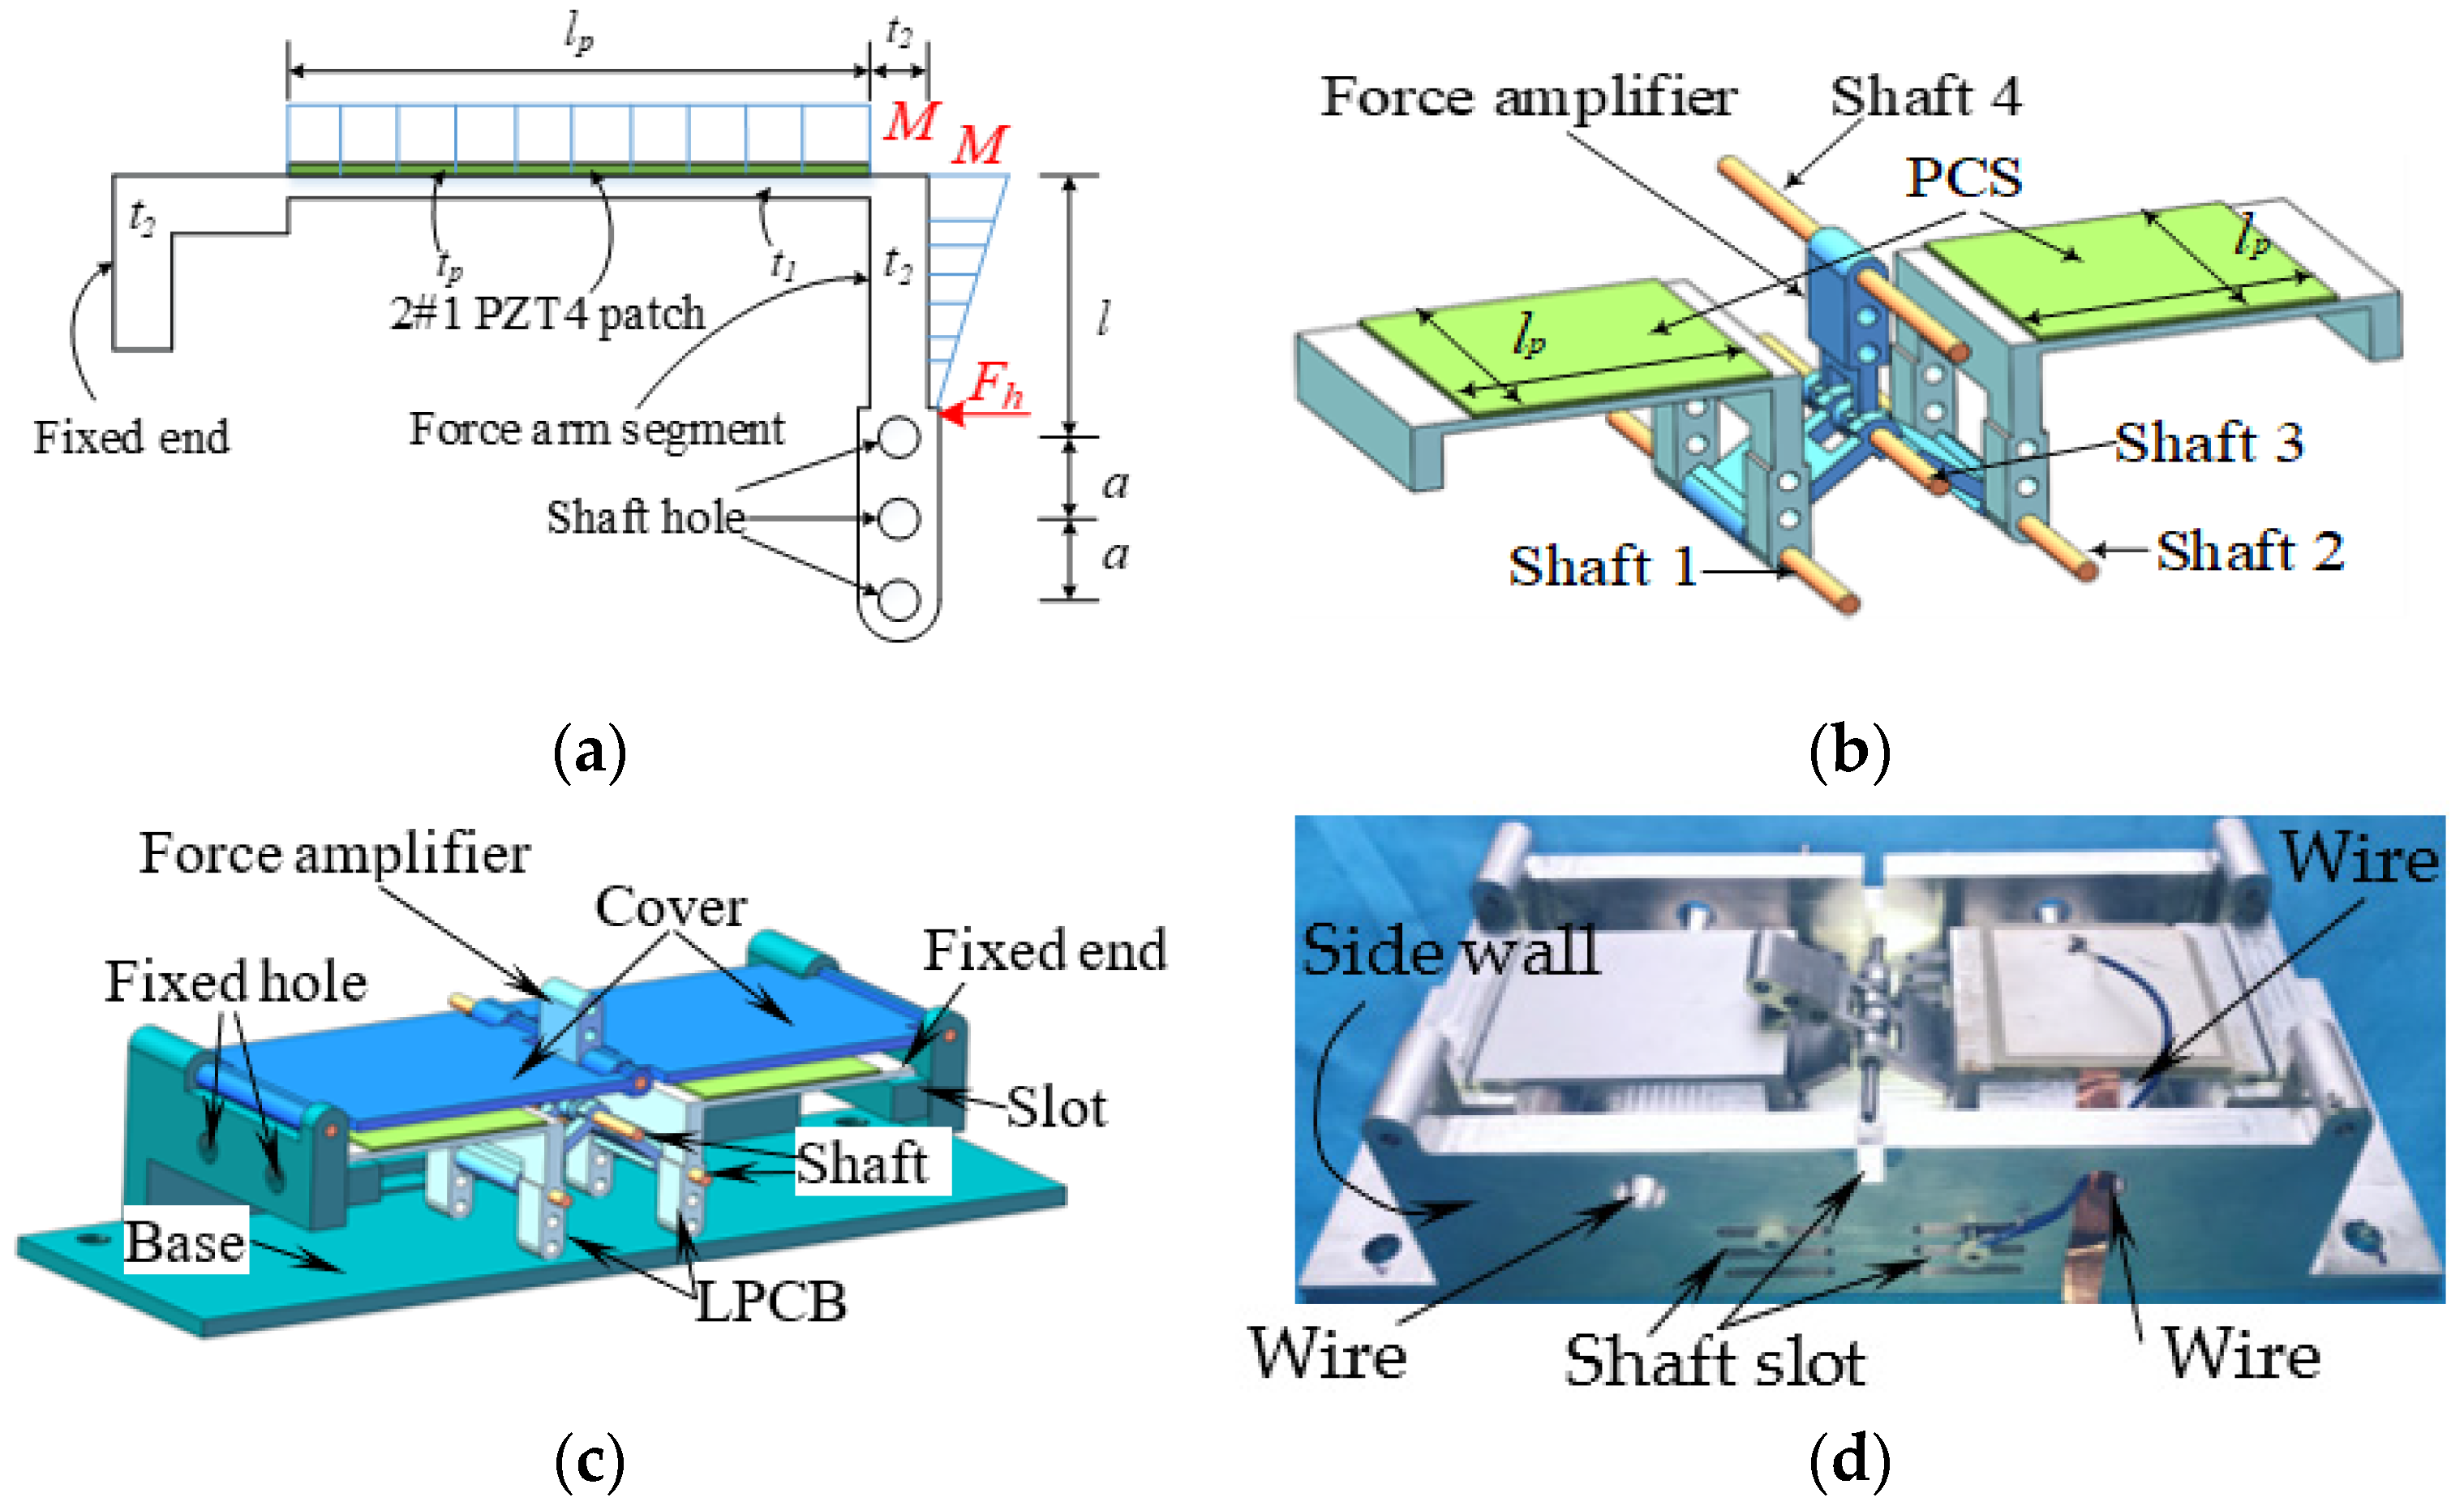
2. Development of Novel Piezoelectric Bricks
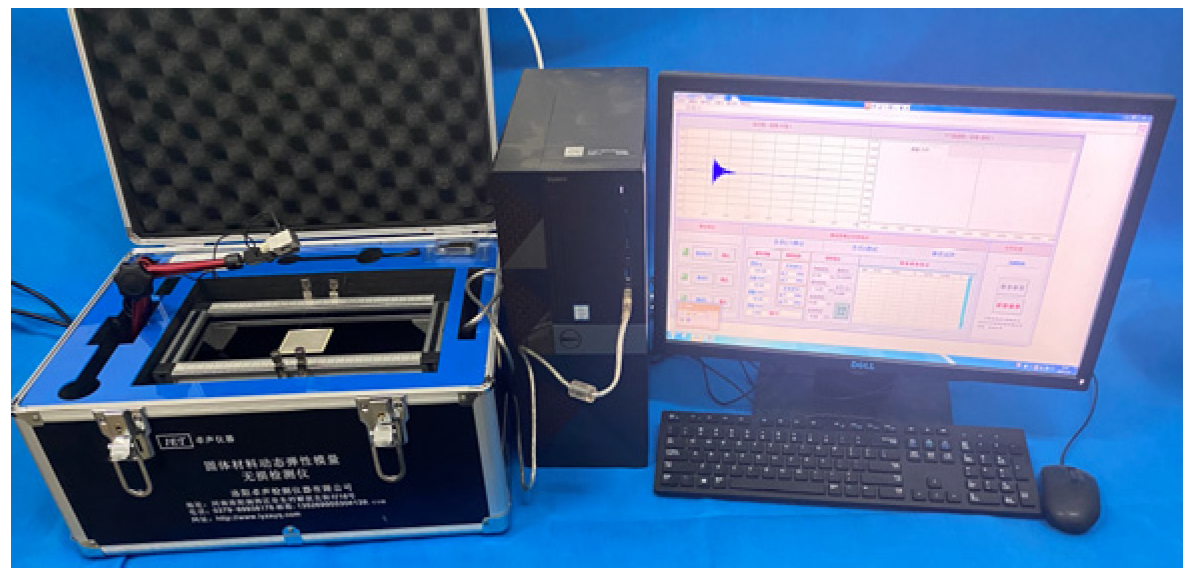
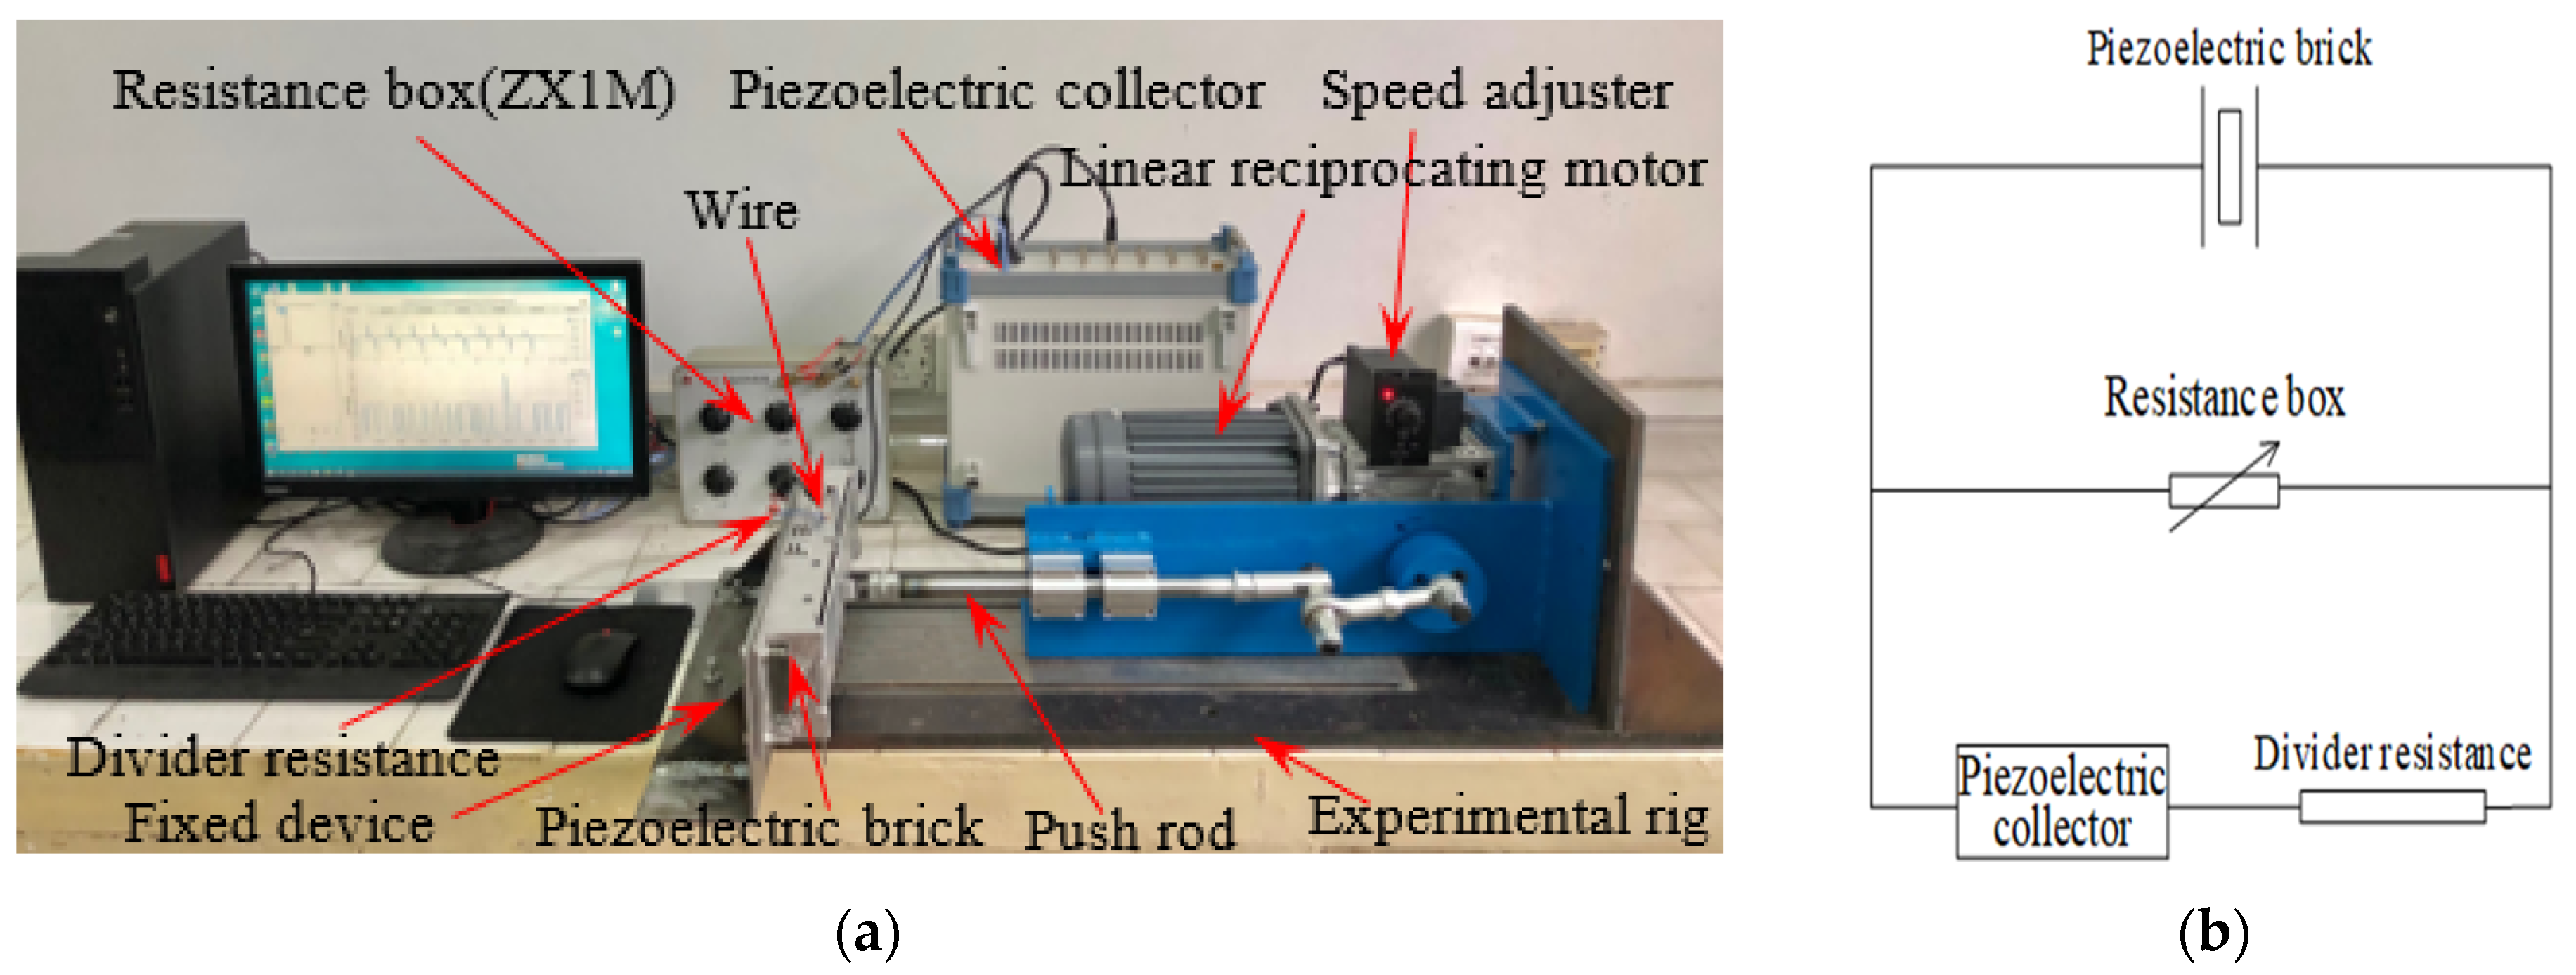
3. Experimental Study
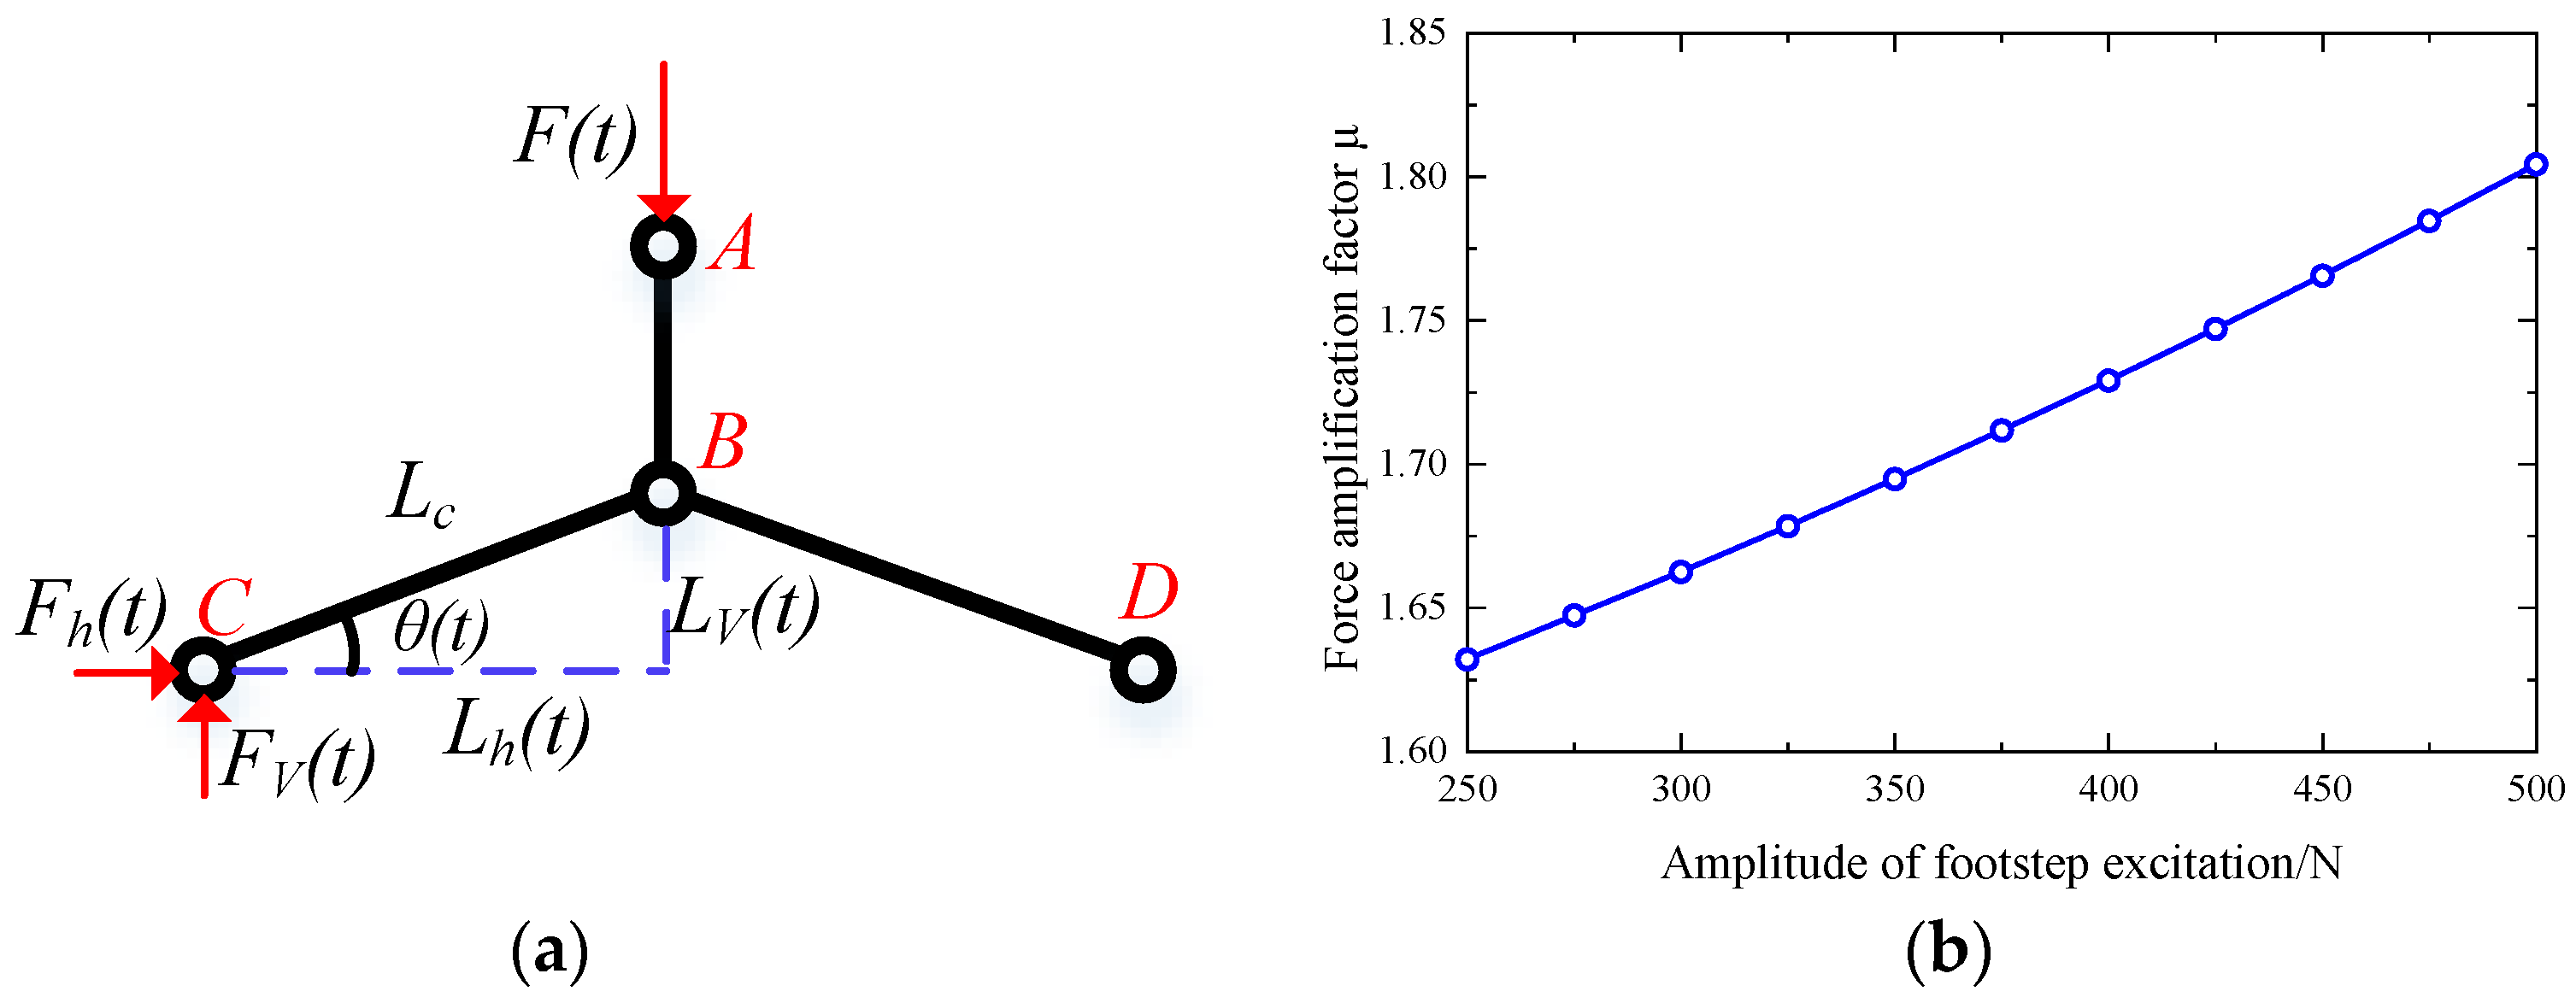
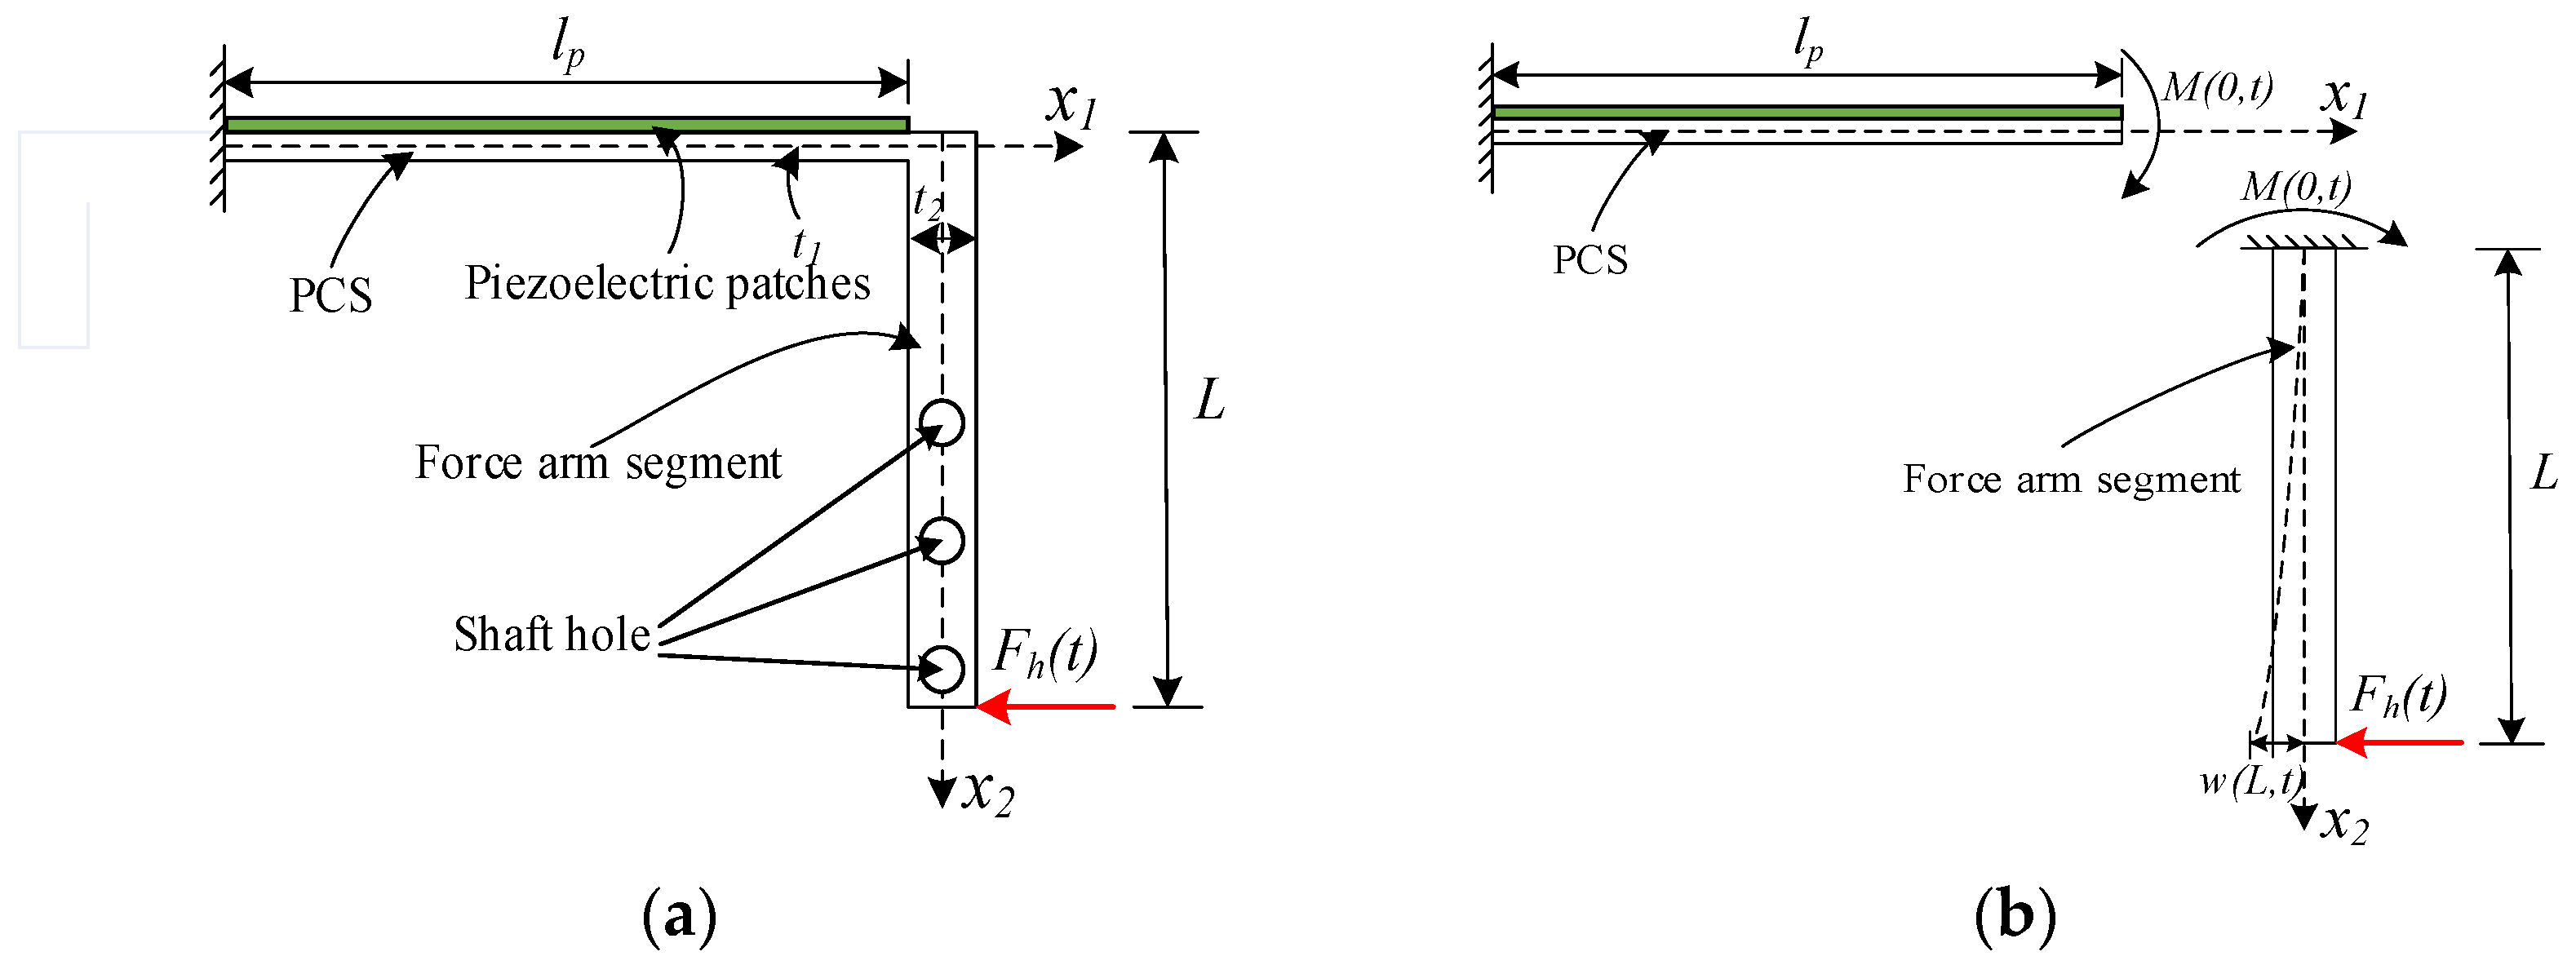
4. The Simplified Theoretical Model of the LPCB with One PCS
5. Experimental Results and Discussion
5.1. Experiments of 1# Piezoelectric Brick
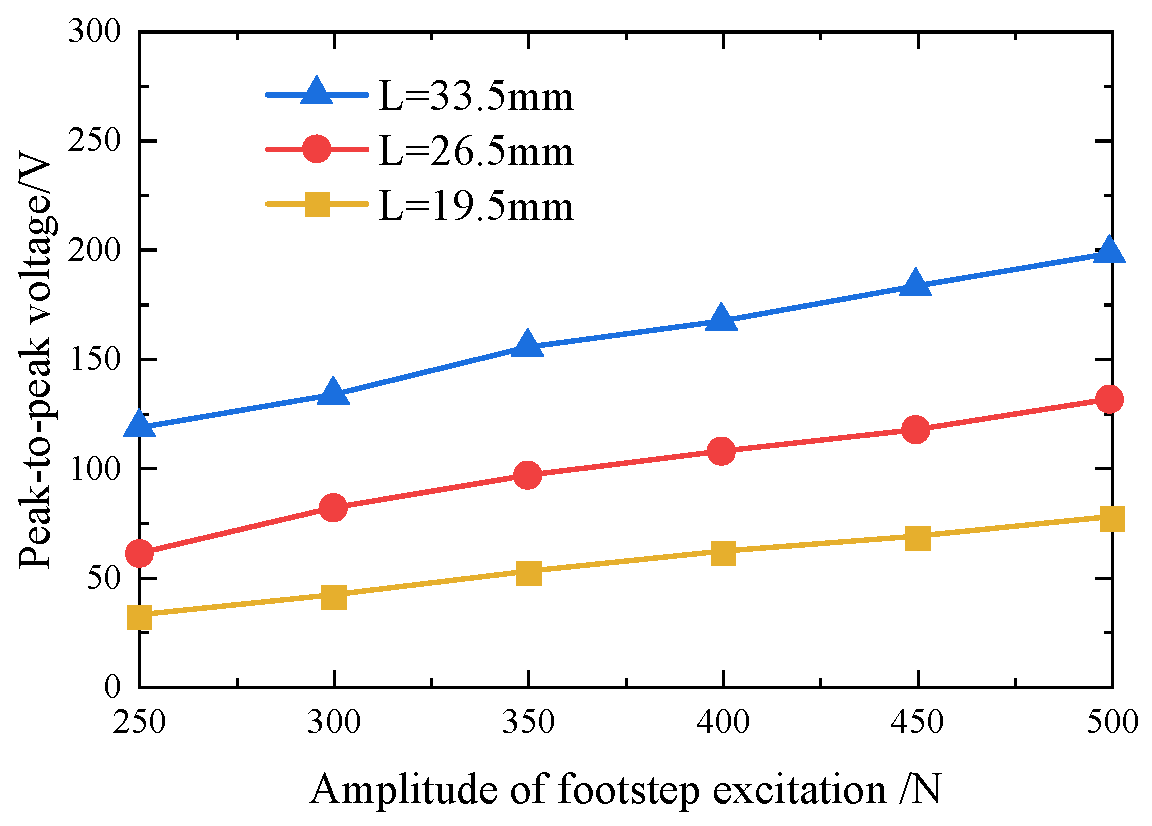
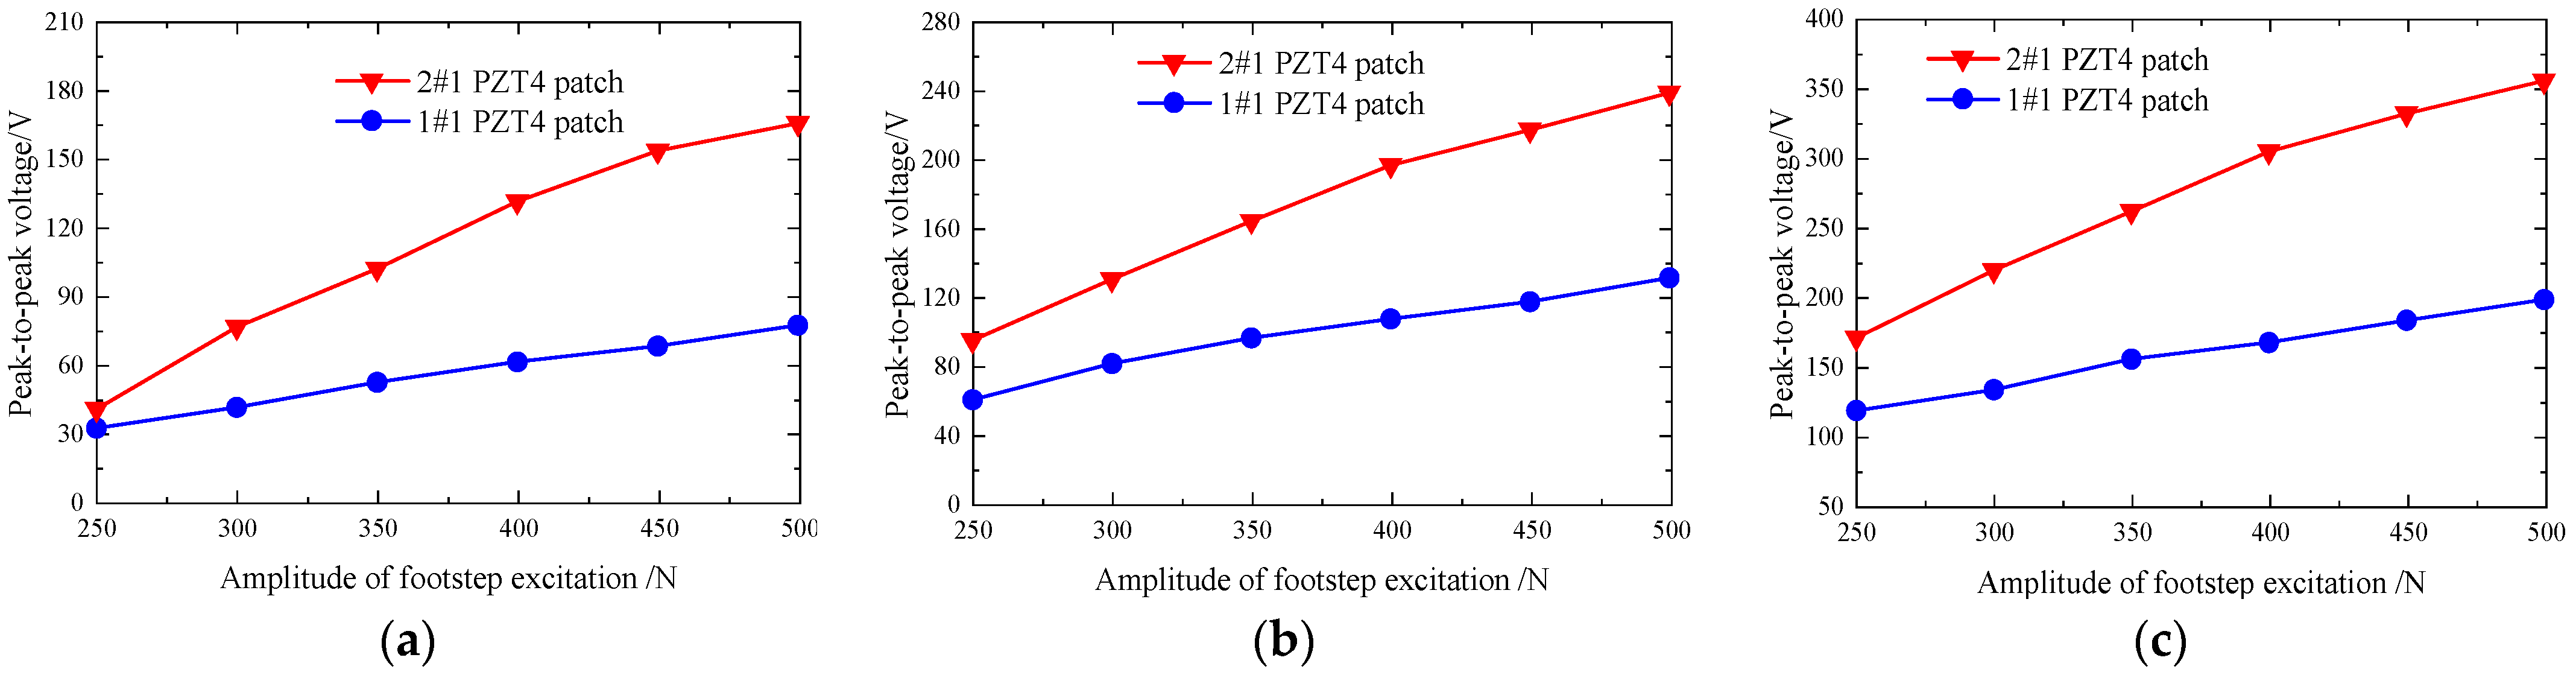
5.1.1. Peak-to-Peak Voltages from 1#1 PZT4 Patch on Unimorph PCS (Open-Circuit)
5.1.2. Average Powers from PZT4 Patch of 1#1 on Unimorph PCS (Close-Circuit)
5.2. Experiments of 2# Piezoelectric Brick
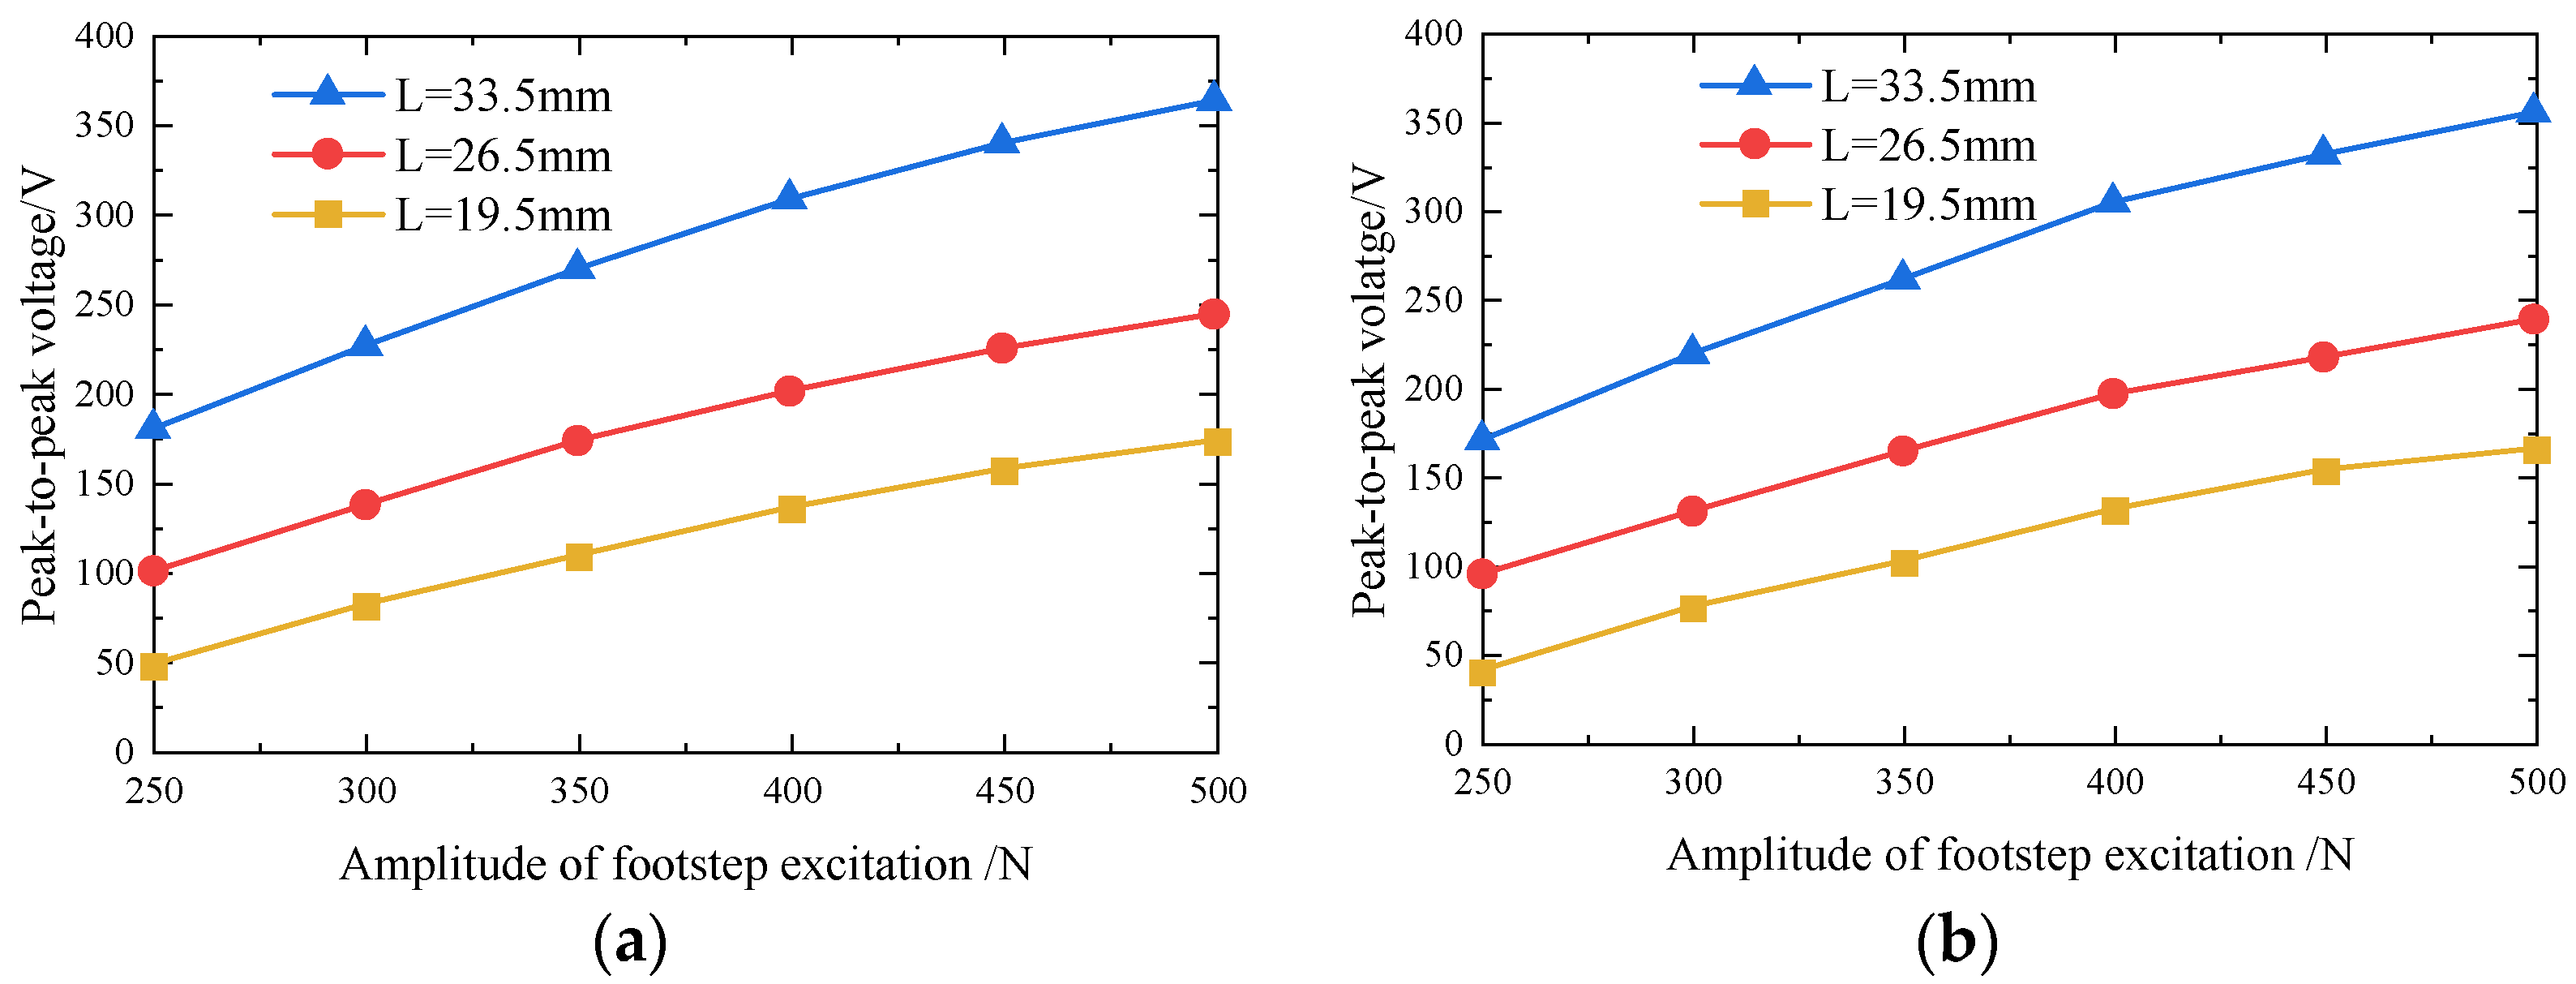
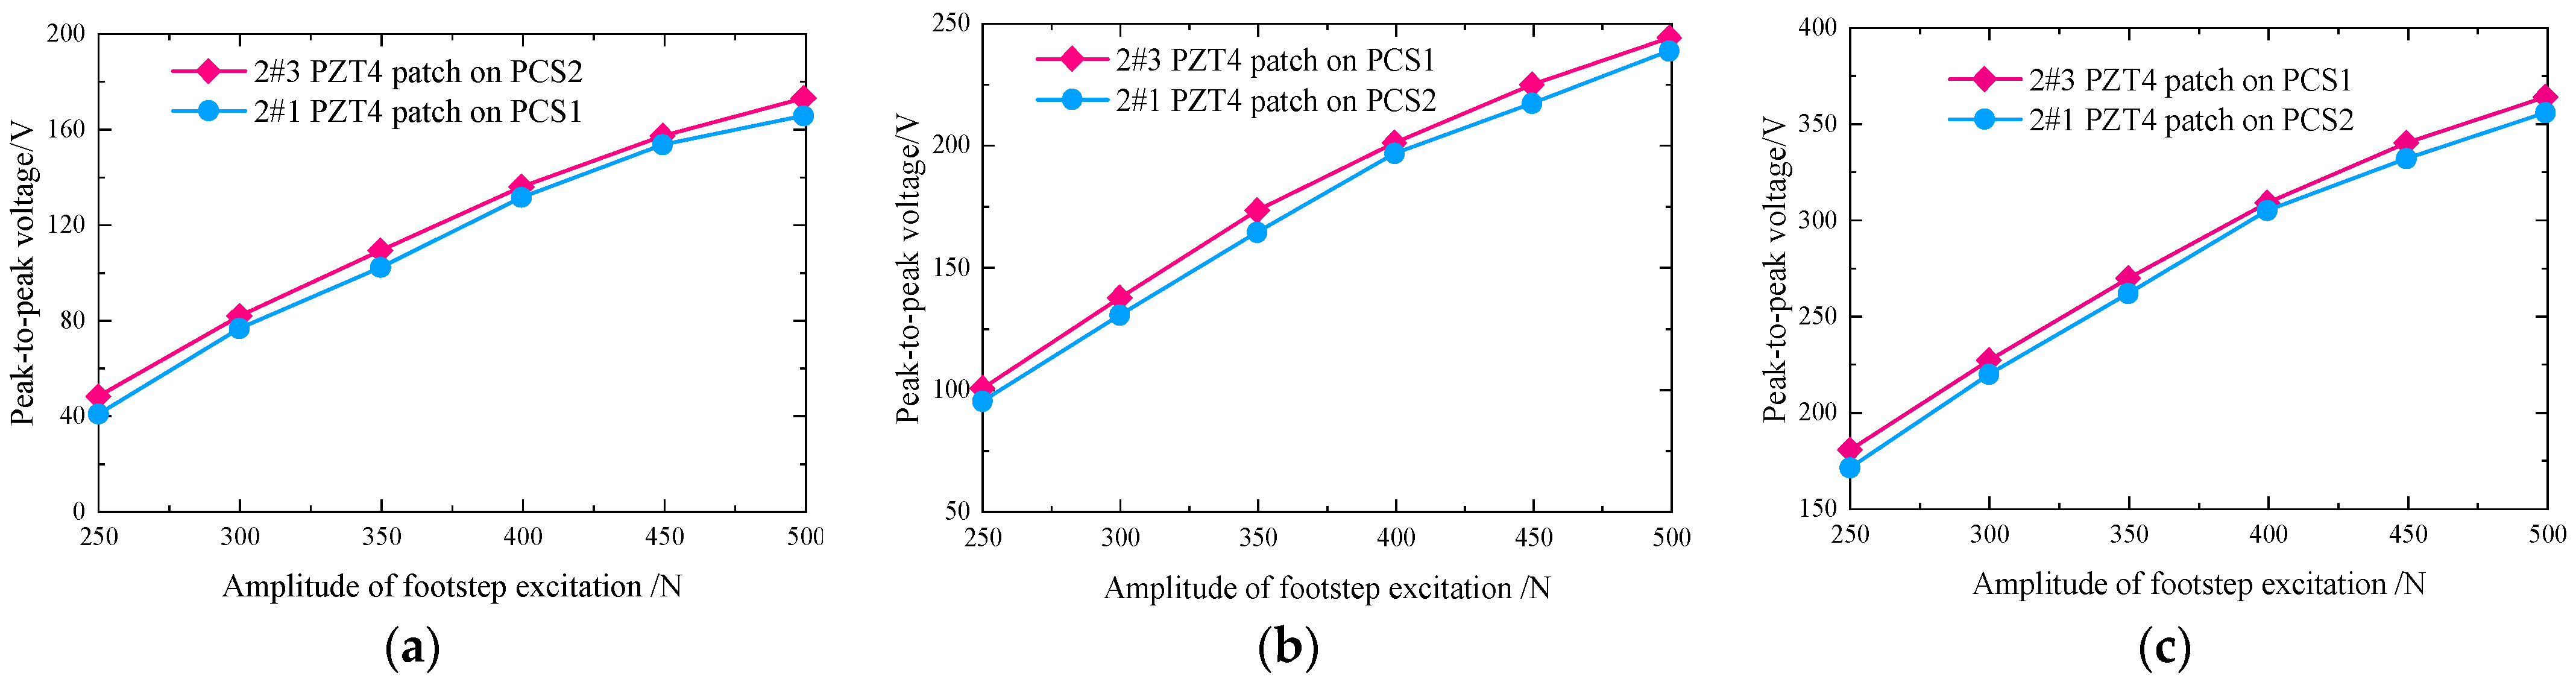
5.2.1. Peak-to-Peak Voltages from PZT4 Patches of 2#1 on Unimorph PCS1 and 2#3 on Unimorph PCS2 (Open-Circuit)
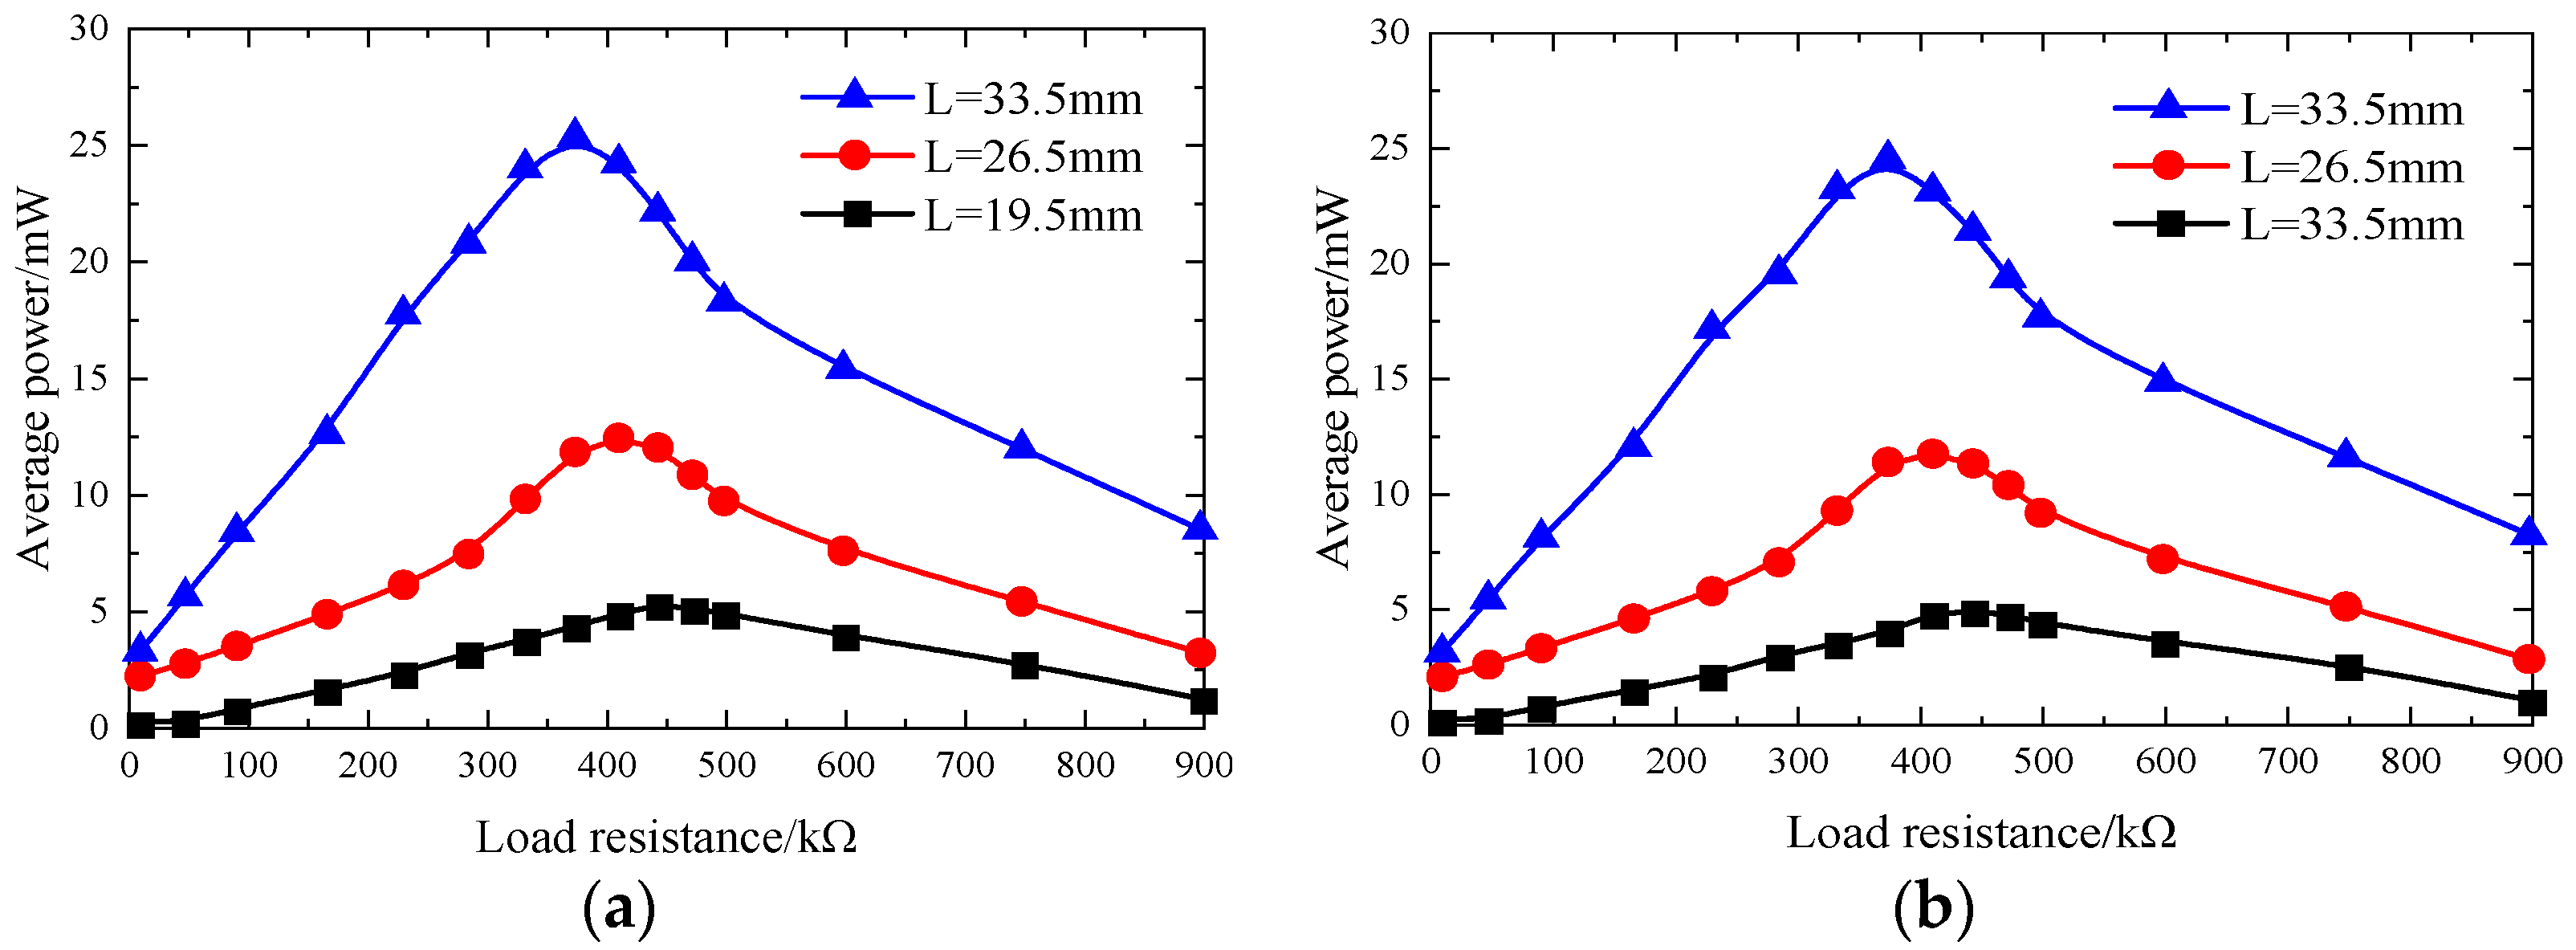
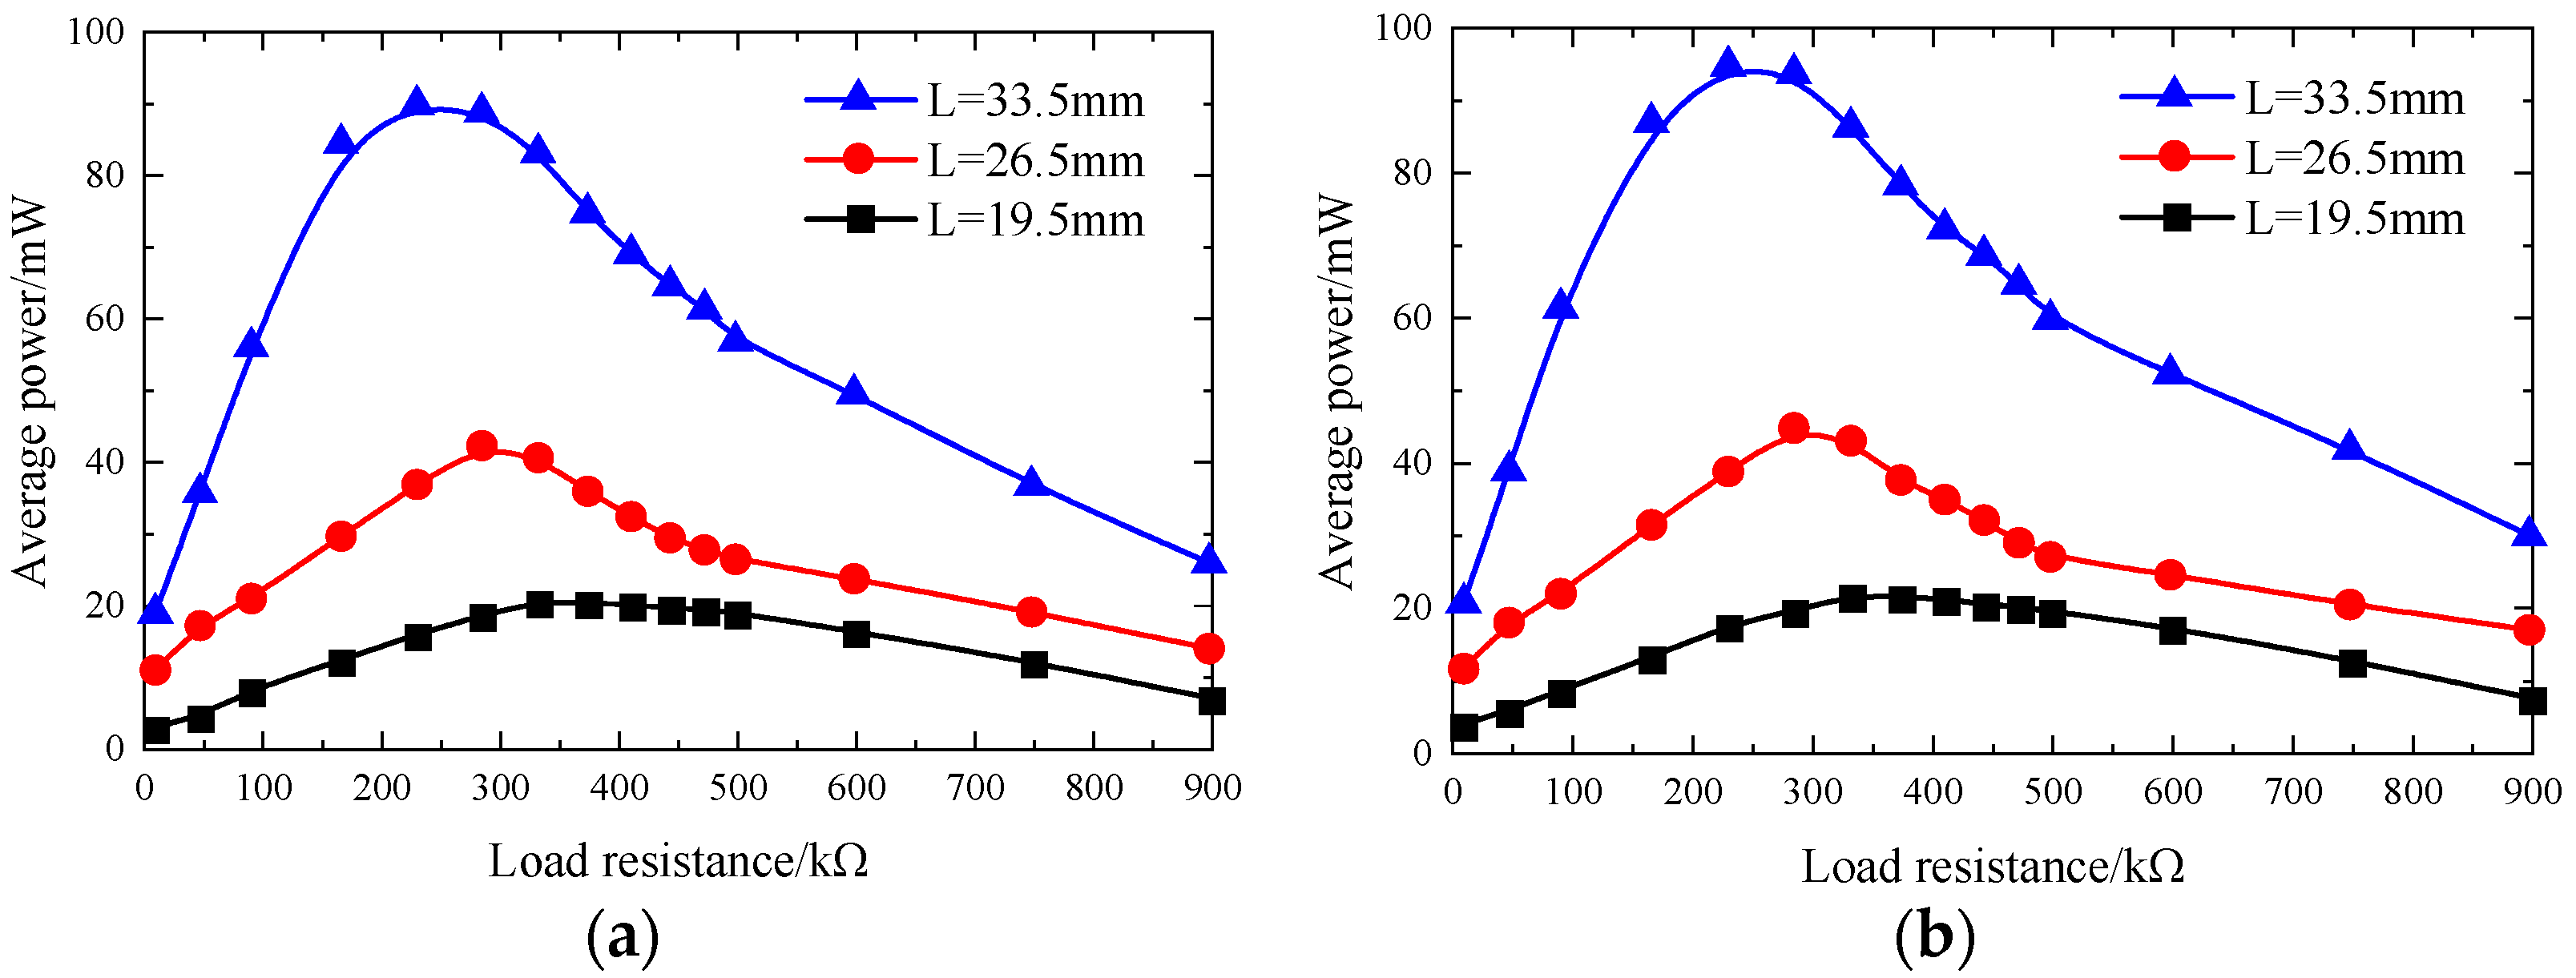
5.2.2. Average Powers from PZT4 Patches of 2#1–2#4 on PCSs (Close-Circuit)
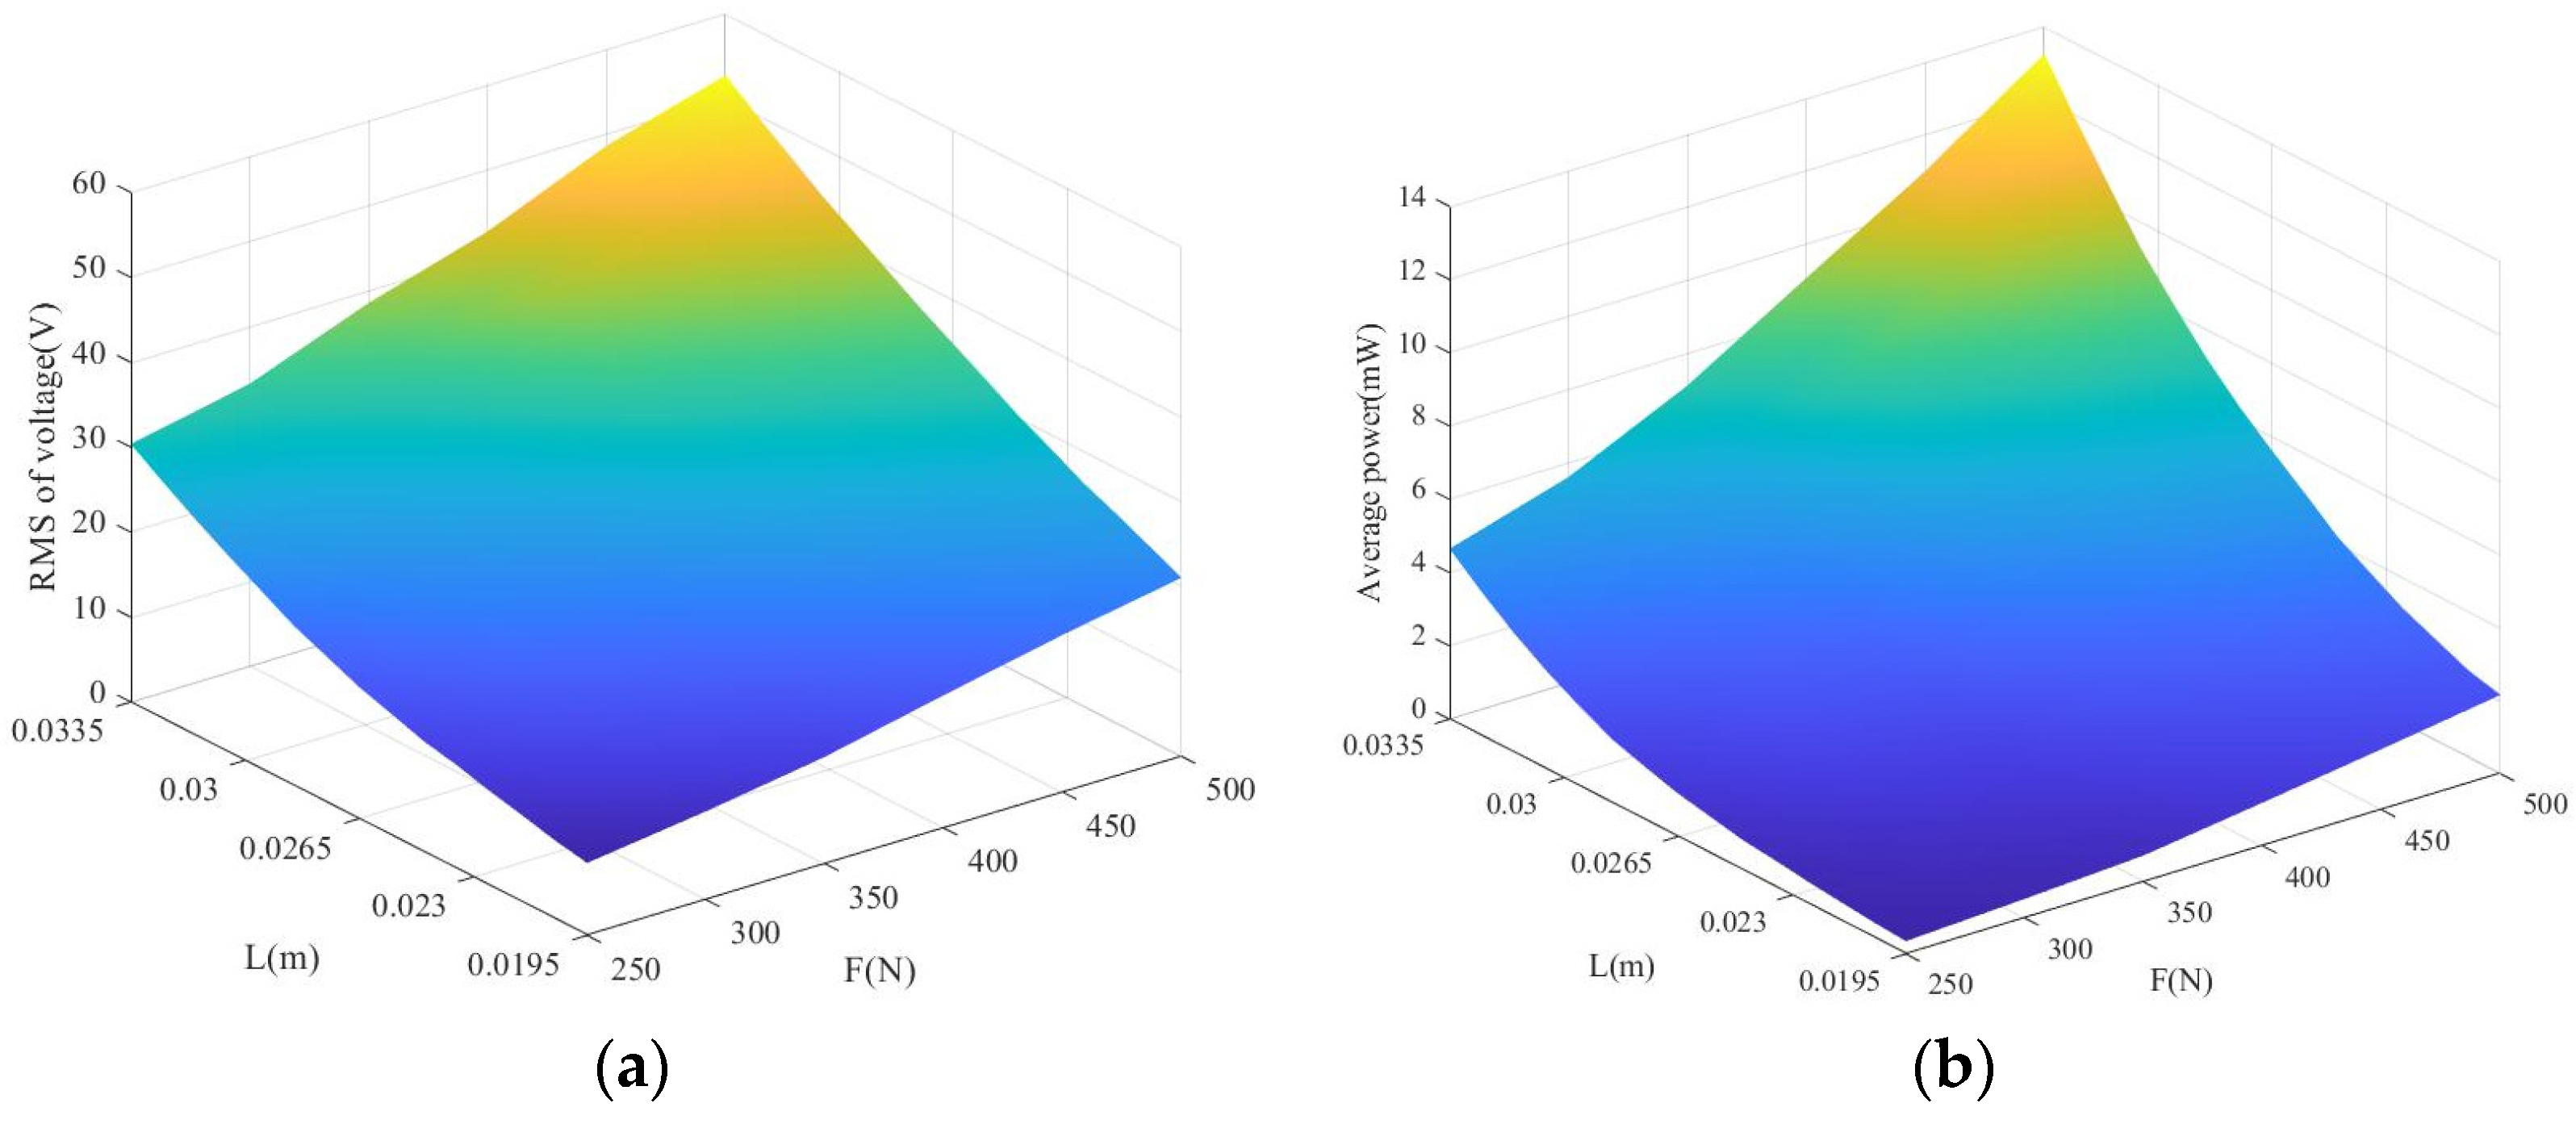
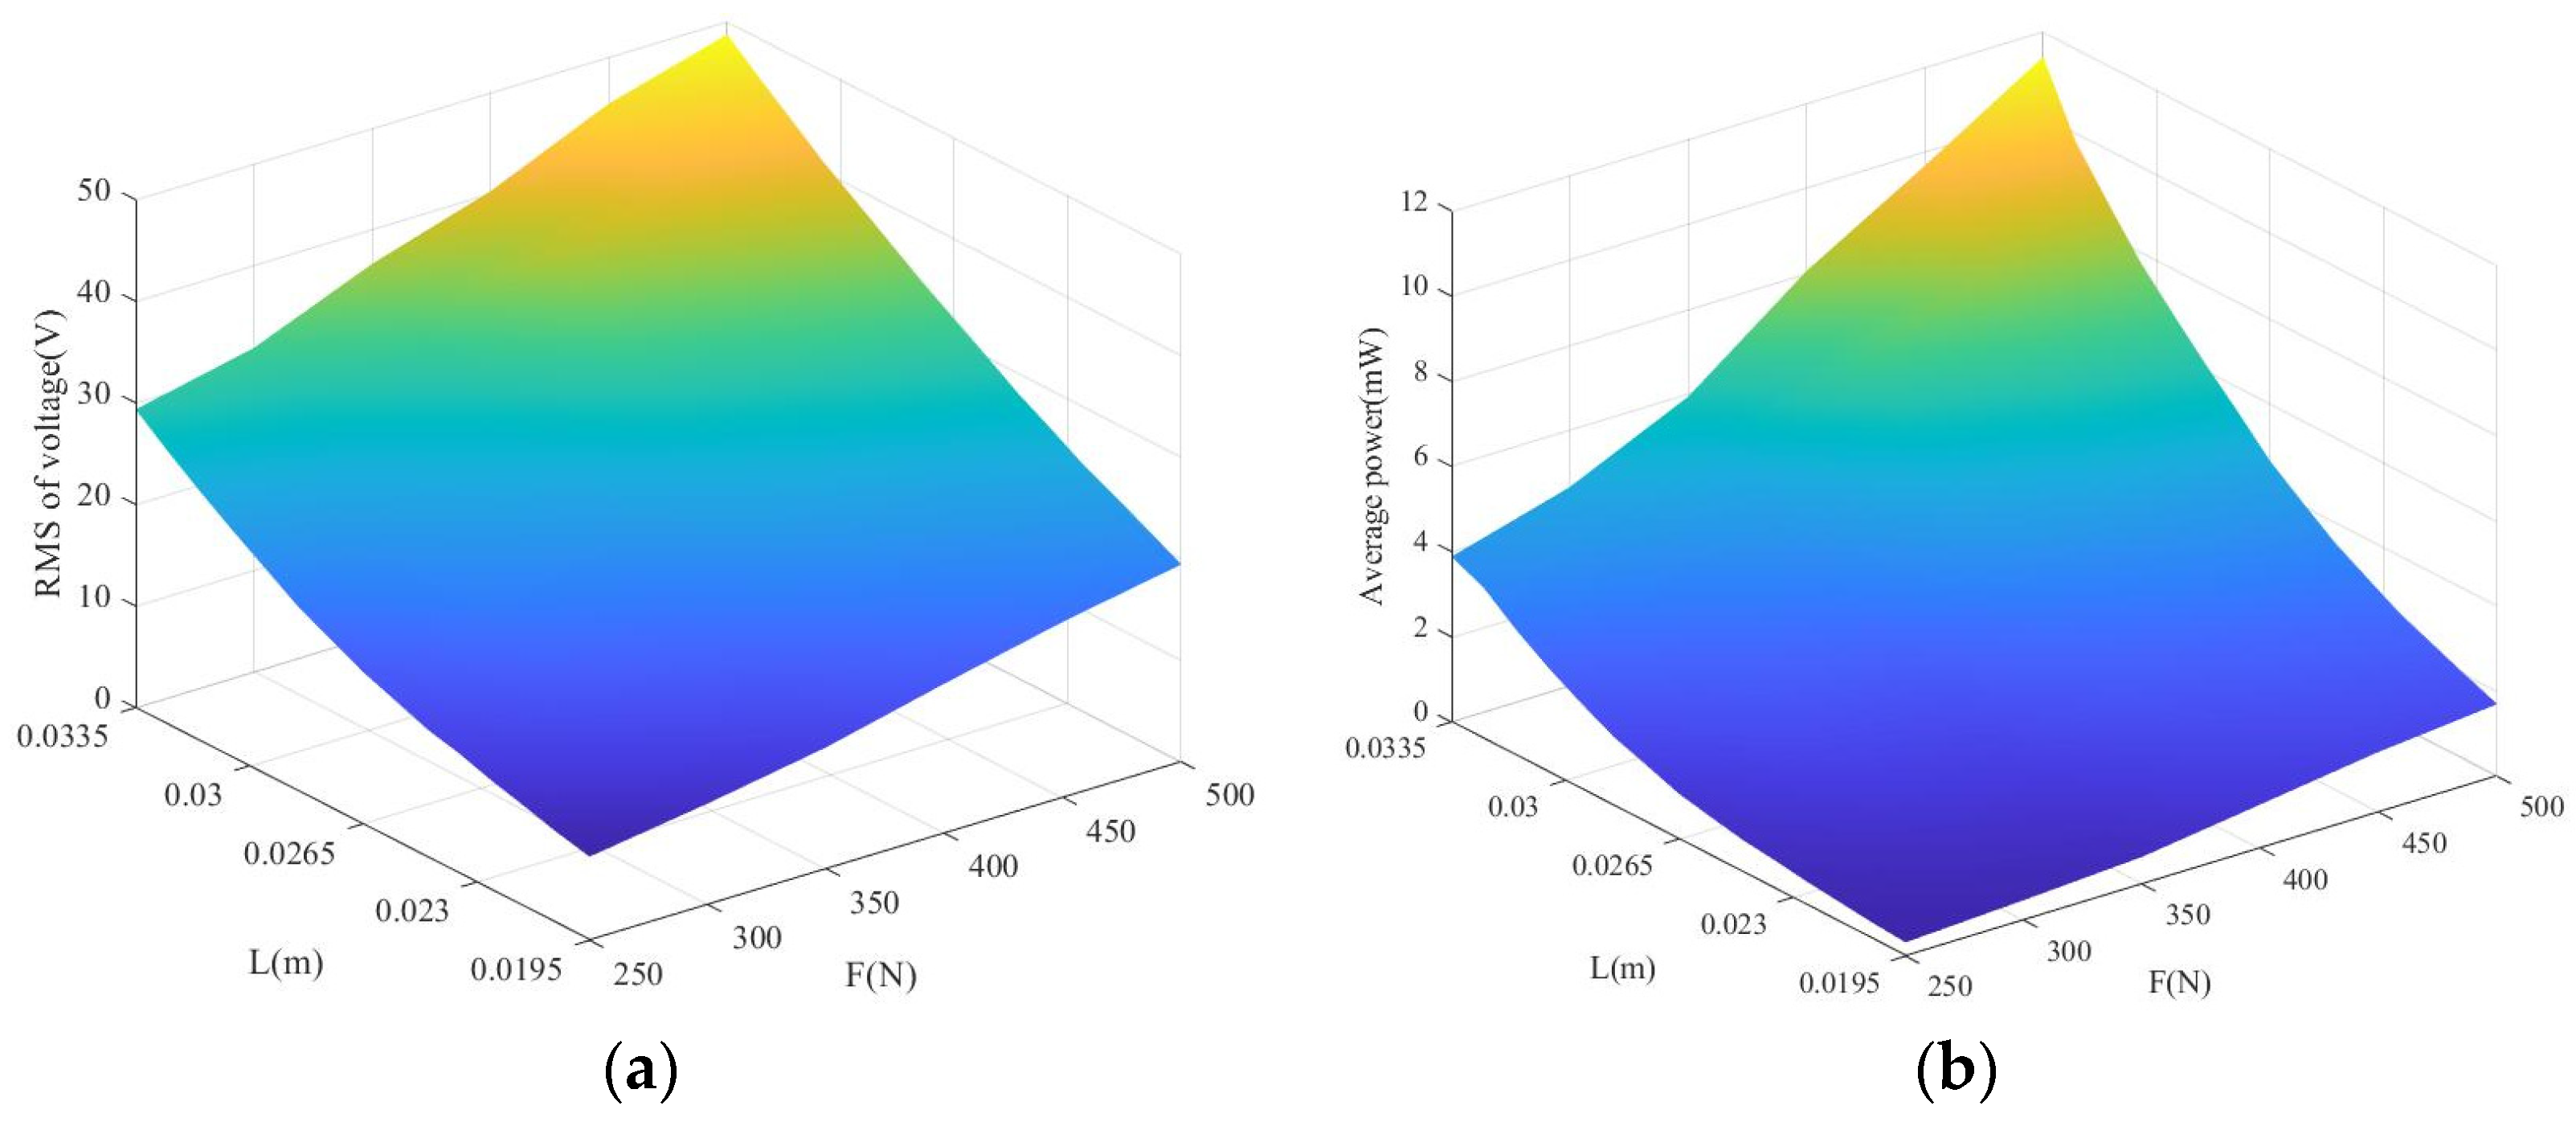
6. MATLAB Simulation
7. Conclusions
- 1.
- The force amplification factor increases with the increase of amplitude of footstep excitation and the energy harvesting ability of the piezoelectric brick can be improved by using the substrate material with a small young’s modulus;
- 2.
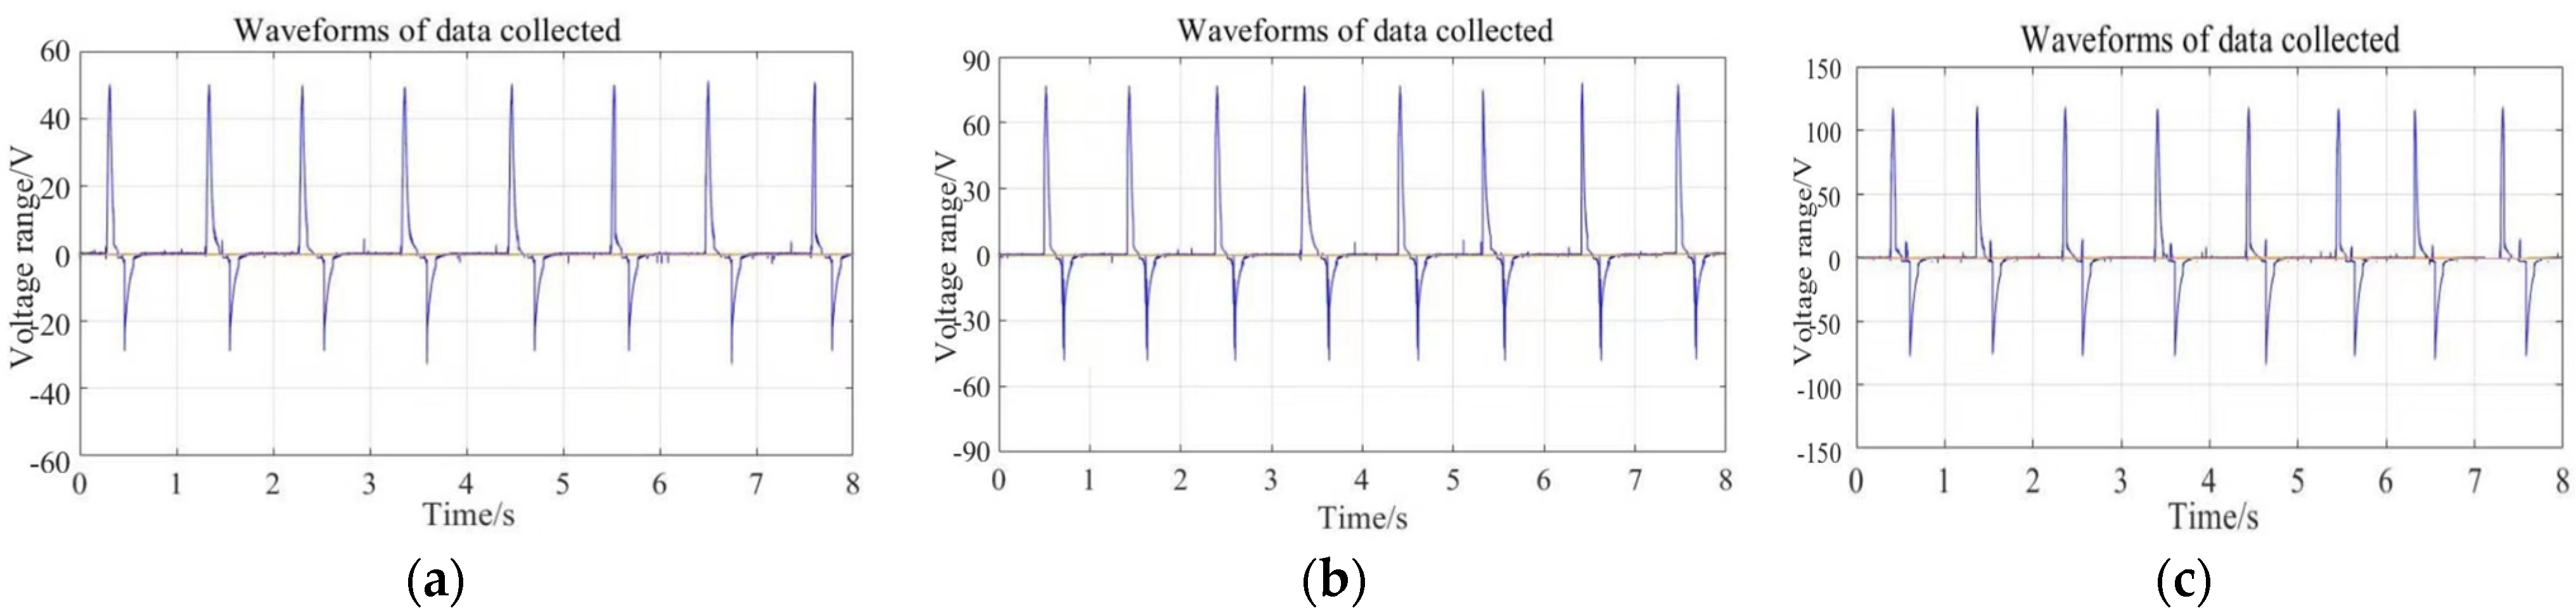
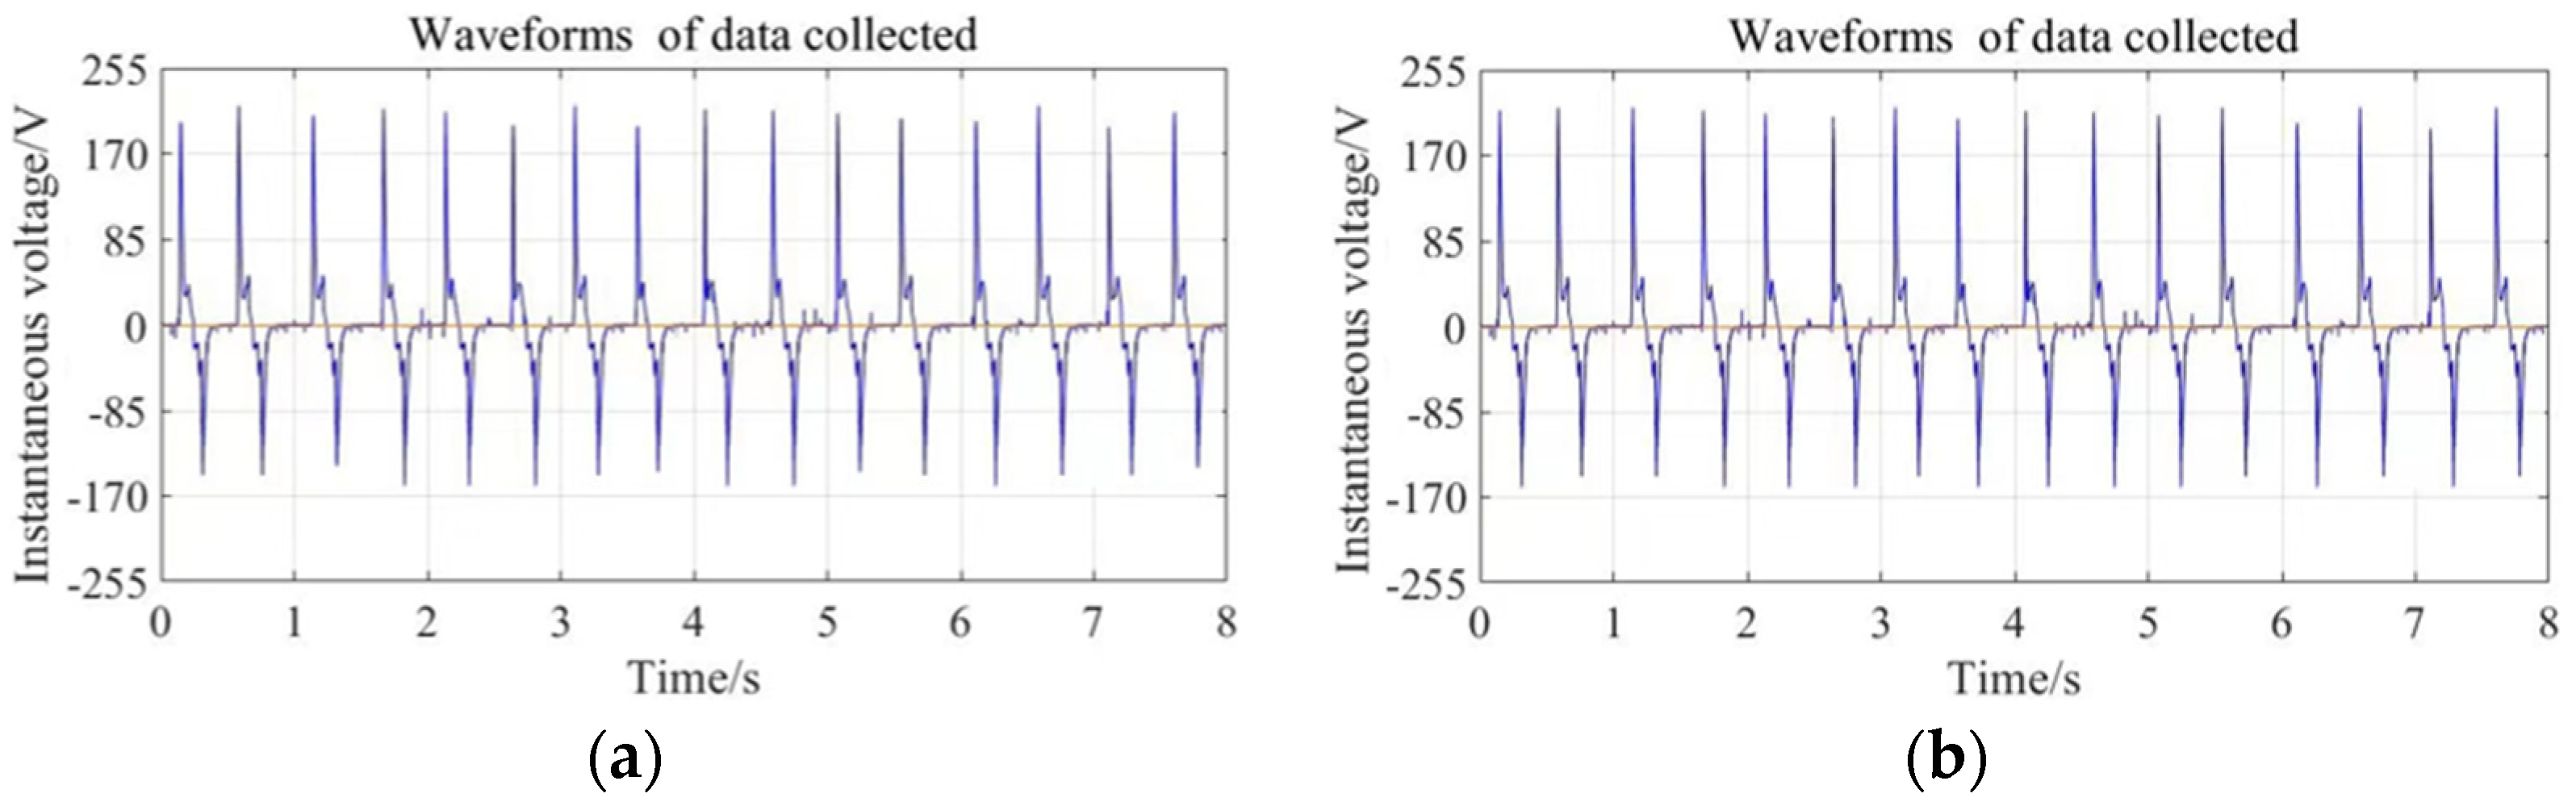
- For any PZT4 patch bonded on LPCB in 1# or 2# piezoelectric brick, the output peak voltage in forced vibration period is far greater than that in the free vibration period, because the strain amplitude of the PZT4 patch in the forced vibration period is much bigger than that in free vibration period;
- 3.
- The average powers from PZT4 patches bonded on upper surfaces in PCSs are slightly larger than the corresponding ones from PZT4 patches bonded on lower surfaces in PCSs, which is because the strain energy in PCS transfers from stretching surface to pressing surface in the vibration process and there is a bigger energy dissipation in the transaction from upper surface to the lower surface compared to from lower surface to upper surface;
- 4.
- The output voltages and powers from PZT4 patches of 2# piezoelectric brick are notably larger than the corresponding ones from PZT4 patches of 1# piezoelectric brick in the same excitation; the main reason is the bending rigidity of 2# piezoelectric brick is less than that of 1# piezoelectric brick;
- 5.
- For 2# piezoelectric brick, the output voltages and powers from PZT4 patches on PCS2 are slightly larger than the corresponding ones from PZT4 patches on PCS1, because there is energy dissipation of exerted force in the transmission from PCS2 to PCS1;
- 6.
- The measured voltage (voltage density) and the output average power (power density) from 2# piezoelectric brick can reach up to 376 V (0.15 V/mm3) and 94.72 mW (37.89 μW/mm3) for a PZT4 patch with a dimension of 50 mm × 50 mm × 1 mm.
Author Contributions
Funding
Institutional Review Board Statement
Informed Consent Statement
Data Availability Statement
Conflicts of Interest
References
- Choi, Y.M.; Lee, M.G.; Jeon, Y. Wearable biomechanical energy harvesting technologies. Energies 2017, 10, 1483. [Google Scholar] [CrossRef] [Green Version]
- Izadgoshasb, I.; Lim, Y.Y.; Lake, N.; Tang, L.; Padilla, R.V.; Kashiwao, T. Optimizing orientation of piezoelectric cantilever beam for harvesting energy from human walking. Energy Convers. Manag. 2018, 161, 66–73. [Google Scholar] [CrossRef]
- Berdy, D.F.; Valentino, D.J.; Peroulis, D. Kinetic energy harvesting from human walking and running using a magnetic levitation energy harvester. Sens. Actuators A Phys. 2015, 222, 262–271. [Google Scholar] [CrossRef]
- Ha, M.; Park, J.; Lee, Y.; Ko, H. Triboelectric generators and sensors for self-powered wearable electronics. ACS Nano 2015, 9, 3421–3427. [Google Scholar] [CrossRef] [PubMed]
- Tan, Y.; Lu, G.; Cong, M.; Wang, X.; Ren, L. Gathering energy from ultra-low-frequency human walking using a double frequency up-conversion harvester in public squares. Energy Convers. Manag. 2020, 217, 112958. [Google Scholar] [CrossRef]
- Jeong, S.Y.; Hwang, W.S.; Cho, J.W.; Jeong, J.C. Piezoelectric device operating as sensor and harvester to drive switching circuit in LED shoes. Energy 2019, 177, 87–93. [Google Scholar] [CrossRef]
- Iqbal, M.; Nauman, M.M.; Khan, F.U.; Abas, P.E.; Choek, Q.; Iqbal, A.; Aissa, B. Vibration-based piezoelectric, electromagnetic, and hybrid energy harvesters for microsystems applications: A contributed review. Int. J. Energy Res. 2021, 45, 65–102. [Google Scholar] [CrossRef]
- Hamlehdar, M.; Kasaeian, A.; Safaei, M.R. Energy harvesting from fluid flow using piezoelectrics: A critical review. Renew. Energy 2019, 143, 1826–1838. [Google Scholar] [CrossRef]
- Safaei, M.; Sodano, H.A.; Anton, S.R. A review of energy harvesting using piezoelectric materials: State-of-the-art a decade later (2008–2018). Smart Mater. Struct. 2019, 28, 113001. [Google Scholar] [CrossRef]
- Kim, H.W.; Priya, S.; Uchino, K.; Newnham, R.E. Piezoelectric Energy Harvesting under High Pre-Stressed Cyclic Vibrations. J. Electroceram. 2015, 15, 27–34. [Google Scholar] [CrossRef]
- Anh, N.D.; Linh, N.N.; Manh, V.; Tuan, V.A.; Kuu, N.V.; Nguyen, A.T.; Elishakoff, I. Efficiency of mono-stable piezoelectric Duffing energy harvester in the secondary resonances by averaging method. Part 1: Sub-harmonic resonance. Int. J. Lin. Mech. 2020, 126, 103537. [Google Scholar] [CrossRef]
- Pradeesh, E.L.; Udhayakumar, S. Effect of placement of piezoelectric material and proof mass on the performance of piezoelectric energy harvester. Mech. Syst. Signal Process. 2019, 130, 664–676. [Google Scholar] [CrossRef]
- He, L.; Zhao, D.; Li, W.; Wu, X.; Cheng, G. A dual piezoelectric energy harvester with contact and non-contact driven by inertial wheel. Mech. Syst. Signal Process. 2020, 146, 106994. [Google Scholar] [CrossRef]
- Zhao, Q.; Liu, Y.; Wang, L.; Yang, H.; Cao, D. Design method for piezoelectric cantilever beam structure under low frequency condition. Int. J. Pavement Res. Technol. 2018, 11, 153–159. [Google Scholar] [CrossRef]
- Xie, X.; Wang, Q.; Wu, N. Energy harvesting from high-rise buildings by a piezoelectric coupled cantilever with a proof mass. Int. J. Eng. Sci. 2013, 72, 98–106. [Google Scholar] [CrossRef]
- Li, M.; Jing, X. Novel tunable broadband piezoelectric harvesters for ultralow-frequency bridge vibration energy harvesting. Appl. Energy 2019, 255, 113829. [Google Scholar] [CrossRef]
- Wang, H.; Jasim, A.; Chen, X. Energy harvesting technologies in roadway and bridge for different applications—A comprehensive review. Appl. Energy 2018, 212, 1083–1094. [Google Scholar] [CrossRef]
- Xie, X.; Wang, Q.; Wu, N. Potential of a piezoelectric energy harvester from sea waves. J. Sound Vib. 2014, 333, 1421–1429. [Google Scholar] [CrossRef]
- Xie, X.; Wang, Q.; Wu, N. Energy harvesting from transverse ocean waves by a piezoelectric plate. Int. J. Eng. Sci. 2014, 81, 41–48. [Google Scholar] [CrossRef]
- Wu, N.; Wang, Q.; Xie, X. Ocean wave energy harvesting with a piezoelectric coupled buoy structure. Appl. Ocean Res. 2015, 50, 110–118. [Google Scholar] [CrossRef]
- Hwang, W.S.; Ahn, J.H.; Jeong, S.Y.; Jung, H.J.; Hong, S.K.; Choi, J.Y.; Cho, J.Y.; Kim, J.H.; Sung, T.H. Design of piezoelectric ocean-wave energy harvester using sway movement. Sens. Actuators A Phys. 2017, 260, 191–197. [Google Scholar] [CrossRef]
- Wu, N.; Wang, Q.; Xie, X. Wind energy harvesting with a piezoelectric harvester. Smart Mater. Struct. 2013, 22, 095023. [Google Scholar] [CrossRef]
- Hou, C.; Shan, X.; Zhang, A.; Song, R.; Yang, Z. Design and Modeling of a Magnetic-Coupling Monostable Piezoelectric Energy Harvester under Vortex-Induced Vibration. IEEE Access 2020, 8, 108913–108927. [Google Scholar] [CrossRef]
- Jia, J.; Shan, X.; Upadrashta, D.; Xie, T.; Yang, Y.; Song, R. An asymmetric bending-torsional piezoelectric energy harvester at low wind speed. Energy 2020, 198, 117287. [Google Scholar] [CrossRef]
- Shan, X.; Tian, H.; Xie, T. Energy Harvesting Performance of a Wing Panel for Aeroelastic Vibration. Int. J. Struct. Stab. Dyn. 2019, 19, 1950102. [Google Scholar] [CrossRef]
- Shan, X.; Tian, H.; Cao, G.; Xie, T. Enhancing Performance of a Piezoelectric Energy Harvester System for Concurrent Flutter and Vortex-Induced Vibration. Energies 2020, 13, 3101. [Google Scholar] [CrossRef]
- Kan, J.; Fan, C.; Wang, S.; Zhang, Z.; Wen, J.; Huang, L. Study on a piezo-windmill for energy harvesting. Renew. Energy 2016, 97, 210–217. [Google Scholar] [CrossRef]
- Fan, K.; Chang, J.; Chao, F.; Pedrycz, W. Design and development of a multipurpose piezoelectric energy harvester. Energy Convers. Manag. 2015, 96, 430–439. [Google Scholar] [CrossRef]
- Mei, X.; Zhou, S.; Yang, Z.; Kaizuka, T.; Nakano, K. A tri-stable energy harvester in rotational motion: Modeling, theoretical analyses and experiments. J. Sound Vib. 2020, 469, 115142. [Google Scholar] [CrossRef]
- Bao, B.; Chen, W.; Wang, Q. A piezoelectric hydro-energy harvester featuring a special container structure. Energy 2019, 189, 116261. [Google Scholar] [CrossRef]
- Bao, B.; Wang, Q. A rain energy harvester using a self-release tank. Mech. Syst. Signal Process. 2021, 147, 107099. [Google Scholar] [CrossRef]
- Li, K.; He, Q.; Wang, J.; Zhou, Z.; Li, X. Wearable energy harvesters generating electricity from low-frequency human limb movement. Microsyst. Nanoeng. 2018, 4, 24. [Google Scholar] [CrossRef] [PubMed]
- Fan, K.; Qu, H.; Wu, Y.; Wen, T.; Wang, F. Design and development of a rotational energy harvester for ultralow frequency vibrations and irregular human motions. Renew. Energy 2020, 156, 1028–1039. [Google Scholar] [CrossRef]
- Zhang, G.; Li, M.; Li, H.; Wang, Q.; Jiang, Q. Harvesting Energy from Human Activity: Ferroelectric Energy Harvesters for Portable. Implantable, and Biomedical Electronics. Energy Technol. 2018, 6, 791–812. [Google Scholar] [CrossRef]
- George, A.; Moline, D.; Wagner, J. A mobile energy harvesting autowinder-Build and test. Renew. Energy 2020, 146, 2659–2667. [Google Scholar] [CrossRef]
- Izadgoshasb, I.; Lin, Y.Y.; Tang, L.H.; Padilla, R.V.; Tang, Z.S.; Sedighi, M. Improving efficiency of piezoelectric based energy harvesting from human motions using double pendulum system. Energy Convers. Manag. 2019, 84, 559–570. [Google Scholar] [CrossRef]
- Xie, X.; Carpinteri, A.; Wang, Q. A theoretical model for a piezoelectric energy harvester with a tapered shape. Eng. Struct. 2017, 144, 19–25. [Google Scholar] [CrossRef]
- Xie, X.; Wang, Q. A study on a high efficient cylinder composite piezoelectric energy harvester. Compos. Struct. 2017, 161, 237–245. [Google Scholar] [CrossRef]
- Xie, X.; Wang, Q. A study on an ocean wave energy harvester made of a composite piezoelectric buoy structure. Compos. Struct. 2017, 178, 447–454. [Google Scholar] [CrossRef]
- Zhang, J.; Xie, X.; Song, G.; Du, G.; Liu, D. A study on a near-shore cantilevered sea wave energy harvester with a variable cross section. Energy Sci. Eng. 2019, 7, 3174–3185. [Google Scholar] [CrossRef]
- Keshmiri, A.; Wu, N.; Wang, Q. A new nonlinearly tapered FGM piezoelectric energy harvester. Eng. Struct. 2018, 173, 52–60. [Google Scholar] [CrossRef]
- Xie, X.; Wang, Q.; Wu, N. A ring piezoelectric energy harvester excited by magnetic forces. Int. J. Eng. Sci. 2014, 77, 71–78. [Google Scholar] [CrossRef]
- Xie, X.; Wang, Q. Energy harvesting from a vehicle suspension system. Energy 2015, 86, 385–392. [Google Scholar] [CrossRef]
- Xie, X.; Wang, Q. A mathematical model for piezoelectric ring energy harvesting technology from vehicle tires. Int. J. Eng. Sci. 2015, 94, 113–127. [Google Scholar] [CrossRef]
- Xie, X.; Wang, Q.; Wang, S. Energy harvesting from high-rise buildings by a piezoelectric harvester device. Energy 2015, 93, 1345–1352. [Google Scholar] [CrossRef]
- Xie, X.; Wang, Q. Design of a piezoelectric harvester fixed under the roof of a high-rise building. Eng. Struct. 2016, 117, 1–9. [Google Scholar] [CrossRef]
- Viet, N.V.; Xie, X.; Lie, K.; Banthia, N.; Wang, Q. Energy harvesting from ocean waves by a floating energy harvester. Energy 2016, 112, 1219–1226. [Google Scholar] [CrossRef]
- Viet, N.V.; Wang, Q. Ocean wave energy pitching harvester with a frequency tuning capability. Energy 2018, 162, 603–617. [Google Scholar] [CrossRef]
- Delibas, B.; Koc, B. L1B2 Piezo Motor Using D33 Effect. In Proceedings of the ACTUATOR, 16th International Conference on New Actuators, Bremen, Germany, 25–27 June 2018; pp. 1–4. [Google Scholar]
- Randall, C.A.; Kelnberger, A.; Yang, G.Y.; Eitel, R.E.; Shrout, T.R. High Strain Piezoelectric Multilayer Actuators—A Material Science and Engineering Challenge. J. Electroceram. 2005, 14, 177–191. [Google Scholar] [CrossRef]
- Wischnewski, M.; Delibas, B.; Wischnewski, A. Piezoelectric motor operated both in resonance and DC modes. In Proceedings of the ACTUATOR, International Conference and Exhibition on New Actuator Systems and Applications, Online, 17–19 February 2021; pp. 1–4. [Google Scholar]
- Kim, K.B.; Cho, J.Y.; Jabbar, H.; Ahn, J.H.; Hong, S.D.; Woo, S.B.; Sung, T.H. Optimized composite piezoelectric energy harvesting floor tile for smart home energy management. Energy Convers. Manag. 2018, 171, 31–37. [Google Scholar] [CrossRef]
- Liu, H.; Hua, R.; Lu, Y.; Wang, Y.; Salman, E.; Liang, J. Boosting the efficiency of a footstep piezoelectric-stack energy harvester using the synchronized switch technology. J. Intell. Mater. Syst. Struct. 2019, 30, 813–822. [Google Scholar] [CrossRef]
- Qian, F.; Xu, T.; Zuo, L. Design, optimization, modeling and testing of a piezoelectric footwear energy harvester. Energy Convers. Manag. 2018, 171, 1352–1364. [Google Scholar] [CrossRef]
- Qian, F.; Xu, T.; Zuo, L. Material equivalence, modeling and experimental validation of a piezoelectric boot energy harvester. Smart Mater. Struct. 2019, 28, 075018. [Google Scholar] [CrossRef]
- Kuang, Y.; Daniels, A.; Zhu, M. A sandwiched piezoelectric transducer with flex end-caps for energy harvesting in large force environments. J. Phys. D Appl. Phys. 2017, 50, 345501. [Google Scholar] [CrossRef]
- Cha, Y.; Seo, J. Energy harvesting from a piezoelectric slipper during walking. J. Intell. Mater. Syst. Struct. 2017, 29, 1456–1463. [Google Scholar] [CrossRef]
- Hu, X.; Li, Y.; Xie, X. A study on a U-shaped piezoelectric coupled beam and its corresponding ingenious harvester. Energy 2019, 185, 938–950. [Google Scholar] [CrossRef]
- Xie, X.; Wang, Z.; Liu, D.; Du, G.; Zhang, J. An experimental study on a novel cylinder harvester made of L-shaped piezoelectric coupled beams with a high efficiency. Energy 2020, 212, 118572. [Google Scholar] [CrossRef]
- Xie, X.; Zhang, J.; Wang, Z.; Song, G. An experimental study on a high-efficient multifunctional U-shaped piezoelectric coupled beam. Energy Convers. Manag. 2020, 224, 113330. [Google Scholar] [CrossRef]
- Sun, S.; Peter, W. Modeling of a horizontal asymmetric U-shaped vibration-based piezoelectric energy harvester (U-VPEH). Mech. Syst. Signal Process. 2019, 114, 467–485. [Google Scholar] [CrossRef]
- Cao, D.; Duan, X.; Guo, X.; Lai, S. Design and performance enhancement of a force-amplified piezoelectric stack energy harvester under pressure fluctuations in hydraulic pipeline systems. Sens. Actuators A Phys. 2020, 309, 112031. [Google Scholar] [CrossRef]
- Yang, Z.; Zu, J.; Luo, J.; Peng, Y. Modeling and parametric study of a force-amplified compressive-mode piezoelectric energy harvester. J. Intell. Mater. Syst. Struct. 2017, 28, 357–366. [Google Scholar] [CrossRef]


| Parameters | Substrate Beam | Piezoelectric Patches (PZT4) |
|---|---|---|
| L (mm) | 19.5 | |
| A (mm) | 7 | |
| t1 (mm) | 1.5 | |
| t2 (mm) | 5 | |
| t3 (mm) | 4 | |
| lp (mm) | 50 | |
| tp (mm) | 1 | |
| Young’s modulus E (GPa) | 72 | 75.1~77.3 |
| Mass density (kg/m3) | 2742 | 7640~7683 |
| C (nF) | 42.4~43.5 | |
| d31(pC/N) | 615~623 |
| Amplitude of Footstep Excitation/N | 250 | 300 | 350 | 400 | 450 | 500 | |
|---|---|---|---|---|---|---|---|
| 1#1 unimorph | 19.5 mm | 32 | 41 | 54 | 61 | 68 | 77 |
| 26.5 mm | 60 | 81 | 96 | 107 | 117 | 131 | |
| 33.5 mm | 118 | 133 | 155 | 167 | 183 | 198 | |
| 2#1 unimorph | 19.5 mm | 40 | 76 | 101 | 131 | 153 | 165 |
| 26.5 mm | 94 | 130 | 164 | 196 | 217 | 238 | |
| 33.5 mm | 170 | 219 | 261 | 304 | 331 | 355 | |
| Force Arm | L = 19.5 mm | L = 26.5 mm | L = 33.5 mm | |||
|---|---|---|---|---|---|---|
| 2#1 | 4.62 mW | 444.4 KΩ | 10.68 mW | 411.8 KΩ | 24.11 mW | 375 KΩ |
| 2#2 | 4.16 mW | 444.4 KΩ | 9.93 mW | 411.8 KΩ | 22.18 mW | 375 KΩ |
| 2#3 | 5.18 mW | 444.4 KΩ | 12.36 mW | 411.8 KΩ | 25.35 mW | 375 KΩ |
| 2#4 | 4.81 mW | 444.4 KΩ | 11.68 mW | 411.8 KΩ | 24.51 mW | 375 KΩ |
| Peak-to-Peak Voltages | Maximum Average Powers | Optimal Load Resistance | ||
|---|---|---|---|---|
| 2 Hz | 2#1 | 362 V | 89.47 mW | 230.77 kΩ |
| 2#3 | 376 V | 94.72 mW | 230.77 kΩ | |
| 1 Hz | 2#1 | 355 V | 41.23 mW | 333.33 kΩ |
| 2#3 | 363 V | 43.65 mW | 333.33 kΩ | |
| Piezoelectric Harvesters | Maximum Average Power Density |
|---|---|
| Piezoelectric brick in this research | 37.39 μW/mm3 |
| Footstep harvester [49] | 1.6 μW/mm3 |
| Footwear harvester [51] | 3.9 μW/mm3 |
| L-shaped harvester [55] | 2.1 μW/mm3 |
| U-shaped harvester [56] | 28.1 μW/mm3 |
| Substrate Material | Young’s Modulus (GPa) | Mass Density (kg/m3) | Maximum RMS of Voltage (V) | Maximum Average Power (mW) |
|---|---|---|---|---|
| Spring steel | 210 | 7820 | 48 | 11.39 |
| Aluminum alloy | 72 | 2742 | 53 | 13.24 |
| Babbitt metal | 58.8 | 7170 | 58 | 16.01 |
Publisher’s Note: MDPI stays neutral with regard to jurisdictional claims in published maps and institutional affiliations. |
© 2021 by the authors. Licensee MDPI, Basel, Switzerland. This article is an open access article distributed under the terms and conditions of the Creative Commons Attribution (CC BY) license (https://creativecommons.org/licenses/by/4.0/).
Share and Cite
Wang, Z.; Xie, X.; Zhang, J.; Du, G. An Experimental Study on Efficient Piezoelectric Coupled Beams and Corresponding Piezoelectric Bricks. Appl. Sci. 2021, 11, 11504. https://doi.org/10.3390/app112311504
Wang Z, Xie X, Zhang J, Du G. An Experimental Study on Efficient Piezoelectric Coupled Beams and Corresponding Piezoelectric Bricks. Applied Sciences. 2021; 11(23):11504. https://doi.org/10.3390/app112311504
Chicago/Turabian StyleWang, Zijing, Xiangdong Xie, Jinfeng Zhang, and Guofeng Du. 2021. "An Experimental Study on Efficient Piezoelectric Coupled Beams and Corresponding Piezoelectric Bricks" Applied Sciences 11, no. 23: 11504. https://doi.org/10.3390/app112311504
APA StyleWang, Z., Xie, X., Zhang, J., & Du, G. (2021). An Experimental Study on Efficient Piezoelectric Coupled Beams and Corresponding Piezoelectric Bricks. Applied Sciences, 11(23), 11504. https://doi.org/10.3390/app112311504