Article

Novel Modelling Approach for Obtaining the Parameters of Low Ionosphere under Extreme Radiation in X-Spectral Range

by
Vladimir A. Srećković
1,*,
Desanka M. Šulić
2,
Veljko Vujčić
3,
Zoran R. Mijić
1 and
Ljubinko M. Ignjatović
1
1
Institute of Physics Belgrade, University of Belgrade, Pregrevica 118, 11080 Belgrade, Serbia
2
Faculty of Ecology and Environmental Protection, University Union—Nikola Tesla, 11000 Belgrade, Serbia
3
Astronomical Observatory, Volgina 7, 11060 Belgrade, Serbia
*
Author to whom correspondence should be addressed.
Appl. Sci. 2021, 11(23), 11574; https://doi.org/10.3390/app112311574
Submission received: 20 October 2021 / Revised: 19 November 2021 / Accepted: 1 December 2021 / Published: 6 December 2021

Abstract

:
Strong radiation from solar X-ray flares can produce increased ionization in the terrestrial D-region and change its structure. Moreover, extreme solar radiation in X-spectral range can create sudden ionospheric disturbances and can consequently affect devices on the terrain as well as signals from satellites and presumably cause numerous uncontrollable catastrophic events. One of the techniques for detection and analysis of solar flares is studying the variations in time of specific spectral lines. The aim of this work is to present our study of solar X-ray flare effects on D-region using very low-frequency radio signal measurements over a long path in parallel with the analysis of X-spectral radiation, and to obtain the atmospheric parameters (sharpness, reflection height, time delay). We introduce a novel modelling approach and give D-region coefficients needed for modelling this medium, as well as a simple expression for electron density of lower ionosphere plasmas. We provide the analysis and software on GitHub.

1. Introduction

Solar flares (SFs) are giant eruptions on the surface of the Sun [1,2] that release huge amounts of electromagnetic energy over the whole electromagnetic spectrum [3,4,5,6,7]. Levels of photoionization processes in the ionosphere depend on plasma composition along with radiation spectral ranges at specific altitudes [8]. Information on certain solar spectral lines could be of importance in research of solar flares [9,10]. The enhanced Extreme Ultraviolet (EUV) radiation is absorbed at higher terrestrial altitudes additionally ionizing E and F regions of the ionosphere [11]. In addition, Lyman-alpha and X-rays penetrate more deeply into the ionosphere, reaching the D-region and causing enhanced ionization and absorption of electromagnetic (EM) waves there [12,13,14]. Solar flares can be classified into different classes based on their peak emission in the X-ray 0.1–0.8 nm spectral range as B (≥10−7 Wm−2), C (≥10−6 Wm−2), M (≥10−5 Wm−2), and X (≥10−4 Wm−2) classes [15,16,17].
The abrupt increase in X-radiation and EUV emission following solar flares causes additional ionization and increased absorption of EM waves in the sunlit part of the Earth’s ionosphere. At the time of SFs and consequently during sudden ionospheric disturbances (SIDs), the gain of the atmosphere electron density at all heights is noticeable [18,19]. As a consequence of radiation influence, SFs create SIDs and induce disturbance in the monitored amplitude and phase of Very Low-Frequency (VLF in narrow band 3–30 kHz) radio signals, primarily in the D layer, which is located between the Earth’s lower atmosphere, which has dense air, and its strongly conducting ionosphere [20,21]. These events of X-ray SFs have been monitored by Geostationary Operational Environmental Satellite (GOES) [15].
In this paper we will focus on the VLF technique—on amplitude and phase signals of worldwide transmitters of signals monitored by BEL VLF system (Belgrade, Serbia) [22]. VLF signals from the emitters located all over the world are continuously recorded by the BEL system. Events of X-ray SFs monitored by GOES satellites are further identified using a radio station’s system of receivers. For these events, VLF wave enhancements are measured and analysed for the daytime atmosphere. In continuation of our previous research, the aim of this contribution is to present our study of solar X-ray flare effects and to obtain the daytime atmospheric parameters and ionization rate induced by this extreme radiation, and to provide a simple equation for altitude-dependent electron density of D-region plasma which depends on X-ray spectral intensity and sluggishness of the medium. Finally, we discuss how the approximately obtained altitude-dependent electron density relies on the shape of X-ray flux. The python scripts for calculating ionosphere parameters can be found on GitHub: https://github.com/sambolino/flarED (accessed on 17 October 2021).
The text is organized as follows: Section 2 briefly presents methods for observing the D-region and introduces a methodology. Section 3 provides the details of numerical results, analyses, and introduces a simple expression of electron density of the D-region. In Section 4 the results are discussed together with further directions of research.

2. SFs Impact

We have studied the VLF amplitude (A) and phase (P), acquired by recording VLF radio signals broadcast by NAA transmitter at Maine, USA (44.63° N, 67.28° W) during solar-induced SIDs. The data were recorded by Belgrade VLF system (44.85° N, 20.38° E). The BEL stations can synchronously record several radio signals broadcast by different transmitters. The technicalities and description of the BEL VLF system are presented in [22]. The NAA-BEL path is sufficiently long (6540 km) and correctly oriented west–east.
Here, we present the study of SIDs induced by the large SFs of solar cycles 24 and 25. The acquisition and research of VLF signals has been carried out together with the investigation of the corresponding X-ray fluxes obtained from GOES. In this research, the registered data of incoming solar radiation X-ray flux in the XRS spectral range of 0.1–0.8 nm are of primary interest.

2.1. Monitoring SF

We have studied the amplitude and phase data, obtained by monitoring VLF radio signals emitted by NAA/24.00 kHz transmitter during solar-induced SIDs. During SIDs, a regular method for signal examination and the determination of ionospheric parameters rely on the comparison between the registered variation of amplitude and phase and the matching values acquired with simulations by the Long-Wave Propagation Capability (LWPC) numerical software package [23,24], as explained in [20,25,26].
As an instructive example of a monitored active day, we present 7 September 2017 (see Figure 1). Three M-class solar flares erupted from sunspot AR2673 of magnitudes M2.4, M1.5, and M7.3, followed by a huge X1.3-class SF. Energy and particulates hurled at the Earth while the proton flux velocity was two times greater than normal. The aurora borealis was also seen.
In Figure 1 we present measured amplitude (lower panel) and phase (upper panel) for NAA/24.00 kHz signal on high solar activity during M1.5 (Ix = 1.5 × 10⁻⁵, Wm−2 at peak time, 09:54 UT), M7.3 (10:15 UT), C3 (12:14 UT) and X1.3 (14:36 UT) events on 7 September 2017 as a function of time. There were visible changes in the VLF daily signal during the C, M and X flares (see signal peaks on panels). From Figure 1, one can see that these VLF and GOES peaks during the daytime happened almost simultaneously (with a time delay of the order of minutes).
In this work we have calculated the amplitude increase ΔArec, defined as the difference between the maximum amplitude Amax registered during the flare and the regular amplitude during quiet condition Aquiet as:
Δ A r e c = A max A q u i e t
In the same way, phase delay increase ΔPrec has been calculated as:
Δ P r e c = P max P q u i e t
The time delay Δt can be defined as: Δt = tAmaxtImax where tAmax is the time of maximum of VLF amplitude Amax and tImax is time of maximum of X-ray irradiance Imax [20]. The time delay is nearly similar to the D-region sluggishness [13] and is an important quantity that can be used to study the ionospheric response to the flares [27]. The quantity Δt depends on flare intensity and other factors, and usually takes values of about a few minutes [16,27].
For the representative quiet days, i.e., conditions, we have chosen the days under low solar activity. The conditions were that the daylight maximum of X-ray flux had to be lower than 10−6 Wm−2 in the 0.1–0.8 nm XL band.

2.2. Used Numerical Methods

2.2.1. Two-Component Exponential Model and Simulations

The daytime two-parameter exponential profile of electron density can be used for VLF modelling [28] and is given by:
N e ( h , H , β ) = 1.43 · 10 13 exp ( 0.15 · H ) exp [ ( β 0.15 ) · ( h H ) ]   [ m 3 ] .
Here, β in km−1 is a time-dependent parameter of sharpness, H′ is a reflection height in km, and h is the height in kilometres above surface.
During SIDs, a regular method for the obtaining of ionospheric parameters is based on comparison of the registered variation of amplitude and phase (Equations (1) and (2)) with the equal values obtained in computation by the LWPC software [23] as interpreted in [20,25,26]. Ne can be obtained from the measured amplitude and phase changes by a trial-and-error method where density profile is modified until the LWPC computed amplitude and phase match with monitored data (see, e.g., [22]). Thus, the obtained parameters β and H′ can be applied for further calculation and simulations (Equation (3), etc.).

2.2.2. FlarED’ Method

In [29], i.e., GitHub: https://github.com/sambolino/flarED (accessed on 17 October 2021), the database is created with SID VLF data (ΔArec, ΔPrec ) parameters, sharpness β and reflection height H′ for different values of Ix, i.e., different classes of solar flares (during the period of ascending phase and maximum of the solar cycle 24 and 25). Solar flares are monitored and analysed by VLF technique and ΔArec, ΔPrec while parameters β and H′ in database are obtained by the method described in [20]. The python scripts for calculating ionosphere parameters can be found https://github.com/sambolino/flarED (accessed on 19 September 2021). For the input values of solar X-ray flux, parameters β and H′ can be evaluated and altitude values of electron density for the low terrestrial ionosphere can be calculated. Users can easily calculate time series and hight profile of electron density. The results, i.e., data, can be plotted and exported in csv.

2.2.3. Approximate Analytic Expression

In order to create an easier and more adequate use of results and data, we give an electron density specially modified simple logarithmic second-degree polynomial expression, with height-dependent coefficients taking into account the delay time of the ionosphere response. The python scripts for calculating electron density by this specially modified expression can be found at https://github.com/sambolino/flarED (accessed on 10 October 2021). Additionally, for details see Section 3.2.

3. Results and Discussion

3.1. Analyses of SF Events

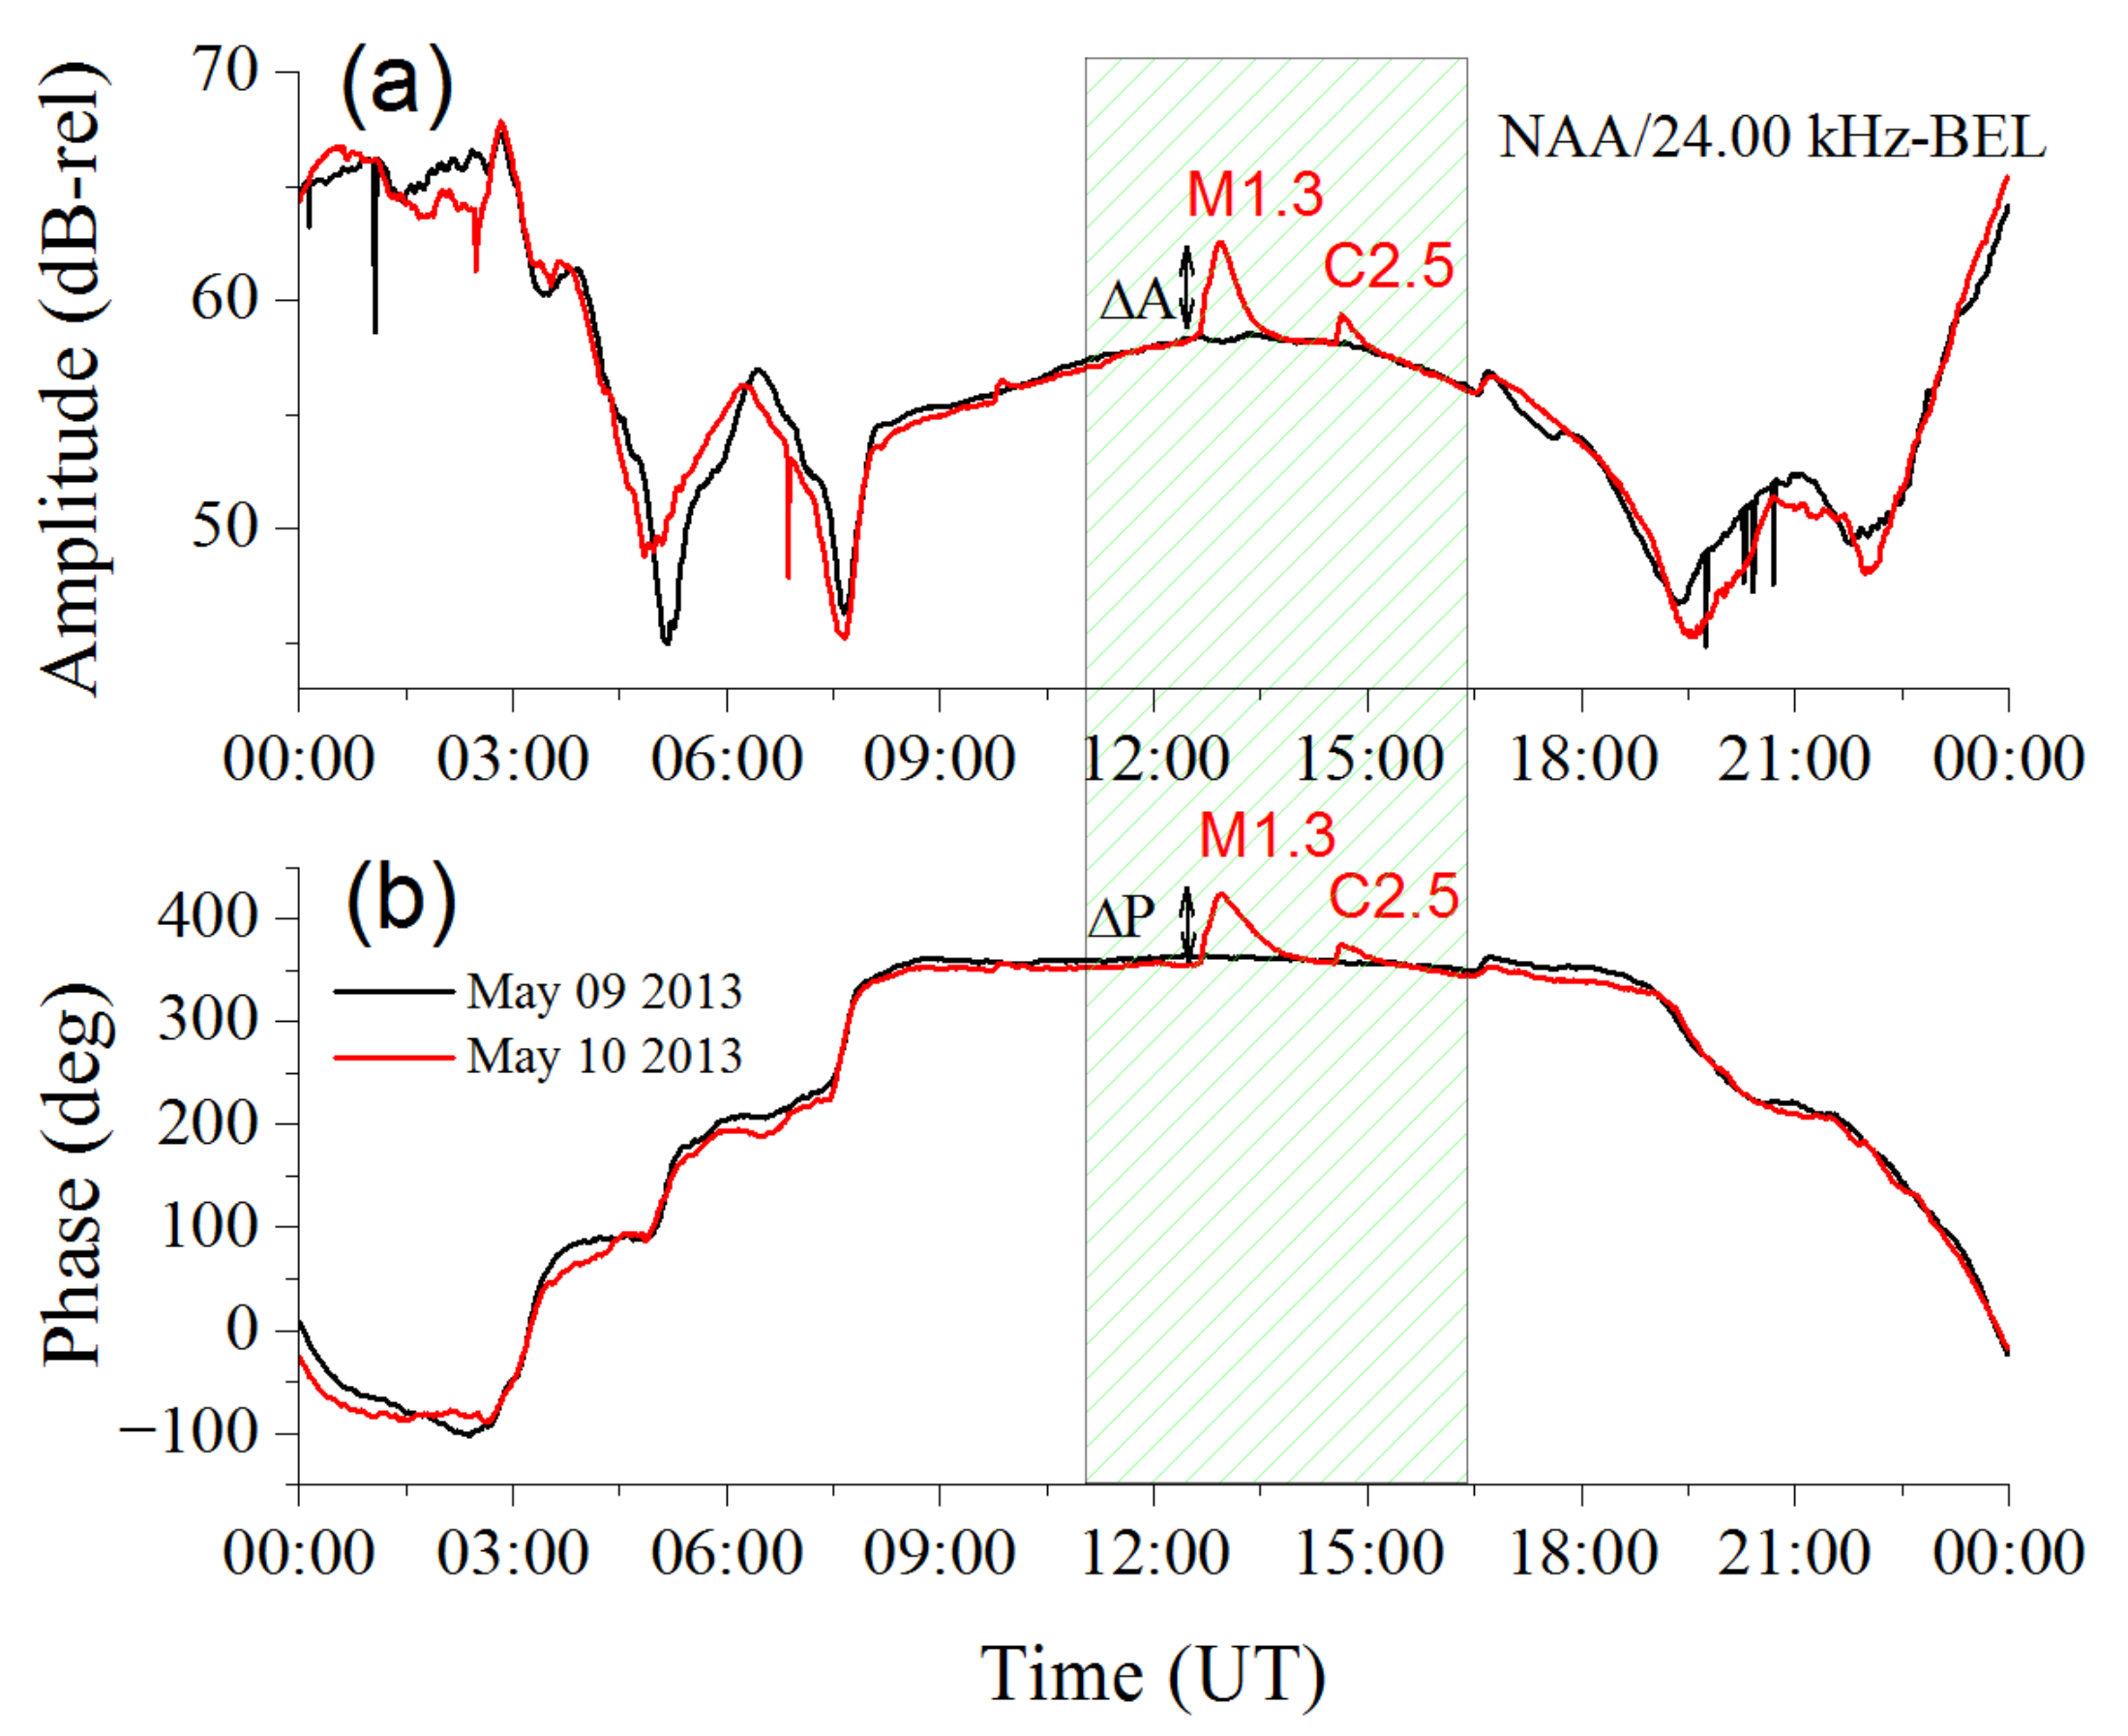
An example of flare-induced phase and amplitude perturbations, measured for the NAA/24.00 kHz signal on an active day of 10 May 2013, is given in Figure 2 (red lines on both panels). The unperturbed daytime values of phase and amplitude were measured on 9 May 2013 (black lines on both panels in Figure 2). There were visible changes in the VLF daily signal during the duration of M1.3 SF (peak time, 12:56 UT) and C2.5 SF (peak time, 14:37 UT).
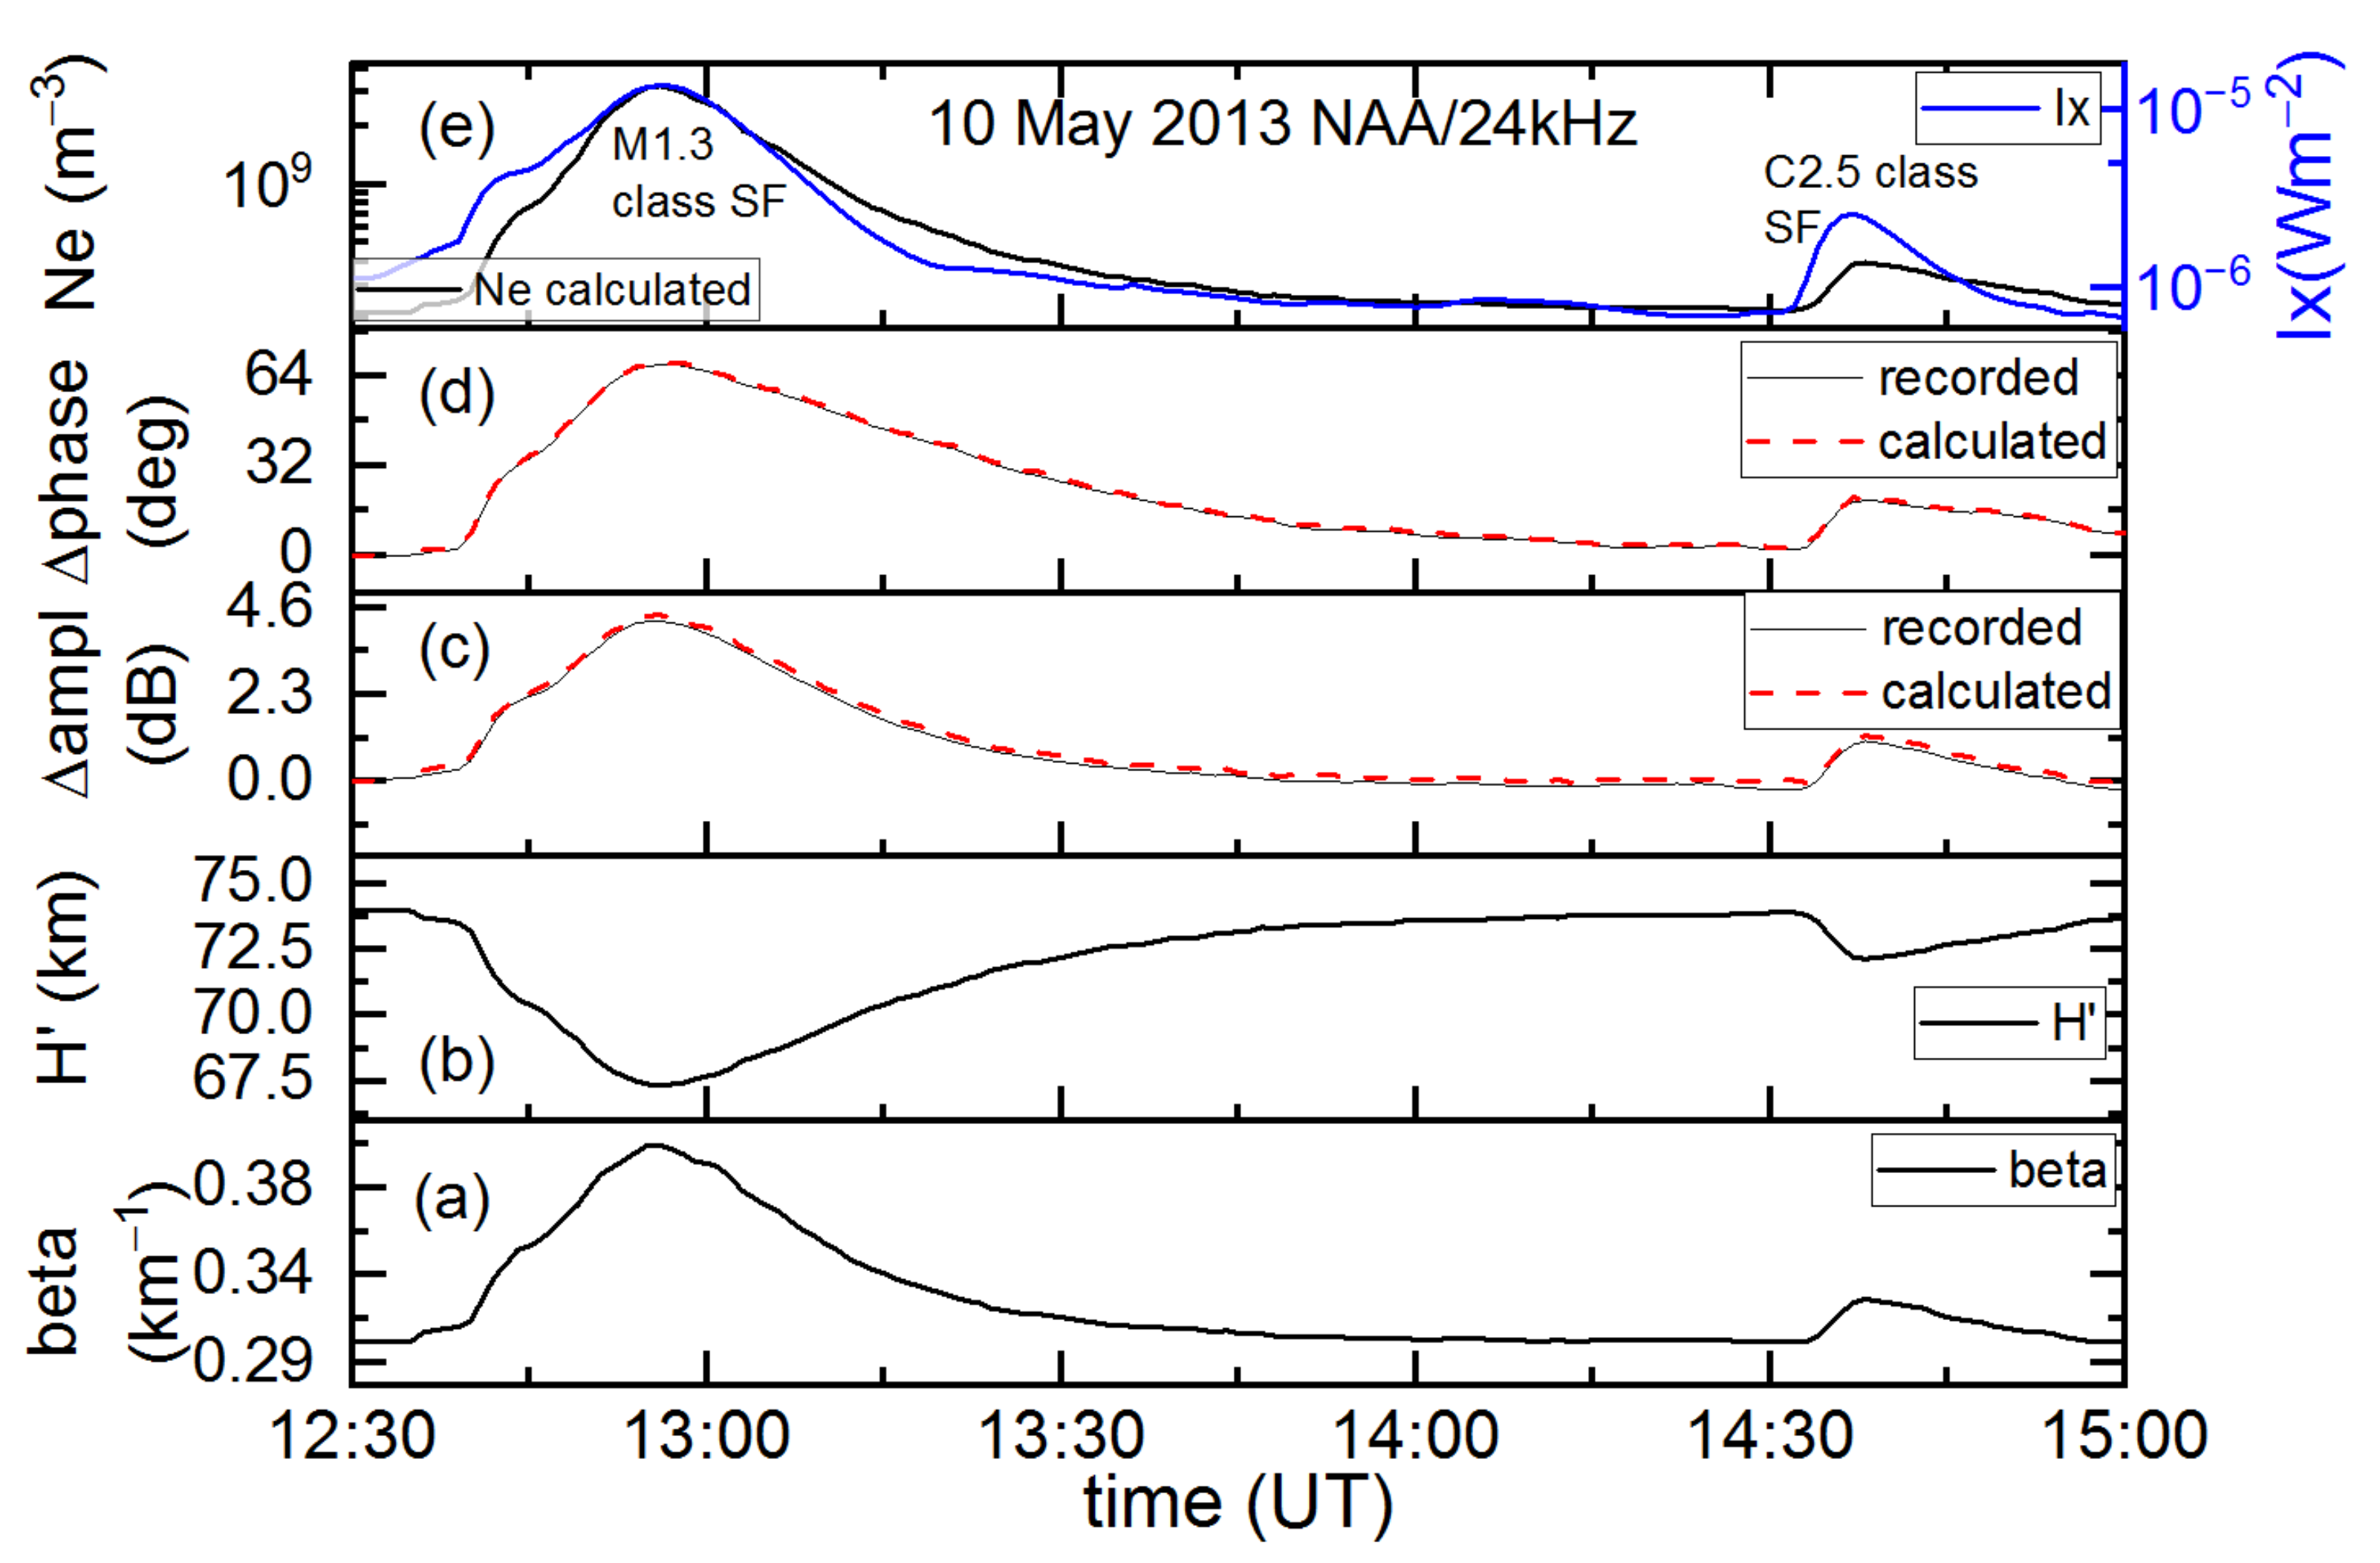
One can see visible variations in amplitude and phase. SID VLF changes at the time of the maximum of SF of M1.3 and C2.5 SF classes are ΔA = 4.2 dB, ΔP = 68.19 deg and ΔA = 1.06 dB, ΔP = 19.20 deg, respectively (see Table 1 and Figure 3c,d). It can be seen that during SF class C, amplitude and phase disturbances are not well defined, but are still noticeable.
Figure 3 shows simultaneous variations of the sharpness β, effective reflection height H′, amplitude and phase (recorded and simulated), electron density at reference height (74 km) and X-ray flux, during the occurrence of two successive flares on 10 May 2013 from Figure 3a–e, respectively.
For the period around SFs on 10 May 2013, we have calculated the time-dependent H′ and β parameters as shown in Figure 3a,b. During M1.3- and C2.5-class SFs on 10 May 2013, the change of H′ with time has normal behaviour. After the start of the SFs it falls to a minimum, and after X-ray peak it keeps growing to a preflare value. Sharpness behaviour is connected with form of registered increase of VLF amplitude, i.e., β rises sharply to a maximum, and after the peak of X-ray flux it drops to a preflare value. At 12:56 UT, i.e., at peak time of the M1.3-class SF, with Ix = 1.36·10−5 Wm−2, H′ decreases to a value of 67 km and the β rises to 0.41 km−1. At C2.5-class SF peak time (14:37 UT) with Ix = 2.59·10−6 Wm−2 the H′ decreases to 72 km and the β increase to 0.32 km−1. It can be noted that the reflection height and the sharpness are in correlation with X-ray flux shape.
Figure 4 shows the height profile, i.e., vertical electron-density profile before, after and during the M1.3- and C2.5-class solar flares that occurred on 10 May 2013. Electron-density altitude profile changes describe the variation of ionization at the D layer due to SF events and are relevant for mapping the low ionosphere [30,31] and moreover are important for checking the validity of the method and results [32] as shown in many examples. For unperturbed (preflare) ionospheric conditions (blue line) and post flare, there is a moderate increment in Ne (from 2.8·107 m−3 at h = 60 km height, to 6.7·108 m−3 at the upper part of this region, i.e., at h = 80 km). These lines have almost the same behaviour. Completely different slope and behaviour have black and dashed dotted–dotted pink lines at peak times of M- and C-class SFs with increment from ~7·107 m−3 at 60 km height to 1.6·1010 m−3 and 4·109 m−3, respectively. It can be noted that the electron density profiles moved to higher electron densities with different slopes when compared to the density profile of the preflare ionospheric condition. These changes in altitude profile of electron density are important for the nature of VLF propagation.
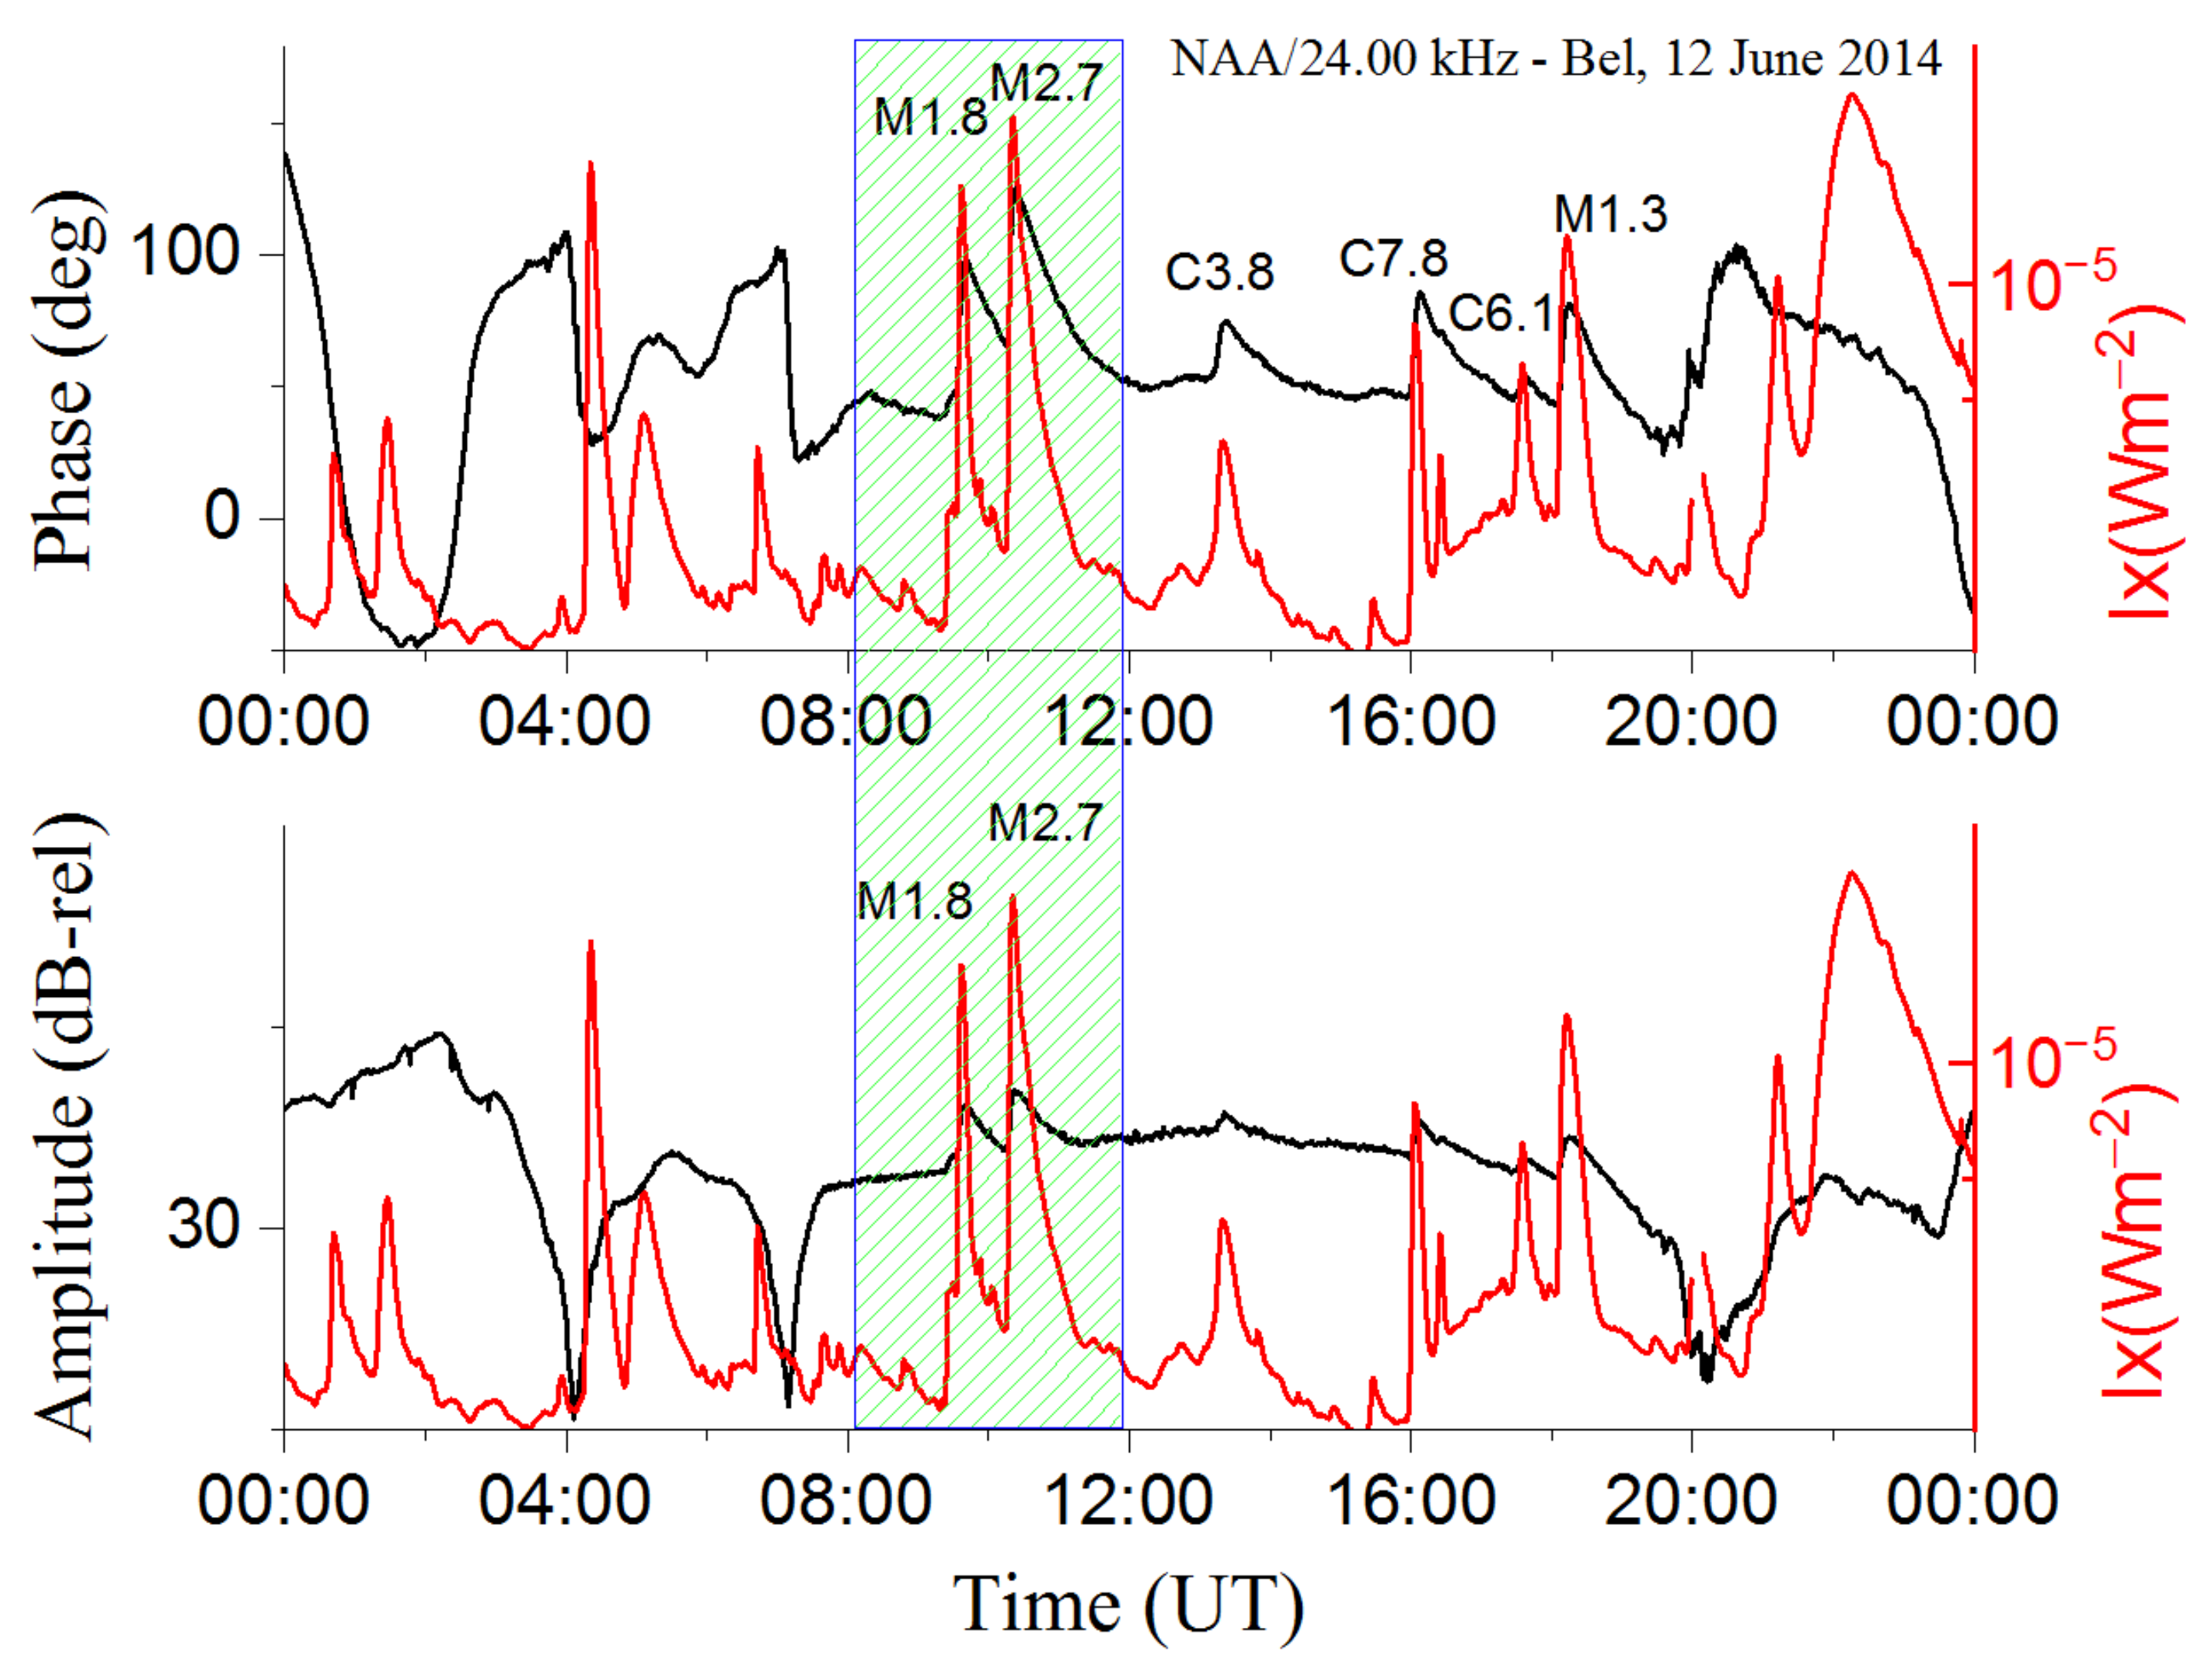
X-ray flux, amplitude, and phase of NAA/24.00 kHz radio signal as a function of UT during strong M-class successive SF on 12 June 2014 is presented in Figure 5. The lower panel shows perturbation of amplitude and X-ray flux, and in the upper panel perturbation of phase and X-ray flux is presented. We analysed two successive M-class solar flares (M1.8 with peak time 09:37 UT and M2.7 with peak time 10:21 UT). There were visible changes in the VLF daily signal during the duration of M1.8 SF and M2.7 SF. SID amplitude and phase changes at the peak time of SF of M1.8 and M2.7 SF classes are ΔA = 4.5 dB, ΔP = 51.47 deg and ΔA = 5.72 dB, ΔP = 83.01 deg, respectively (see Table 1 and Figure 6c,d).
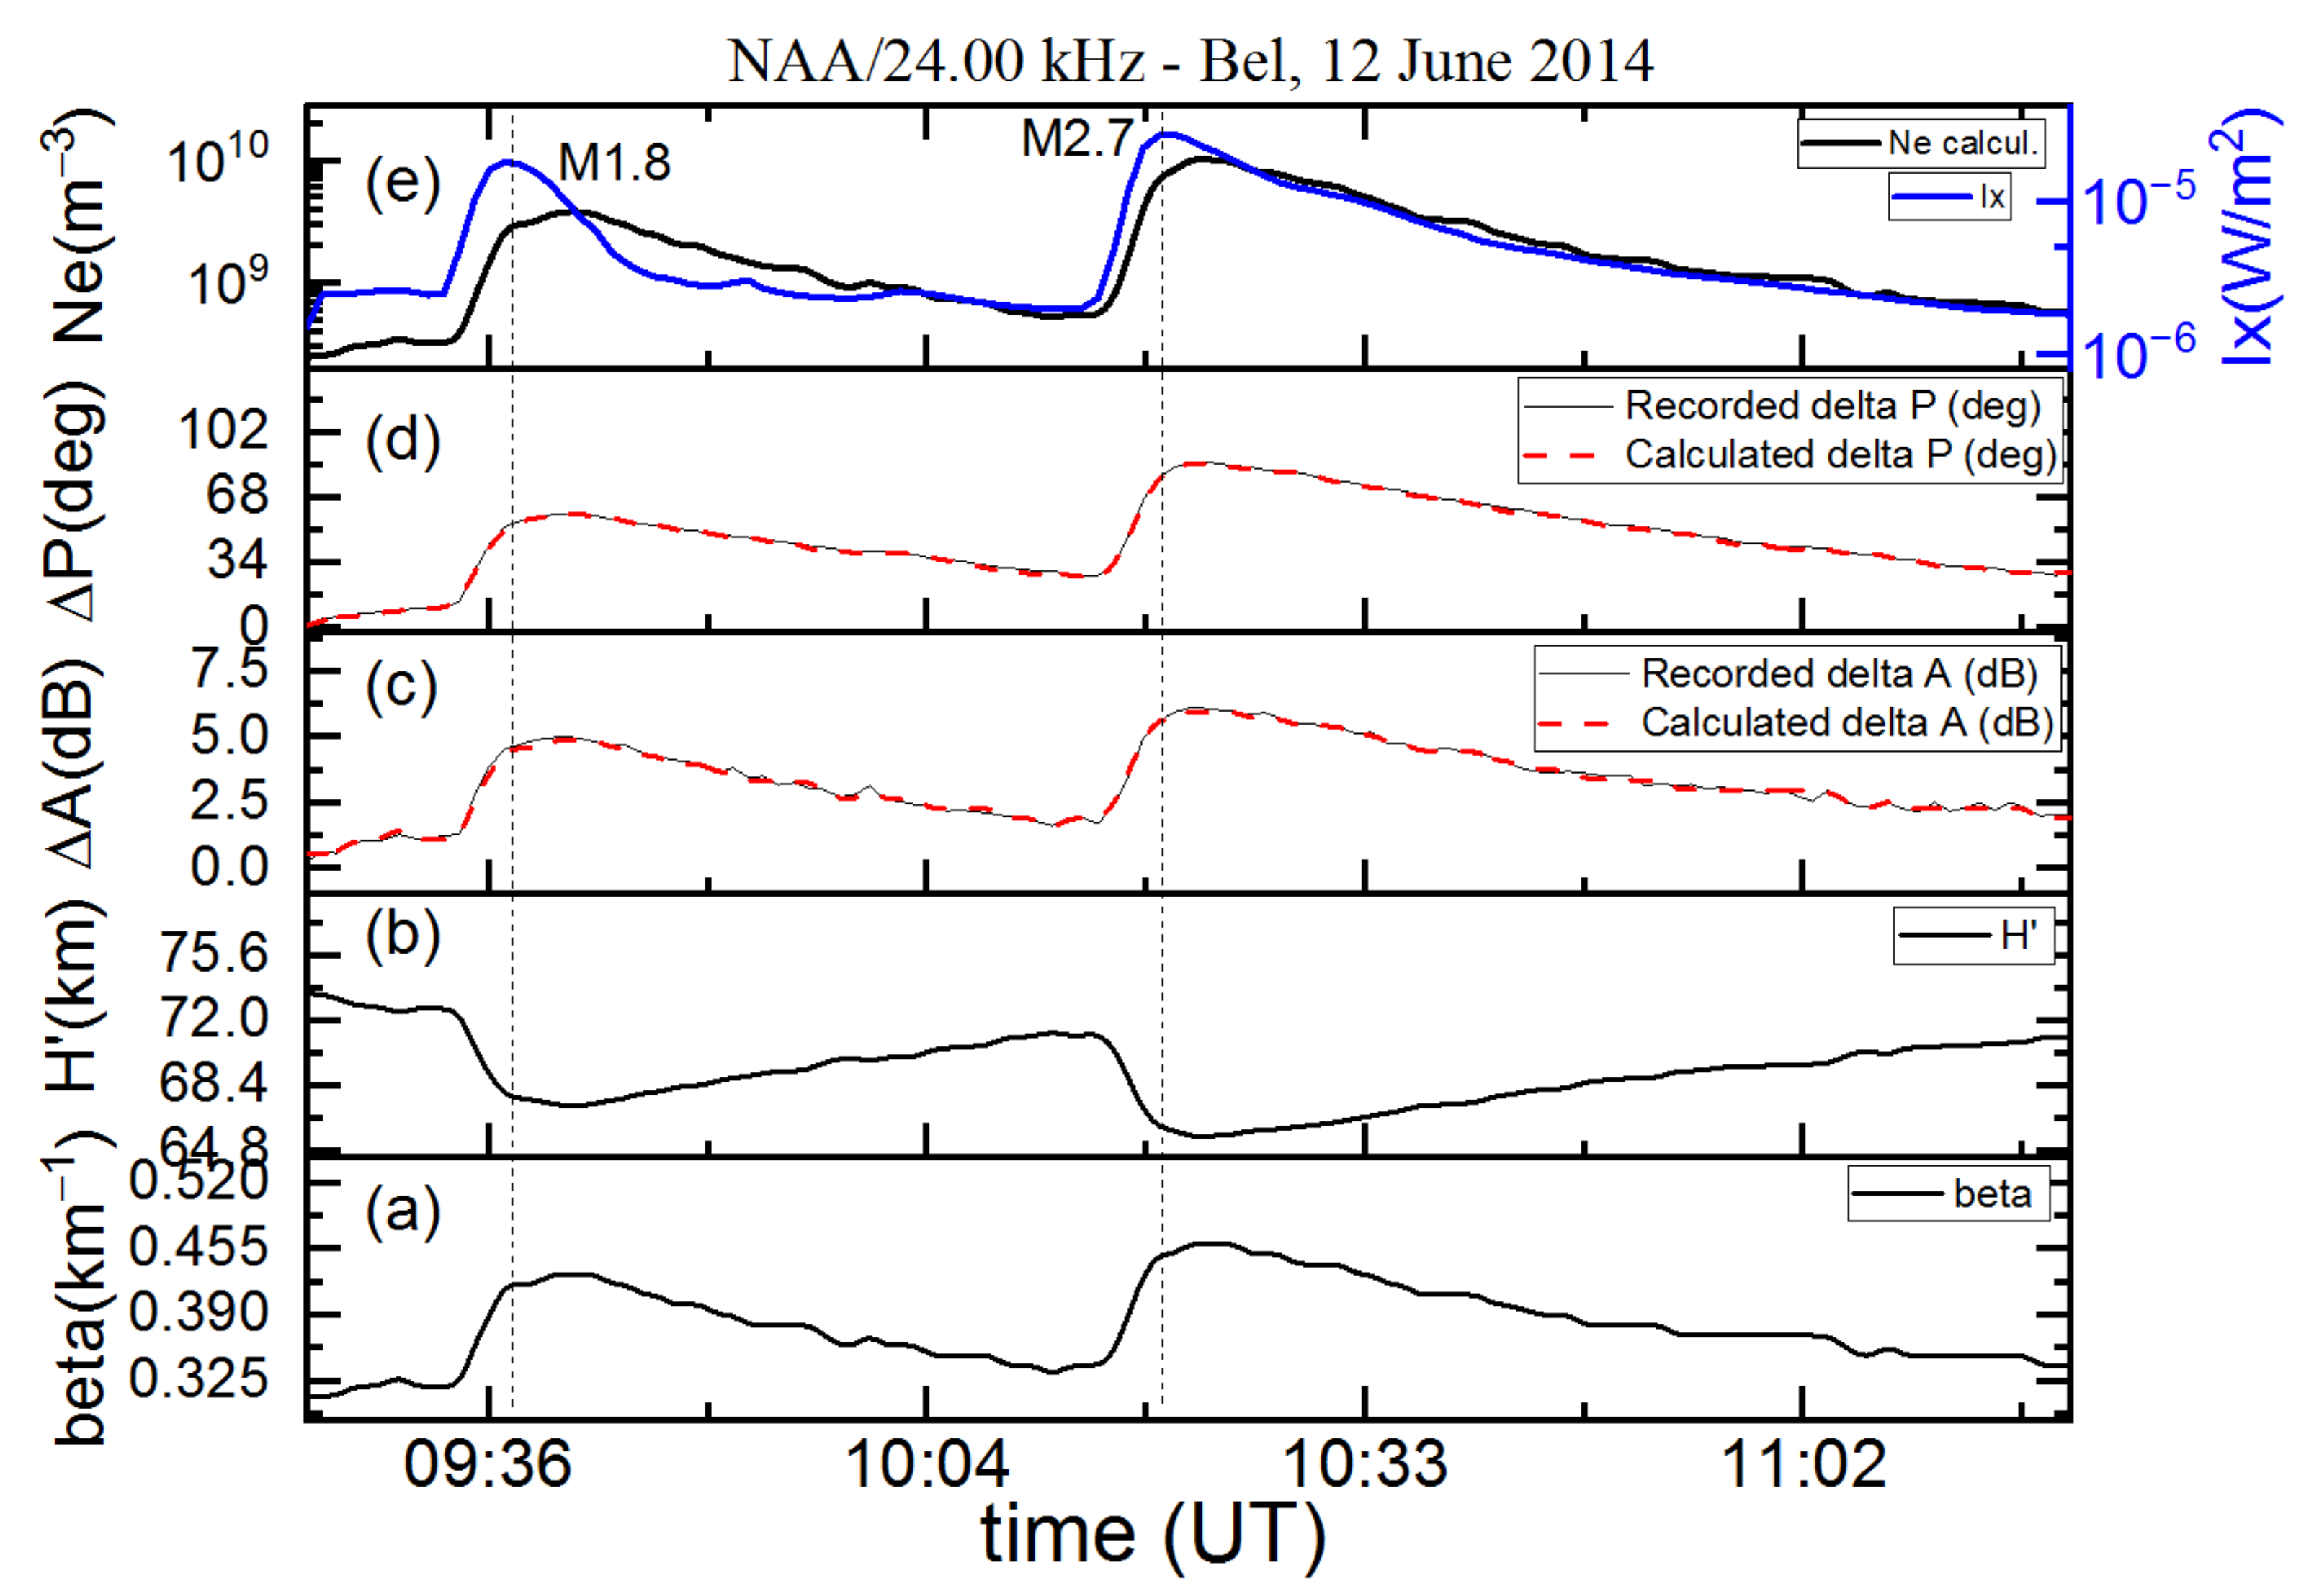
Sharpness β, effective reflection height H′, amplitude and phase of VLF signals (recorded and simulated), electron density at reference height, and X-ray flux during the presence of two M flares on 12 June 2014 are presented in Figure 6 on the upper to lower panels, respectively.
For the period around SF on 12 June 2014, we have calculated the time-dependent effective reflection height and sharpness as shown in Figure 6b,a. Generally, as in previous example, the shape of H′ and β are in correlation with solar X-ray flux. During occurrences of M1.8- and M2.7-class SFs on 12 June 2014, the changes of H′ during time have a normal nature. H′ lowers in intensity to a minimum after SFs beginning and it rises to a preflare value after X-ray flux peaks. The structure of β is correlated with the amplitude shape. At the time of this SF, it rose quickly to a maximum after the SF peak time and then collapsed to preflare size. At peak time of the M1.8-class SF, (Ix = 1.81·10−5 Wm−2), H′ lowers to a value of 67 km and β rises to 0.42 km−1. At peak time 10:21 UT during M2.7-class SF with flux Ix = 2.7·10−5 Wm−2, the H′ decreases to 65 km and the sharpness increases to 0.46 km−1.
The Ne at reference height is also in correlation with the intensity and shape of X-ray flux during the analysed time period (see Figure 6e).
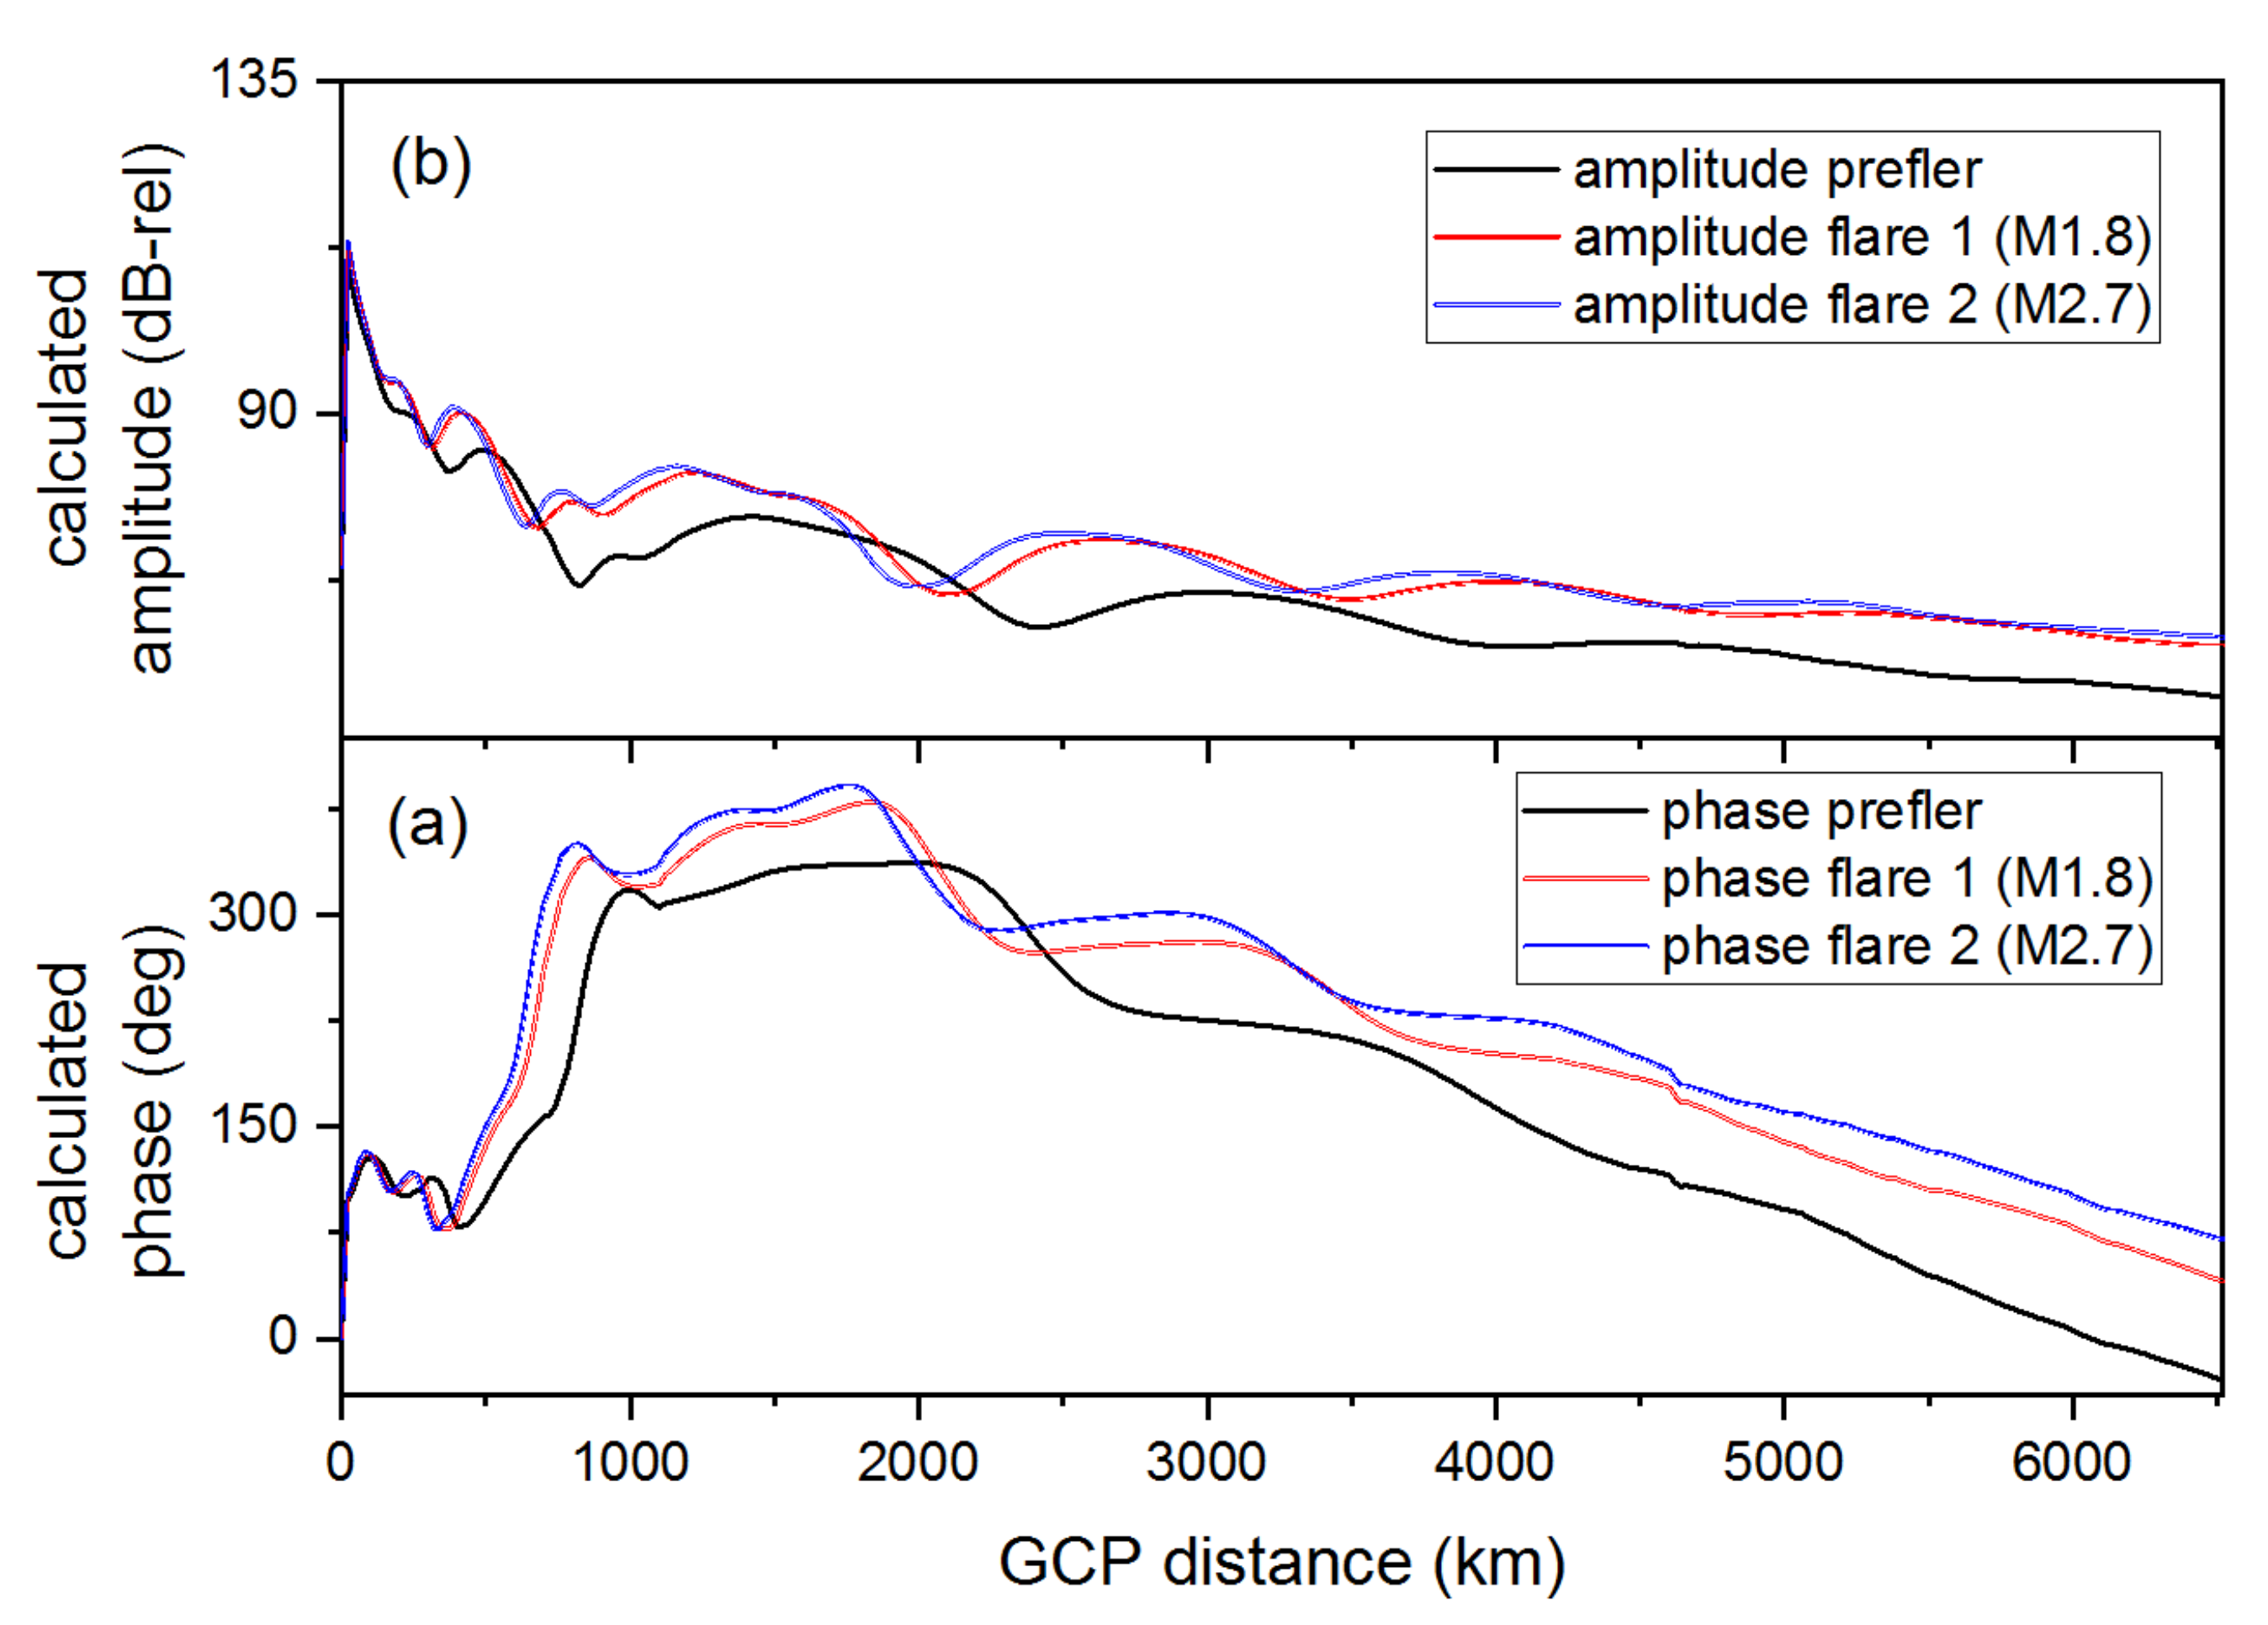
Figure 7 presents the values of simulated amplitude and phase of the NAA signal along the GCP distance, obtained for quiet and disturbed ionospheric state during SFs on 12 June 2014. The simulations of propagation were performed using LWPC code. Amplitude and phase values of NAA signal proportionally increase with increasing X-ray intensity along the whole path. During the initial and main phase of the SID event, the signal variations are more frequent. SID events in the D-region are most noticeable as changes in the phase of VLF radio signals.
The height profile, i.e., vertical Ne density profile before, after and during the M1.8- and M2.7-class solar flares on 12 June 2014 are shown in Figure 8. For unperturbed (preflare) conditions (black dashed line), one can see a slow increment of Ne (from 3.2·107 m−3 at 60 km height, to about 9.7·108 m−3 at 80 km height). Different slopes have a pink line and dashed red lines (at peak times of M-class SFs), with an increment from ~6·107 m−3 and ~1.2·108 m−3 at 60 km height to 1.45·1010 m−3 and 5·1010 m−3 at 80 km height, respectively.
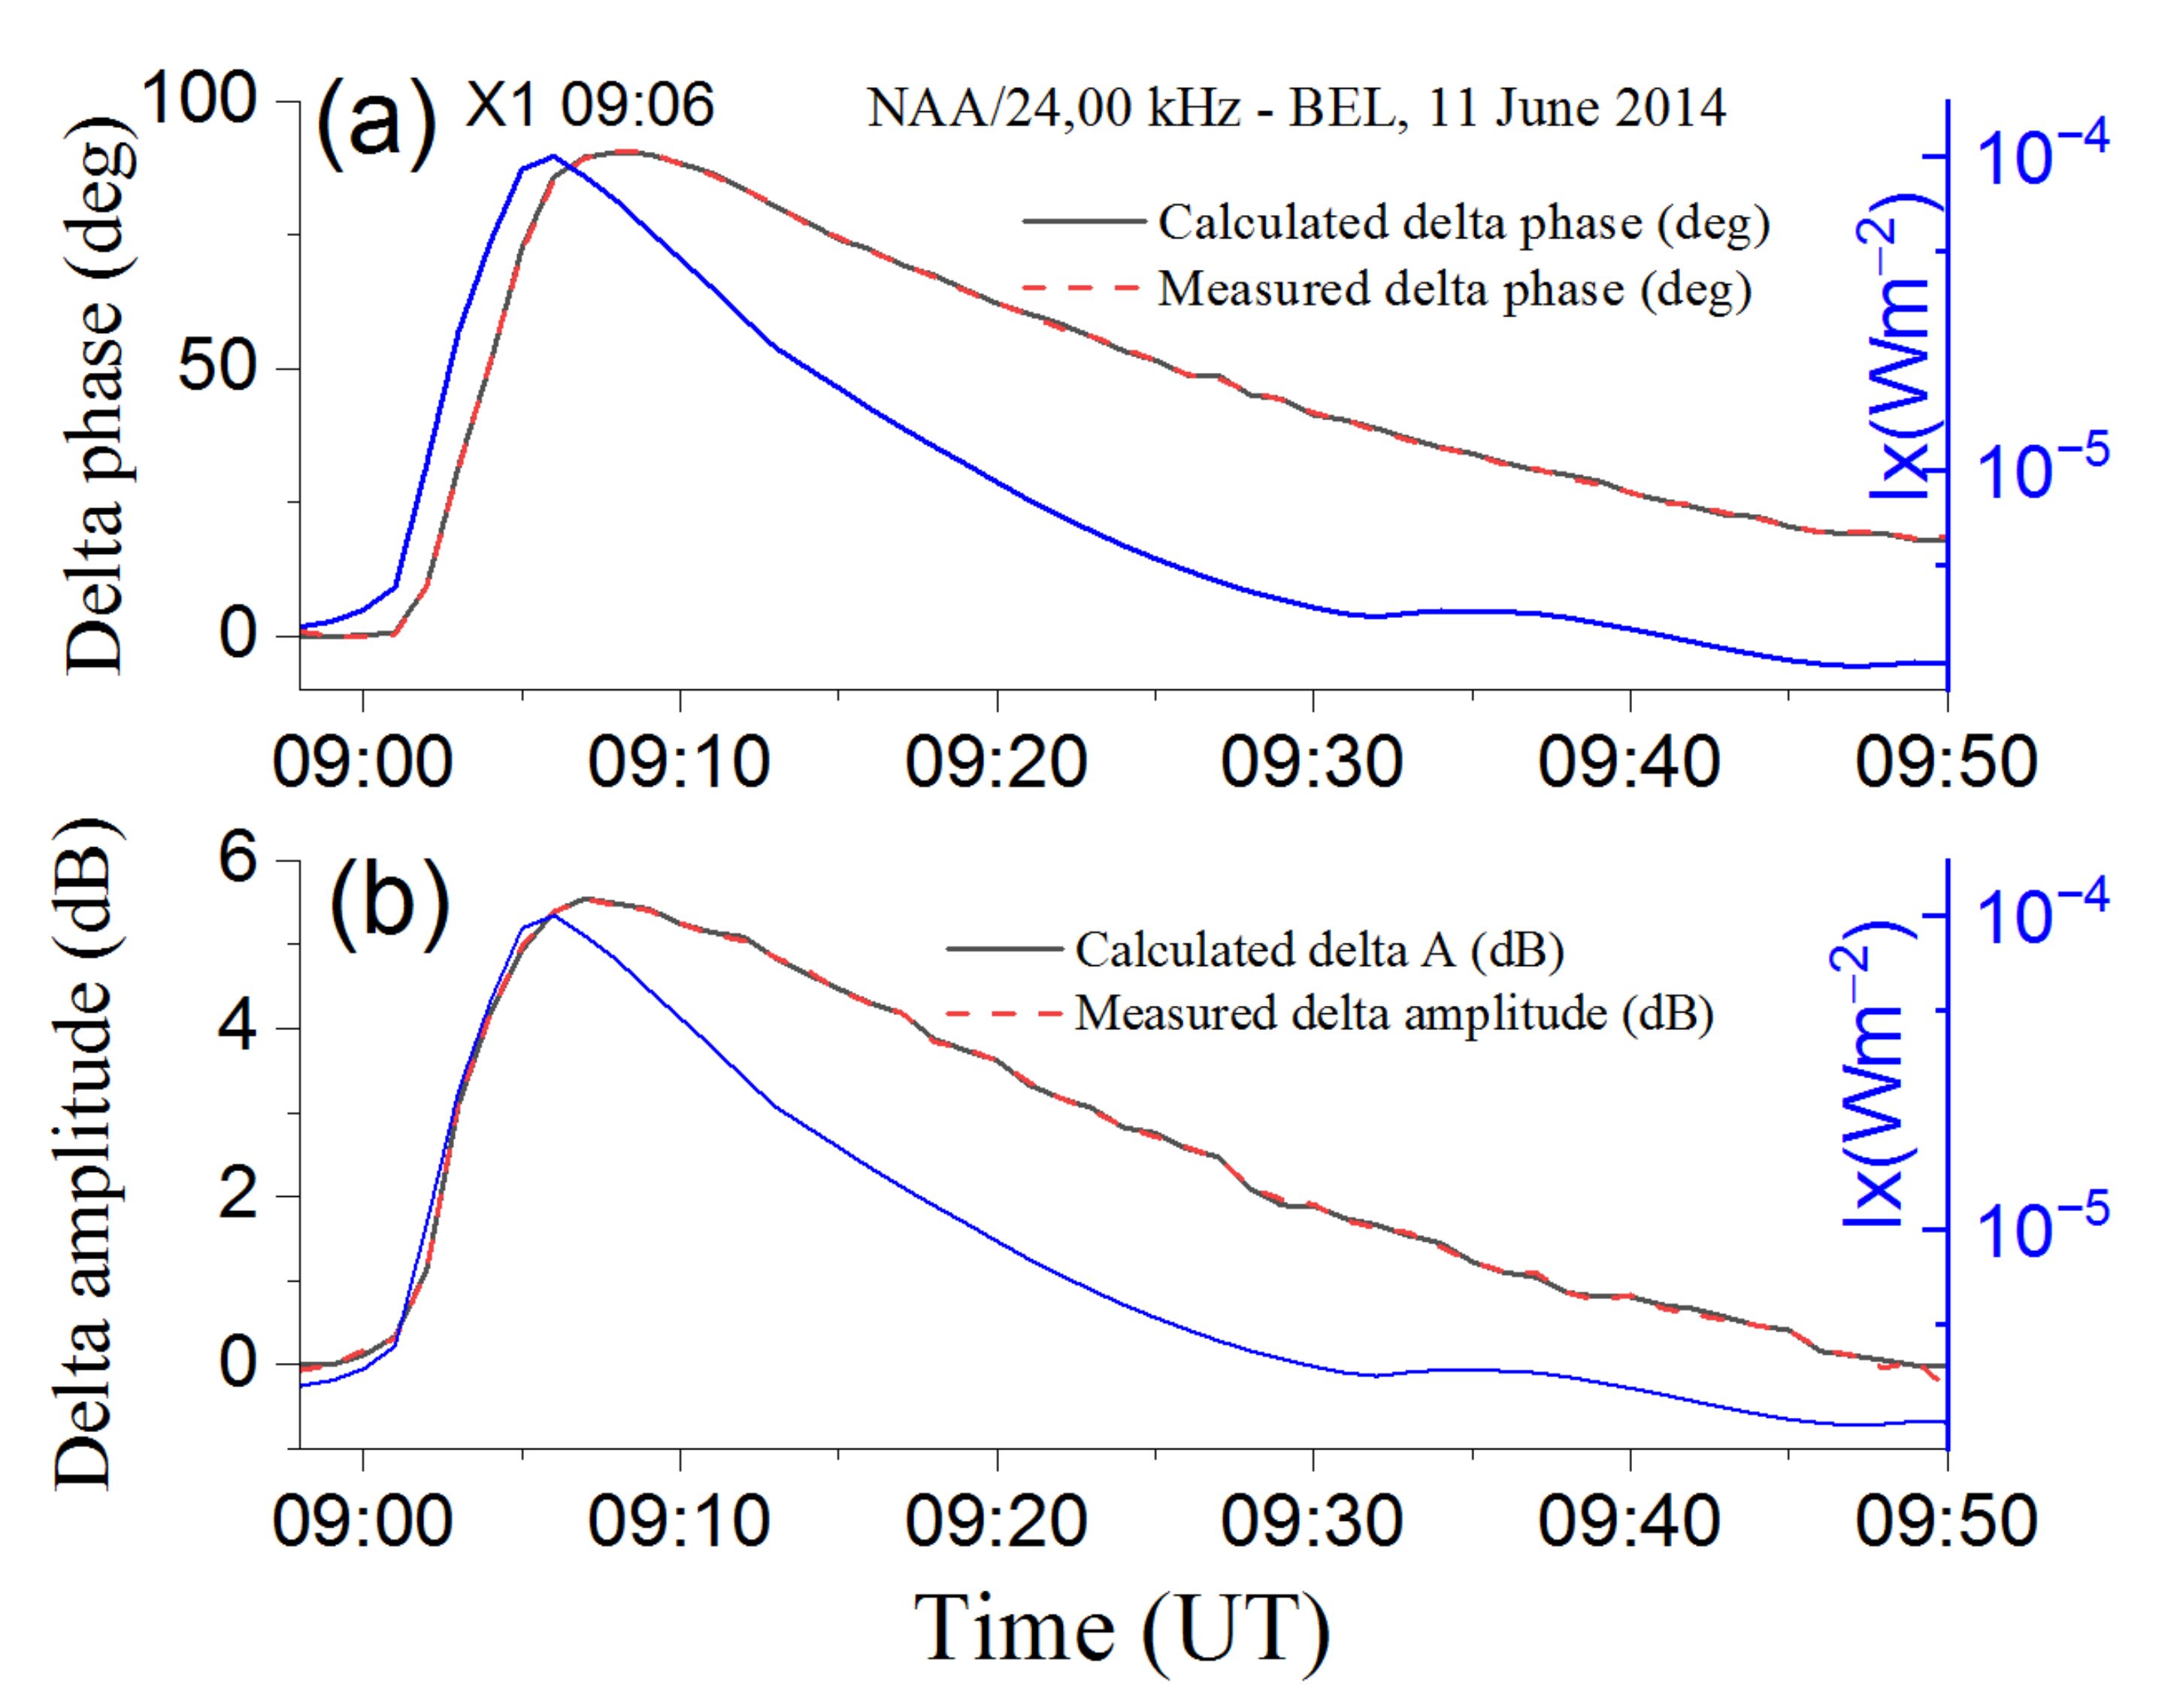
Strong SF: In order to cover the whole Ix spectral range needed for further analysis, we studied X-class solar flares with flux ≥10−4 Wm−2. Figure 9 presents the values of the monitored and simulated excess of amplitude and phase of the NAA signal simultaneously with X-ray flux during SF on 11 June 2014. Measured and simulated signal values are in good agreement, i.e., almost identical. Barely visible differences are at the right corner of the figure, i.e., during relaxation time and the end of SF.
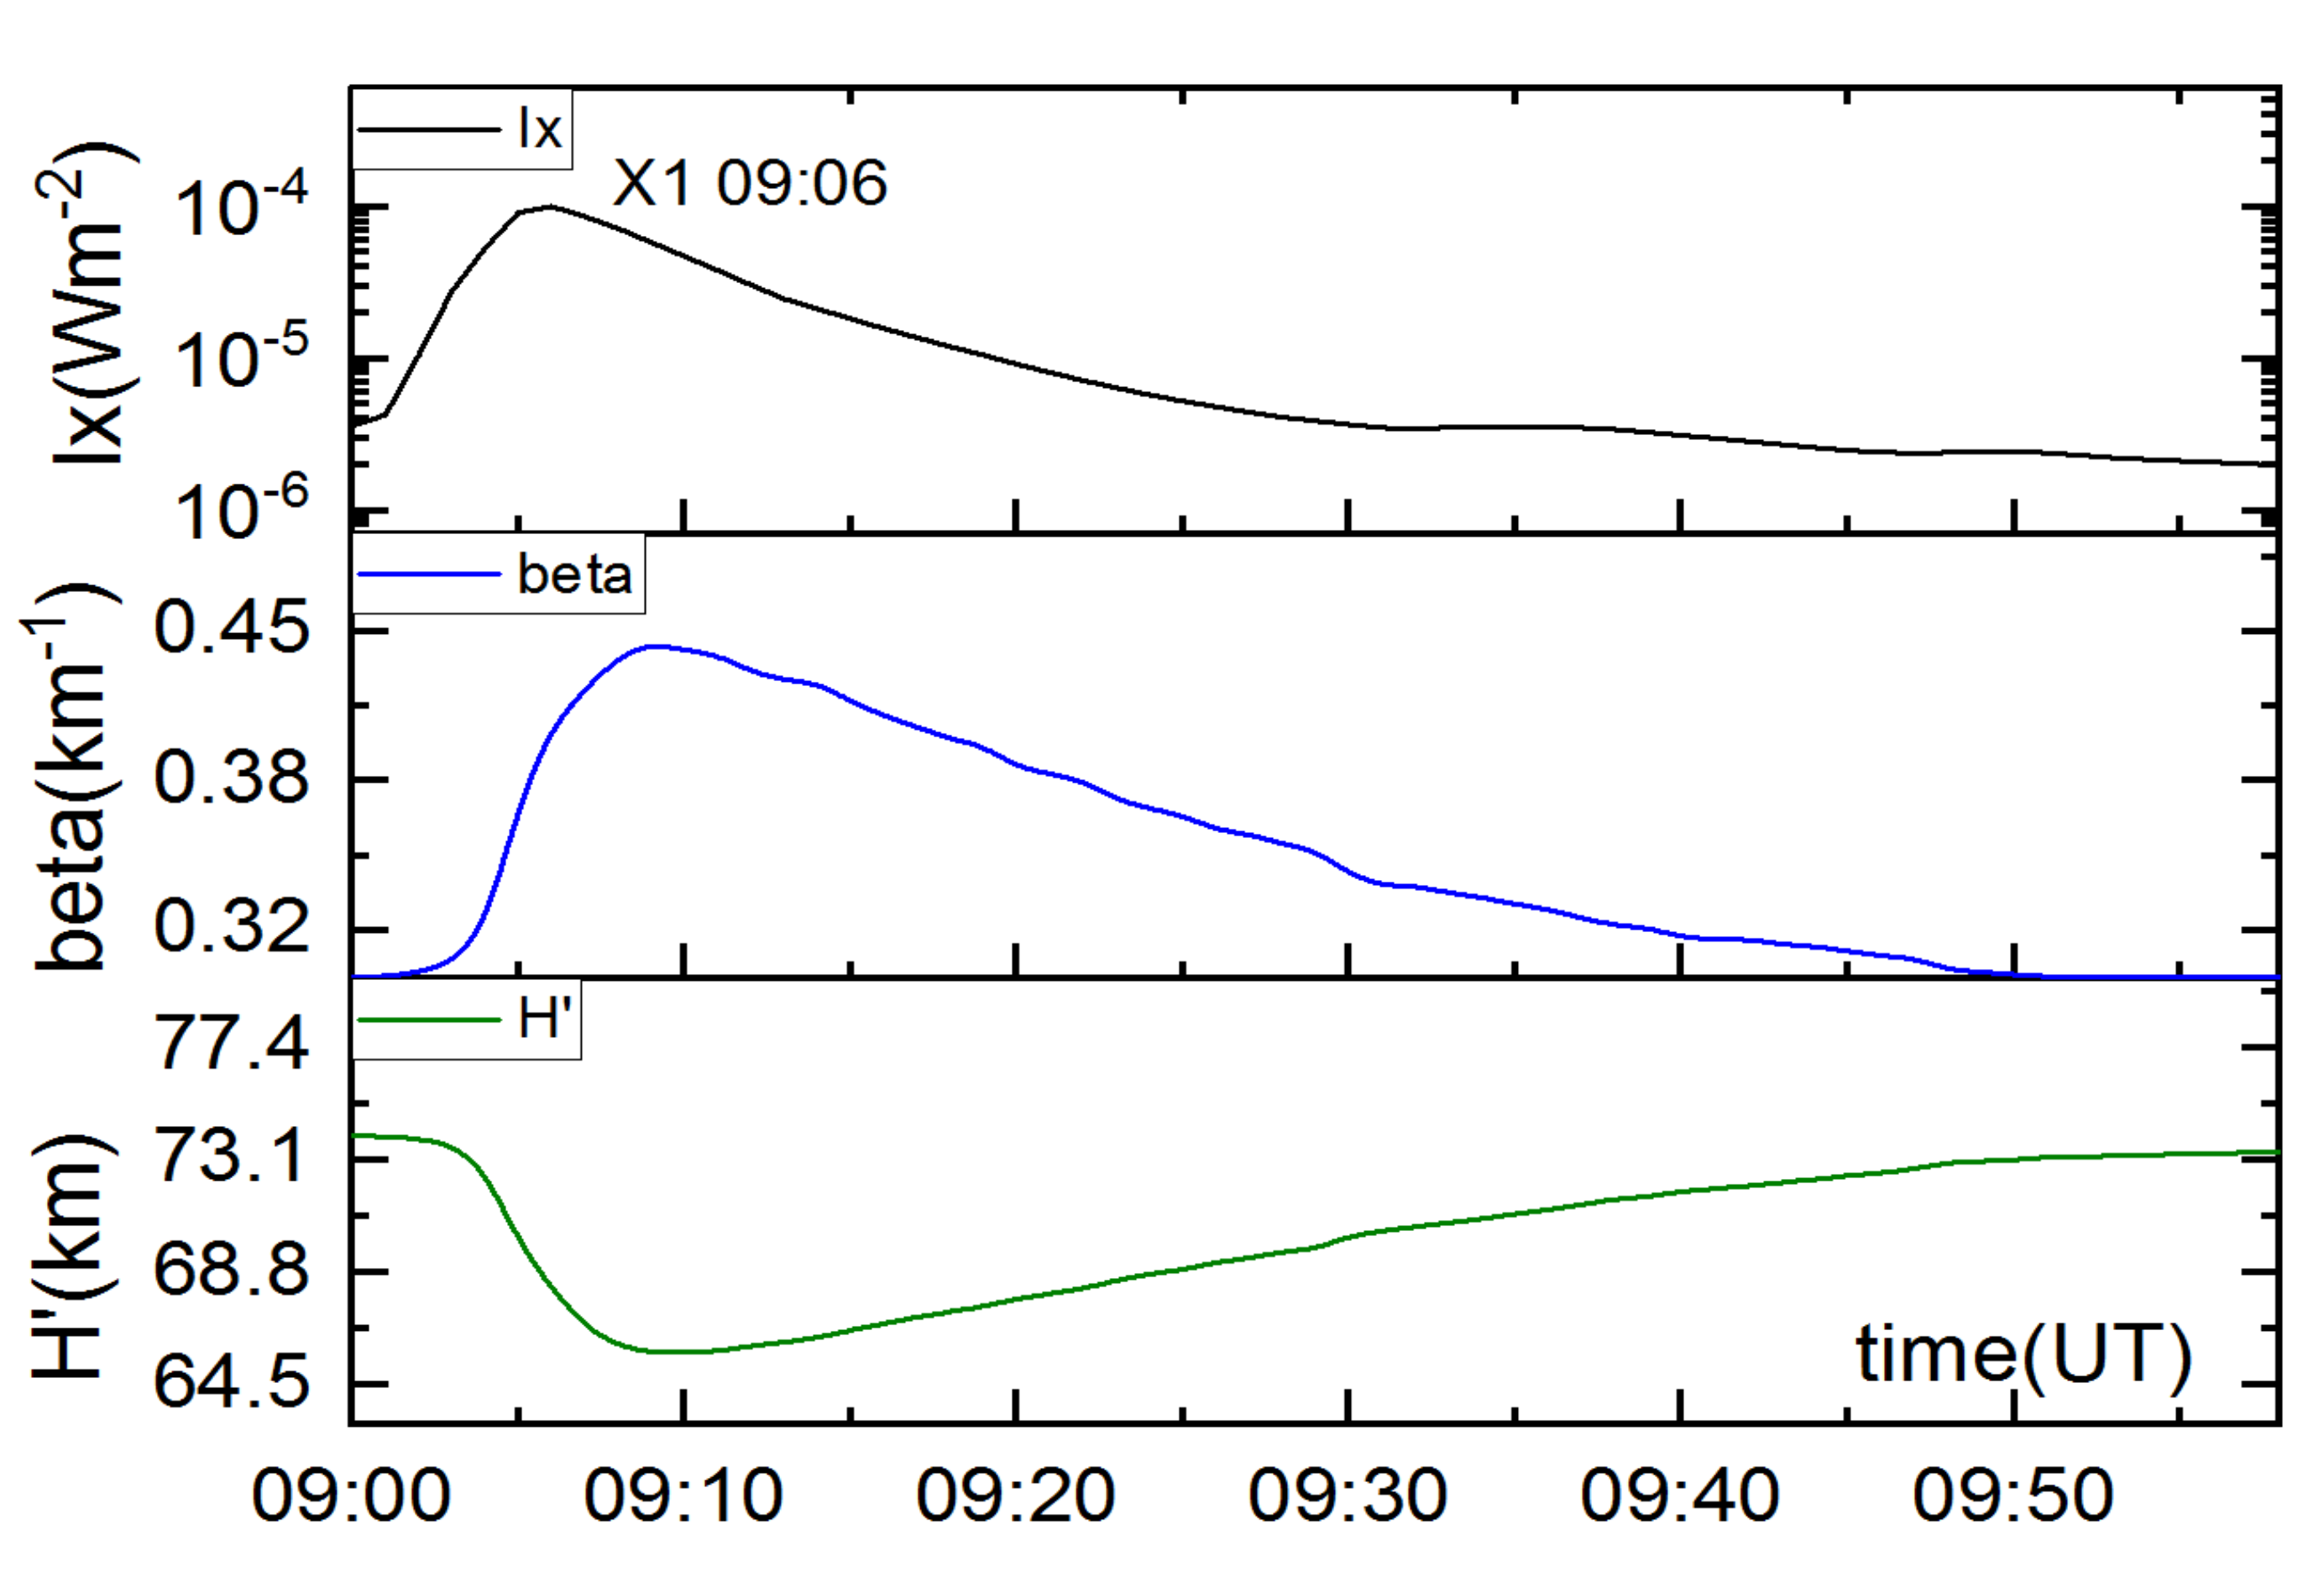
Additionally, amplitude and phase values of NAA signal proportionally increase with increasing X-ray intensity, and during relaxation time (right wings of signal) amplitude values decrease more slowly than the flux due to ionosphere sluggishness. For the period around SF on 11 June 2014, we have calculated the quantities needed for modelling such as the effective reflection height H′ and the sharpness β, as shown in lower panels of Figure 10. One can see that the time profile, i.e., shape of reflection height and the sharpness are in correlation with X-ray flux. More precisely, β has almost the same form as Ix but shifted by Δt, while H′ has a reverse shape.

3.2. Approximative Expressions and Simulations

Nowadays, more complicated methods and formulas exist and can be used in this field of science [27,33,34]. They are mostly related to calm conditions in the ionosphere, but still they are also used for perturbed conditions. However, the question arises of how easy some of them are for use and whether they are applicable when speed of analysis and obtaining products are important. The idea is to make the formula easy to use as well as to enable rapid calculations and analysis, such as for example the IRI model—the international standard empirical model for the terrestrial ionosphere [35,36].
In order to create an easier and more adequate use of the results and data, here we introduce the electron-density expression:
log N e ( h , I x ( t ) , t + Δ t ) = i = 0 2 a i ( h ) · ( log ( I x max ) ) i ,    t t I x max     a ) y 0 + ( 2 A / p i ) ( w / ( 4 ( t x c ) 2 + w 2 ) ) ,    t > t I x max     b )
where, tImax is time of maximum of X-ray flux (Wm−2) and h is height (km), Δt is time delay defined earlier in the text and ai(h) represents height-dependent dimensionless coefficients. Here, y 0 + ( 2 A / p i ) ( w / ( 4 ( t x c ) 2 + w 2 ) ) is Lorentzian function. Equation (4) gives more than satisfactory results when simplified (which was our intention to make it easy to use), i.e., when (4a) is valid for the whole time interval. Consequently, instead of whole Equation (4) we can use a simple logarithmic second-degree polynomial expression for theentire time interval, with height-dependent coefficients:
log N e ( h , I x ( t ) , t + Δ t ) = i = 0 2 a i ( h ) · ( log ( I x max ) ) i
Height-dependent coefficients ai(h) can be found in the Github project. Compared to paper [37], here for the first time we introduce Δt and improve the expression by taking into account the delay time of the ionosphere response, making it more physical.
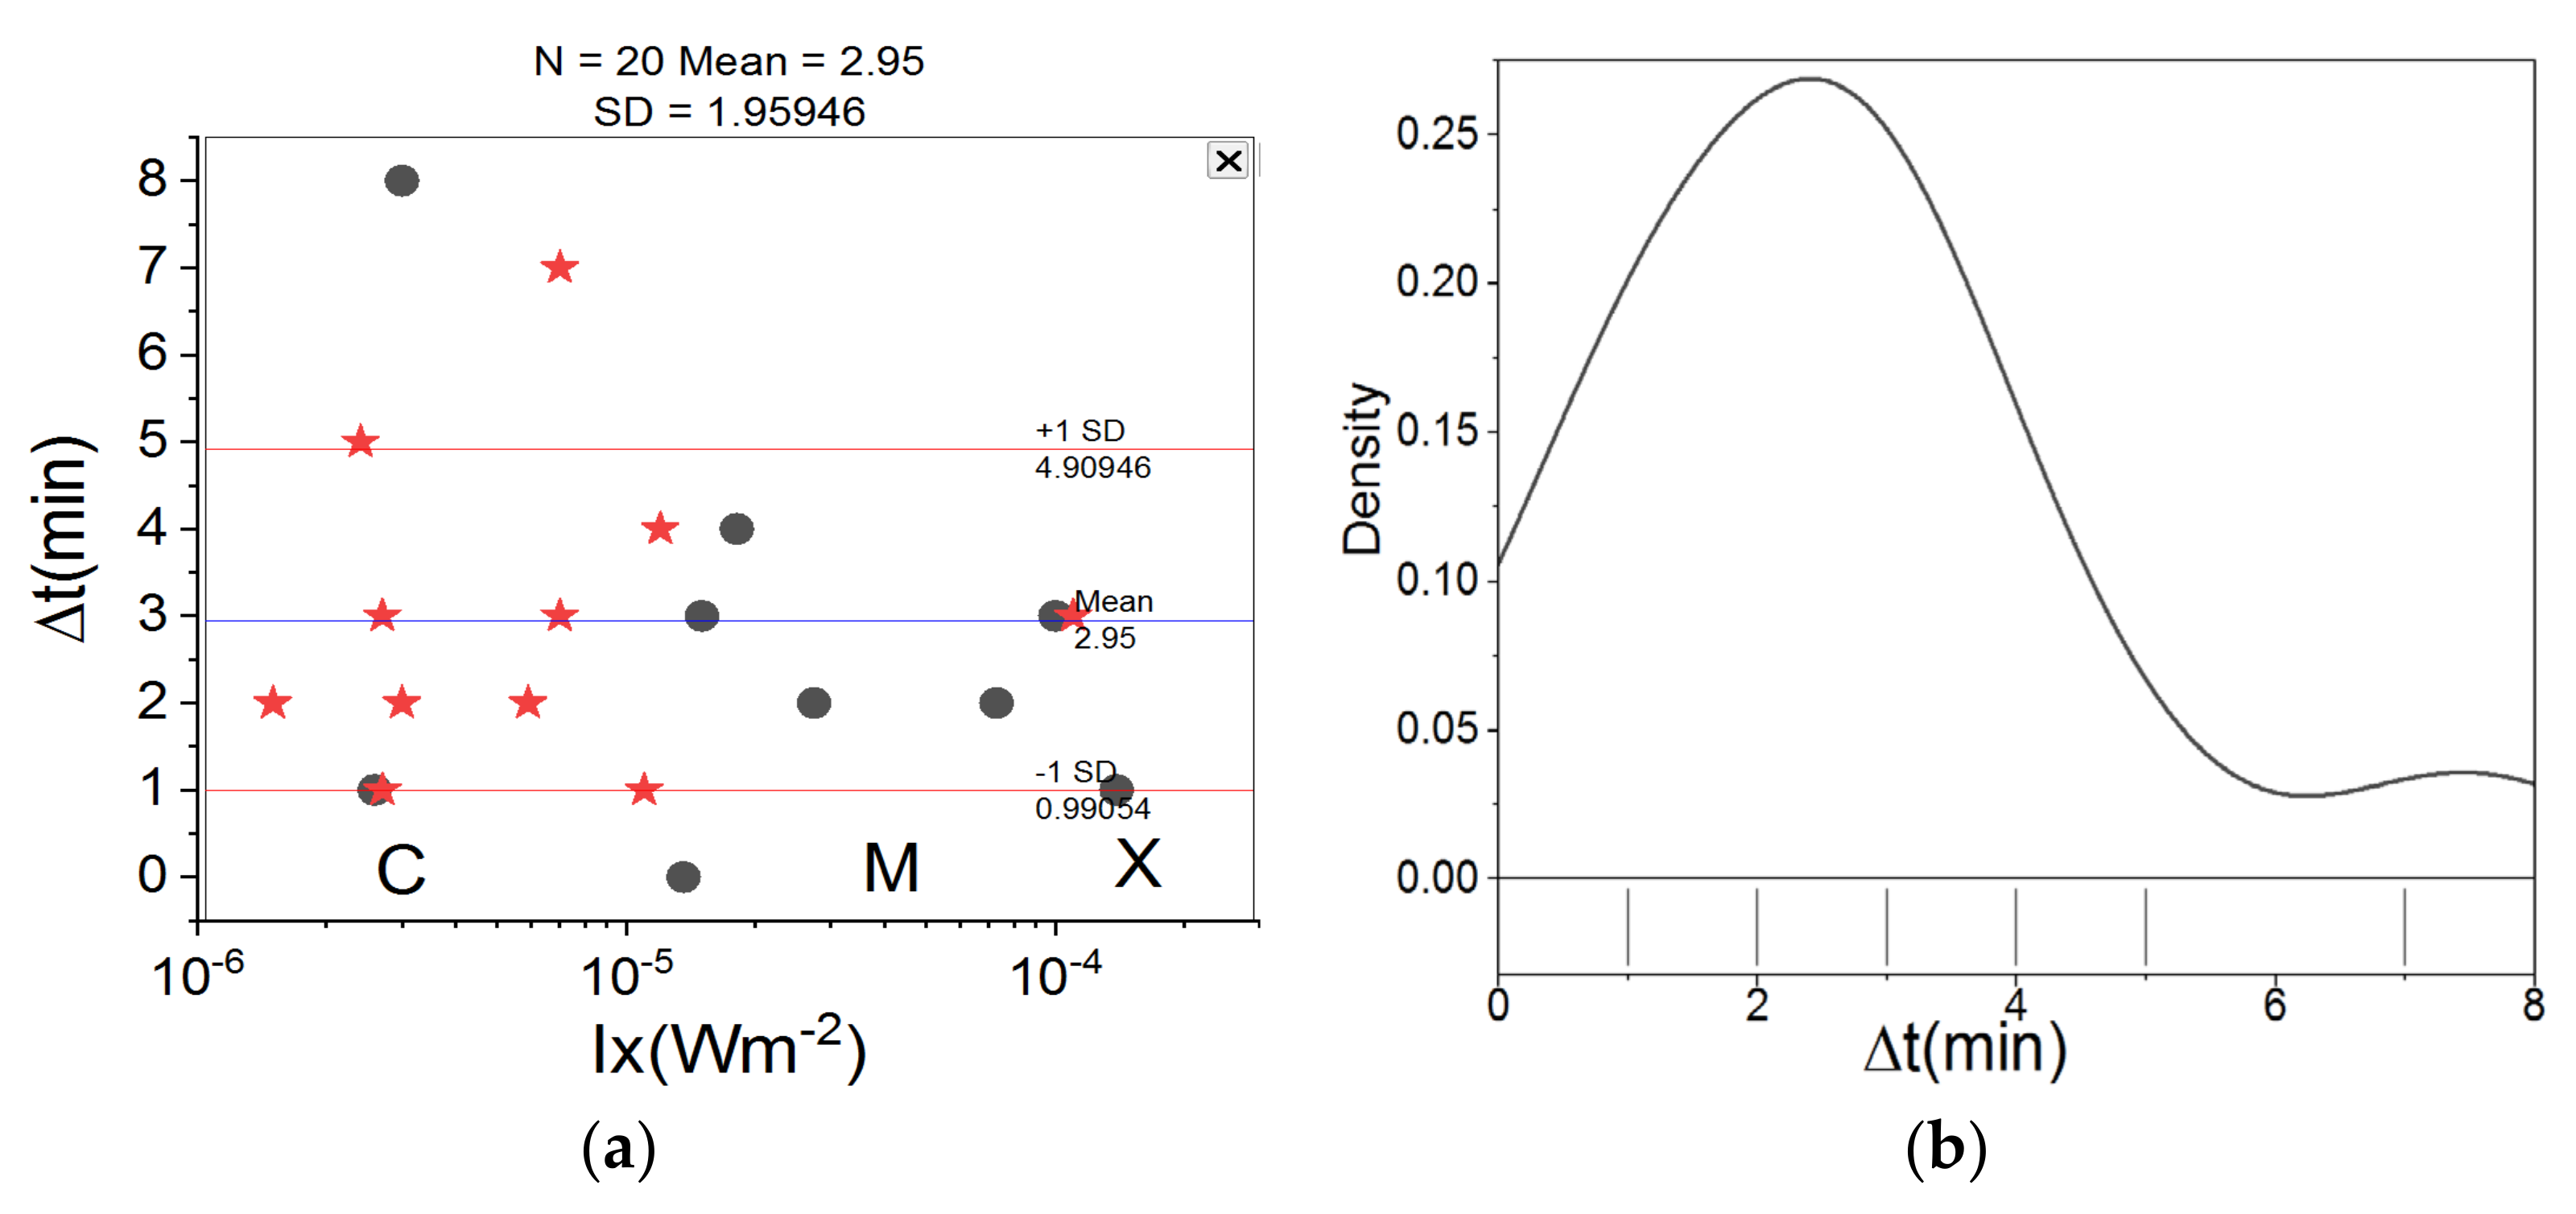
Time delay Δt in min can be presented (we use it further in the investigation) by linear dependence on the logarithm of X-ray flux (see, e.g., Figure 11)
Δ t = i = 0 1 c i · ( log ( I x max ) ) i   [ min ]
where dimensionless quantities take values c0 = 0.45385 and c1 = −0.44863 and Ixmax is X-ray flux at peak time in [Wm−2]. Further in the investigation we will use expression (6), which can be additionally corrected by inserting various influences. Of course, a more sophisticated formula might have been developed, but such precision was unnecessary since the values of the D-region parameters are known to fluctuate by an order of magnitude. The goal was to make the formula simple to use while also allowing for quick calculations and analysis.
In Figure 11a, we present values of obtained time delay Δt between the X-ray flux and the VLF amplitude as a function of peak flux. Black circles are data from present work and red stars are data from [27], obtained under the same conditions, i.e., with the same equipment and for the same transmitter–receiver path. Additionally, in Figure 11b we provide the distribution of Δt data points—a rug plot. The time delay between the X-ray flux and the VLF amplitude maximum Δt has a mean value of about 3 min. For C-class SFs, Δt is more scattered and has the highest variation, and for the larger values of flux Ix (M- and X-class SFs), the increase is the smallest.
From Figure 6 of the paper by Hayes et al. [38], one can see that presented data are scattered, even more so than in our case, with Δt up to 10 min and with a mean value of about two minutes, which is in accordance with our results. From Figure 11b (see rug plot), we certainly have the largest grouping between 1–4 min, which is also the case with the results of Hayes et al. [38] i.e., the results are in accordance. Certainly, there are other results in the literature such as from the paper of Basak & Chakrabarti [39], but our results and also the recent findings of Hayes et al. [38] differ from findings of Basak & Chakrabarti, which surely does not affect the main goal of the present work.
The conclusion is that the maximum of the signal, and consequently the electron density, is shifted by an average value of three minutes in relation to the maximum of the flux during the flare event due to ionosphere sluggishness. In addition, detailed statistics could have been performed but the main goal was to obtain a useful and easy to use expression for Ne.
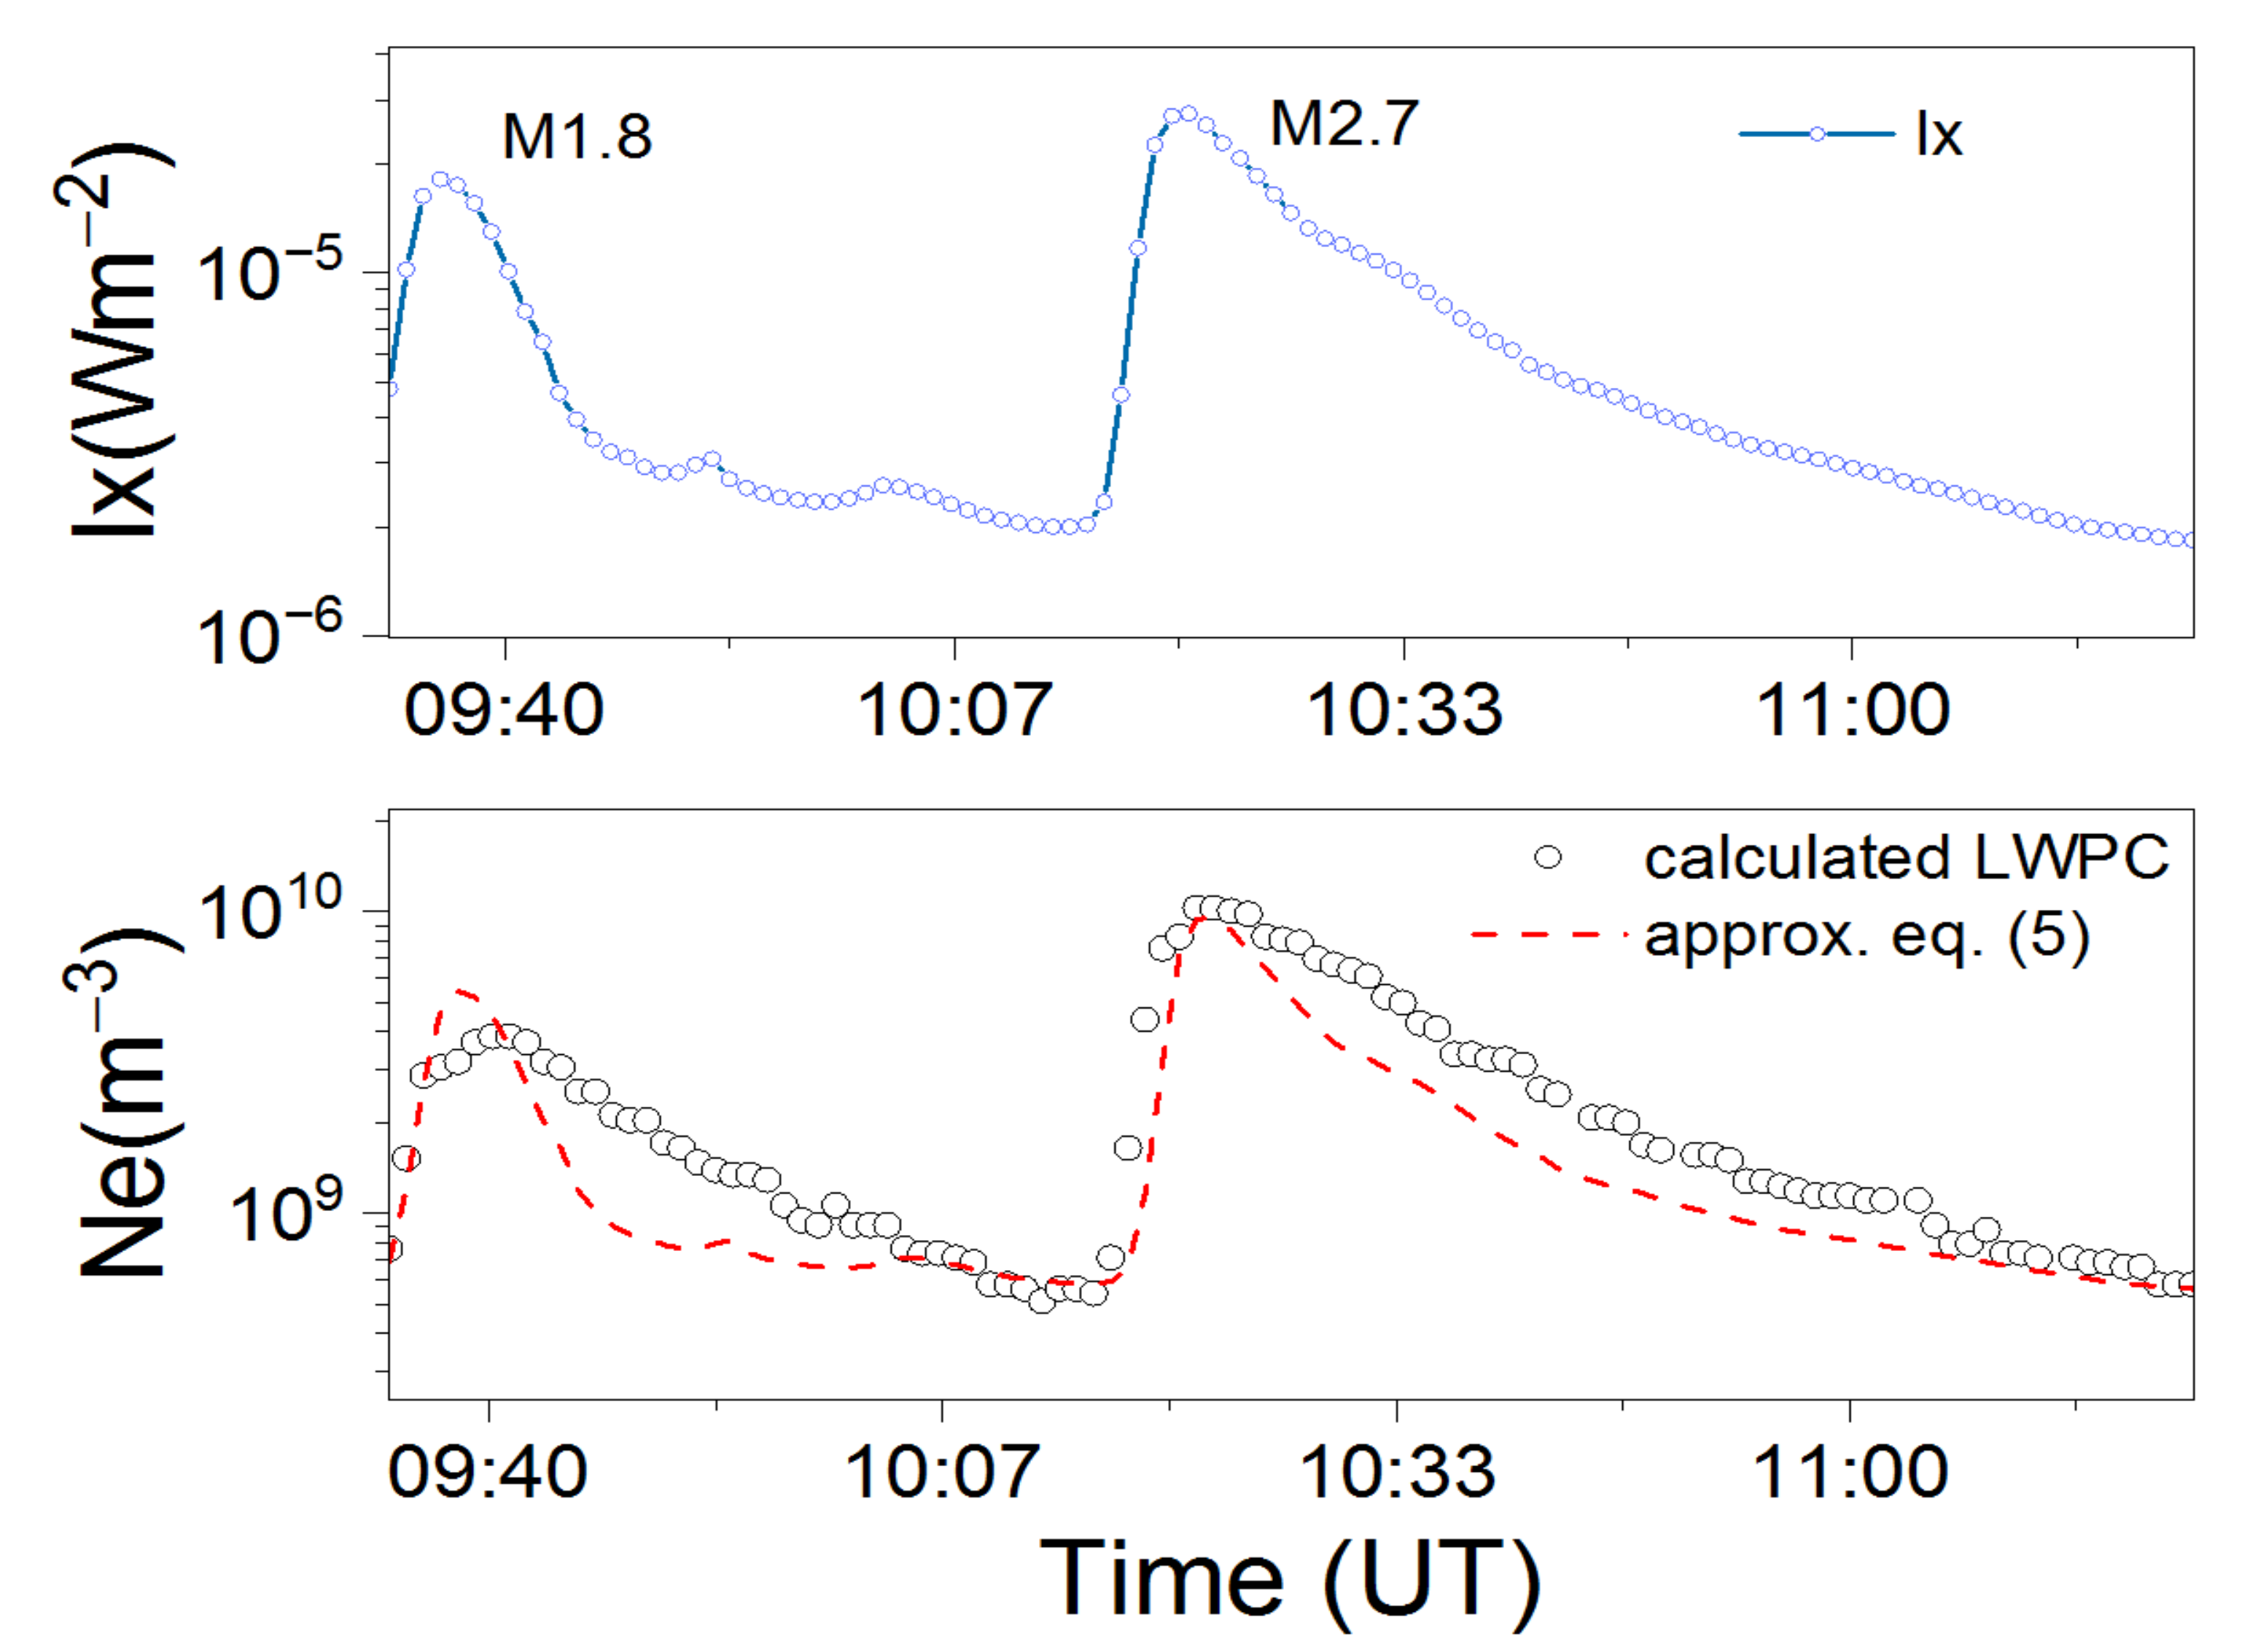
Variation in X-ray flux (upper panel), measured by GOES-15, and Ne (h = 74 km) as a function of UT during two successive flares on 12 June 2014 (lower panel) are presented in Figure 12. The red line in the lower panel shows results acquired by approximative Equation (5). The circles present values of electron density Ne obtained in this research by the method mentioned above using Equation (3). One can see that the results are in good agreement except the post-flare wings (Ne shape is more stretched). It can be noted that due to the sluggishness of the ionosphere, the shape of electron density over time does not totally follow the solar flux shape and it returns more slowly (post-flare wings) to a calm state due to the D-region relaxation time.
In [29], the database contains parameters β and H′ for different values of Ix, i.e., different classes of solar flares (during the period of ascending phase and maximum of the solar cycle 24 and 25). Solar flares are monitored and analysed by VLF technique and parameters β and H′ in database are obtained by method described in [20]. In https://github.com/sambolino/flarED (accessed on 19 September 2021) [29] for the input values of solar X-ray flux, Wait’s parameters β and H′ can be evaluated and altitude values of electron density for the low terrestrial ionosphere can be calculated.
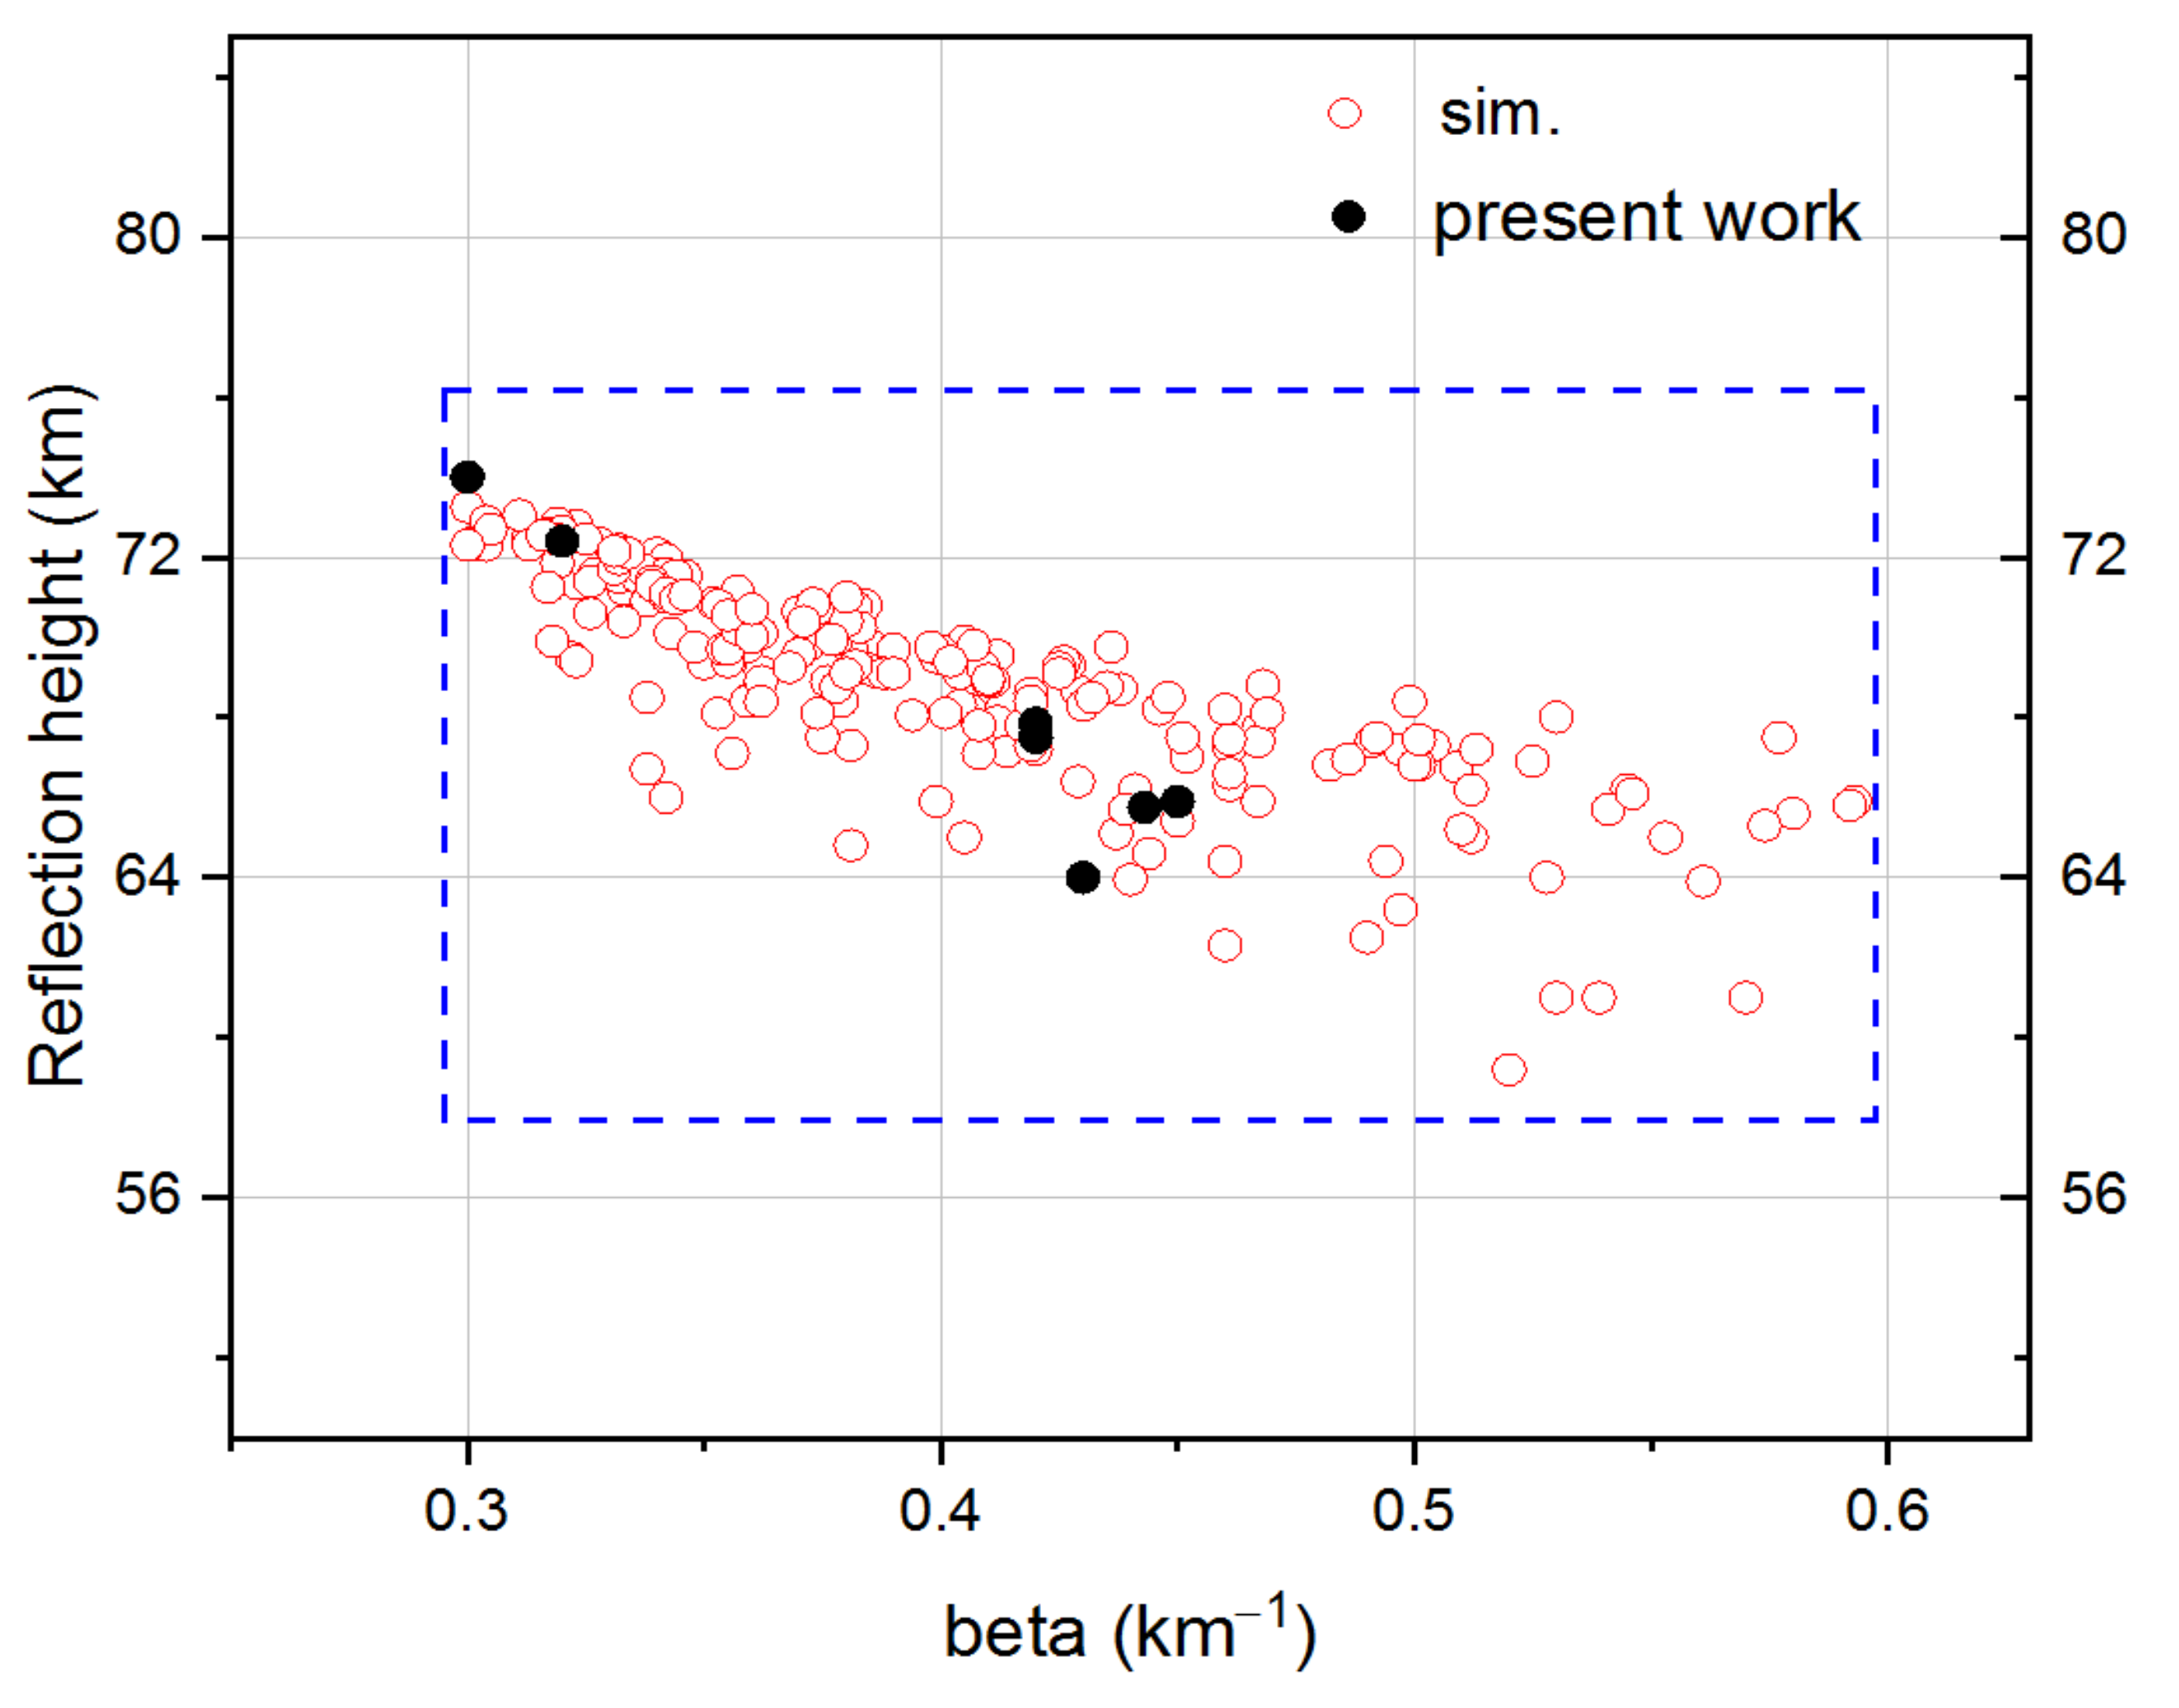
Figure 13 presents a scatter plot of a pair of D-region parameters, H′ and β, for SID cases analysed in this study together with data obtained using methods from [29]. Calculated parameters H′ and β are in the range of 60–74 km and 0.30–0.60 km−1, respectively. Black circles represent data from present work and red circles are related to the data obtained using the flared method (see Section 2.2.2). In the bottom right corner (for M- and X-classes of SF) data are more scattered.

3.3. Comparison of Results

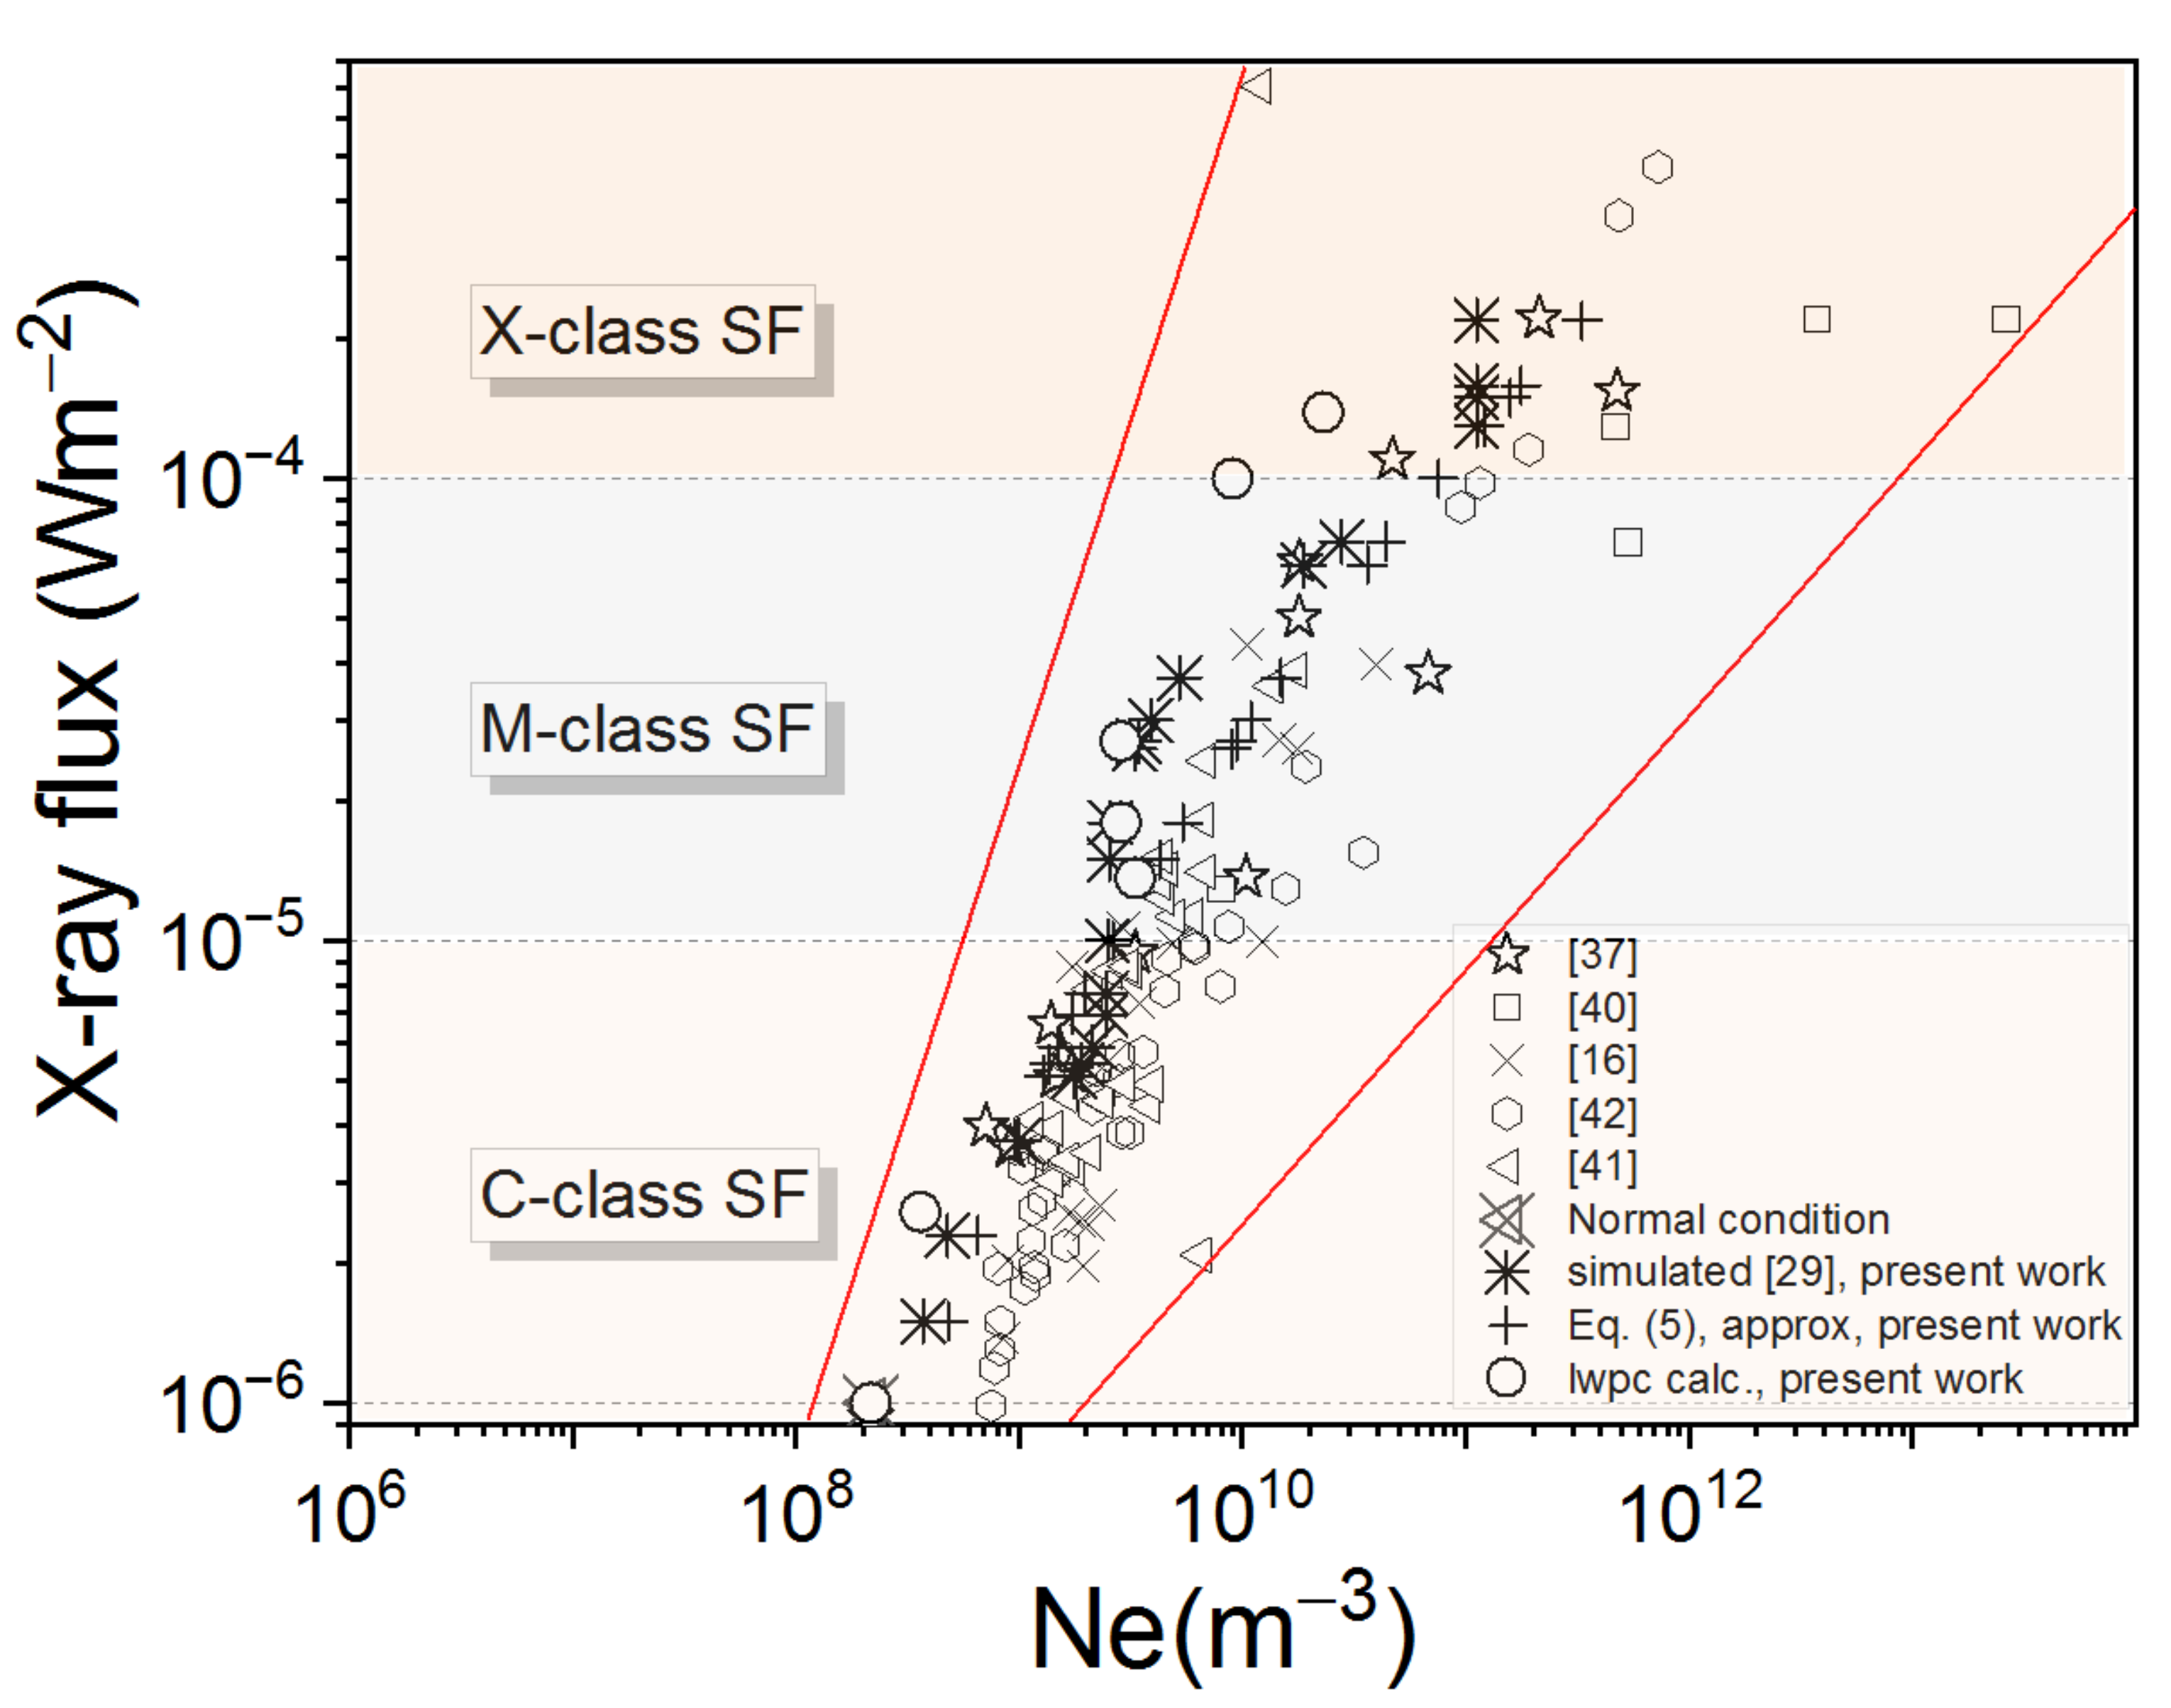
In Figure 14, we present the results from this investigation, i.e., paper (using three methods from Section 2.2.1, Section 2.2.2 and Section 2.2.3), which are either simulated, calculated, approximated or the data obtained from literature [16,37,40,41,42], for electron density Ne at reference height as a function of X-ray flux. The area of importance is between the two red lines. It can be noticed that the results differ from each other in some cases by an order of magnitude or more. Although the data are scattered, especially for stronger flares (right side of the graph), they still tend to increase with the intensity of the X-ray radiation. As noted, our results were acquired on the basis of analysis of SID events on NAA/24.00 kHz signal and using methods described in the text. Electron density at reference height h = 74 km changed from Ne = 2.16 × 10⁸ m−3 to Ne > 1011 m−3. Additionally, we compared data with the Ne data obtained using approximate Equation (5) (plus sign in Figure 14) and simulations (black star) using the flared method. The results are in fair agreement with previous studies. We can conclude that measurements over a long path give slightly higher slope, i.e., lower values of electron density than expected, but are quite satisfactory. This is important because most results concerning investigation in the D-region are scattered and vary in order of magnitude and we need to take into account all the data and correct the existing ones. During SIDs the time profile of electron density follows the solar X-ray flux variation.

4. Conclusions and Perspectives

In this paper we analysed SF events with extreme radiation in the X-spectral range. The perturbed VLF data were collected by monitoring the NAA/24.00 kHz VLF signal (transmitted in Maine, USA and then received in Belgrade, with GCP = 6540 km) and used together with GOES satellite data. The magnitude of impact of SFs on D-region and the consequences of these explosive events were analysed using measurements over a long path. The amplitude and phase data and ionosphere parameters during the enhancements of radiation due to the SF obtained in our study, are presented.
The GCP from the NAA transmitter to the Belgrade receiver is about 6540 km long and characterized as a long, dominantly sea path, and we studied cases when it is entirely sunlit. The data obtained here demonstrate the advantages of using these long-path measurements due to stable form of phase and amplitude variation caused by SID in contrast to the VLF perturbations on the short path which display more complexity and oscillations, including decreases and increases depending on the flare intensity. This is very important during the modelling process.
Furthermore, we conclude that the intensity of amplitude and phase perturbations on VLF kHz signal over a long path is in correlation with the size and shape of X-ray flux. This is in line with previous studies. The most effective influence on the enhancement of the ionization rate in the D-region during the observed SFs is due to the increased intensity of spectral lines in the X-ray spectra. Moreover, X-ray SFs with larger line intensities produce a larger increase in electron density. The computation was applied, and we obtained coefficients, i.e., sharpness, reflection height, and time delay needed for modelling this medium under increased radiation in the X-spectral range. One can notice that the intensified solar radiation in the X-spectral range changes D-region parameters and conducts an enhanced production rate, consequently deforming the VLF signal. The dependence of electron density on X-ray flux has slightly lower slope but is in fair agreement with previous studies.
The present manuscript offers an extension of the electron-density modeling in the daytime, SF-perturbed D-region of the ionosphere already introduced in [37]. In particular, the extension includes time delays from ionospheric sluggishness in Ne modeling, making use of data over a long GC path that ensures enhanced stability of SID-induced variations in phase and amplitude shape. The construction of the associated flarED GitHub project is designed to be easily applicable.
Moreover, we introduce novel methods and provide a simple, modified expression for Ne as a function of Ix, valid for unperturbed and perturbed conditions. We develop the expression by taking into account the delay time of the ionosphere response, making it more physical. The analysis and software are provided on GitHub under the MIT license.
In addition, the observed increase in the atmospheric aerosol number density after the event of SFs in February and March 2011, as well as high-level cloud formation in the upper atmosphere, reveal the importance of further investigation of SF and possible influence on particle-electrification mechanisms [43,44,45]. Recent studies [46] have introduced reconsideration of atmospheric aerosol–electricity interactions, which could improve theoretical understanding and simulations of the aerosol lifecycle, opening new horizons for weather and climate science. Future research will focus on a multidiscipline approach, investigating solar–geomagnetic activity effects on aerosol particles and on radiative transfer.

Author Contributions

Conceptualization, V.A.S. and D.M.Š.; writing—original draft preparation, V.A.S., Z.R.M.; writing—review and editing, V.A.S., D.M.Š., V.V., Z.R.M.; supervision, L.M.I. All authors have read and agreed to the published version of the manuscript.

Funding

This work was funded by the Institute of Physics Belgrade and University Union—Nikola Tesla Belgrade, through a grant by the Ministry of Education and Science of the Republic of Serbia. This article/publication is based upon work from COST Action CA17126—Towards understanding and modelling intense electronic excitation (TUMIEE), supported by COST (European Cooperation in Science and Technology).

Institutional Review Board Statement

Not applicable.

Informed Consent Statement

Not applicable.

Data Availability Statement

New dataset from this study is publicly available as well as python functions for calculating ionosphere parameters on GitHub: https://github.com/sambolino/flarED (accessed on 10 October 2021). Publicly available datasets were analysed in this study and can be found at https://satdat.ngdc.noaa.gov/sem/goes/data/avg (accessed on 2 September 2021).

Acknowledgments

We would like to express our appreciation to Ognyan Kounchev and Magdalena Christova for the shown attention to this paper and for a fruitful dialogue.

Conflicts of Interest

The authors declare no conflict of interest. The funders had no role in the design of the study; in the collection, analyses, or interpretation of data; in the writing of the manuscript, or in the decision to publish the results.

References

  1. Bothmer, V.; Daglis, I.A. Space Weather: Physics and Effects; Springer Science & Business Media: Berlin/Heidelberg, Germany, 2007. [Google Scholar]
  2. Smith, H.J.; Smith, E.V.P. Solar Flares; Macmillan: New York, NY, USA, 1963. [Google Scholar]
  3. Davidson, B. Weatherman’s Guide to the Sun, 3rd ed.; Space Weather News, LLC.: New York, NY, USA, 2020. [Google Scholar]
  4. Doschek, G.; Meekins, J.; Cowan, R.D. Spectra of solar flares from 8.5 Å to 16 Å. Sol. Phys. 1973, 29, 125–141. [Google Scholar] [CrossRef]
  5. Tandberg-Hanssen, E.; Emslie, A.G. The Physics of Solar Flares; Cambridge University Press: Cambridge, UK, 2009. [Google Scholar]
  6. Reames, D.V.; Murdin, P. Solar Wind: Energetic Particles. Encycl. Astron. Astrophys. 2002, 2312, 1–122. [Google Scholar]
  7. Tandon, J.; Deshpande, S.; Bhatia, V. Electromagnetic radiation from solar flares. Nature 1968, 220, 1213–1214. [Google Scholar] [CrossRef]
  8. Brasseur, G.P.; Solomon, S. Composition and chemistry. In Aeronomy of the Middle Atmosphere: Chemistry and Physics of the Stratosphere and Mesosphere; Springer: Berlin/Heidelberg, Germany, 2005; pp. 265–442. [Google Scholar]
  9. Nina, A.; Čadež, V.; Srećković, V.; Šulić, D. The influence of solar spectral lines on electron concentration in terrestrial ionosphere. Open Astron. 2011, 20, 609–612. [Google Scholar] [CrossRef] [Green Version]
  10. Valnicek, B.; Ranzinger, P. X-ray emission and D-region “sluggishness”. Bull. Astron. Inst. Czechoslov. 1972, 23, 318. [Google Scholar]
  11. Bain, W.C.; Hammond, E. Ionospheric solar flare effect observations. J. Atmos. Sol. Terr. Phys. 1975, 37, 573–574. [Google Scholar] [CrossRef]
  12. Brasseur, G.P.; Solomon, S. Radiation. In Aeronomy of the Middle Atmosphere: Chemistry and Physics of the Stratosphere and Mesosphere; Springer: Berlin/Heidelberg, Germany, 2005; pp. 151–264. [Google Scholar]
  13. Mitra, A.P. Ionospheric Effects of Solar Flares; Springer: Berlin/Heidelberg, The Netherlands, 1974. [Google Scholar] [CrossRef]
  14. Nicolet, M.; Swider, W., Jr. Ionospheric conditions. Planet. Space Sci. 1963, 11, 1459–1482. [Google Scholar] [CrossRef]
  15. Garcia, H.A. Temperature and emission measure from GOES soft X-ray measurements. Sol. Phys. 1994, 154, 275–308. [Google Scholar] [CrossRef]
  16. Grubor, D.; Šulić, D.; Žigman, V. Classification of X-ray solar flares regarding their effects on the lower ionosphere electron density profile. Ann. Geophys. 2008, 26, 1731–1740. [Google Scholar] [CrossRef] [Green Version]
  17. Wang, X.; Chen, Y.; Toth, G.; Manchester, W.B.; Gombosi, T.I.; Hero, A.O.; Jiao, Z.; Sun, H.; Jin, M.; Liu, Y. Predicting solar flares with machine learning: Investigating solar cycle dependence. Astrophys. J. 2020, 895, 3. [Google Scholar] [CrossRef]
  18. Kelley, M.C. The Earth’s Ionosphere: Plasma Physics and Electrodynamics, ser. International Geophysics, 2nd ed.; Academic Press: Cambridge, MA, USA, 2009. [Google Scholar]
  19. Wah, W.P.; Abdullah, M.; Hasbi, A.M.; Bahari, S.A. Development of a VLF receiver system for sudden ionospheric disturbances (SID) detection. In Proceedings of the 2012 IEEE Asia-Pacific Conference on Applied Electromagnetics (APACE), Melaka, Malaysia, 11–13 December; pp. 98–103.
  20. Šulić, D.; Srećković, V.; Mihajlov, A. A study of VLF signals variations associated with the changes of ionization level in the D-region in consequence of solar conditions. Adv. Space Res. 2016, 57, 1029–1043. [Google Scholar] [CrossRef] [Green Version]
  21. Volland, H. On the solar flare effect of vlf-waves in the lower ionosphere. J. Atmos. Sol.-Terr. Phys. 1964, 26, 695–709. [Google Scholar] [CrossRef]
  22. Šulić, D.; Srećković, V. A comparative study of measured amplitude and phase perturbations of VLF and LF radio signals induced by solar flares. Serb. Astron. J. 2014, 188, 45–54. [Google Scholar] [CrossRef] [Green Version]
  23. Ferguson, A.J. Computer Programs for Assessment of Long-Wavelength Radio Communications, Version 2.0: User’s Guide and Source Files; Space and Naval Warfare Systems Center: San Diego, CA, USA, 1998. [Google Scholar]
  24. LWPC. Computer Programs for Assessment of Long-Wavelength Radio Communications, V2.1. 2018. Available online: https://github.com/space-physics/LWPC (accessed on 30 June 2021).
  25. Nina, A.; Čadež, V.; Srećković, V.; Šulić, D. Altitude distribution of electron concentration in ionospheric D-region in presence of time-varying solar radiation flux. Nucl. Instrum. Methods Phys. Res. B 2012, 279, 110–113. [Google Scholar] [CrossRef] [Green Version]
  26. Nina, A.; Čadež, V.; Šulić, D.; Srećković, V.; Žigman, V. Effective electron recombination coefficient in ionospheric D-region during the relaxation regime after solar flare from February 18, 2011. Nucl. Instrum. Methods Phys. Res. B 2012, 279, 106–109. [Google Scholar] [CrossRef] [Green Version]
  27. Žigman, V.; Grubor, D.; Šulić, D. D-region electron density evaluated from VLF amplitude time delay during X-ray solar flares. J. Atmos. Sol.-Terr. Phys. 2007, 69, 775–792. [Google Scholar] [CrossRef]
  28. Wait, J.R.; Spies, K.P. Characteristics of the Earth-Ionosphere Waveguide for VLF Radio Waves, Technical Note 300; US Department of Commerce, National Bureau of Standards: Boulder, CO, USA, 1964.
  29. Vujčić, V.; Srećković, V.A. flarED Flare Electron Density. Available online: https://github.com/sambolino/flarED (accessed on 19 September 2021).
  30. Da Silva, C.L.; Salazar, S.D.; Brum, C.G.; Terra, P. Survey of electron density changes in the daytime ionosphere over the Arecibo observatory due to lightning and solar flares. Sci. Rep. 2021, 11, 1–12. [Google Scholar] [CrossRef]
  31. Kolarski, A.; Grubor, D. Sensing the Earth’s low ionosphere during solar flares using VLF signals and goes solar X-ray data. Adv. Space Res. 2014, 53, 1595–1602. [Google Scholar] [CrossRef] [Green Version]
  32. Kolarski, A.; Grubor, D. Comparative analysis of VLF signal variation along trajectory induced by X-ray solar flares. J. Astrophys. Astron. 2015, 36, 565–579. [Google Scholar] [CrossRef]
  33. Nina, A.; Nico, G.; Mitrović, S.T.; Čadež, V.M.; Milošević, I.R.; Radovanović, M.; Popović, L.Č. Quiet Ionospheric D-Region (QIonDR) Model Based on VLF/LF Observations. Remote Sens. 2021, 13, 483. [Google Scholar] [CrossRef]
  34. Palit, S.; Basak, T.; Mondal, S.; Pal, S.; Chakrabarti, S. Modeling of very low frequency (VLF) radio wave signal profile due to solar flares using the GEANT4 Monte Carlo simulation coupled with ionospheric chemistry. Atmos. Chem. Phys. 2013, 13, 9159–9168. [Google Scholar] [CrossRef] [Green Version]
  35. Sezen, U.; Gulyaeva, T.L.; Arikan, F. Online international reference ionosphere extended to plasmasphere (IRI-Plas) model. In Proceedings of the 2017 XXXIInd General Assembly and Scientific Symposium of the International Union of Radio Science (URSI GASS), Montreal, QC, Canada, 19–26 August 2017; pp. 1–4. [Google Scholar]
  36. Bilitza, D.; Altadill, D.; Truhlik, V.; Shubin, V.; Galkin, I.; Reinisch, B.; Huang, X. International Reference Ionosphere 2016: From Ionospheric Climate to Real-Time Weather Predictions. Space Weather. 2017, 15, 418–429. [Google Scholar] [CrossRef]
  37. Srećković, V.A.; Šulić, D.M.; Ignjatović, L.; Vujčić, V. Low Ionosphere under Influence of Strong Solar Radiation: Diagnostics and Modeling. Appl. Sci. 2021, 11, 7194. [Google Scholar] [CrossRef]
  38. Hayes, L.A.; O’Hara, O.S.; Murray, S.A.; Gallagher, P.T. Solar Flare Effects on the Earth’s Lower Ionosphere. Sol. Phys. 2021, 296, 1–17. [Google Scholar] [CrossRef]
  39. Basak, T.; Chakrabarti, S.K. Effective recombination coefficient and solar zenith angle effects on low-latitude D-region ionosphere evaluated from VLF signal amplitude and its time delay during X-ray solar flares. Astrophys. Space Sci. 2013, 348, 315–326. [Google Scholar] [CrossRef] [Green Version]
  40. Gavrilov, B.; Ermak, V.; Lyakhov, A.; Poklad, Y.V.; Rybakov, V.; Ryakhovsky, I. Reconstruction of the Parameters of the Lower Midlatitude Ionosphere in M-and X-Class Solar Flares. Geomagn. Aeron. 2020, 60, 747–753. [Google Scholar] [CrossRef]
  41. Pandey, U.; Singh, B.; Singh, O.; Saraswat, V. Solar flare induced ionospheric D-region perturbation as observed at a low latitude station Agra, India. Astrophys. Space Sci. 2015, 357, 1–11. [Google Scholar] [CrossRef]
  42. Thomson, N.R.; Clilverd, M.A. Solar flare induced ionospheric D-region enhancements from VLF amplitude observations. J. Atmos. Sol.-Terr. Phys. 2001, 63, 1729–1737. [Google Scholar] [CrossRef]
  43. Avakyan, S. Supramolecular physics of the solar-troposphere links: Control of the cloud cover by solar flares and geomagnetic storms. In Proceedings of the 11th Intl School and Conference “Problems of Geocosmos”, St. Petersburg, Russia, 3–7 October 2016; pp. 187–191. [Google Scholar]
  44. Goncharenko, Y.V.; Kivva, F. Evaluation of Size of the Atmospheric Aerosol Particles in the Reflecting Layers Occurring after Intense Solar Flares. Telecommun. Radio Eng. 2003, 59, 1–6. [Google Scholar]
  45. McGrath-Spangler, E.L.; Denning, A.S. Global seasonal variations of midday planetary boundary layer depth from CALIPSO space-borne LIDAR. J. Geophys. Res. 2013, 118, 1226–1233. [Google Scholar] [CrossRef]
  46. Mallios, S.A.; Daskalopoulou, V.; Amiridis, V. Orientation of non spherical prolate dust particles moving vertically in the Earth’s atmosphere. J. Aerosol. Sci. 2021, 151, 105657. [Google Scholar] [CrossRef]
Figure 1. Time variation of X-ray irradiance on the right axes, NAA/24.00 kHz signal phase (a) and amplitude (b) during M1.5 (09:54 UT), M7.3 (10:15 UT), C3 (12:14 UT) and X1.3 (14:36 UT) events on 7 September 2017.
Applsci 11 11574 g001
Figure 2. Measured variation of amplitude (a) and phase (b) on NAA signals for 9 May 2013 (quiet day) and 10 May 2013 with noticeable SF events.
Applsci 11 11574 g002
Figure 3. Simultaneous variations of the sharpness β (a), effective reflection height H′ (b), VLF amplitude (c) and phase (d) excess recorded and simulated, electron density at reference height (e) and X-ray flux (on the right axis (e)) during the occurrence of two successive SFs on 10 May 2013.
Applsci 11 11574 g003
Figure 4. The altitude profile of electron density during two successive SFs on 10 May 2013.
Applsci 11 11574 g004
Figure 5. X-ray flux, amplitude, and phase of NAA signal during strong successive flares on 12 June 2014. (Lower panel) Amplitude and X-ray flux variation; (Upper panel) phase and X-ray flux variation.
Applsci 11 11574 g005
Figure 6. Variations of the sharpness β (a), effective reflection height H′ (b), VLF amplitude (c) and phase (d) recorded and simulated, reference height electron density (e) and X-ray flux (on the right axis (e)), during the occurrence of two successive M-class SFs on 12 June 2014.
Applsci 11 11574 g006
Figure 7. The phase (a) and amplitude (b) of the NAA/24.0 kHz signal along the GCP distance from Maine, USA, to BEL VLF station, Belgrade, obtained for quiet and disturbed ionospheric state during SFs on 12 June 2014.
Applsci 11 11574 g007
Figure 8. The altitude profile of electron density during two successive M-class SFs on 12 June 2014.
Applsci 11 11574 g008
Figure 9. Time variation of X-ray irradiance (on the right axes), NAA/24.00 kHz signal phase (a) and amplitude (b) enhancement during M1.0 (09:06 UT) events on 11 June 2014.
Applsci 11 11574 g009
Figure 10. Variations in the effective reflection height H′, sharpness β and X-ray irradiance during the occurrence of SF on 11 June 2014 are shown in panels from lower to upper, respectively.
Applsci 11 11574 g010
Figure 11. (a) The time delay Δt between the VLF amplitude max and the peak of SF X-ray flux as a function of peak flux (black circles are data from present investigation, red stars data from [27]; (b) Distribution of Δt data points (a rug plot).
Applsci 11 11574 g011
Figure 12. X-ray flux from GOES-15, and Ne (h = 74 km) as a function of UT during two M-class SFs on 12 June 2014. The dashed red line shows results acquired by approximative Equation (5). Ne obtained by the above-mentioned method is presented by circles.
Applsci 11 11574 g012
Figure 13. A scatter plot of a pair of D-region parameters, i.e., H′ versus β, is shown for SID cases analysed in this study using LWPC and two-component exponential model together with ones obtained using flared method from Github project [29].
Applsci 11 11574 g013
Figure 14. Electron-density data (calculated, simulated and approximated) at reference height h = 74 km and maximum of Ix flux during occurrence of different class SFs. The data are compared with results from [16,37,40,41,42]. Area of importance is between the two red lines.
Applsci 11 11574 g014
Table 1. The data on SFs, amplitude and phase perturbations of VLF signals caused by different events analysed in this study.
SF TimSID VLF
Signatures
SF Data
SF
(Class, Date)
Start [UT]Peak [UT]End [UT]ΔA
[dB]
ΔP
[deg]
Δt
[min]
Ix max
XL [Wm−2]
Active Region
M1.3
10.05.2013
12:3712:5613:044.2068.1901.36 × 10−51745
C2.5
10.05.2013
14:3014:3714:421.0619.2012.59 × 10−61745
M1.8
12.06.2014
09:2309:3709:424.5051.4741.81 × 10−52085
M2.7
12.06.2014
10:1410:2110:275.7283.0122.74 × 10−52087
X1.0
11.06.2014
08:5909:0609:105.5490.4531.00 × 10−42087
X1.3
07.09.2017
14:2014:3614:554.5015911.39 × 10−42673
Publisher’s Note: MDPI stays neutral with regard to jurisdictional claims in published maps and institutional affiliations.