Abstract
Driver inattention is the primary cause of vehicle accidents; hence, manufacturers have introduced systems to support the driver and improve safety; nonetheless, advanced driver assistance systems (ADAS) must be properly designed not to become a potential source of distraction for the driver due to the provided feedback. In the present study, an experiment involving auditory and haptic ADAS has been conducted involving 11 participants, whose attention has been monitored during their driving experience. An RGB-D camera has been used to acquire the drivers’ face data. Subsequently, these images have been analyzed using a deep learning-based approach, i.e., a convolutional neural network (CNN) specifically trained to perform facial expression recognition (FER). Analyses to assess possible relationships between these results and both ADAS activations and event occurrences, i.e., accidents, have been carried out. A correlation between attention and accidents emerged, whilst facial expressions and ADAS activations resulted to be not correlated, thus no evidence that the designed ADAS are a possible source of distraction has been found. In addition to the experimental results, the proposed approach has proved to be an effective tool to monitor the driver through the usage of non-invasive techniques.
1. Introduction
The vast majority of vehicle crashes is due to driver’s inattention [1]. Thus, the phenomenon has become a research problem referred to as DADA, driver attention prediction in driving accident scenario [2,3].
To address this danger and ensure driving safety, several monitoring and control tools have been introduced within the vehicles over the years. Adaptive cruise control, active safety brake, parking systems, lane change warning are just a subset of the systems known as advanced driver assistance systems (ADAS) [4], which aim to support the driver in the event of a lapse in attention; however, driver’s inattention could also be caused by excessive automatic support leading to relaxation, as testified by several studies such as Gaspar et al. [5], and even ADAS may become a source of distraction for the driver [6].
Studies for enhancing safe driving encounter the issue that experimental validity should not be achieved at the expense of the safety of the humans involved in the experiment [7], so they must be simulation-based. For this reason, the research community has increasingly focused on virtual reality (VR) simulators: for example, Bozkir et al. [8] aimed to use VR to train drivers in critical situations, Caruso et al. [9] assessed the impact of the level of detail (LOD) on the drivers’ behavior, Gaweesh et al. [10] evaluated safety performance of connected vehicles in mitigating the risk of secondary crashes, and Bakhshi et al. [11] focused on scenarios which involved truck drivers. However, researchers must be careful to make their driver monitoring algorithms robust to the challenges introduced in naturalistic driving conditions such as lighting changes, occlusions and head pose, which are not trivial to be reproduced in a simulator [12].
Driver’s attention is often monitored through basic features retrieved by tools the car is equipped with, such as lane information, inertial sensors and steering operation [13], or by supervising driver’s behavior in terms of head pose, gaze direction, yawning and eye state [14]. The quick development of face expression recognition (FER) and the spread of low-cost 3D cameras observed in the last decade [15] provided the opportunity of introducing new tools within the vehicle and innovative techniques for driver’s supervision; for instance, Ceccacci et al. [16] introduced a conceptual model to adapt the behavior of an emotion-aware vehicle in terms of automation level and support for the driver, by retrieving the driver’s mood from facial expressions acquired through a low-cost camera. Nonetheless, considering all and only facial expressions referring to Ekman’s basic emotions [17], i.e., anger, surprise, disgust, enjoyment, fear, and sadness, plus the neutral state, it is too shortsighted to gather information in all situations. FER implies the possibility of identifying other emotions and states of mind, such as boredom and excitement [18], or engagement and frustration [19]. Driver’s attention [20] is no exception; though, only a few studies about attention detection through FER in the context of driving have been proposed; for instance, Craye et al. [21] used an RGB-D sensor to develop a module for detecting driver distraction and recognizing its specific type, and Kowalczuk et al. [22] introduced a system to monitor the impact of emotions on driver’s attention and, consequently, on driving safety. Nonetheless, several works focused on uncovering the relationship between attention and specific action units (AUs), i.e., relaxation or contraction of one or more facial muscles [23], while others directly dealt with basic emotions. Dubbaka et al. [24] explored the usage of cameras to monitor attention of students in massive open online courses (MOOCs). Roohi et al. [25] introduced a deep learning-based methodology to analyze players’ facial expressions and verify that neural networks, trained with the common six basic emotions, could link the brief moments of intense concentration required to kill enemies to the expression of anger. Sharma et al. [26] proposed a system to figure out the concentration level of students in front of a webcam, identifying concentration with the neutral facial expression. Furthermore, according to Kowalczuk et al. [22], emotions are suppressed over time, hence emotion detection can reveal distraction in specific scenarios.
In our work, a driving simulator was used to carry out an experiment during which users had to drive in a highway VR scenario with several types of ADAS and different types of feedback. A convolutional neural network (CNN) was employed to detect driver’s attention, in order to evaluate if the presence of ADAS could be a potential source of distraction.
The paper is organized as follows. Section 2 describes the experiment, the simulator, the RGB-D camera, and the methodologies adopted to acquire and analyze the data, with a focus on the neural network used for FER. Section 3 presents the data obtained after the experiment and Section 4 provides a discussion of the results; finally, in Section 5, conclusions are drawn looking at possible future improvements.
2. Materials and Methods
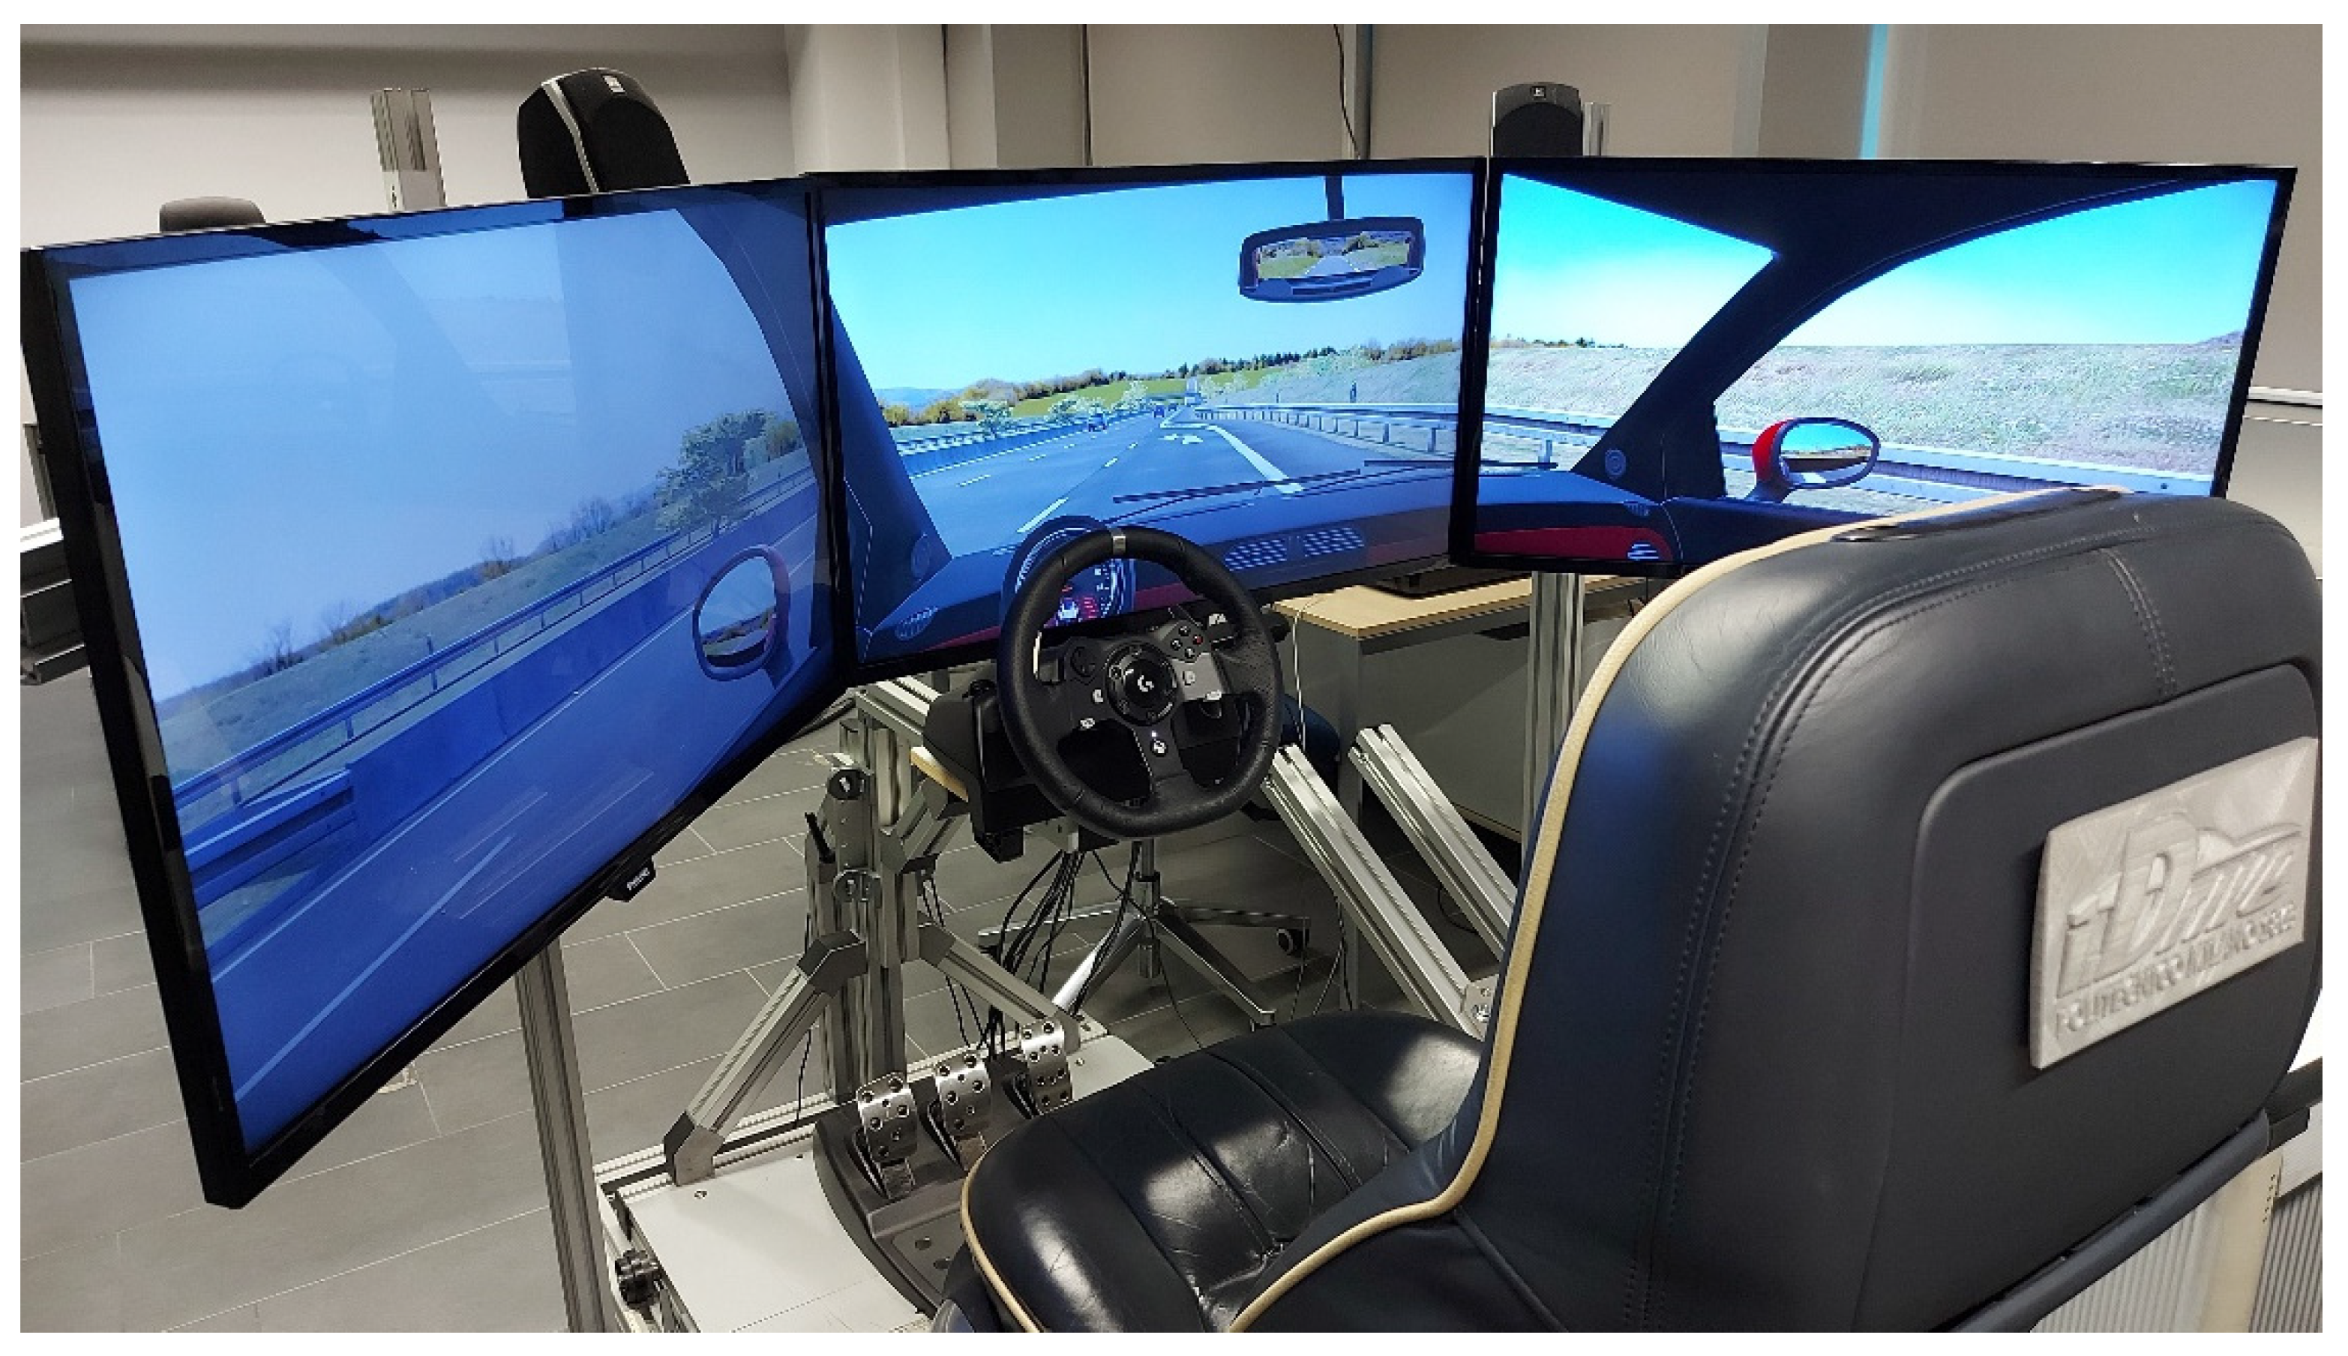
The driving simulator used in this study (Figure 1) is property of the iDrive laboratory of Polytechnic University of Milan and is composed by the following elements: a steering wheel with force feedback, gear shifter with automatic transmission, gas and brake pedals, and adjustable driving seat. Furthermore, three 32″ size monitors display the driving scene; their pixel resolution is 1920 × 1080, 36 degrees of vertical field of view (FoV) and 165 degrees of horizontal FoV. Vibrations and force feedbacks are provided on the steering wheel to improve the realism of the user experience. Unity game engine has been used to build the virtual driving environment and to interface between vehicle controls and multi-modality displays (visual, auditory, and haptic feedback) in simulator system. Data are recorded 10 times per second.

Figure 1.
View of the iDrive driving simulator.
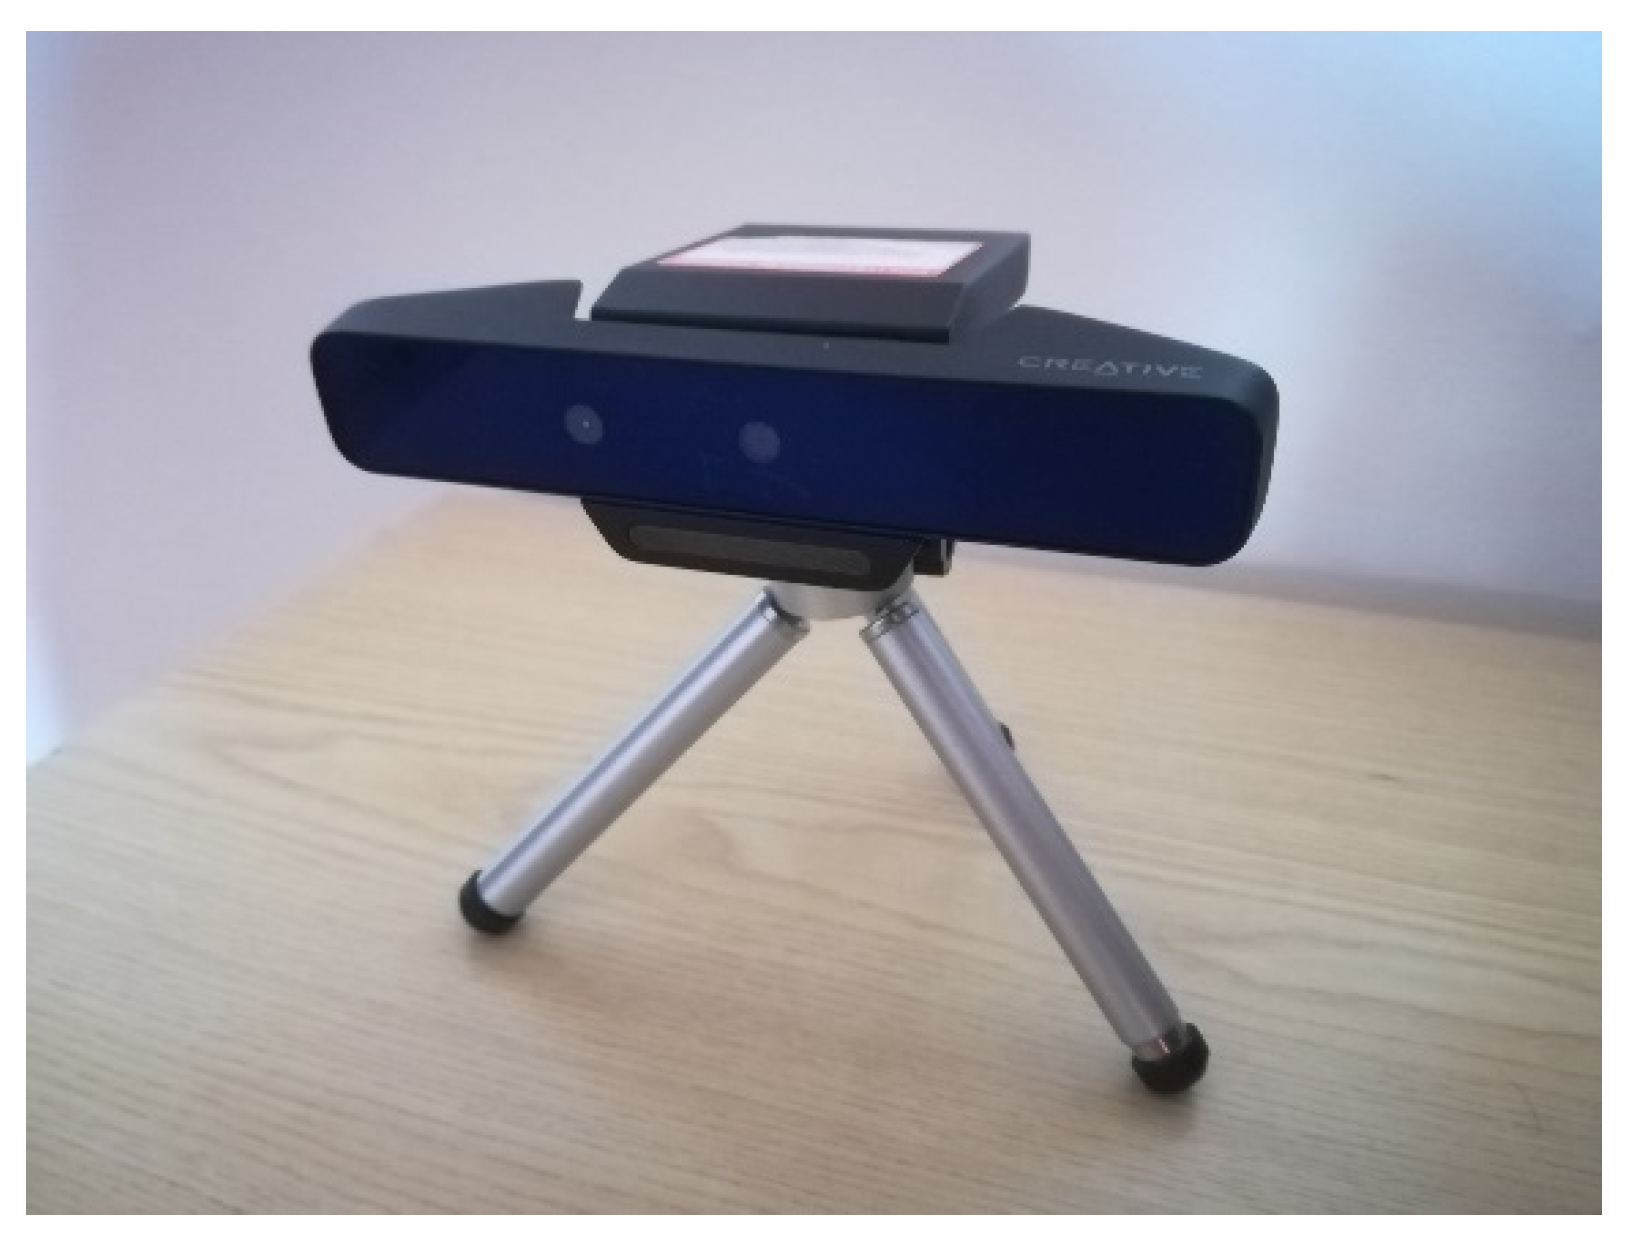
The Intel RealSense SR300 camera has been used to record drivers’ facial expressions during their driving experiences. This device is an RGB-D camera, which allows to retrieve both the color (RGB) and the depth (D) information about a scene. The camera recorded at 30 FPS with a 640 × 480 resolution (Figure 2).

Figure 2.
Intel RealSense SR300.
Eleven participants among men and women between the ages of 22 and 45 joined the experiment. They held a driver’s license and at least 3 years of driving experience. The designed experiment consists of three driving experiences (Figure 3), each of them lasting three minutes: the first one is the training phase, whilst the other two experiences are the testing phase.
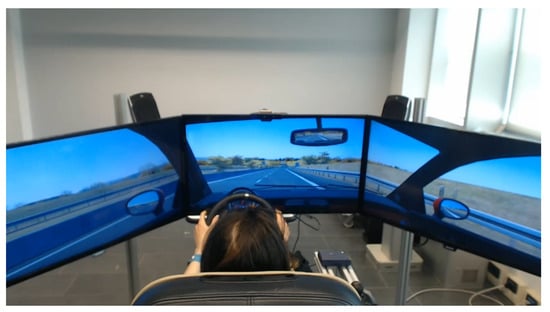
Figure 3.
First driving experience.
During the training phase the driver is asked to drive on a traffic-free highway. This step is mandatory to become familiar with the highway layout and to improve the sensitivity in being responsive to the pedals and to the wheel feedback. The aim is to minimize the learning effect during the testing phase [27] and the emotional response to other elements not belonging to the experiment [28].
During the second and the third driving experiences, the driver is asked to drive on the same highway in moderate traffic conditions. The scenarios have been specifically designed to have a particularly arduous driving experience, through the implementation of a dynamic and unpredictable behavior of other vehicles, such as sudden lane change and screeching halt; hence, the drivers drove in a context where the number of hazards was well above average. In both the scenarios the following ADAS are activated: the speed warning, above 130 km/h and the forward collision warning [29], with two time-to-collision thresholds: 4 s (preliminary alert) and 2 s (possible collision). The difference between the two scenarios is that in one of them the feedback provided by the ADAS is haptic, whilst in the other the feedback is by auditory. A Latin square design has been used for the testing phase to minimize sequencing effects.
An FER analysis has been carried out to monitor driver’s mood during the whole experiment. As mentioned in the previous Section, in order to identify the concentration through a FER methodology, some works ([22,26]) suggest to identify the neutral expression. Furthermore, the present work also considered the assumption that emotion detection can reveal driver’s distraction with particular criticality in the presence of anger, sadness, and emotional agitation, as stated by Dingus et al. [30] in their work about crash risk factors, and, on the contrary, the concentration can be associated with the neutral expression. Furthermore, in regard to the Second Strategic Highway Research Program Naturalistic Driving Study (SHRP 2 NDS), the crash dataset used in that work is highly significative for our experiment for a twofold reason. Firstly, all the stated considerations arise from observations in a naturalistic context, providing a solid foundation for the evaluation of drivers’ emotions; secondly, the scenario referred to in the SHRP 2 NDS is the highway, which is the same environment designed for our experiment.
The FER analysis has been performed using a convolutional neural network (CNN). Each frame is processed singularly. This specific deep learning-based algorithm was chosen in order to have the flexibility to tune the methodology for a purpose that has not been explored yet in the literature, namely, monitoring driver’s attention. Facial expressions are usually classified according to Ekman’s basic emotions; hence, to meet the requirements of this work, and the considerations mentioned above in the study of Dingus et al. as well, a neural network has been specifically trained. In particular, an InceptionV3 model has been chosen, due to its reduced number of trainable parameters compared to other well-known architectures, such as VGG or ResNet. First, the network has been trained on two public databases, BU-3DFE and Bosphorus, to recognize neutral and non-neutral classes. Levels 3 and 4 of BU-3DFE, i.e., the highest in terms of facial expression intensity, have been selected to train the CNN. This choice has been made considering the standard dataset used for FER in literature [31,32,33,34]. Indeed, relying on the study of Dingus et al. [30], to identify driving attention it is necessary to look for moments when the driver does not show emotions (“focused” moments); conversely, when drivers express emotions, distraction is present (“inattentive”). In order to fix the data imbalance problem of the databases, and at the same time to reduce the risk of overfitting, data augmentation [35] has been implemented in the training set to increase the number of neutral images. Data augmentation is a set of techniques, such as rotations, flips, cuts and clippings, color changes, and noise injection, that broaden the available dataset without actually gathering new elements. After trying different configurations, the best results have been obtained using a batch size of 32, Adam optimizer [36] with a learning rate of 0.0001, and the ‘sparse categorical crossentropy’ function to calculate the loss. Furthermore, one Dense layer followed by a dropout layer, used to avoid overfitting, and a subsequent batch normalization layer—used to make the network more stable—have been added to the starting architecture. Then, using transfer learning technique, the model has been fine-tuned on our specific related task, to distinguish focused and inattentive RGB frames captured with the RGB-D camera during the experiment.
In addition to considering facial expressions, accidents (which we also refer to as ‘event occurrences’) and ADAS activations have been monitored during the experiment to reveal possible sources of distraction. For the sake of clarity, events refer to what is not predictable in the driving experiences. In the context of this experiment, event occurrences are accidents due to sudden movements of other vehicles, for instance sudden lane changes. An ADAS activation does not necessarily imply an accident (e.g., the driver exceeds the speed limit or gets too close to another car, but there is no collision, so there is ADAS activation but no accident) and an accident does not necessarily imply an ADAS activations (e.g., the driver hits the guardrail sideways without committing other infractions, so there is not ADAS activation, but only accident). All these data have been gathered instant by instant, so that for each moment it is possible to determine if the facial expression is focused or inactive, if an ADAS has been activated or not and whether an event has occurred.
To assess driver’s concentration, analyses to investigate the linear relationship between facial expressions and ADAS activations, and between facial expressions and event occurrences have been carried out using the Pearson correlation coefficient.
3. Results
Amongst the eleven participants, two subjects have not been recorded properly by the RGB-D camera due to a technical issue; therefore, the results of Participants #5 and #8 are not available. For the sake of clarity, a driving experience ID has been used to identify each driving experience. This code is composed of a number, that identifies each subject (01—first driver, 02—second driver, …, 11—eleventh driver), and a letter, to classify the driving experience according to the feedback provided: “S” stands for sound (auditory feedback), “H” stands for haptic (haptic feedback).
The deep learning-based FER has been carried out to analyze the drivers’ concentration during the driving experiences. The training phase has resulted to be particularly important for the drivers to familiarize with the simulator and to be engaged with the task to accomplish; indeed, since also facial expressions acquired during the training phase have been analyzed to tune the neural network, some users showed to be not completely focused on driving due to some kind of anxiety expressed through nervous smiles. Only in a few driving experiences the user did not show any facial expression; the reason is that the driving experiences were specifically designed to propose a dynamic environment in order to trigger ADAS with an average driving style, hence not aggressive nor overly cautious.
The public dataset consists of 165 and 530 images, respectively for the two classes of neutral and non-neutral facial expressions, divided into training, validation, and testing subsets. After the first pre-training phase, the neural network model reaches a validation accuracy of 91%, similarly to the performance of state-of-the-art methods for monitoring a driver’s emotions [37]. The private dataset consists of 404 frames, equally divided into the focused and inattentive classes, and the CNN has then been empirically tested on all the remaining ones, for a total of 61863. The integration of depth frames to combine depth and RGB information did not improve the overall recognition rate. This issue was caused by the poor depth resolution since the camera was positioned too far from the drivers’ faces. The driving simulator required to position the RGB-D camera on the top of the central monitor; any other position would have obstructed the driver’s view, negatively influencing the experimental validity. The optimal functioning distance is 0.35–0.40 m, while drivers had to seat 0.5 m or further depending on their height, causing a too high loss of information to favorably use depth frames.
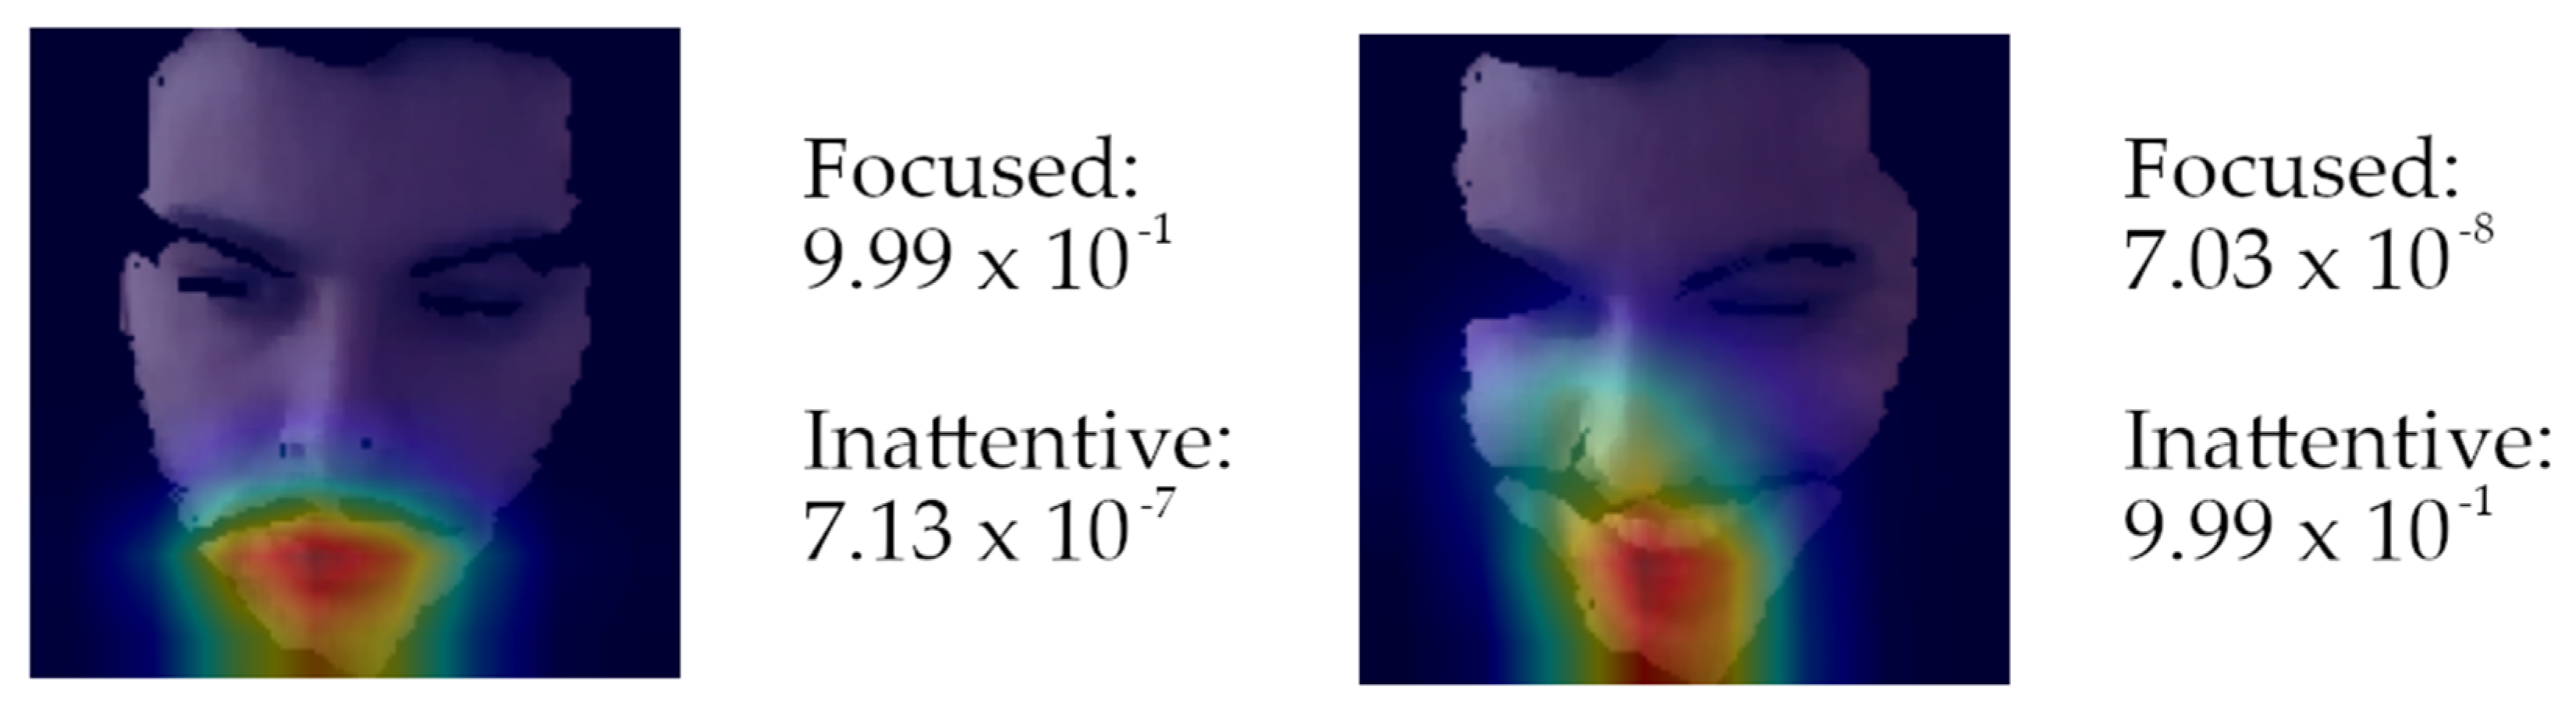
In Figure 4, an example of the testing of two frames with predictions and activation analysis has been reported.
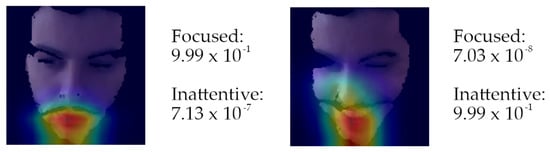
Figure 4.
Predictions and activations analysis of two different frames. These images show the class activation maps of CNN using the Grad-CAM algorithm highlighting the important regions in the image for the result prediction [38].
The FER analysis has been conducted in order to monitor the driver’s concentration. In Figure 5 results of the frame classification provided by the CCN are shown. In particular, green columns represent drivers’ concentration in terms of temporal duration during each driving experience; instead, red columns represent drivers’ inattention. Since all the frames have been split in two classes, values referring to the inattentive frames are dual of the focused ones and have not been reported not to make the visualization too complicated. Values are expressed as percentages.
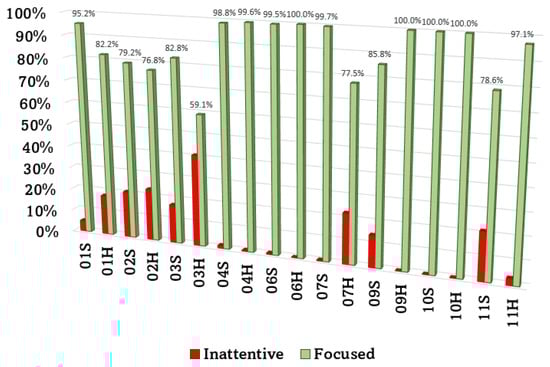
Figure 5.
Drivers’ attention analysis. Percentages are computed on the overall number of frames per driving experience.
Despite videos have been recorded at 30 FPS, in order to make the frame rate coherent with the frequency of acquisition of data related to vehicle (among which events and ADAS activations), 10 frames per second have been analyzed, ensuring to select the frames in the same instants of time of vehicle information, comparing the timestamp for the time alignment. This way it is possible to compute the correlation between the three parameters (events, ADAS activations and facial expressions) for the same moments of time. All the drivers remained focused for most of the time, especially #4 and #6, although only Participant #10 was not distracted at all during either the haptic feedback experience or the sound feedback experience. Driver #3, during the driving experience with haptic feedback, obtained the worst result in terms of concentration (59.1%). In all other experiences, drivers’ concentration percentage was above the 75%.
As reported in Table 1, number of accidents, mainly fender bender, ranges from a minimum of 0 and a maximum of 2 for each driving experience. The ADAS activation values, expressed as a percentage related to the overall time of the session, is reported. Differences between values are mainly related to drivers’ driving style.

Table 1.
Number of accidents and ADAS activation time per driving experience.
In order to understand the causes of driver’s inattention, hence the sources of distraction, correlation analysis both between event occurrences and facial expressions and between ADAS activation and facial expressions have been performed.
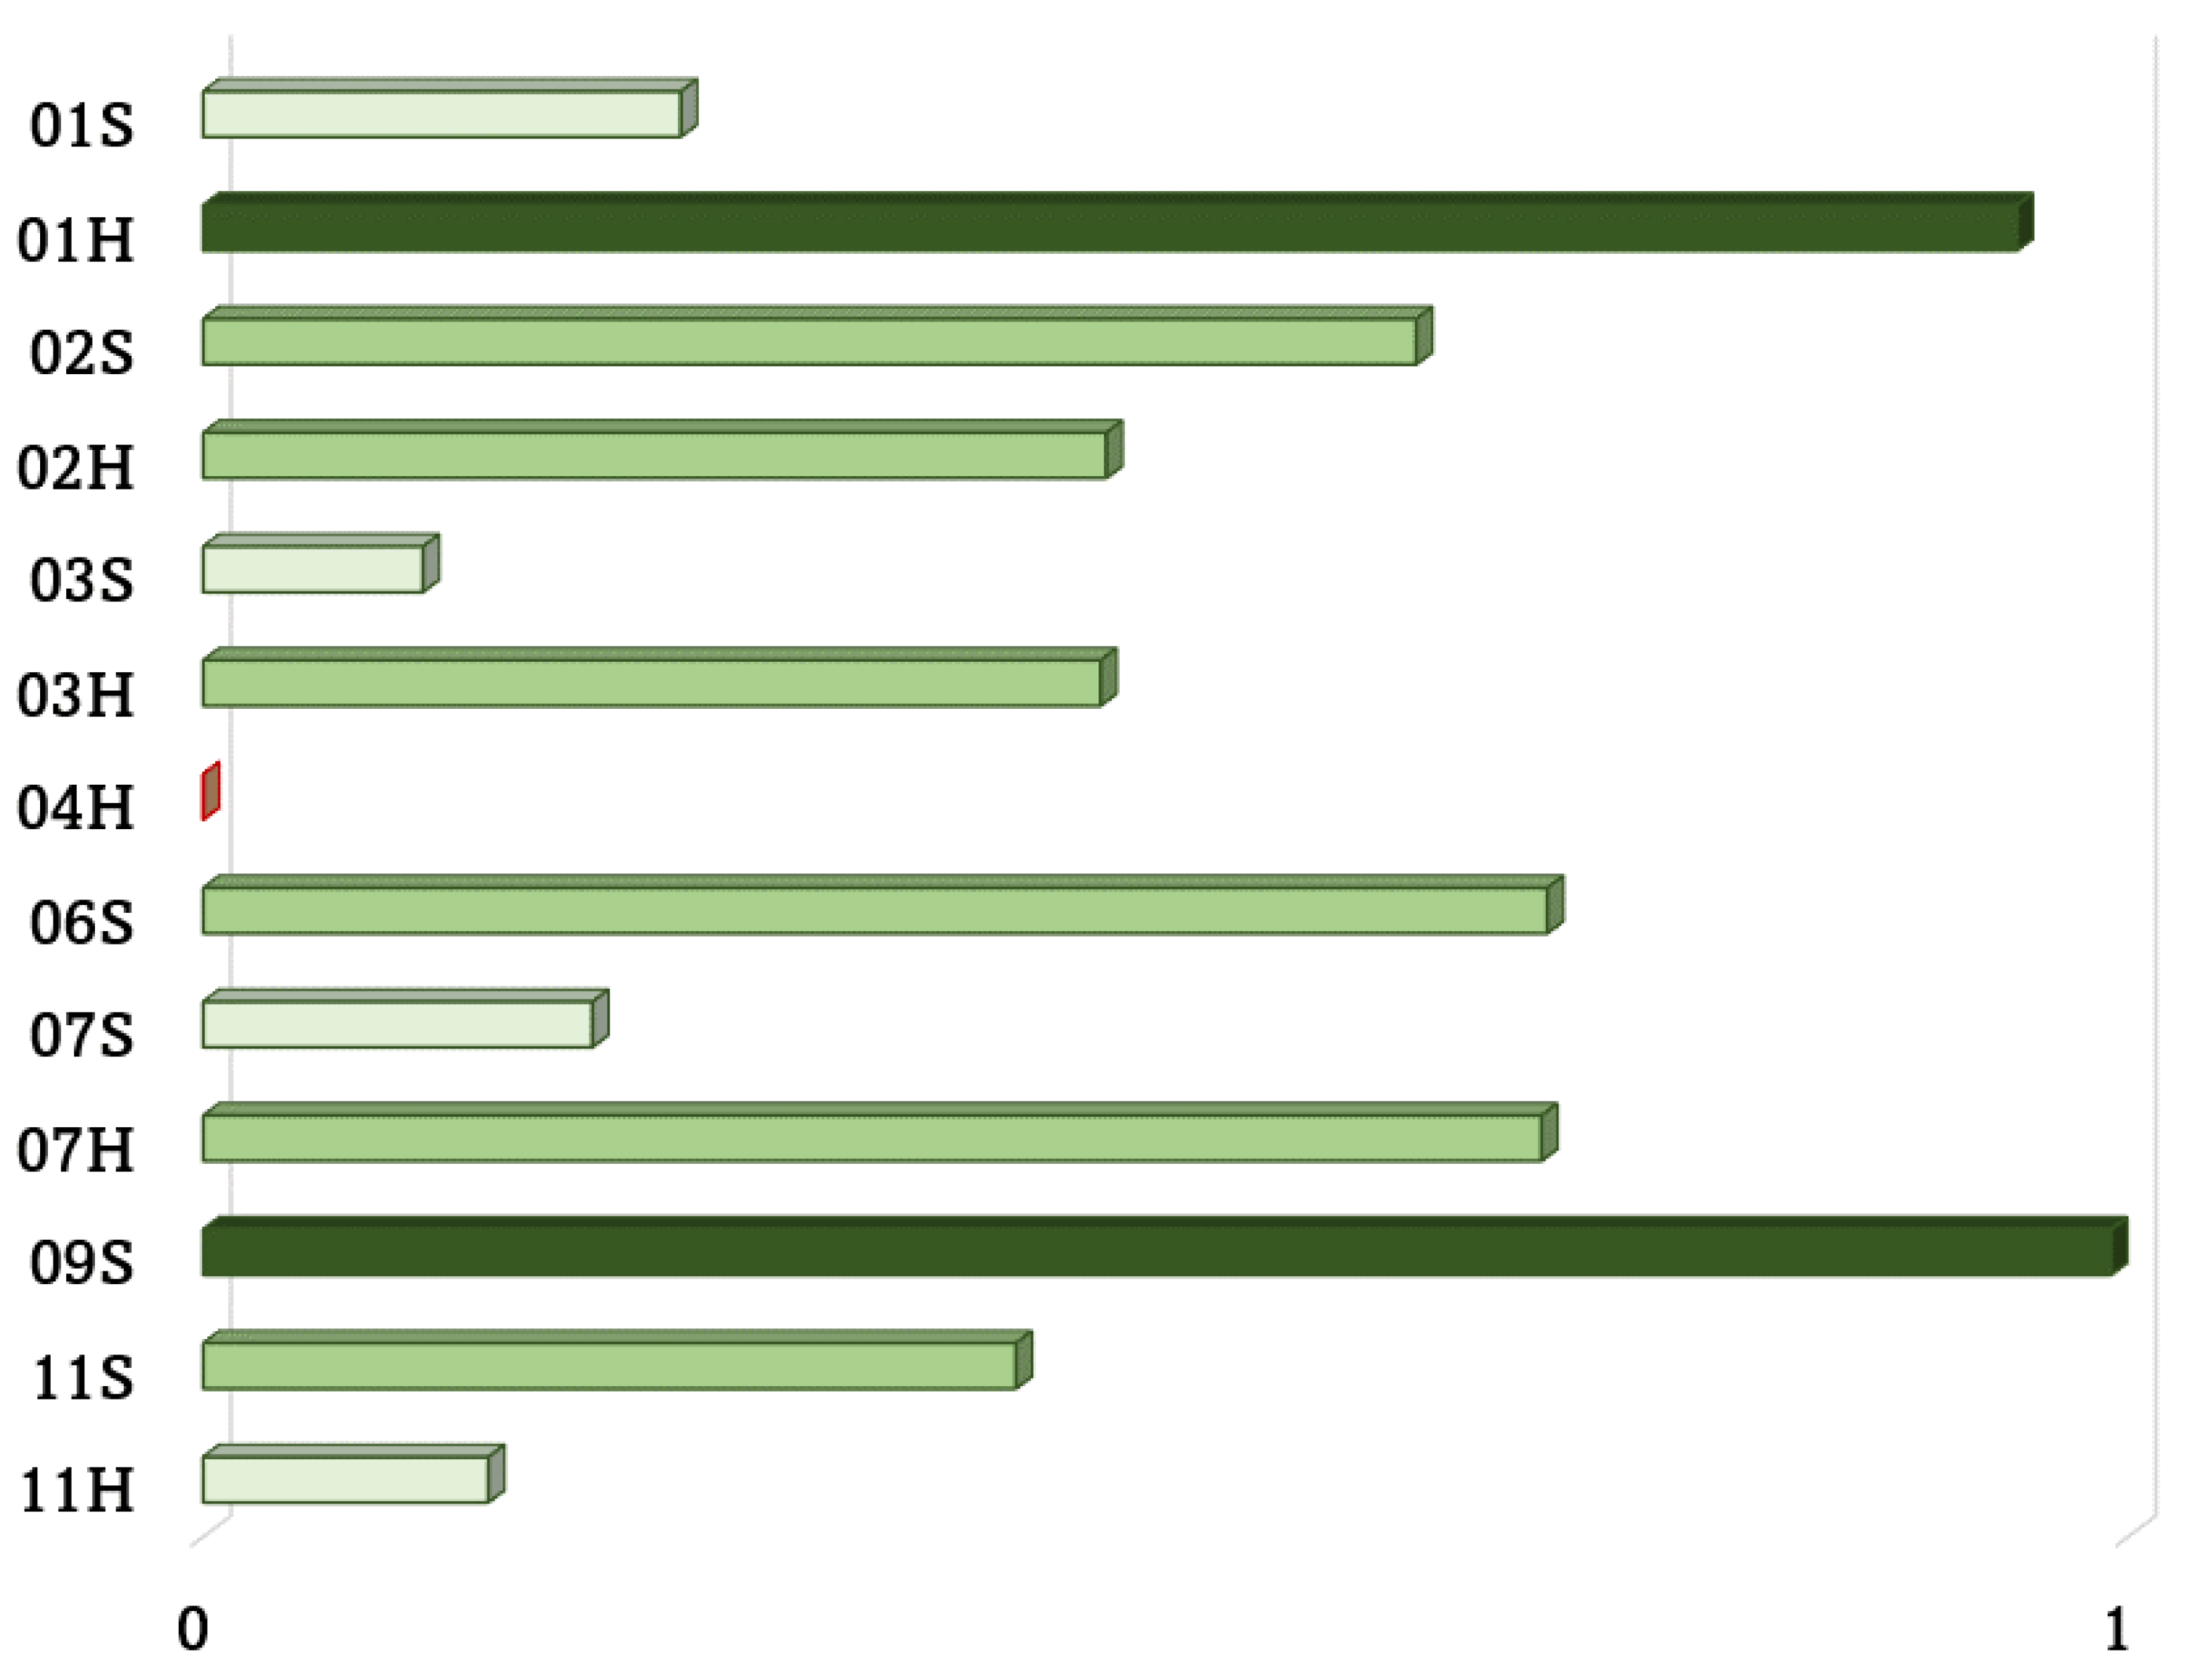
Event occurrences and facial expressions resulted to be correlated in the vast majority of the driving experiences analyzed (Figure 6). Events and ADAS resulted to be triggered depending on users’ driving style. A more aggressive driving style resulted in a greater number of ADAS activations and accidents, whilst a more cautious guidance reduced this number; for instance, one of the participants (#10) never run into an accident nor activated an ADAS during the testing experiences.
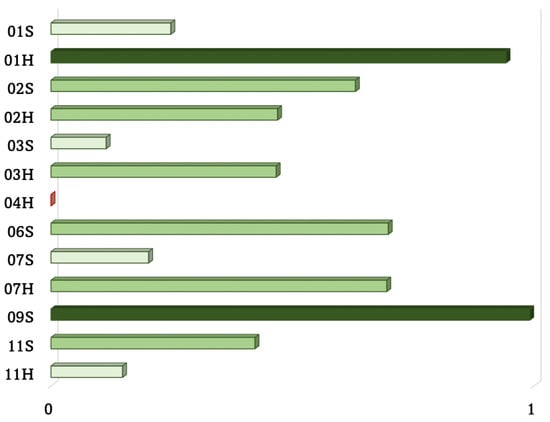
Figure 6.
Strength of correlation between event occurrences and facial expressions.
Some driving experiences have not recorded any event occurrence, thus, the correlation was not computable, for example for both the experiences of Subject #10. The correlation in the other 13 cases was always positive, except from the experience with haptic feedback regarding Subject #4; in particular, as it can be seen in Table 2, a strong positive correlation has been found twice, 01H and 09S, a moderate positive correlation has been noticed for 01S, 02S, 02H, 03H, 06S, 07H, and 11S, and a weak positive correlation has been found for the remaining 01S, 03S, 07S and 11H.
Table 2.
Correlation analysis between event occurrences and facial expressions. The experience ID is composed by a number that identifies a subject.
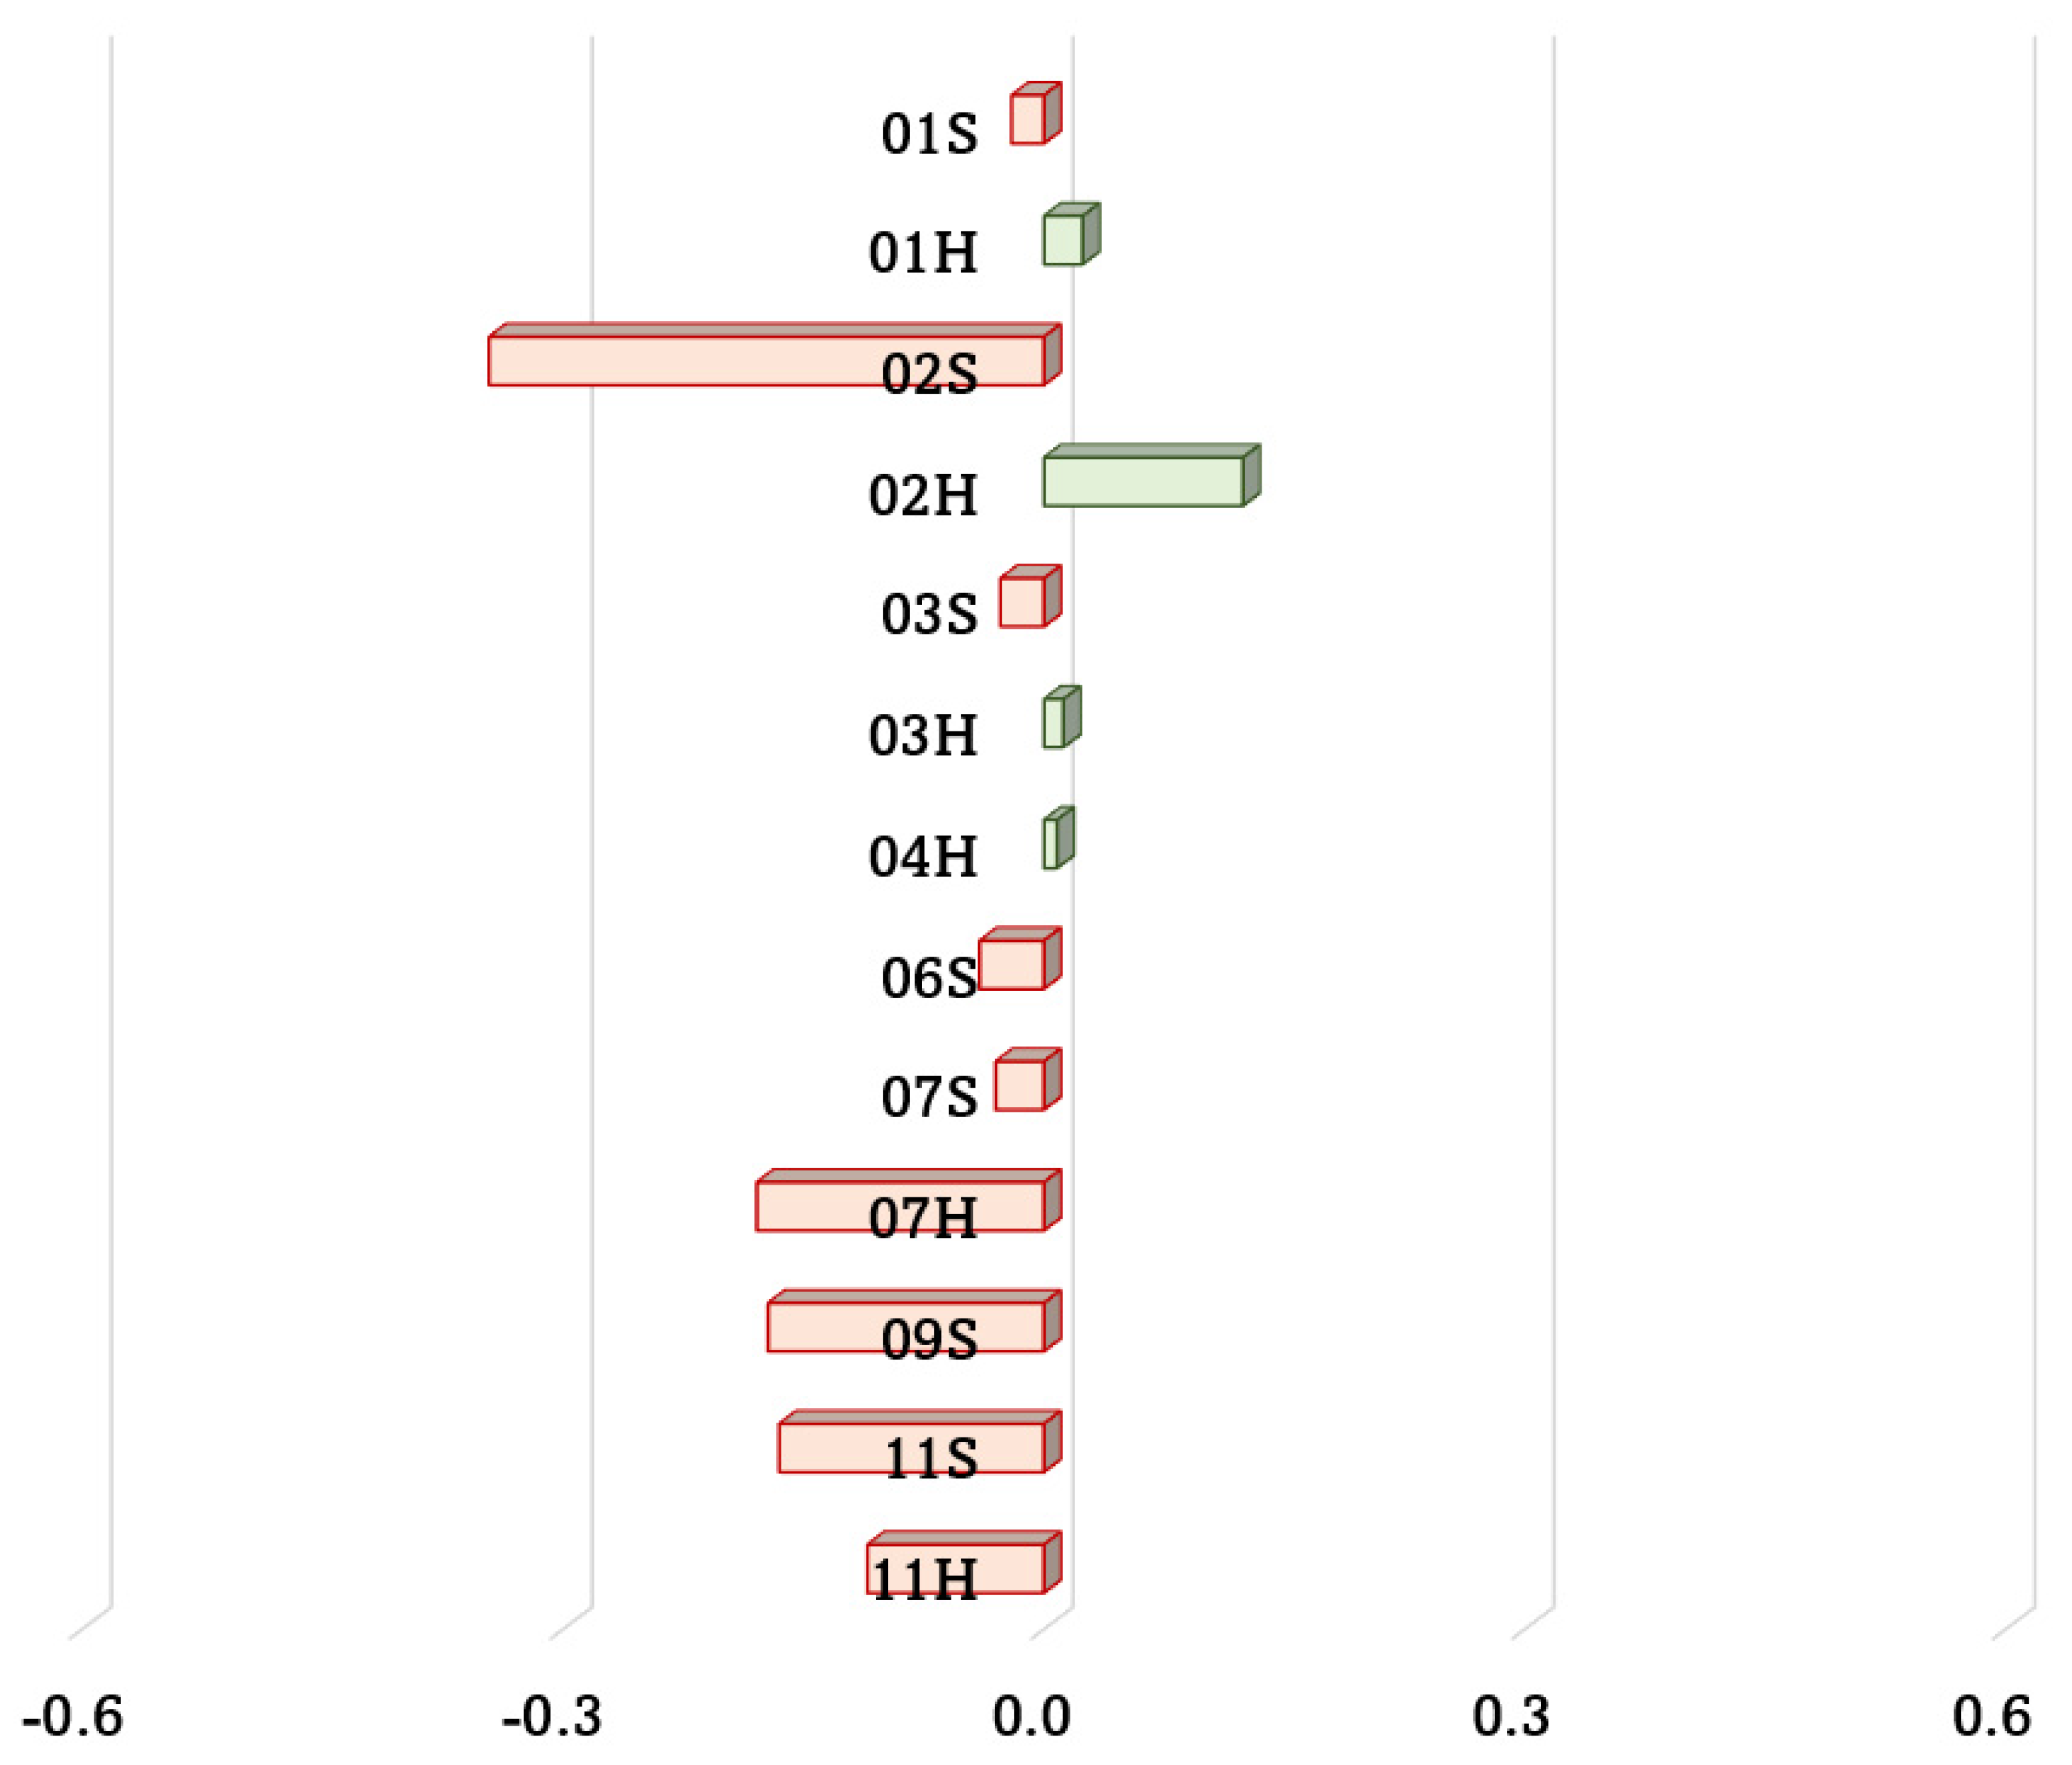
Conversely, ADAS activations and facial expressions resulted to be not positively correlated in any case, with the exception of a weak positive correlation for 02H (Figure 7).

Figure 7.
Strength of correlation between ADAS activations and facial expressions.
As detailed in Table 3, in the vast majority of the driving experiences, either linear correlation can be considered not significant, or a weak negative correlation can be observed. A single moderate linear relationship has been found for 02S, but the correlation is negative.
Table 3.
Correlation analysis between ADAS activations and facial expressions.
4. Discussion
Results obtained through the comparison of event occurrences, ADAS activations and FER lead to the considerations outlined below.
First, there is a correlation between event occurrences and driver’s inattention. Inattention progressively makes the user unable to realize what is happening in the environment and to predict, and thus to react to, other drivers’ behavior [37], resulting in a higher probability of accidents. Nonetheless, there could be a second interpretation observed for this correlation; a user involved in a driving experience using the simulator is focused on his task as long as he is in control of the situation. If a perturbing event occurs, especially an unpredictable one such as an incident, then her/his concentration will reduce until vehicle controls will respond again.
Instead, there is no correlation between designed ADAS activations and drivers’ inattention, at least for what concerns facial expressions. This outcome suggests that the feedbacks provided by ADAS for this experiment have been designed properly, both for sound and haptic, since the driver is not distracted, but rather can receive clues to adjust the driving behavior and to maintain safe driving conditions. The risk of reducing safety benefits is the most important issue when designing ADAS [39], hence a related quantitative analysis is mandatory. In this sense, the adopted strategy for FER has delivered the expected results and proved to be suitable for this purpose. The usage of a deep learning-based methodology on RGB-D images for monitoring the drivers has been chosen to guarantee the experimental validity of data. There are alternative techniques, involving for example physiological data, which can monitor drivers’ concentration or, eventually, other states of mind. These solutions can provide accurate evaluations, yet at the same time could result more invasive due to the need of placing sensors directly on users. In the current work, images have been the only source of information and have guaranteed a user experience as transparent as possible. Experimental validity is critical in doing research and assumes an even more crucial role in a study about concentration, a reason why minimizing the invasiveness was inevitable.
5. Conclusions
A study to monitor driver’s attention through 3D cameras has been successfully pursued. The designed experiment aimed to evaluate the presence of ADAS as a possible source of distraction for the driver using RGB-D images and FER. After a training phase necessary for the drivers to become familiar with the simulator, two driving experiences have been presented to the participants according to a Latin square design. In one of the driving experiences the feedback provided by the ADAS was haptic, whilst in the other one it was auditory. In both cases the users had to drive in a virtual scenario on a highway with moderate traffic. Users have been monitored with an Intel RealSense SR300, an RGB-D camera, and images have been used to identify concentration and inattention with a deep learning-based methodology to fulfill FER.
Results highlighted that drivers have been distracted in case of events, mostly accidents, whilst ADAS did not affect their attention except from a single user in a single scenario; anyway, the linear correlation between ADAS activation and inattentive facial expression for this outlier resulted to be also weak.
RGB-D images coupled with a deep learning-based method has proved to be an effective tool to monitor concentration without being invasive, a particularly useful advantage to preserve the experimental validity, but also for not being a disturbing element for the driver in a naturalistic environment, i.e., on a real car.
ADAS resulted not to be correlated with facial expressions. Future works could investigate whether it is possible to establish the ADAS effectiveness, intended as how much the ADAS feedback is perceived by the user. To this aim, facial micromovements could be studied as possible indicators, possibly integrated with physiological data for increasing the sensitivity, and it should be considered to adapt the deep learning methodology to assess the temporal correlation between facial expressions in different times. Furthermore, the extension of the driving experience sessions could provide more data regarding drivers’ concentration; nonetheless, such a study should take place in a naturalistic context or should require an even more complex scenario to preserve experimental validity not influencing participants’ driving style due to possible recognition of patterns in the unpredictable behavior of the other vehicles.
Author Contributions
Conceptualization, L.U., F.M., F.N., G.C. and E.V.; methodology, L.U., F.N., F.M. and S.M.; software, L.U., F.N. and Y.S.; validation, L.U. and F.N.; formal analysis, L.U., F.N. and S.M.; investigation, L.U., S.M.; resources, G.C. and E.V.; data curation, L.U., F.N. and Y.S.; writing—original draft preparation, L.U. and F.N.; writing—review and editing, S.M., F.M. and G.C.; visualization, L.U., F.N. and Y.S.; supervision, E.V.; project administration, E.V. and G.C.; funding acquisition, E.V. and G.C. All authors have read and agreed to the published version of the manuscript.
Funding
This research received no external funding.
Institutional Review Board Statement
The study was conducted according to the guidelines of the Declaration of Helsinki.
Informed Consent Statement
Informed consent was obtained from all subjects involved in the study.
Data Availability Statement
The data presented in this study are available on request from the corresponding author. The data are not publicly available due to the large size of the acquired dataset.
Conflicts of Interest
The authors declare no conflict of interest.
References
- Dua, I.; Nambi, A.U.; Jawahar, C.V.; Padmanabhan, V. AutoRate: How attentive is the driver? In Proceedings of the 14th IEEE International Conference on Automatic Face and Gesture Recognition, FG 2019, Lille, France, 14–18 May 2019. [Google Scholar]
- Fang, J.; Yan, D.; Qiao, J.; Xue, J.; Yu, H. DADA: Driver Attention Prediction in Driving Accident Scenarios. IEEE Trans. Intell. Transp. Syst. 2021. [Google Scholar] [CrossRef]
- Xia, Y.; Zhang, D.; Kim, J.; Nakayama, K.; Zipser, K.; Whitney, D. Predicting Driver Attention in Critical Situations. In Asian Conference on Computer Vision; Lecture Notes in Computer Science (Including Subseries Lecture Notes in Artificial Intelligence and Lecture Notes in Bioinformatics); Springer: Cham, Switzerland, 2019; Volume 11365, pp. 658–674. [Google Scholar]
- Ziebinski, A.; Cupek, R.; Grzechca, D.; Chruszczyk, L. Review of advanced driver assistance systems (ADAS). AIP Conf. Proc. 2017, 1906, 120002. [Google Scholar] [CrossRef]
- Gaspar, J.; Carney, C. The Effect of Partial Automation on Driver Attention: A Naturalistic Driving Study. Hum. Factors 2019, 61, 1261–1276. [Google Scholar] [CrossRef]
- Ruscio, D.; Bos, A.J.; Ciceri, M.R. Distraction or cognitive overload? Using modulations of the autonomic nervous system to discriminate the possible negative effects of advanced assistance system. Accid. Anal. Prev. 2017, 103, 105–111. [Google Scholar] [CrossRef] [PubMed]
- Shi, Y.; Bordegoni, M.; Caruso, G. User studies by driving simulators in the era of automated vehicle. Comput. Aided. Des. Appl. 2020, 18, 211–226. [Google Scholar] [CrossRef]
- Bozkir, E.; Geisler, D.; Kasneci, E. Assessment of driver attention during a safety critical situation in VR to generate VR-based training. In Proceedings of the SAP 2019: ACM Conference on Applied Perception, Barcelona, Spain, 19–20 September 2019; ACM: New York, NY, USA, 2019. [Google Scholar]
- Caruso, G.; Shi, Y.; Ahmed, I.S.; Ferraioli, A.; Piga, B.; Mussone, L. Driver’s behaviour changes with different LODs of Road scenarios. In Proceedings of the European Transport Conference, Milan, Italy, 9–11 September 2020. [Google Scholar]
- Gaweesh, S.M.; Khoda Bakhshi, A.; Ahmed, M.M. Safety Performance Assessment of Connected Vehicles in Mitigating the Risk of Secondary Crashes: A Driving Simulator Study. Transp. Res. Rec. J. Transp. Res. Board 2021. [Google Scholar] [CrossRef]
- Khoda Bakhshi, A.; Gaweesh, S.M.; Ahmed, M.M. The safety performance of connected vehicles on slippery horizontal curves through enhancing truck drivers’ situational awareness: A driving simulator experiment. Transp. Res. Part F Traffic Psychol. Behav. 2021, 79, 118–138. [Google Scholar] [CrossRef]
- Jha, S.; Marzban, M.F.; Hu, T.; Mahmoud, M.H.; Al-Dhahir, N.; Busso, C. The Multimodal Driver Monitoring Database: A Naturalistic Corpus to Study Driver Attention. IEEE Trans. Intell. Transp. Syst. 2021. [Google Scholar] [CrossRef]
- Nishigaki, M.; Shirakata, T. Driver attention level estimation using driver model identification. In Proceedings of the 2019 IEEE Intelligent Transportation Systems Conference, ITSC 2019, Auckland, New Zealand, 27–30 October 2019; Institute of Electrical and Electronics Engineers Inc.: Piscataway, NJ, USA, 2019; pp. 3520–3525. [Google Scholar]
- Yang, D.; Li, X.; Dai, X.; Zhang, R.; Qi, L.; Zhang, W.; Jiang, Z. All in One Network for Driver Attention Monitoring. In Proceedings of the ICASSP, IEEE International Conference on Acoustics, Speech and Signal Processing, Barcelona, Spain, 4–8 May 2020; Volume 2020, pp. 2258–2262. [Google Scholar]
- Ulrich, L.; Vezzetti, E.; Moos, S.; Marcolin, F. Analysis of RGB-D camera technologies for supporting different facial usage scenarios. Multimed. Tools Appl. 2020, 79, 29375–29398. [Google Scholar] [CrossRef]
- Ceccacci, S.; Mengoni, M.; Andrea, G.; Giraldi, L.; Carbonara, G.; Castellano, A.; Montanari, R. A preliminary investigation towards the application of facial expression analysis to enable an emotion-aware car interface. In International Conference on Human-Computer Interaction; Lecture Notes in Computer Science (Including Subseries Lecture Notes in Artificial Intelligence and Lecture Notes in Bioinformatics); Springer: Berlin/Heidelberg, Germany, 2020; Volume 12189, pp. 504–517. [Google Scholar]
- Ekman, P. An Argument for Basic Emotions. Cogn. Emot. 1992, 6, 169–200. [Google Scholar] [CrossRef]
- Cowen, A.S.; Keltner, D. Self-report captures 27 distinct categories of emotion bridged by continuous gradients. Proc. Natl. Acad. Sci. USA 2017, 114, E7900–E7909. [Google Scholar] [CrossRef] [Green Version]
- Grafsgaard, J.F.; Wiggins, J.B.; Boyer, K.E.; Wiebe, E.N.; Lester, J.C. Automatically recognizing facial expression: Predicting engagement and frustration. In Proceedings of the 6th International Conference on Educational Data Mining, (EDM 2013), Memphis, TN, USA, 6–9 July 2013. [Google Scholar]
- Borghi, G. Combining Deep and Depth: Deep Learning and Face Depth Maps for Driver Attention Monitoring. arXiv 2018, arXiv:1812.05831. [Google Scholar]
- Craye, C.; Karray, F. Driver distraction detection and recognition using RGB-D sensor. arXiv 2015, arXiv:1502.00250. [Google Scholar]
- Kowalczuk, Z.; Czubenko, M.; Merta, T. Emotion monitoring system for drivers. IFAC-PapersOnLine 2019, 52, 440–445. [Google Scholar] [CrossRef]
- Tornincasa, S.; Vezzetti, E.; Moos, S.; Violante, M.G.; Marcolin, F.; Dagnes, N.; Ulrich, L.; Tregnaghi, G.F. 3D facial action units and expression recognition using a crisp logic. Comput. Aided. Des. Appl. 2019, 16. [Google Scholar] [CrossRef]
- Dubbaka, A.; Gopalan, A. Detecting Learner Engagement in MOOCs using Automatic Facial Expression Recognition. In Proceedings of the IEEE Global Engineering Education Conference, EDUCON, Porto, Portugal, 27–30 April 2020; Volume 2020, pp. 447–456. [Google Scholar]
- Roohi, S.; Takatalo, J.; Matias Kivikangas, J.; Hämäläinen, P. Neural network based facial expression analysis of game events: A cautionary tale. In Proceedings of the CHI PLAY 2018 Annual Symposium on Computer-Human Interaction in Play, Melbourne, VIC, Australia, 28–31 October 2018; Association for Computing Machinery, Inc.: New York, NY, USA, 2018; pp. 59–71. [Google Scholar]
- Sharma, P.; Esengönül, M.; Khanal, S.R.; Khanal, T.T.; Filipe, V.; Reis, M.J.C.S. Student concentration evaluation index in an E-learning context using facial emotion analysis. In Proceedings of the International Conference on Technology and Innovation in Learning, Teaching and Education, Thessaloniki, Greece, 20–22 June 2019; Springer: Berlin/Heidelberg, Germany, 2019; Volume 993, pp. 529–538. [Google Scholar]
- Meyer, O.A.; Omdahl, M.K.; Makransky, G. Investigating the effect of pre-training when learning through immersive virtual reality and video: A media and methods experiment. Comput. Educ. 2019, 140, 103603. [Google Scholar] [CrossRef]
- Varao-Sousa, T.L.; Smilek, D.; Kingstone, A. In the lab and in the wild: How distraction and mind wandering affect attention and memory. Cogn. Res. Princ. Implic. 2018, 3, 1–9. [Google Scholar] [CrossRef] [PubMed]
- Aksan, N.; Sager, L.; Hacker, S.; Marini, R.; Dawson, J.; Anderson, S.; Rizzo, M. Forward Collision Warning: Clues to Optimal Timing of Advisory Warnings. SAE Int. J. Transp. Saf. 2016, 4, 107–112. [Google Scholar] [CrossRef] [PubMed] [Green Version]
- Dingus, T.A.; Guo, F.; Lee, S.; Antin, J.F.; Perez, M.; Buchanan-King, M.; Hankey, J. Driver crash risk factors and prevalence evaluation using naturalistic driving data. Proc. Natl. Acad. Sci. USA 2016, 113, 2636–2641. [Google Scholar] [CrossRef] [Green Version]
- Lemaire, P.; Ardabilian, M.; Chen, L.; Daoudi, M. Fully automatic 3D facial expression recognition using differential mean curvature maps and histograms of oriented gradients. In Proceedings of the 2013 10th IEEE International Conference and Workshops on Automatic Face and Gesture Recognition (FG), Shanghai, China, 22–26 April 2013. [Google Scholar]
- Li, H.; Sun, J.; Xu, Z.; Chen, L. Multimodal 2D+3D Facial Expression Recognition with Deep Fusion Convolutional Neural Network. IEEE Trans. Multimed. 2017, 19, 2816–2831. [Google Scholar] [CrossRef]
- Sui, M.; Zhu, Z.; Zhao, F.; Wu, F. FFNet-M: Feature Fusion Network with Masks for Multimodal Facial Expression Recognition. In Proceedings of the 2021 IEEE International Conference on Multimedia and Expo (ICME), Shenzhen, China, 5–9 July 2021; pp. 1–6. [Google Scholar]
- Li, H.; Sui, M.; Zhu, Z.; Zhao, F. MFEViT: A Robust Lightweight Transformer-based Network for Multimodal 2D+3D Facial Expression Recognition. arXiv 2021, arXiv:2109.13086. [Google Scholar]
- Shorten, C.; Khoshgoftaar, T.M. A survey on Image Data Augmentation for Deep Learning. J. Big Data 2019, 6, 60. [Google Scholar] [CrossRef]
- Kingma, D.P.; Ba, J.L. Adam: A method for stochastic optimization. In Proceedings of the 3rd International Conference on Learning Representations, ICLR 2015—Conference Track Proceedings, International Conference on Learning Representations, ICLR, San Diego, CA, USA, 7–9 May 2015. [Google Scholar]
- Shams, Z.; Naderi, H.; Nassiri, H. Assessing the effect of inattention-related error and anger in driving on road accidents among Iranian heavy vehicle drivers. IATSS Res. 2021, 45, 210–217. [Google Scholar] [CrossRef]
- Selvaraju, R.R.; Cogswell, M.; Das, A.; Vedantam, R.; Parikh, D.; Batra, D. Grad-CAM: Visual Explanations from Deep Networks via Gradient-Based Localization. Int. J. Comput. Vis. 2020, 128, 336–359. [Google Scholar] [CrossRef] [Green Version]
- Hungund, A.P.; Pai, G.; Pradhan, A.K. Systematic Review of Research on Driver Distraction in the Context of Advanced Driver Assistance Systems. Transp. Res. Rec. J. Transp. Res. Board 2021. [Google Scholar] [CrossRef]


Publisher’s Note: MDPI stays neutral with regard to jurisdictional claims in published maps and institutional affiliations. |
© 2021 by the authors. Licensee MDPI, Basel, Switzerland. This article is an open access article distributed under the terms and conditions of the Creative Commons Attribution (CC BY) license (https://creativecommons.org/licenses/by/4.0/).