Article

Influence of Aeration Method on Gaseous Emissions and the Losses of the Carbon and Nitrogen during Cow Manure Composting

1
College of Resources and Environmental Sciences, Gansu Agricultural University, Lanzhou 730070, China
2
Gansu Province Engineering Research Center for the Resource Utilization of Livestock and Poultry Wastes, Lanzhou 730070, China
*
Author to whom correspondence should be addressed.
Appl. Sci. 2021, 11(24), 11639; https://doi.org/10.3390/app112411639
Submission received: 19 November 2021 / Revised: 3 December 2021 / Accepted: 4 December 2021 / Published: 8 December 2021

Abstract

:
The objective of this research was to explore the effects of different aeration methods on NH3 and greenhouse gas (GHG) emissions and the losses of carbon and nitrogen from composting of cow manure and corn stalks in the laboratory-scale reactors. Here, we designed three treatments, including continuous aerated treatment C1 (aeration rates 0.21 L·kg−1 dry matter (DM)·min1) and intermittent aerated treatments I1 (aeration rates 0.42 L·kg−1 DM·min1; aerate 10 min, stop 10 min) and I2 (aeration rates 0.84 L·kg−1 DM·min1; aerate 5 min, stop 15 min). The results showed that the physicochemical parameters (temperature, pH values, and germination index) of composting products met the requirements of maturity and sanitation. Compared with continuous aerated treatment C1, the cumulative NH3 emissions of I1 and I2 treatments decreased by 24.37% and 19.27%, while the cumulative CO2 emissions decreased by 13.01% and 20.72%. On the contrary, the cumulative N2O emissions of I1 and I2 treatments increased by 22.22% and 43.14%. CO2 emission was the principal pathway for the TOC losses, which comprised over 65% of TOC losses. C1 treatment had the highest TOC losses due to its highest cumulative CO2 emissions. The TN losses of I1 and I2 treatments reduced 9.07% and 6.1% compared to C1 treatment, so the intermittent aerated modes could reduce the TN loss. Due to the potential for mitigation of gaseous emissions, I1 treatment was recommended to be used in aerobic composting of cow manure.

1. Introduction

Aerobic composting is a significant and sustainable technology that is extensively used for utilizing organic waste. Composting not only reduces the quantity of organic waste, but also the composting products can be used as an effective organic fertilizer [1,2]. However, gaseous emissions of secondary byproducts including NH3 and greenhouse gas during aerobic composting are a serious pollution threat to the environment [3]. Unwanted discharge causes loss of nutrients, thus decreasing the compost product quality [4].
NH3 and greenhouse gases are produced as the chief secondary pollution of composting. NH3 is volatilized from NH4+-N formation by the ammonification of degradable organic nitrogen at optimum pH and higher temperature [3,5]. Previous studies [6,7,8] have reported the N losses of NH3 emission accounted for 9.6–46% of the initial total nitrogen. CO2 is regarded as the main byproduct of C losses during composting, 70–85% of total organic carbon is lost in the form of CO2 [4]. Although N2O and CH4 are emitted in small amounts during composting, studies based on a 100-year period have estimated that N2O and CH4 are crucial GHGs, and the global warming potentials of them are 298 and 25 times higher than that of CO2 [9]. CH4 is emitted by extensive labile carbon compounds under strictly anaerobic conditions; therefore, proper aeration management is vital to reducing CH4 emissions [3,10,11]. N2O can be produced not only by the denitrification pathway but also by nitrification pathway [12,13,14]. Different research indicated that N2O emissions occur at different stages. Awasthi et al. [15] examined that vast quantities of N2O was produced during the thermophilic phase, while Hellmann et al. [16] indicated that significant N2O was emitted primarily during the maturation phase.
NH3 and GHG emissions during aerobic composting are significantly affected by factors such as C/N ratio, temperature, water content, aeration condition, additives, pH, and pile scale. Among these factors, aeration condition is considered a critical factor determining the gaseous emissions and nitrogen transformation [3]. Deficient aeration rate and decreasing aeration frequency may result in anaerobic conditions and thus increase the emissions of CH4 and N2O, while NH3 volatilization leads to acidification and eutrophication of ecosystems [17,18]. On the contrary, excess aeration rate can limit microbial activity due to the losses of heat and moisture of composting materials [4,19]. This study aims to approach the effects of different aerated modes on gaseous emissions and reduce the losses of carbon and nitrogen caused by gas emissions. It provided useful strategies for reducing atmospheric environmental pollution and valuable information for solving problems of gaseous emission and nutrient losses during composting.

2. Materials and Methods

2.1. Composting Materials

Cow manure was collected from Xinhao dairy farm in Baiyin, China. Corn stalks were taken from farmland in Yuzhong county, China and cut into small pieces of 1–2 cm. The properties of composting materials are shown in Table 1.

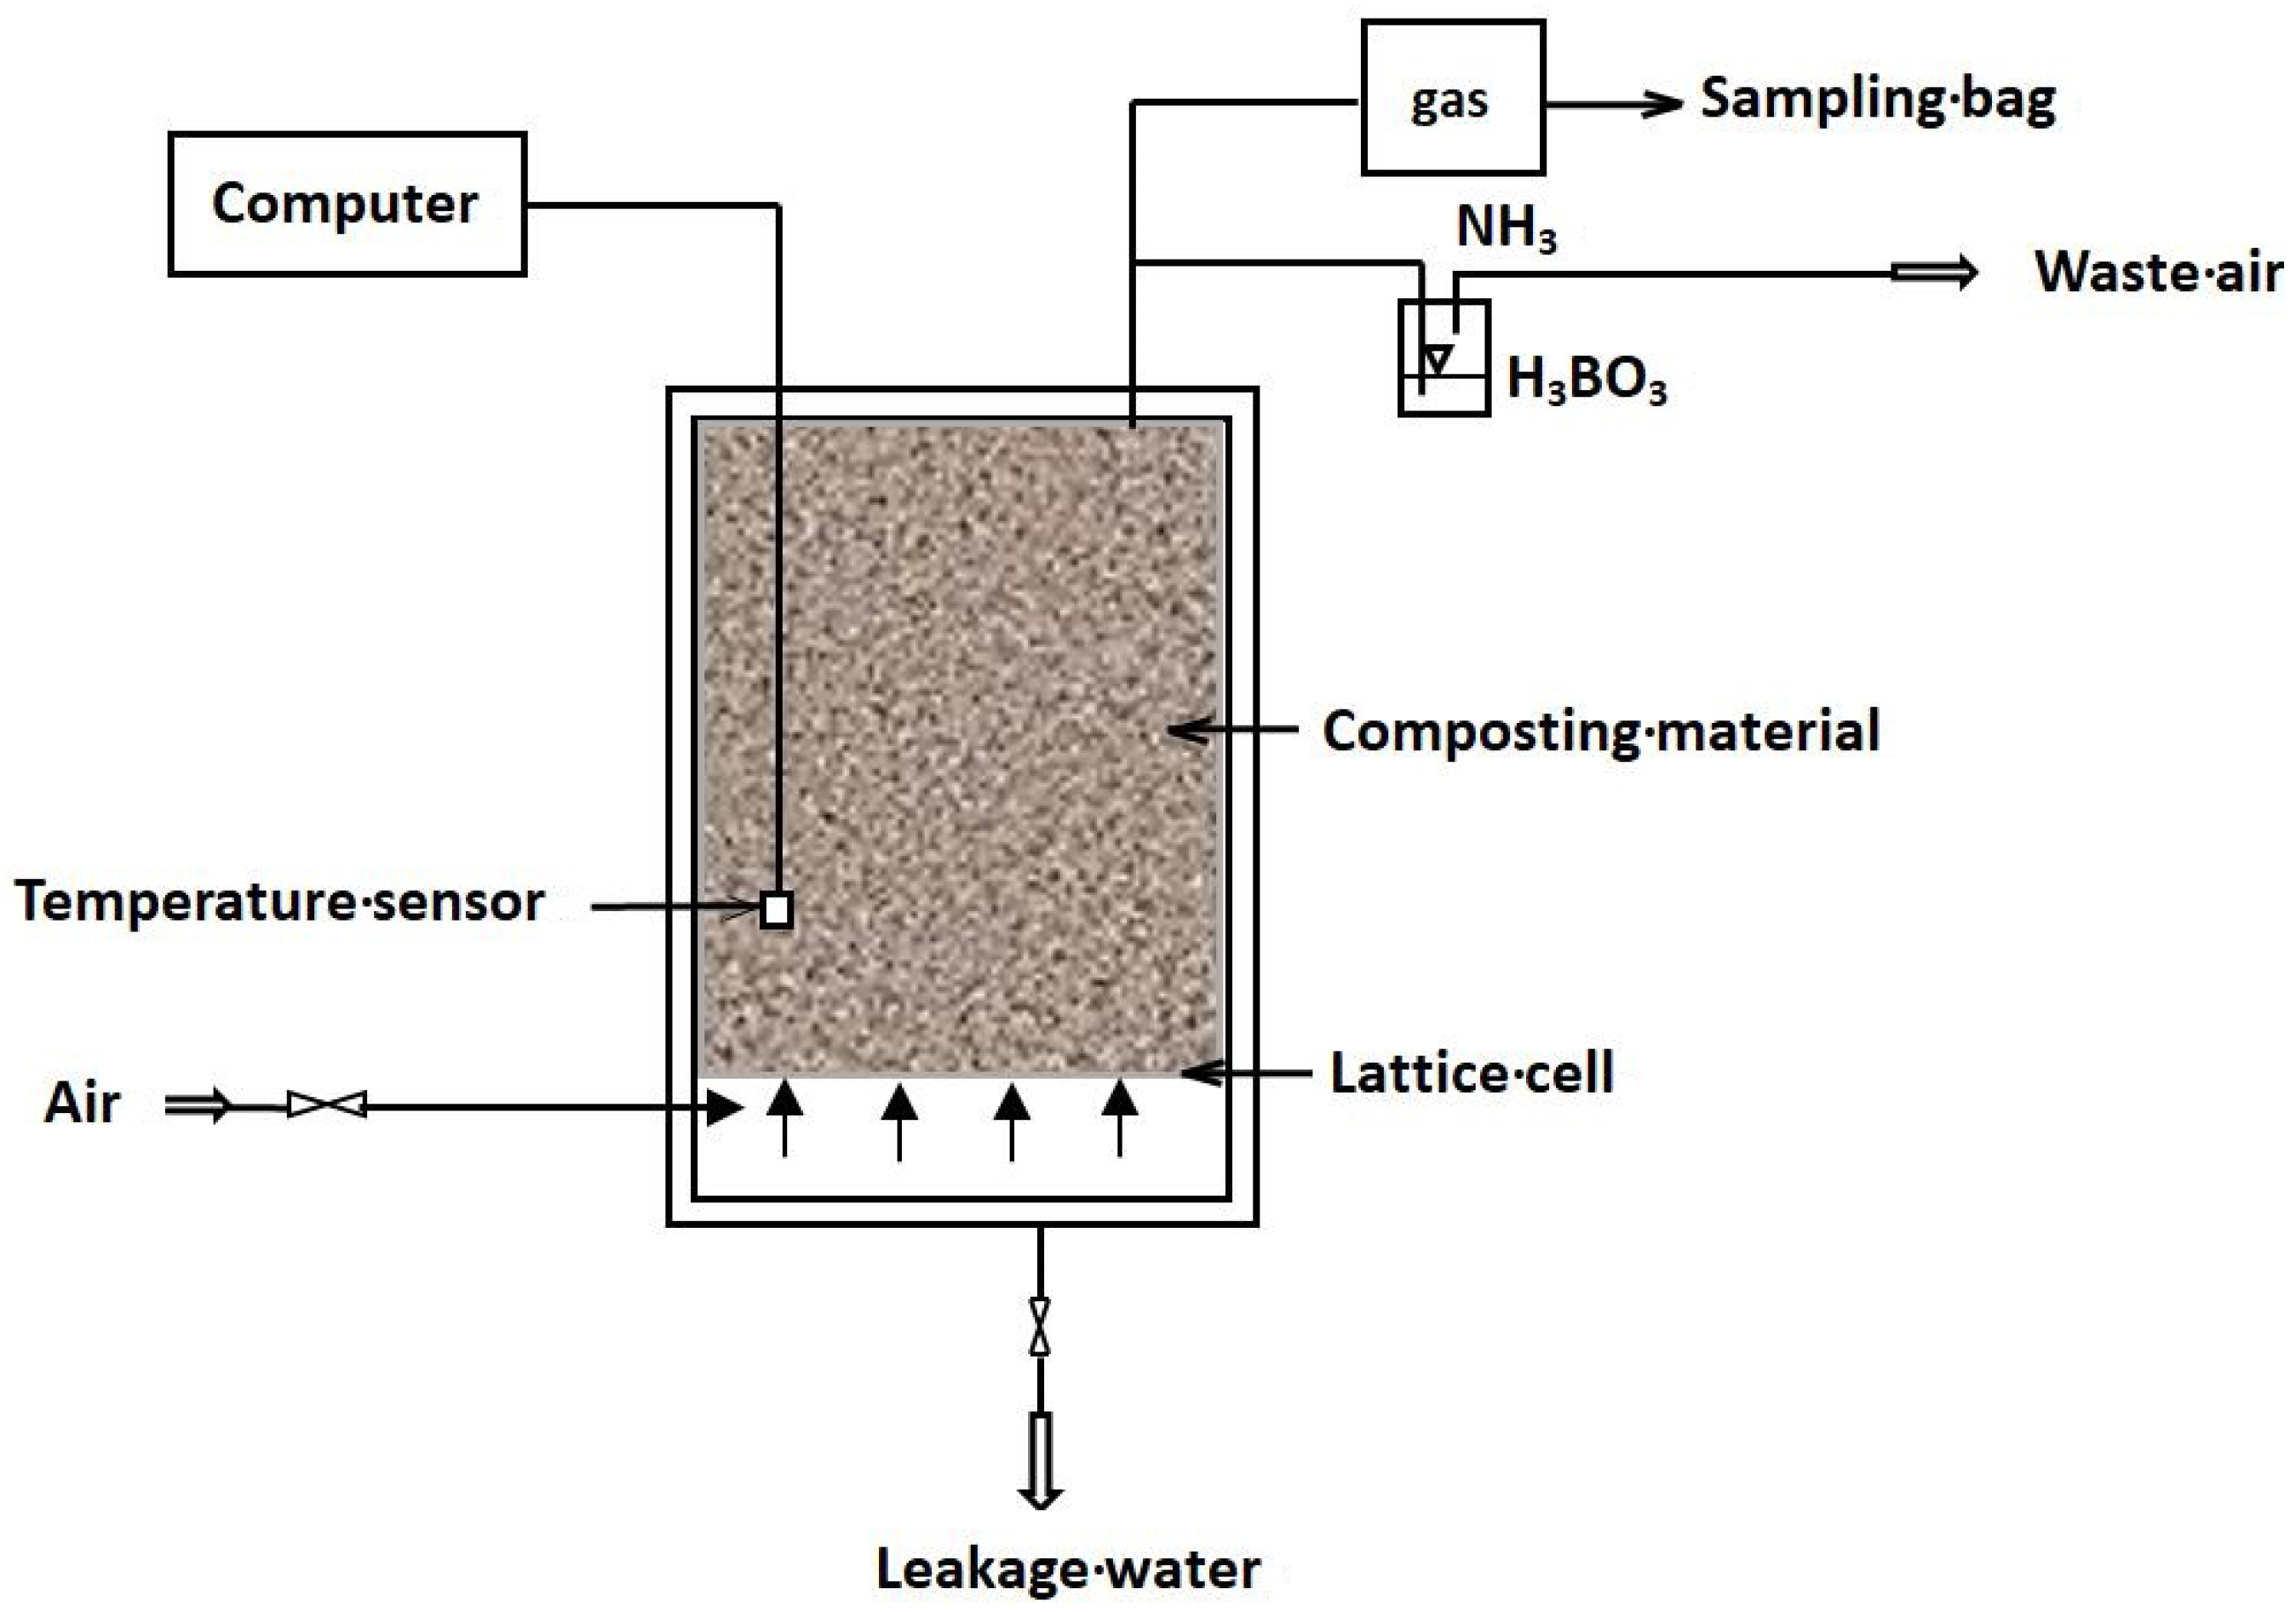
2.2. Experimental Equipment and Design

Composting experiment was carried out in a laboratory-scale forced aeration composting system (Figure 1). The composting system was custom-designed with approximately 60 L cylindrical stainless steel reactors (0.36 m internal diameter, 0.60 m internal high) with a ventilation control system [13]. Each reactor was designed with a vacuum interlayer to prevent heat loss. The temperature data were recorded automatically by the temperature control system. Air pumps provide air, and the airflow rates to each reactor were controlled by a rotameter.
Composting experiments were conducted using a mixture of cow manure and corn stalk under conditions of the initial moisture content of 60% and C/N ratio of 29.35. As shown in Table 2, the experiment was assigned to three treatments that had the same average aeration rate and different aeration method. Triplicate reactors were used for each treatment, and each reactor used a similar compost mixture. The composting period lasted 20 days.

2.3. Sampling and Analysis Methods

An approximately 100-g solid sample was collected from each reactor after manually mixing the material inside the reactor on Day 0, 2, 4, 8, 12, 16 and 20. Samples were kept into two parts. One was kept in a refrigerator at 4 °C to measure pH, germination index (GI), NO3-N and NH4+-N, while another was air-dried and ground to pass through a 0.1 mm sieve for determination of TN and TOC content. TN and TOC were measured using the methods described by the Chinese National Agricultural Organic Fertilizer Standard [20]. The GI and pH values were determined according to Jiang et al. [13]. NH4+-N and NO3-N were extracted with 0.01 mol/L CaCl2 solution (1:10, v/v) and analyzed using a continuous flow analyzer (Skalar San, The Netherlands).
The NH3 was absorbed in boric acid (2%), and then titrated using 0.05 M H2SO4 [13]. Gaseous samples were collected daily during the first 10 days and every two days during the last 10 days by syringes into the gas sampling bags (Aluminum foil-0.2 L, China Ningbo Hongpu Technology Co., Ltd., Ningbo, China). The GHG (CO2, CH4 and N2O) samples were analyzed by a gas chromatograph equipped with FID and ECD (Agilent 7890B, Santa Clara, CA, USA). Data for non-measured days were calculated by averaging the closest measured days; meanwhile, the cumulative emissions were obtained from the daily flux.
The seed germination index (GI) was measured based on Wang et al. [21]. The TOC and TN loss were calculated according to Chen et al. [10]. The gaseous emission loss (NH3-N, N2O-N, CH4-C, and CO2-C) was analyzed based on the formulas as described by Tong et al. [22].

2.4. Statistical Analysis

Each data point was the mean value (±SD) of three replicates, and the results were processed using Microsoft Excel (version 2010). The statistical analysis was performed with the one-way ANOVA analysis method at a significance level of p < 0.05 using SPSS software Version 22.0 in this study. Origin 2018 was used to generate the figures. Relationships among the physicochemical characteristics and gaseous emission were assessed with the redundancy analysis (RDA) function in the Vegan package of R software.

3. Results

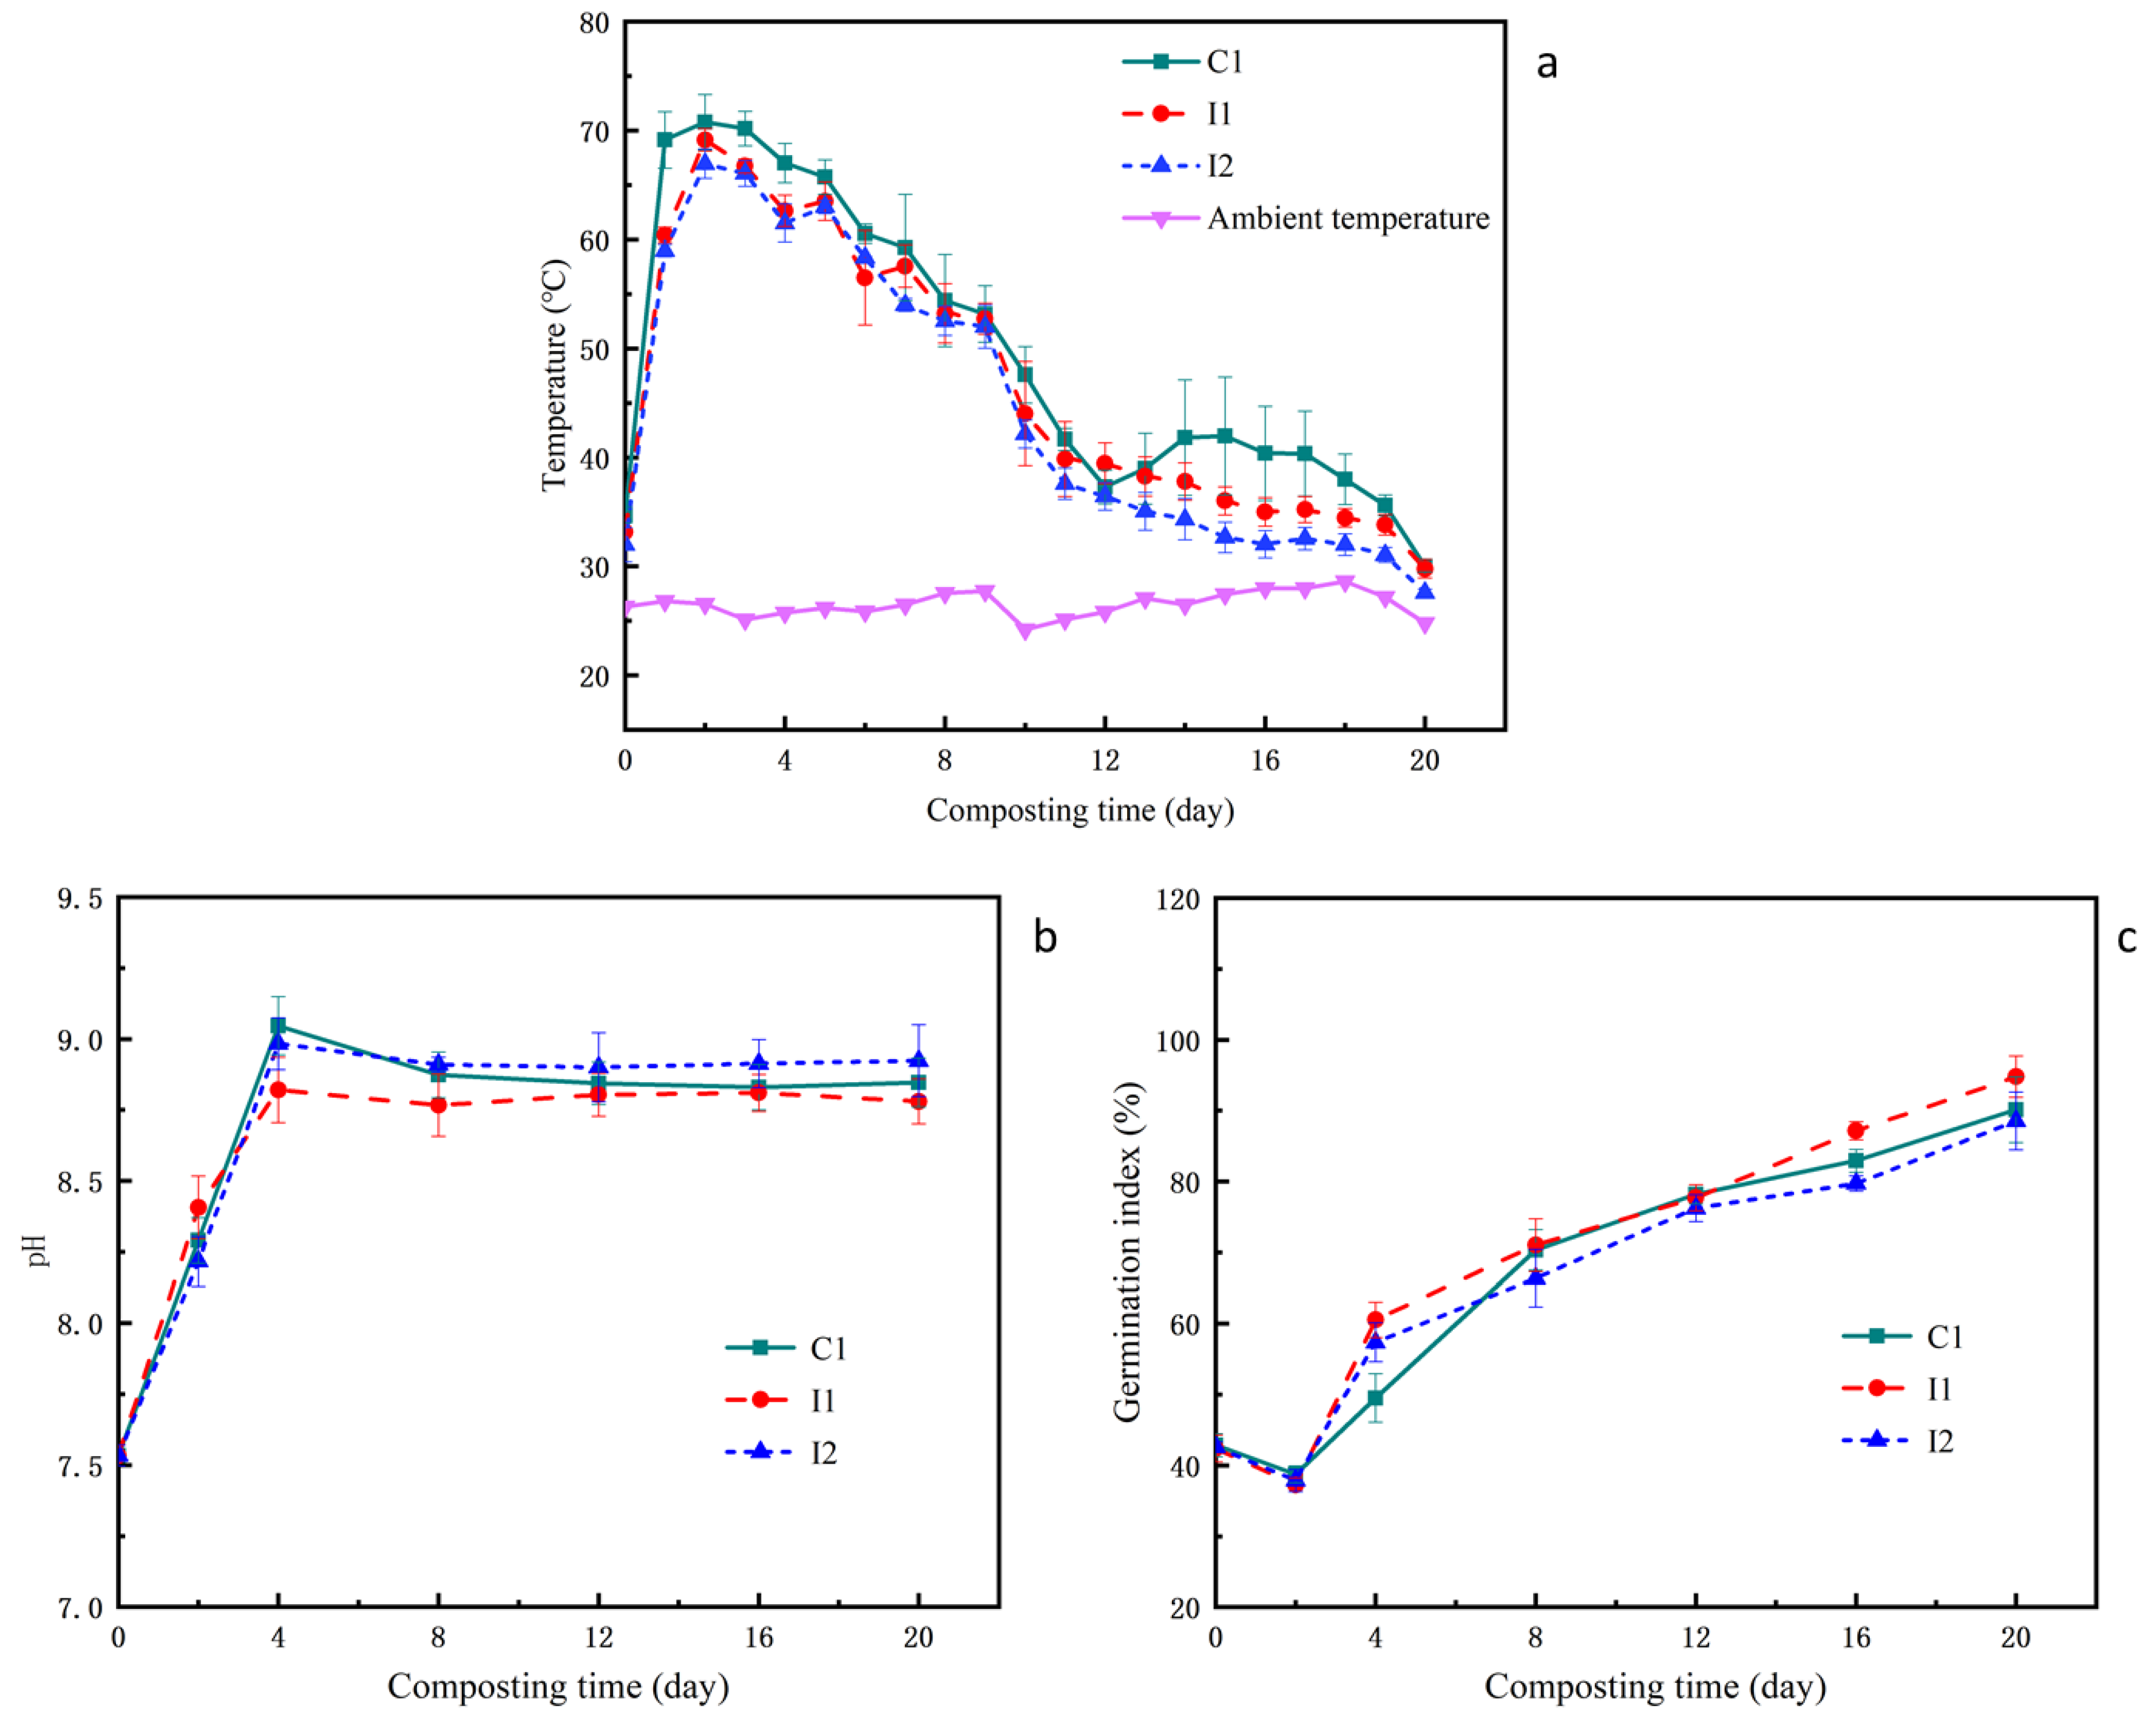
3.1. Variations in Temperature, pH, and GI during the Composting
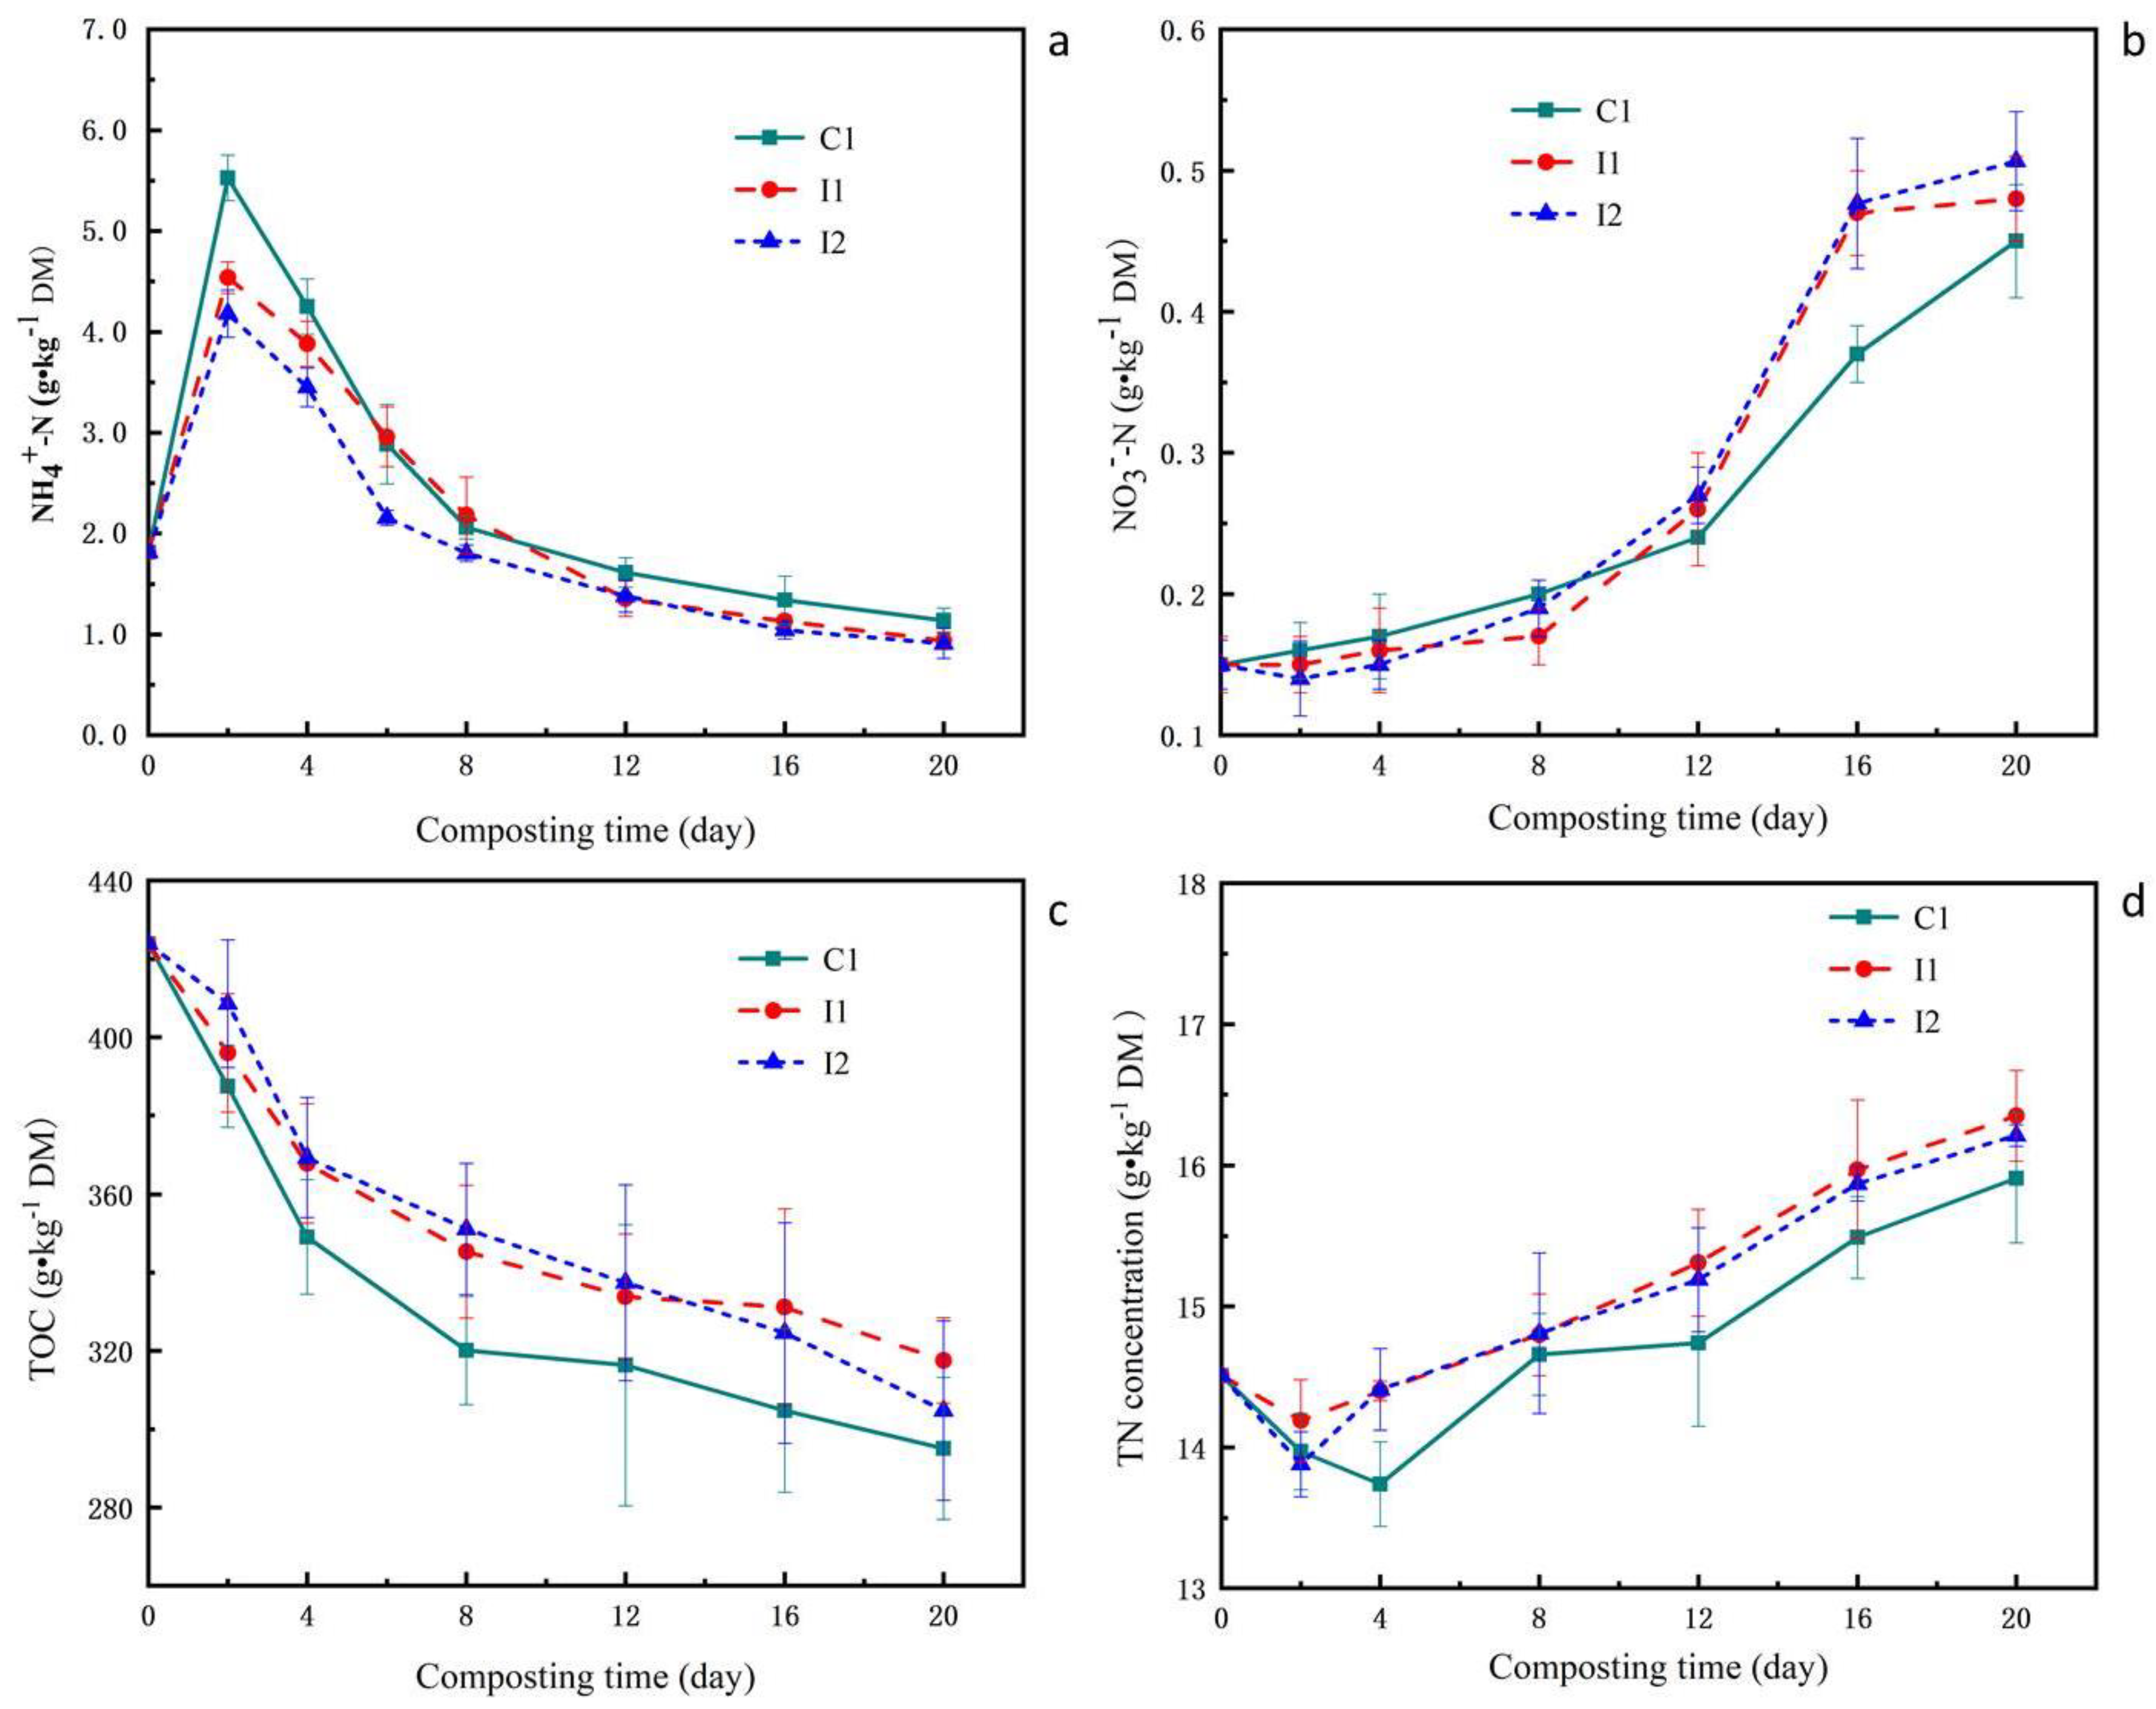
The temperatures in the three treatments increased sharply at the beginning of composting and exceeded more than 65 °C within 2 days (Figure 2a). Subsequently, the temperature of the three treatments gradually decreased. The peak values of C1, I1 and I2 reached 70.77 °C, 69.15 °C and 66.96 °C on day 2, respectively. By the end of composting, the temperature of the three treatments was close to the ambient temperature, which was lower than 30 °C. Compared with C1 and I1, the temperature of I2 is lowest owing to the higher heat loss by a high instantaneous aeration rate.
As shown in Figure 2b, the pH values of the C1, I1, and I2 increased from initial pH 7.53 to peak pH 9.05, 8.82, and 8.98 on day 4, respectively. After Day 4, the pH values of the three runs slightly decreased and then stabilized until the end of composting. The pH values of C1, I1, and I2 treatments were 8.85, 8.82 and 8.92 on day 20, respectively. ANOVA showed no significant differences among the three treatments.
The GI of C1, I1, and I2 were 42.85%, 42.39% and 42.59% at day 0 (Figure 2c), respectively. The GI of the three treatments decreased during the early phase and then increased and exceeded 80% on day 16. The GI of C1, I1, and I2 treatments eventually reached 90.14%, 94.79% and 88.56% at day 20, respectively.

3.2. Variations in NH4+-N, NO3-N, TN, and TOC during the Composting

The accumulation of NH4+-N is mainly due to the mineralization and ammonification of organic nitrogen. As shown in Figure 3a, NH4+-N content showed a trend of increasing first (from day 0 to 2) and then decreasing in three treatments. The NH4+-N content in C1, I1, and I2 increased from initial 1.82 g/kg DM to the peak 5.53 g/kg DM, 4.54 g/kg DM and 4.18 g/kg DM on day 2, respectively. Afterward, NH4+-N content kept going down. NH4+-N content was decreased to 1.14 g/kg DM, 0.94 g/kg DM and 0.91 g/kg DM on day 20. By the end of composting, the final NH4+-N content of C1, I1, and I2 treatments decreased by 37.4%, 48.4% and 49.9%, respectively.
The initial NO3-N concentrations of the three treatments were low and the growth rates were slight at the initial phase of the composting process (Figure 3b). The NO3-N concentrations in C1, I1, I2 increased from 0.20, 0.17, 0.19 g/kg DM on day 8 to the 0.45, 0.48, 0.51 g/kg DM on day 20, respectively. The NO3-N content of C1 treatment was significantly lower than that of I1 and I2 treatments.
The TOC content in all the treatments decreased gradually during the composting process (Figure 3c). The rates of TOC degradation in the thermophilic phase were slightly higher than those in the curing period. At the end of composting, the TOC contents of C1, I1, and I2 were 295.10 g/kg, 317.56 g/kg, 304.78 g/kg, and the TOC losses were 51.26%, 47.55%, 49.66%, respectively. Higher TOC loss occurred with the C1 treatment compared with I1 and I2.
As shown in Figure 3d, TN content showed a trend of slightly decreasing first and then increasing in the three treatments during the whole composting process. The minimum TN content value was detected in the C1 treatment on day 4 and I1 and I2 treatments on day 2. The TN content of C1, I1, and I2 peaked at the end of composting with 15.91 g/kg DM, 16.35 g/kg DM and 16.21 g/kg DM, respectively. During the whole composting process, the TN content of C1 treatment was lower than that of I1 and I2.

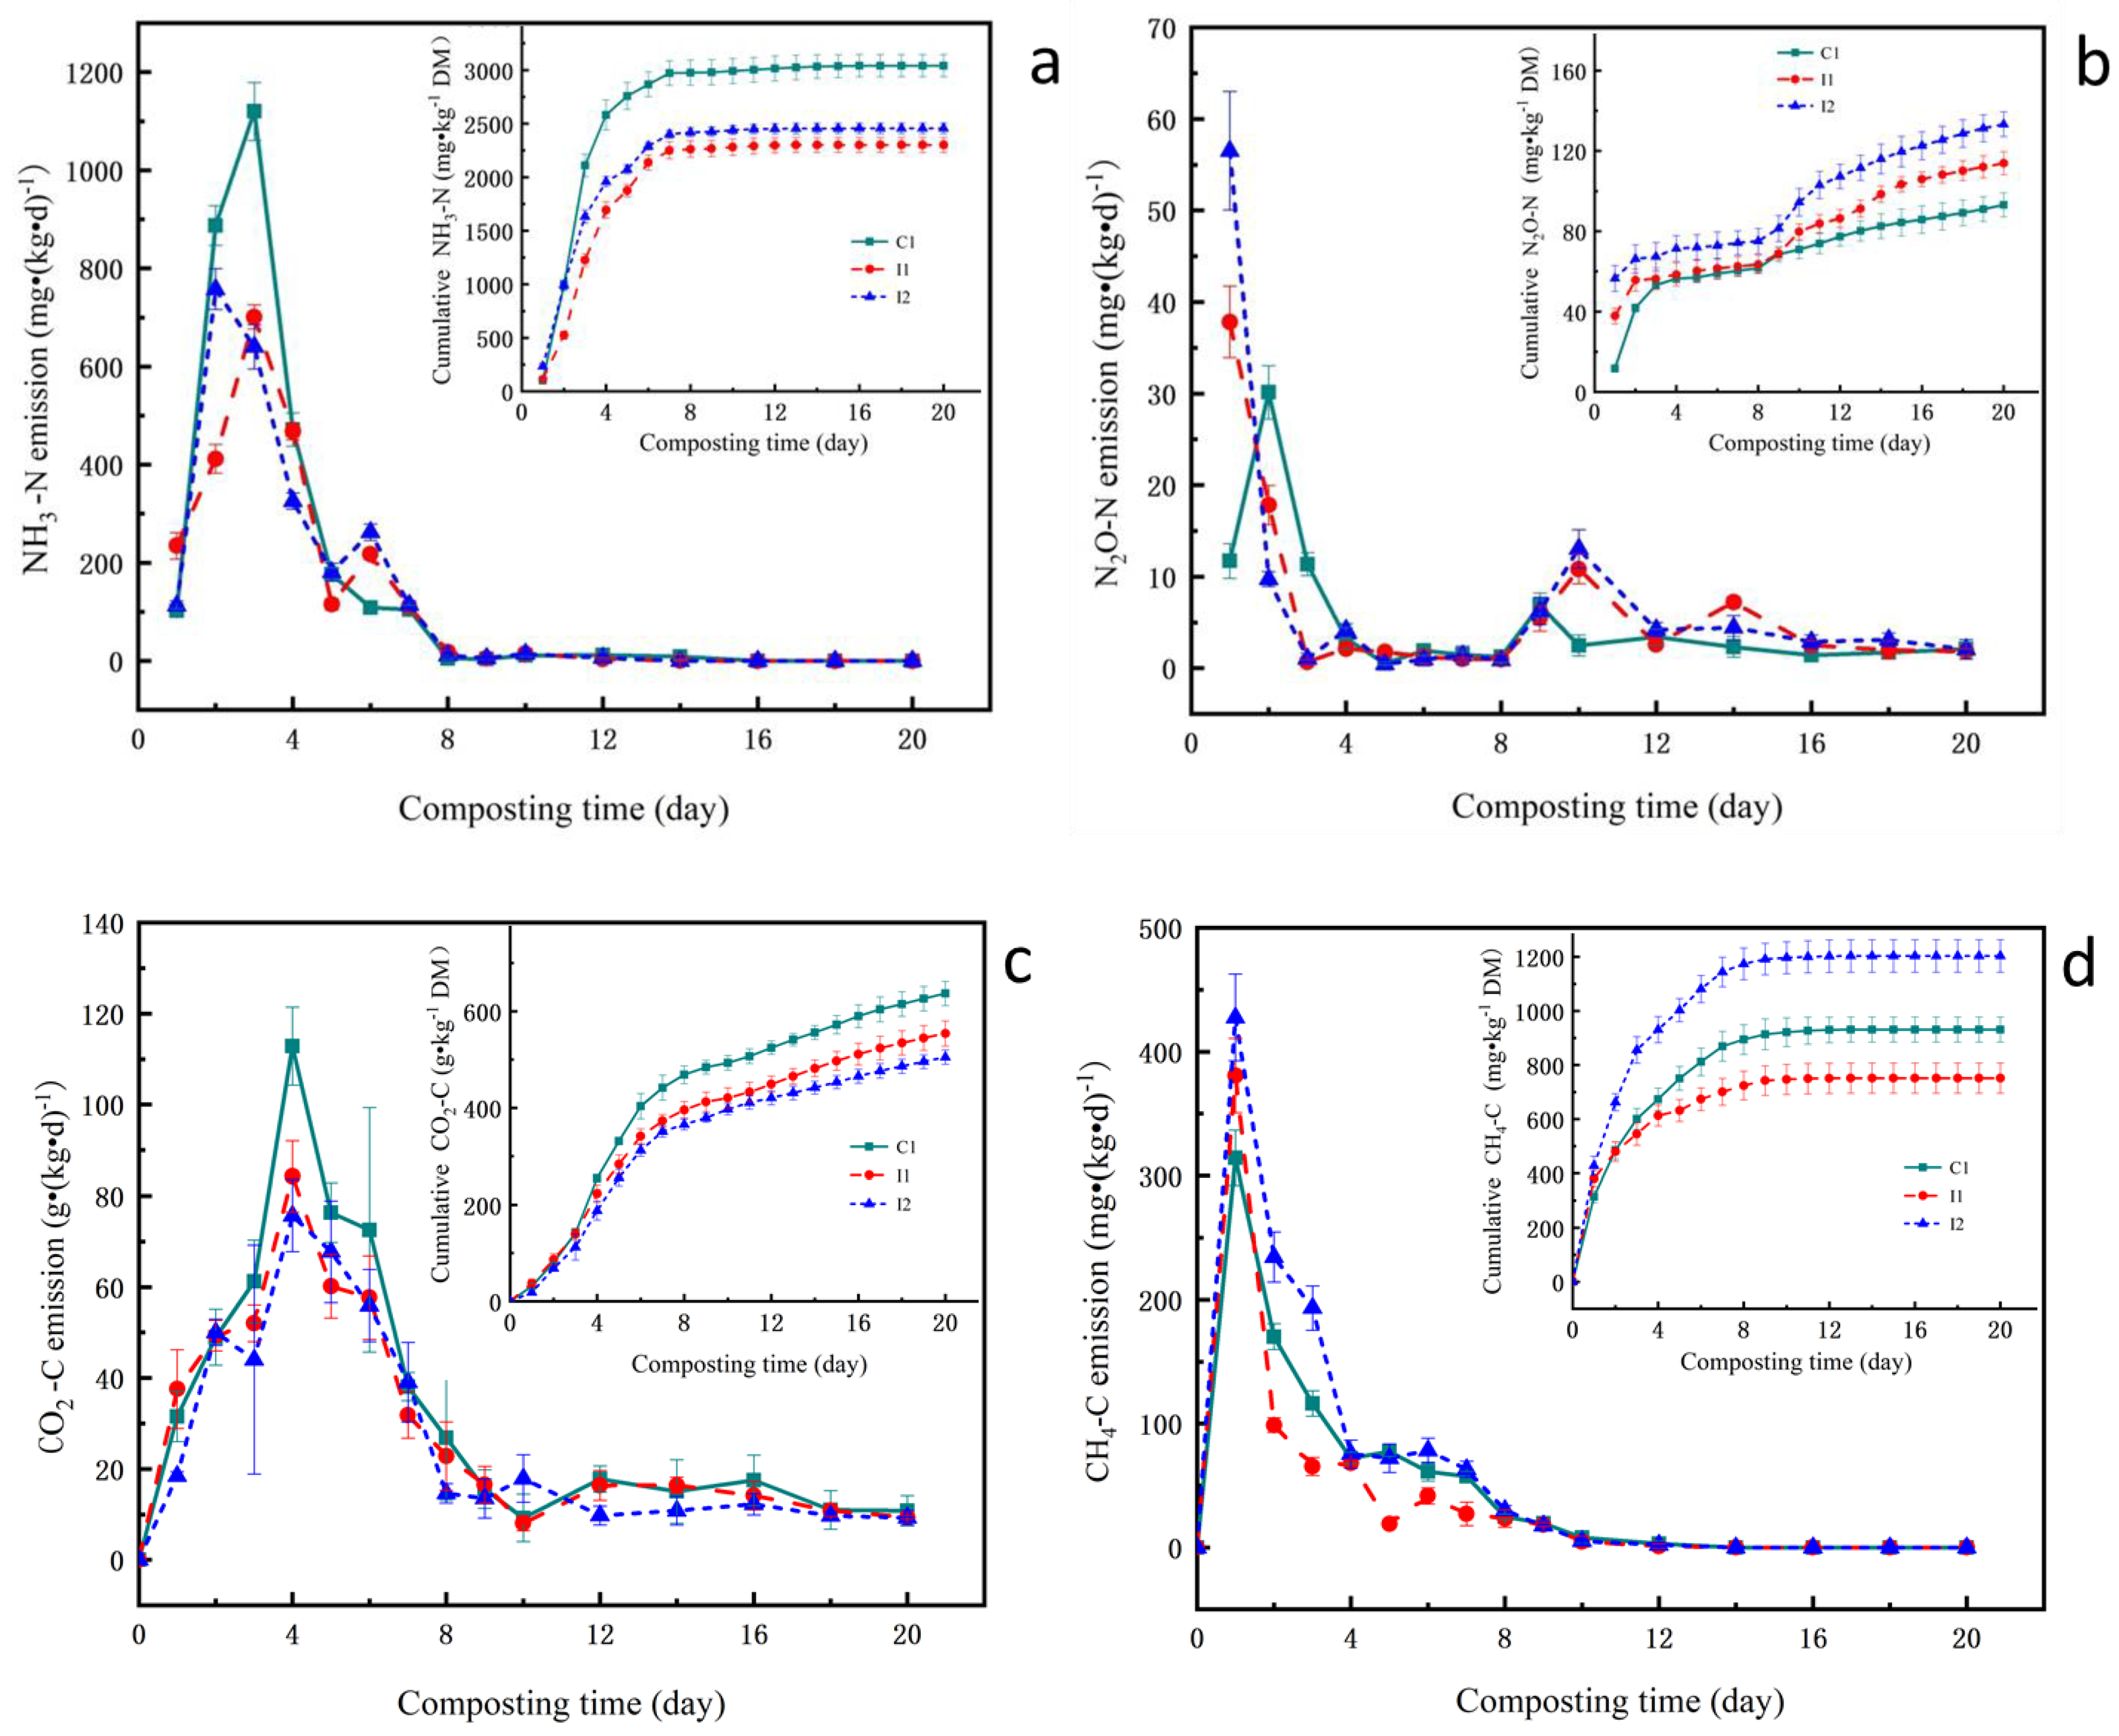
3.3. Emissions of NH3 and GHGs during the Composting

As shown in Figure 4a, the maximum values of NH3 emission were 1120.01 mg/kg/day DM, 701.17 mg/kg/day DM, and 757.55 mg/kg/day DM for C1, I1, and I2, respectively. Two weeks later, no NH3 emissions could be detected in the three treatments. Throughout the whole composting process, the cumulative NH3 emissions of C1, I1 and I2 treatments were 3041.90 mg/kg DM, 2300.53 mg/kg DM and 2455.68 mg/kg DM, accounting for 74.37%, 61.86% and 63.94% of TN losses, respectively. C1 treatment has the highest cumulative NH3 emissions. I1 and I2 treatments reduced NH3 emissions by 24.37% and 19.27% compared to C1 treatment, respectively. Data analysis showed that there were significant differences of NH3 accumulation between the treatments with continuous aeration (C1) and intermittent aeration (I1 and I2) (p < 0.05), but the difference between I1 and I2 was not significant.
Large amounts of N2O emissions were detected in the first three days of composting (Figure 4b). The peak of N2O emission of C1, I1, and I2 treatments reached 30.14 mg/kg/day DM, 37.83 mg/kg/day DM and 56.53 mg/kg/day DM, respectively. During the maturation phase, the second peak of N2O emissions was observed in I1 and I2 treatments, while the emission of C1 treatment was very low. Throughout the whole composting process, the cumulative N2O emissions of C1, I1, and I2 treatments were 93.13 mg/kg DM, 113.82 mg/kg DM and 133.31 mg/kg DM, respectively. The data analysis showed that the cumulative N2O emissions of I2 were significantly higher than that of C1 and C2.
CO2 emission flux during composting of all treatments is shown in Figure 4c, which increased rapidly in the early stage and peaked value 112.86 g, 84.27 g, and 75.67 g on day 4, respectively, and then gradually decreased by the end of the thermophilic phase. CO2 emissions of all three treatments during the thermophilic period account for more than 70% of total CO2 emissions. The cumulative CO2 emission of C1 treatment (636.91 g/kg DM) was the highest, which was 13.01% and 20.72% higher than that of I1 and I2 treatment, respectively.
The evolution trend of CH4 emission of all treatments showed an initial sharp increase and peaked within a few days, and then decrease (Figure 4d). The peak values were recorded on the first day and ranged between 314.34 mg/kg DM and 427.70 mg/kg. The intermittent aeration treatments (I1 and I2) had higher CH4 emission peaks compared to continuous aeration treatment. By the end of composting, the CH4 accumulation of C1, I1 and I2 were 931.23 mg/kg DM, 751.48 mg/kg DM and 1203.63 mg/kg DM, respectively. Among the three aeration treatments, I2 treatment has the highest CH4 accumulation. Meanwhile, the cumulative CH4 emission from I1 was lower than that from C1. The data analysis showed that there were significant differences in cumulative CH4 emission among the three treatments (p < 0.05).

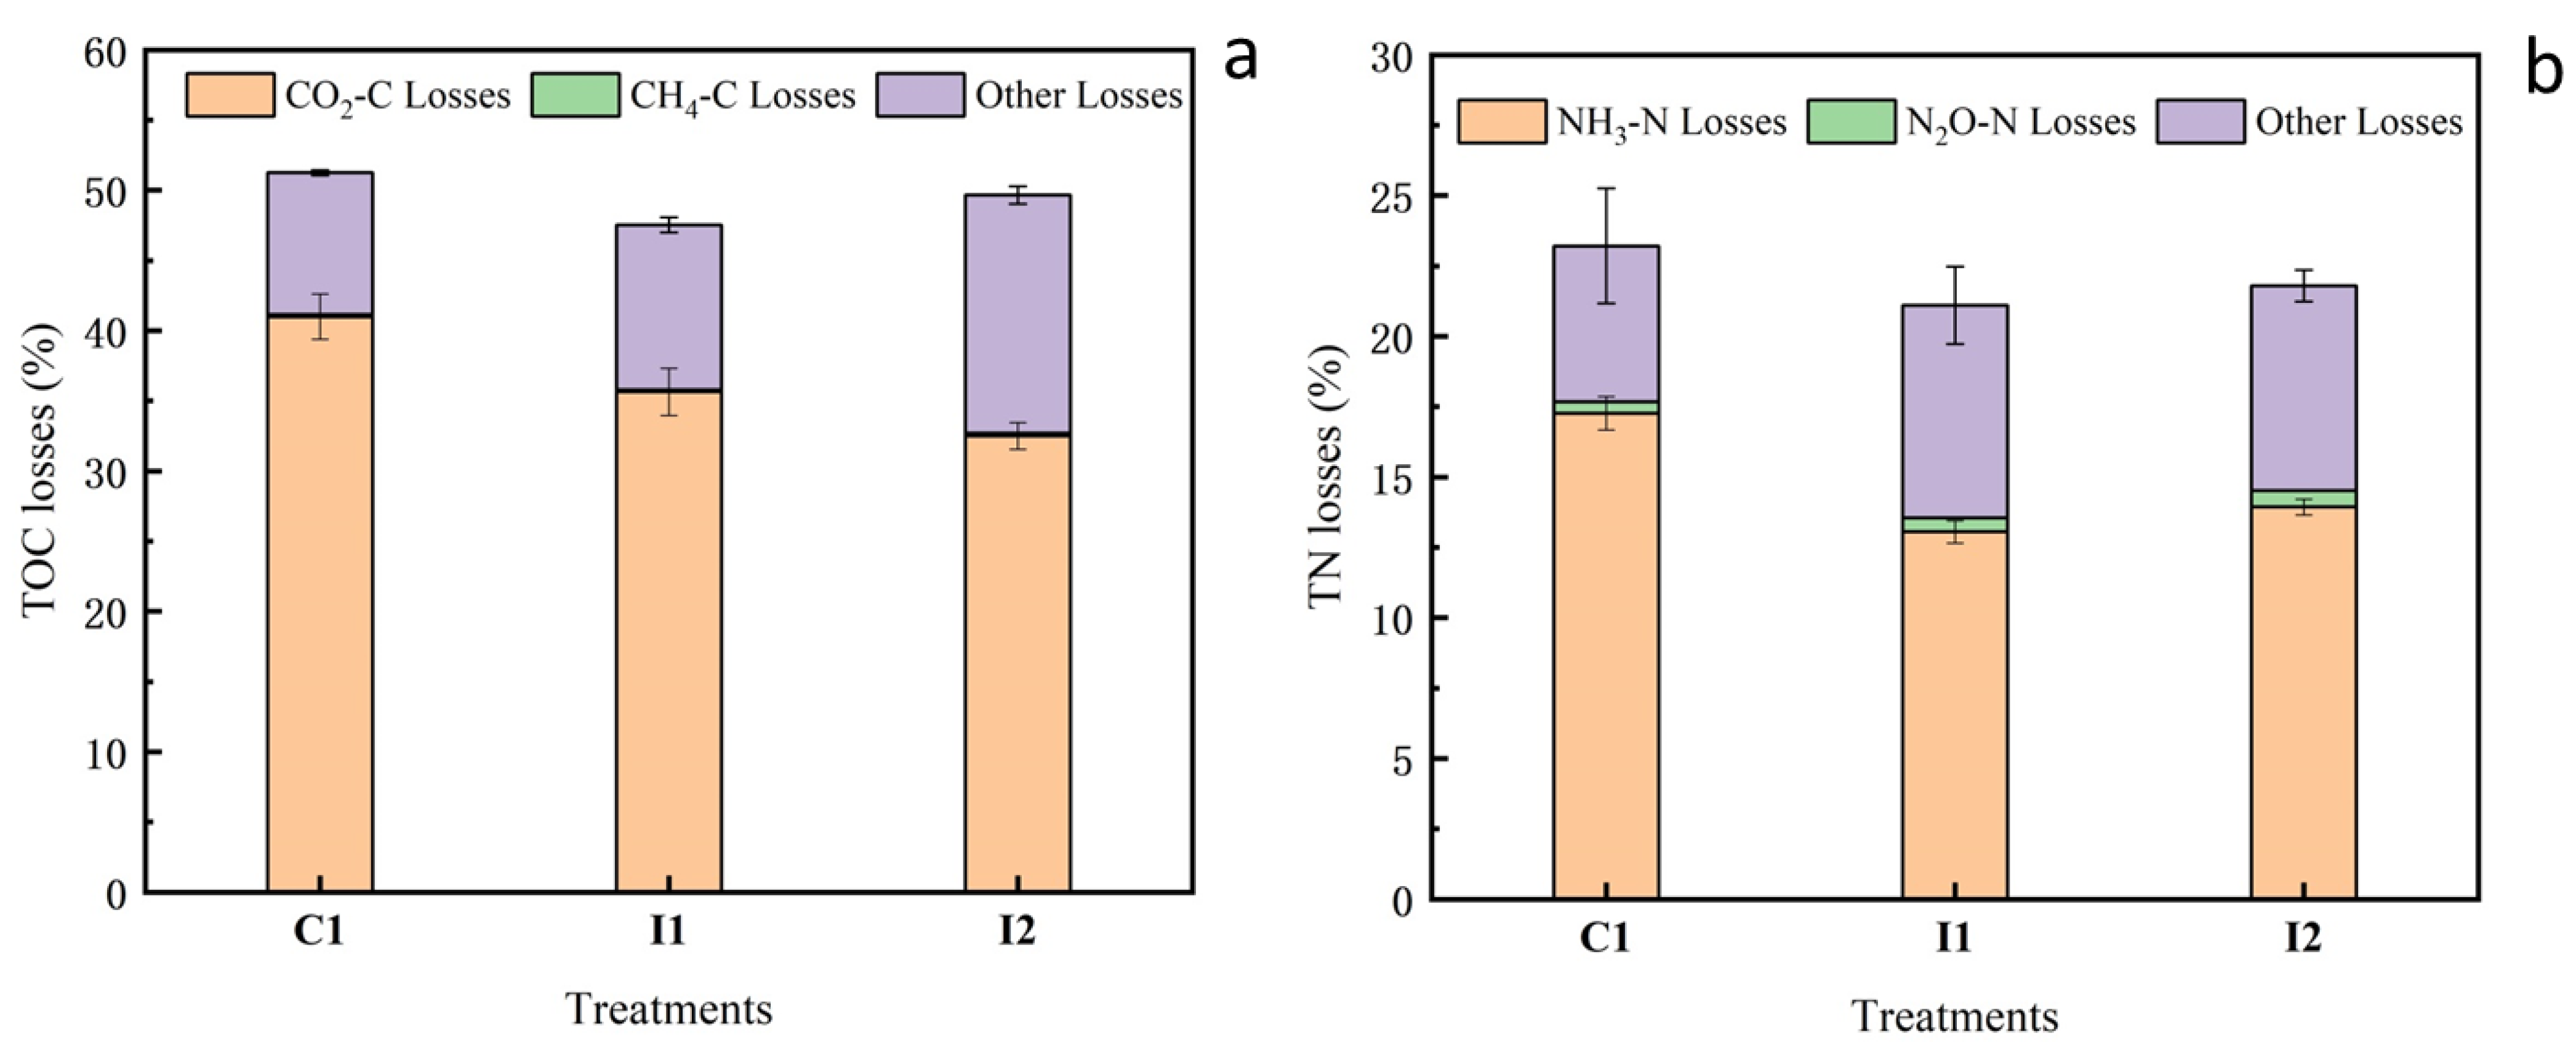
3.4. Carbon and Nitrogen Losses

The carbon and nitrogen losses from NH3 and GHG emission are presented in Figure 5. Throughout the composting process, more than 47% of the TOC has been lost, of which 32.50–40.99% and 0.13–0.21% were lost in the form of CO2 and CH4. The CO2-C loss comprised 65.44–79.97% of TOC loss, so CO2 emission was the principal pathway for the TOC loss in this study. The data analysis showed the TOC loss of C1 treatment was higher than that of I1 and I2 treatments.
The TN losses from the initial TN of all treatments ranged from 21.11–23.21%. TN losses can be attributed mainly to NH3 volatilization. In this study, the NH3-N loss accounted for 61.86–74.37% of TN loss, meanwhile, only 1.76–2.68% of TN loss was lost by N2O emission. For C1, I1, and I2, the percentage of NH3-N loss of the initial TN was 17.26%, 13.06%, and 13.94%, respectively. Compared with continuous aeration C1 treatment, the TN losses from I1 and I2 reduced 9.07% and 6.1%, so the intermittent aeration modes could reduce the TN loss.

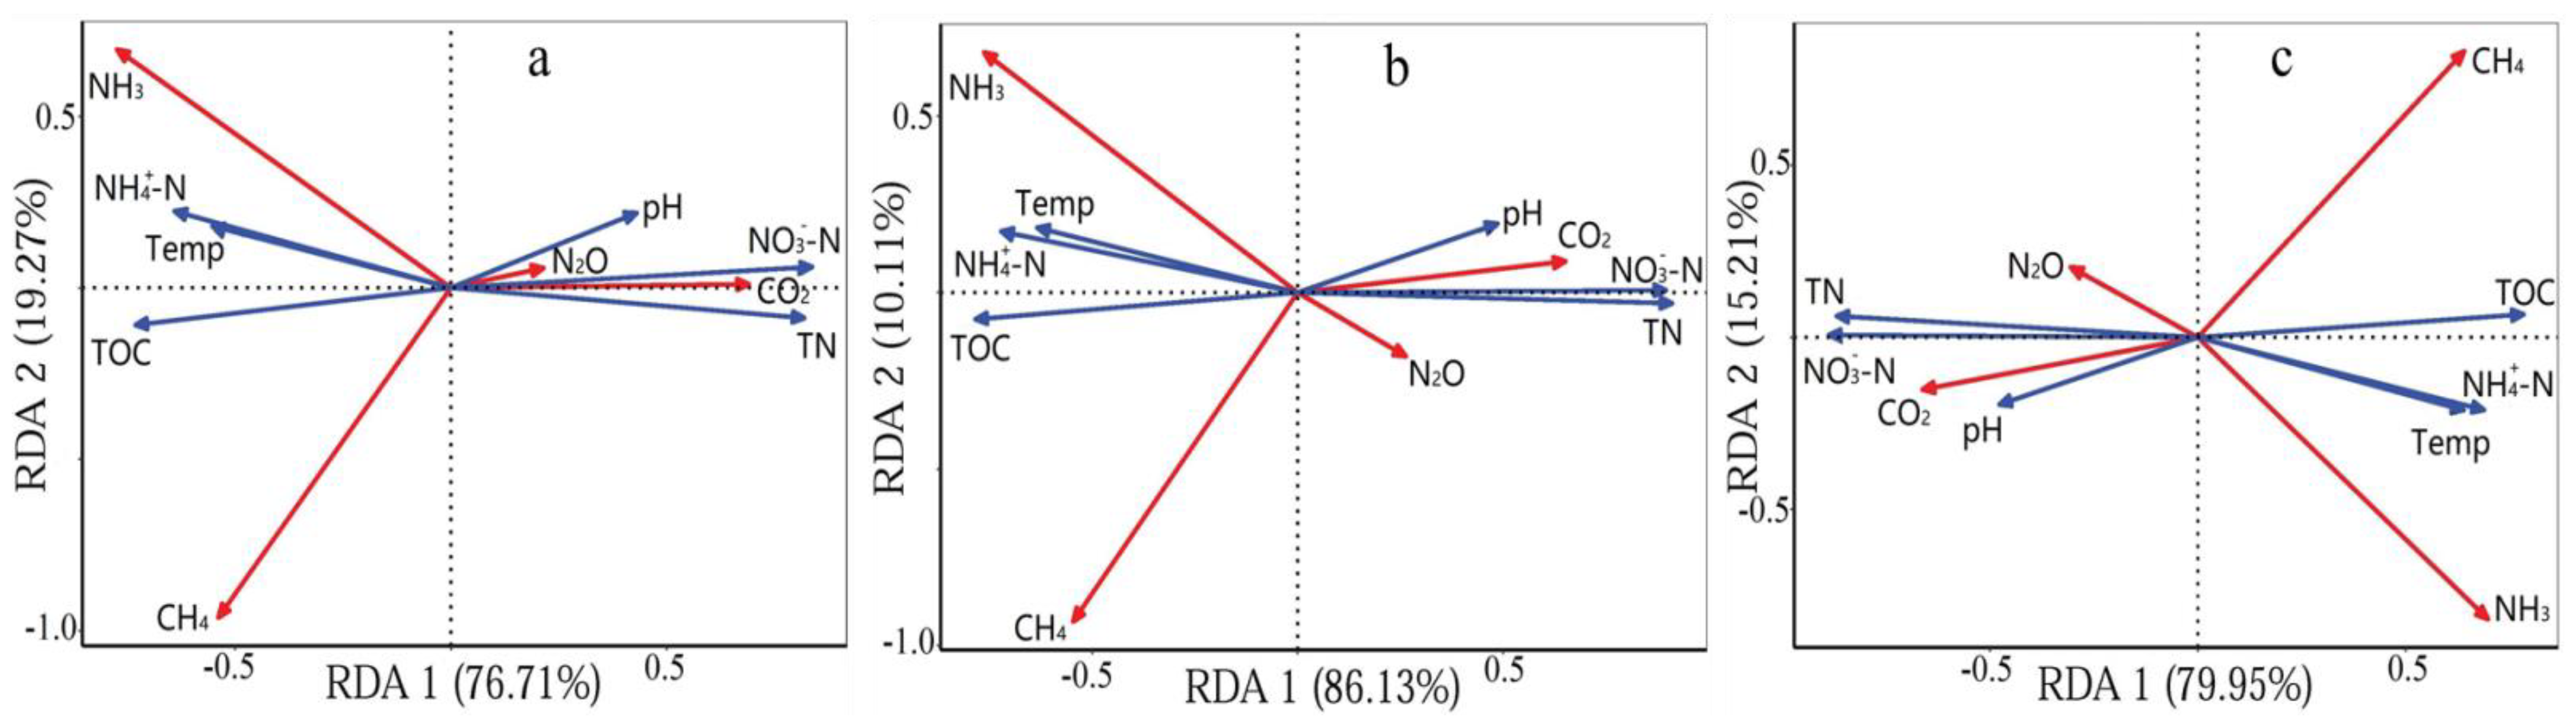
3.5. Redundancy Analysis (RDA) of Gaseous Emissions and Physicochemical Properties

Physiochemical parameters influence the gaseous emissions during the composting process. Redundancy analysis (RDA) was considered with the gaseous emission, different forms of carbon/nitrogen and physicochemical indices. As shown in Figure 6, the first two axes of the RDA accounted for 95.98%, 96.24%, 95.16% variance between the gases and the physicochemical parameters. The TOC, NH4+-N, NO3-N, and TN were identified as key factors that influenced the gaseous emissions. The RDA results showed a positive correlation between N2O and NO3-N and the negative correlation between N2O and TOC. NH3 was positively correlated with temperature and NH4+-N, while negatively correlated with TN.

4. Discussion

4.1. Temperature, pH and GI

The temperature of all treatments increased sharply at the beginning of composting because the forced aeration provided abundant oxygen to promote the degradation of organic matter [19]. C1 treatment had the highest temperature among the three treatments. The oxygen consumption rate was fast in the thermophilic phase [23], while the intermittent aerated treatment stopped the ventilation for a long time, resulting in the hypoxia of the reactor, which affected the activity of microorganisms and further affected the increase in temperature. With the complete degradation of easily degradable organic matter, the activity of microorganisms decreased, and the temperature was close to the ambient temperature. Compared with C1 and I1, the temperature of I2 is lowest owing to the higher heat loss by a high instantaneous aeration rate. A similar result was reported by [24]. The thermophilic phase (temperature ≥ 50 °C) lasted around 9 days, which met the Chinese Technical requirement for non-hazardous treatment of animal manure [25], which reach over 50 °C for at least 7 days to ensure elimination of pathogens.
The pH value not only affected the activity of microorganisms, but also was the key parameter to control ammonia volatilization [26], which directly affected the forms of nitrogen in the composting system. With the increase in temperature, ammonization was serious at the beginning of composting, which promoted the transformation of organic nitrogen to NH4+-N, resulting in a rapid increase in pH value [27,28,29]. After the fourth day, due to ammonia volatilization and ammonium oxidation to nitrates of nitrogenous bacteria, pH began to decline and then stabilized [5].
The GI is regarded as a sensitive indicator of compost maturity and phytotoxicity [30]. The GI decreased during the early phase, which may be attributed to the increase in NH4+-N content (Figure 2b) and the decomposition of organic matter to organic acids. At the end of composting, the GI of three treatments exceeded 80%, which indicated that the compost was phytotoxic-free and mature [31].

4.2. NH4+-N, NO3-N, TN, and TOC

The accumulation of NH4+-N is mainly due to the mineralization and ammonification. The NH4+-N content of C1 treatment was significantly higher than that of I1 and I2 treatment on the second day, and the difference reached the maximum between all treatments. It showed that the higher temperature and pH value of continuous aerated treatment was beneficial to the conversion of organic nitrogen into NH4+-N by ammonification [32,33]. As the higher nitrogen content in the early composting materials, microorganisms accelerated the decomposition of available nitrogen through ammonification which leads to a rapid accumulation in NH4+-N content [34]. Subsequently, the NH4+-N content gradually decreased due to the intense ammonia volatilization under high pH and temperature, nitrification, and biological immobilization [10,35]. At the end of composting, the NH4+-N content of intermittent aerated treatment decreased more than that of continuous aerated treatment, which may be due to the better growth of nitrifying bacteria at about 30 °C in the I1 and I2 treatments [36], thereby enhancing the nitrification and promoting the transformation of NH4+-N to NO3-N.
The NO3-N concentration of all treatments was maintained within 0.2 g/kg DM during the thermophilic phase. High temperature and pH value limited the activity of nitrite bacteria and nitrobacteria [33,37], so the NO3-N concentration remained at a low level. Santos et al. [38] reported that nitrification occurs when the temperature is lower than 40 °C and the aeration is favorable. After the 12th day, the ammonification was weakened and the nitrification was intensified, which promoted the conversion of NH4+-N to NO3-N [27], so the concentration of NO3-N increased rapidly. Compared with continuous aerated treatment, the NO3-N concentration of intermittent aerated treatments was lower. The optimum temperature of nitrifying bacteria was about 30 °C [36]. Therefore, intermittent aerated treatments enhanced nitrification and promoted the conversion of NH4+-N to NO3-N.
TOC showed a downward trend throughout the composting process, which was possibly due to the production of CO2 by bacterial and fungal metabolism and the rapid decomposition of degradable carbon in Compost material [10]. At the end of composting, Higher TOC content occurred with the C1 treatment due to the higher CO2 emissions. Guo et al. [33] reported CO2 was the main source of carbon loss (over 70% of the total carbon losses), and the rest of the carbon losses were caused by the emission of CH4 and other VOCs.
TN content in all treatments decreased at the beginning of composting, due to the decomposition of organic nitrogen and massive NH3 volatilization under high temperature and high pH value [2,39]. TN peak content of C1 treatment (13.74 g/kg DM) was the lowest among the three treatments, which was consistent with its NH3 emissions (Figure 4a). Vuorinen et al. [40] reported that the decomposition of massive nitrogenous organic matter by microorganisms requires a large amount of oxygen, so the oxygen consumption rate was higher than supply rate in the reactors. Therefore, anaerobic microorganisms further decompose decomposition of nitrogenous organic matter to N2O and N2, resulting in a decrease in TN content. With the start of the concentration effect, the reduction rate of composting materials quality was faster than that of nitrogen [22], so the final TN content was higher than the initial TN content [13,41]. Among the three treatments, the TN content of C1 treatment was the lowest on day 20 because of its highest TN loss. This was consistent with the results in Figure 5b.

4.3. Emissions of NH3 and GHGs

NH3 emissions of all treatments quickly peaked at the thermophilic phase due to the intense biodegradation of organic nitrogen to NH4+-N [7,42], forming a positive correlation confirmed by the RDA analysis (Figure 6a–c). High pH altered the solution equilibrium between NH4+-N and NH3 to the benefit of the volatilization of NH3. Compared with the cumulative NH3 emissions of C1 treatment, I1 treatment was 24.37% lower, and I2 treatment was 19.27% lower. C1 treatment has the highest cumulative NH3 emissions due to its continuous plentiful oxygen supply which facilitates the degradation process and leads to increased NH4+-N release [19,43]. Therefore, intermittent aeration can effectively reduce NH3 volatilization.
The mechanism of the N2O emission is complicated because N2O could be produced both during incomplete nitrification processes and also as an intermediate product of denitrification [2,44,45,46]. N2O emissions were detected in the first three days of composting, which may be explained denitrification or nitrification had begun before the process of mixing the composting materials [22,44]. The N2O emission pattern was similar to previous studies [15,47]. However, this result was opposing to the observations of Hellmann et al. [16], which reported that N2O cannot be produced because nitrifying bacteria are unable to thrive at thermophilic temperatures. During the maturation phase, the second peak of N2O emissions was observed in all treatments. However, the peak value of C1 treatment was very low because the denitrification process was difficult to carry out with the continuous aeration [19]. Among the three treatments, the cumulative N2O emission of C1 treatment was the lowest, because intermittent aeration promoted N2O emissions through the alternation of nitrification and denitrification [18].
CO2 emissions are a crucial indicator of organic matter (OM) decomposition and microbial activity [2]. CO2 was mainly emitted during the thermophilic period due to the rapid degradation of OM and increasing temperature with microbial activity [3,7,22,33]. During the maturation phase, low CO2 emission was observed with the gradual consumption of the OM and decreasing temperature [18]. C1 treatment showed the highest cumulative CO2 emissions (636.91 g/kg DM), which indicated that enough aeration time promoted the degradation of OM and increased CO2 emissions at high temperatures [17,18].
CH4 is produced by the deoxidization of CO2, CO, and VOAs by methanogens under anaerobic conditions [47]. Previous research reported that CH4 emissions mainly occurred at the thermophilic stage of the composting might be due to composting mass settlement and then anaerobic pockets formed [15,19,48,49]. The intermittent aerated treatments had higher CH4 emission peaks compared to continuous aerated treatment. The initially large CH4 emissions for C1 might be due to the mosaic of aerobic and anaerobic microsites within the composting matrix because the high O2 consumption and CO2 production rates coincide with moisture evolution limit the O2 concentration and diffusion rate, and thus decreasing O2 availability at a local scale [17]. By the end of composting, I2 treatment has the highest CH4 accumulation may be the insufficient oxygen supply for the intensive degradation caused by the long aeration interval [14].

4.4. Carbon and Nitrogen Losses

TN losses can be attributed mainly to NH3 volatilization [50]. In this research, the NH3-N loss accounted for more than 60% of TN loss, meanwhile, only about 2% of TN loss was lost by N2O emission. The result was similar with [4]. The NH3-N loss of the three treatments accounted for 13.06–17.26% of the initial TN, which was higher than the range of 2.56–9.73% as reported by Pan et al. [39] during composting with acidic additives, and lower than 29.17–60.55% during aerobic composting with sewage sludge as reported by Han et al. [3]. Therefore, NH3 emission may be influenced by the different materials, additives, and aeration condition. Among the three treatments, continuous aerated treatment (C1) had the highest nitrogen loss (23.21%) due to its highest NH3 volatilization (17.26%).
CO2 emission was the principal pathway for the TOC loss in this study, which comprised over 65% of TOC loss. While the CH4-C loss accounted for only about 0.3% of TOC loss. The result was comparable with Li et al. [51] and Luo et al. [42] in pig manure composting. C1 showed the largest TOC loss (51.26%) due to the highest CO2 accumulation, as sufficient oxygen enhanced microbial activity thus produced more CO2, so the intermittent aeration modes could reduce the TOC loss. However, this result was the opposite of Wang et al. [18], who reported the intermittent aeration could result in higher TOC loss than continuous aeration strategies. Although the CH4 loss of I2 treatment was the highest among the three treatments, its proportion in TOC loss was very small. Meanwhile, the CO2 emission of C1 treatment was the highest, so its TOC loss was the highest.

4.5. Relationships between Gases and Physicochemical Indices

N2O was positively correlated with NO3-N, while negatively correlated with TOC. The reason could be because denitrifying bacteria use carbon source to rapidly propagate and use nitrate as a substrate for denitrification process to reduce nitrogen oxides to N2O [10,52]. NH3 was positively correlated with temperature and NH4+-N, which was probably because microorganisms accelerated the decomposition of Org-N compounds through ammonification under the high temperature environment, which leads to a rapid accumulation in NH4+-N content [34,48]. Meanwhile, the transformation of NH4+-N to NH3 was promoted by the high temperature and pH value, so the higher NH3 emissions were relative to the higher NH4+-N content [2]. The decrease in TN content could be due to NH3 emissions and organic nitrogen decomposition with high temperature [2], and perhaps because of this reason, the NH3 was negatively correlated with the TN.

5. Conclusions

Aeration modes had significant effects on gaseous emissions during aerobic composting of cow manure in the laboratory-scale. Compared with continuous aeration, intermittent aeration reduced cumulative CO2 and NH3 emission, while reduced TOC and TN losses, but increased N2O accumulation by the alternation of nitrification and denitrification. The results showed that the percentages of NH3-N and N2O-N losses of the TN losses were 61.86–74.37% and 1.76–2.68%, while C losses of CO2-C and CH4-C comprised 65.44–79.97% and 0.27–0.42% of TOC losses. In particular, I1 treatment had the lowest cumulative NH3 emissions (2.30 g/kg DM) and TOC loss (47.55%). Therefore, adjusting intermittent aeration (average aeration rate 0.21 L kg−1 DM·min1, aeration 10 min and stop 10 min) in composting could be useful strategies for limiting NH3 and GHG emissions and reducing carbon and nitrogen losses during aerobic composting of cow manure.

Author Contributions

Conceptualization, Y.W., H.Q., M.L., and P.G.; data curation, Y.W., M.L., and P.G.; investigation, Y.W., M.L., and P.G.; draft of manuscript, Y.W. and H.Q.; writing—review and editing, Y.W. and H.Q.; supervision, H.Q.; funding acquisition, Y.W. and H.Q. All authors have read and agreed to the published version of the manuscript.

Funding

This research was funded by Science and Technology Innovation Funds of Gansu Agricultural University, grant number GSAU-XKJS-2018-204; Natural Science Foundation of Gansu Province, China, grant number 20JR10RA542 and the National Key Research and Development Program of China, grant number 2017YFD0800200.

Institutional Review Board Statement

Not applicable.

Informed Consent Statement

Not applicable.

Data Availability Statement

Not applicable.

Conflicts of Interest

The authors declare no conflict of interest.

References

  1. Gao, M.; Li, B.; Yu, A.; Liang, F.; Yang, L.; Sun, Y. The effect of aeration rate on forced-aeration composting of chicken manure and sawdust. Bioresour. Technol. 2010, 101, 1899–1903. [Google Scholar] [CrossRef] [PubMed]
  2. Yang, Y.J.; Awasthi, M.K.; Du, W.; Ren, X.N.; Lei, T.; Lv, J.L. Compost supplementation with nitrogen loss and greenhouse gas emissions during pig manure composting. Bioresour. Technol. 2020, 297, 122435. [Google Scholar] [CrossRef]
  3. Han, Z.; Sun, D.; Wang, H.; Li, R.; Bao, Z.; Qi, F. Effects of ambient temperature and aeration frequency on emissions of ammonia and greenhouse gases from a sewage sludge aerobic composting plant. Bioresour. Technol. 2018, 270, 457–466. [Google Scholar] [CrossRef] [PubMed]
  4. Yuan, J.; Chadwick, D.; Zhang, D.; Li, G.; Chen, S.; Luo, W.; Du, L.; He, S.; Peng, S. Effects of aeration rate on maturity and gaseous emissions during sewage sludge composting. Waste Manag. 2016, 56, 403–410. [Google Scholar] [CrossRef] [PubMed]
  5. Meng, L.; Li, W.; Zhang, S.; Wu, C.; Wang, K. Effects of sucrose amendment on ammonia assimilation during sewage sludge composting. Bioresour. Technol. 2016, 210, 160–166. [Google Scholar] [CrossRef] [PubMed]
  6. Jiang, T.; Ma, X.; Yang, J.; Tang, Q.; Yi, Z.; Chen, M.; Li, G. Effect of different struvite crystallization methods on gaseous emission and the comprehensive comparison during the composting. Bioresour. Technol. 2016, 217, 219–226. [Google Scholar] [CrossRef] [PubMed]
  7. Nakhshiniev, B.; Perera, C.; Biddinika, M.K.; Gonzales, H.B.; Sumida, H.; Yoshikawa, K. Reducing ammonia volatilization during composting of organic waste through addition of hydrothermally treated lignocellulose. Int. Biodeterior. Biodegrad. 2014, 96, 58–62. [Google Scholar] [CrossRef]
  8. Yuan, J.; Yang, Q.Y.; Zhang, Z.Y.; Li, G.X.; Luo, W.H.; Zhang, D.F. Use of additive and pretreatment to control odors in municipal kitchen waste during aerobic composting. J. Environ. Sci. 2015, 37, 83–90. [Google Scholar] [CrossRef]
  9. IPCC. Climate Change 2014: Synthesis Report. Contribution of Working Groups I, II and III to the Fifth Assessment Report of the Intergovernmental Panel on Climate Change; IPCC: Geneva, Switzerland, 2014. [Google Scholar]
  10. Chen, M.L.; Huang, Y.M.; Liu, H.J.; Xie, S.W.; Abbas, F. Impact of different nitrogen source on the compost quality and greenhouse gas emissions during composting of garden waste. Process. Saf. Environ. 2019, 124, 326–335. [Google Scholar] [CrossRef]
  11. Szanto, G.L.; Hamelers, H.M.; Rulkens, W.H.; Veeken, A.H.M. NH3, N2O and CH4 emissions during passively aerated composting of straw-rich pig manure. Bioresour. Technol. 2007, 98, 2659–2670. [Google Scholar] [CrossRef] [PubMed]
  12. Ermolaev, E.; Jarvis, A.; Sundberg, C.; Smars, S.; Pell, M.; Jonsson, H. Nitrous oxide and methane emissions from food waste composting at different temperatures. Waste Manag. 2015, 46, 113–119. [Google Scholar] [CrossRef]
  13. Jiang, T.; Ma, X.G.; Tang, Q.; Yang, J.; Li, G.X.; Schuchardt, F. Combined use of nitrification inhibitor and struvite crystallization to reduce the NH3 and N2O emissions during composting. Bioresour. Technol. 2016, 217, 210–218. [Google Scholar] [CrossRef]
  14. Zeng, J.; Yin, H.; Shen, X.; Liu, N.; Ge, J.; Han, L.; Huang, G. Effect of aeration interval on oxygen consumption and GHG emission during pig manure composting. Bioresour. Technol. 2018, 250, 214–220. [Google Scholar] [CrossRef]
  15. Awasthi, M.K.; Wang, Q.; Huang, H.; Ren, X.N.; Lahori, A.H.; Mahar, A.; Ali, A.; Shen, F.; Li, R.H.; Zhang, Z.Q. Influence of zeolite and lime as additives on greenhouse gas emissions and maturity evolution during sewage sludge composting. Bioresour. Technol. 2016, 216, 172–181. [Google Scholar] [CrossRef] [PubMed]
  16. Hellmann, B.; Zelles, L.; Palojarvi, A.; Bai, Q.Y. Emission of climate-relevant trace gases and succession of microbial communities during open-window composting. Appl. Environ. Microbiol. 1997, 63, 1011–1018. [Google Scholar] [CrossRef] [Green Version]
  17. Chowdhury, M.A.; de Neergaard, A.; Jensen, L.S. Potential of aeration flow rate and bio-char addition to reduce greenhouse gas and ammonia emissions during manure composting. Chemosphere 2014, 97, 16–25. [Google Scholar] [CrossRef]
  18. Wang, Y.; Liu, S.J.; Xue, W.T.; Guo, H.; Li, X.R.; Zou, G.Y.; Zhao, T.K.; Dong, H.M. The Characteristics of Carbon, Nitrogen and Sulfur Transformation During Cattle Manure Composting-Based on Different Aeration Strategies. Int. J. Environ. Res. Public Health 2019, 16, 3930. [Google Scholar] [CrossRef] [Green Version]
  19. Jiang, T.; Li, G.; Tang, Q.; Ma, X.; Wang, G.; Schuchardt, F. Effects of aeration method and aeration rate on greenhouse gas emissions during composting of pig feces in pilot scale. J. Environ. Sci. 2015, 31, 124–132. [Google Scholar] [CrossRef]
  20. NY525-2012. China Standard Method: Organic Fertilizer; Ministry of Agriculture of the People’s Republic of China: Beijing, China, 2012.
  21. Wang, X.; Bai, Z.H.; Yao, Y.; Gao, B.B.; Chadwick, D.; Chen, Q.; Hu, C.S.; Ma, L. Composting with negative pressure aeration for the mitigation of ammonia emissions and global warming potential. J. Clean. Prod. 2018, 195, 448–457. [Google Scholar] [CrossRef]
  22. Tong, B.X.; Wang, X.; Wang, S.Q.; Ma, L.; Ma, W.Q. Transformation of nitrogen and carbon during composting of manure litter with different methods. Bioresour. Technol. 2019, 293, 122046. [Google Scholar] [CrossRef] [PubMed]
  23. Chen, T.B.; Zheng, Y.Q.; Gao, D.; Kong, J.S.; Luo, W. Variation of oxygen concentration during aerobic composting of pig manure. J. Appl. Ecol. 2004, 15, 2179–2183. [Google Scholar]
  24. Shen, Y.J.; Zhang, P.Y.; Zhao, L.X.; Cheng, H.S.; Zhou, H.B.; Zhang, X. Effects of ventilation modes on control of main odor substances in pig manure composting. Trans. Chin. Soc. Agric. Eng. 2019, 35, 203–209. [Google Scholar]
  25. NY/T1168-2006. Technical Requirement for Non-Hazardous Treatment of Animal Manure; Ministry of Agriculture of the People’s Republic of China: Beijing, China, 2006.
  26. Zhu, X.; Dong, W.; Wang, H.; Yan, C.; Liu, H.; Liu, E. Effects of cattle manure composting methods on greenhouse gas and ammonia emissions. Trans. Chin. Soc. Agric. Eng. 2017, 33, 258–264. [Google Scholar]
  27. Nie, E.; Zheng, G.; Gao, D.; Liu, X. Moderate intensity of ventilation can significantly reduce nitrogen loss during aerobic composting of chicken manure. J. Plant Nutr. Fertil. 2019, 25, 1773–1780. [Google Scholar]
  28. Rihani, M.; Malamis, D.; Bihaoui, B.; Etahiri, S.; Loizidou, M.; Assobhei, O. In-vessel treatment of urban primary sludge by aerobic composting. Bioresour. Technol. 2010, 101, 5988–5995. [Google Scholar] [CrossRef] [PubMed]
  29. Wong, J.W.; Mak, K.F.; Chan, N.W.; Lam, A.; Fang, M.; Zhou, L.X.; Wu, Q.T.; Liao, X.D. Co-composting of soybean residues and leaves in Hong Kong. Bioresour. Technol. 2001, 76, 99–106. [Google Scholar] [CrossRef]
  30. Meng, X.; Liu, B.; Xi, C.; Luo, X.; Yuan, X.; Wang, X.; Zhu, W.; Wang, H.; Cui, Z. Effect of pig manure on the chemical composition and microbial diversity during co-composting with spent mushroom substrate and rice husks. Bioresour. Technol. 2018, 251, 22–30. [Google Scholar] [CrossRef]
  31. Selim, S.M.; Zayed, M.S.; Atta, H.M. Evaluation of phytotoxicity of compost during composting process. Nat. Sci. 2012, 10, 69–77. [Google Scholar]
  32. Chen, M.L.; Wang, C.; Wang, B.R.; Bai, X.; Gao, H.; Huang, Y. Enzymatic mechanism of organic nitrogen conversion and ammonia formation during vegetable waste composting using two amendments. Waste Manag. 2019, 95, 306–315. [Google Scholar] [CrossRef] [PubMed]
  33. Guo, R.; Li, G.; Jiang, T.; Schuchardt, F.; Chen, T.; Zhao, Y.; Shen, Y. Effect of aeration rate, C/N ratio and moisture content on the stability and maturity of compost. Bioresour. Technol. 2012, 112, 171–178. [Google Scholar] [CrossRef] [PubMed]
  34. Cao, Y.; Huang, H.Y.; Sun, J.J.; Wu, H.S.; Duan, H.Y.; Xu, Y.D.; Jin, H.M.; Chang, Z.Z. Effect of hyperthermerphilic pretreatment on transformation and losses of C and N during pig manure composting. China Environ. Sci. 2018, 38, 1792–1800. [Google Scholar]
  35. Awasthi, M.K.; Pandey, A.K.; Bundela, P.S.; Khan, J. Co-composting of organic fraction of municipal solid waste mixed with different bulking waste: Characterization of physicochemical parameters and microbial enzymatic dynamic. Bioresour. Technol. 2015, 182, 200–207. [Google Scholar] [CrossRef]
  36. Liu, N.; Zhou, J.; Ma, S.; Han, L.; Huang, G. Impacts of Biochar on Major Forms Contents and Conservation Mechanism of Nitrogen during Aerobic Composting of Chicken Manure. Trans. Chin. Soc. Agric. Mach. 2016, 47, 233–239. [Google Scholar]
  37. Yuan, J.; Li, Y.; Chen, S.; Li, D.; Tang, H.; Chadwick, D.; Li, S.; Li, W.; Li, G. Effects of phosphogypsum, superphosphate, and dicyandiamide on gaseous emission and compost quality during sewage sludge composting. Bioresour. Technol. 2018, 270, 368–376. [Google Scholar] [CrossRef] [PubMed]
  38. Santos, A.; Bustamante, M.A.; Tortosa, G.; Moral, R.; Bernal, M.P. Gaseous emissions and process development during composting of pig slurry: The influence of the proportion of cotton gin waste. J. Clean. Prod. 2016, 112, 81–90. [Google Scholar] [CrossRef]
  39. Pan, J.T.; Cai, H.Z.; Zhang, Z.Q.; Liu, H.B.; Li, R.H.; Mao, H.; Awasthi, M.K.; Wang, Q.; Zhai, L.M. Comparative evaluation of the use of acidic additives on sewage sludge composting quality improvement, nitrogen conservation, and greenhouse gas reduction. Bioresour. Technol. 2018, 270, 467–475. [Google Scholar] [CrossRef]
  40. Vuorinen, A.H.; Saharinen, M.H. Evolution of microbiological and chemical parameters during manure and straw co-composting in a drum composting system. Agric. Ecosyst. Environ. 1997, 66, 19–29. [Google Scholar] [CrossRef]
  41. Chan, M.T.; Selvam, A.; Wong, J.W.C. Reducing nitrogen loss and salinity during ’struvite’ food waste composting by zeolite amendment. Bioresour. Technol. 2016, 200, 838–844. [Google Scholar] [CrossRef] [PubMed]
  42. Luo, W.H.; Yuan, J.; Luo, Y.M.; Li, G.X.; Nghiem, L.D.; Price, W.E. Effects of mixing and covering with mature compost on gaseous emissions during composting. Chemosphere 2014, 117, 14–19. [Google Scholar] [CrossRef] [PubMed] [Green Version]
  43. Jiang, T.; Schuchardt, F.; Li, G.X.; Guo, R.; Luo, Y.M. Gaseous emission during the composting of pig feces from Chinese Ganqinfen system. Chemosphere 2013, 90, 1545–1551. [Google Scholar] [CrossRef]
  44. El Kader, N.A.; Robin, P.; Paillat, J.M.; Leterme, P. Turning, compacting and the addition of water as factors affecting gaseous emissions in farm manure composting. Bioresour. Technol. 2007, 98, 2619–2628. [Google Scholar] [CrossRef] [PubMed]
  45. Richardson, D.; Felgate, H.; Watmough, N.; Thomson, A.; Baggs, E. Mitigating release of the potent greenhouse gas N2O from the nitrogen cycle—Could enzymic regulation hold the key? Trends Biotechnol. 2009, 27, 388–397. [Google Scholar] [CrossRef] [PubMed]
  46. Tsutsui, H.; Fujiwara, T.; Matsukawa, K.; Funamizu, N. Nitrous oxide emission mechanisms during intermittently aerated composting of cattle manure. Bioresour. Technol. 2013, 141, 205–211. [Google Scholar] [CrossRef] [PubMed]
  47. Awasthi, M.K.; Wang, M.J.; Chen, H.Y.; Wang, Q.; Zhao, J.C.; Ren, X.N.; Li, D.S.; Awasthi, S.K.; Shen, F.; Li, R.H.; et al. Heterogeneity of biochar amendment to improve the carbon and nitrogen sequestration through reduce the greenhouse gases emissions during sewage sludge composting. Bioresour. Technol. 2017, 224, 428–438. [Google Scholar] [CrossRef] [PubMed]
  48. Zhao, J.; Sun, X.; Awasthi, M.K.; Wang, Q.; Ren, X.; Li, R.; Chen, H.; Wang, M.; Liu, T.; Zhang, Z. Performance evaluation of gaseous emissions and Zn speciation during Zn-rich antibiotic manufacturing wastes and pig manure composting. Bioresour. Technol. 2018, 267, 688–695. [Google Scholar] [CrossRef] [PubMed]
  49. Shen, Y.; Ren, L.; Li, G.; Chen, T.; Guo, R. Influence of aeration on CH4, N2O and NH3 emissions during aerobic composting of a chicken manure and high C/N waste mixture. Waste Manag. 2011, 31, 33–38. [Google Scholar] [CrossRef] [PubMed]
  50. Tiquia, S.M.; Tam, N.F.Y. Fate of nitrogen during composting of chicken litter. Environ. Pollut. 2000, 110, 535–541. [Google Scholar] [CrossRef]
  51. Li, S.; Li, D.; Li, J.; Li, Y.; Li, G.; Zang, B.; Li, Y. Effect of spent mushroom substrate as a bulking agent on gaseous emissions and compost quality during pig manure composting. Environ. Sci. Pollut. Res. 2018, 25, 12398–12406. [Google Scholar] [CrossRef] [PubMed]
  52. Ghanney, P.; Qiu, H.; Anning, D.K.; Yang, H.; Wang, Y.; Kugbe, J.X. Moisture-Induced Pattern of Gases and Physicochemical Indices in Corn Straw and Cow Manure Composting. Appl. Sci. 2021, 11, 8493. [Google Scholar] [CrossRef]
Figure 1. Sketch of the composting reactor.
Applsci 11 11639 g001
Figure 2. Evaluations of temperature (a), pH values (b) and GI (c) of the three treatments. The error bars are standard deviation (n = 3).
Applsci 11 11639 g002
Figure 3. Evolutions of NH4+-N content (a), NO3-N content (b), TOC content (c) and TN content (d) during the composting. The error bars are standard deviation (n = 3).
Applsci 11 11639 g003
Figure 4. Emissions and accumulations of NH3 (a), N2O (b), CO2 (c) and CH4 (d) during the composting. The error bars are standard deviation (n = 3).
Applsci 11 11639 g004
Figure 5. The losses of carbon (a) and nitrogen (b) during composting with different ventilation modes.
Applsci 11 11639 g005
Figure 6. Redundancy analysis (RDA) of gaseous emissions and physiochemical parameters during composting. (a) C1 treatment, (b) I1 treatment, (c) I2 treatment. Correlations between physiochemical characteristics and RDA axes were represented by the length and angle of arrows.
Applsci 11 11639 g006
Table 1. The properties of composting materials.
MaterialsMC (%)TOC (%)TN (%)C/NpH
Dairy manure63.93 ± 0.4940.83 ± 3.102.02 ± 0.2120.30 ± 1.117.6 ± 0.17
Corn stalks7.26 ± 0.2243.75 ± 1.780.72 ± 0.0460.78 ± 0.597.1 ± 0.10
Initial composting mixture60.22 ± 1.1842.38 ± 1.011.45 ± 0.1329.35 ± 2.207.53 ± 0.04
Values indicate mean ± standard deviation based on the samples with three replications. MC: moisture content; TOC: total organic carbon; TN: total nitrogen; C/N: ratio of TOC to TN.
Table 2. Design of Experiment.
TreatmentsAeration Rate (L·kg−1 DM·min1)Aeration Flow (L/h)Aeration Method
C10.21100continuous
I10.42 (average 0.21)200Intermittent (aerate 10 min, stop 10 min)
I20.84 (average 0.21)400Intermittent (aerate 5 min, stop 15 min)
Publisher’s Note: MDPI stays neutral with regard to jurisdictional claims in published maps and institutional affiliations.

