Article

Technological Processes for Steel Applications in Nuclear Fusion

1
Karlsruhe Institute of Technology, Institute for Applied Materials, 76344 Eggenstein-Leopoldshafen, Germany
2
Karlsruhe Institute of Technology, Institute for Neutron Physics and Reactor Technology, 76344 Eggenstein-Leopoldshafen, Germany
3
Forschungszentrum Jülich GmbH, Institut für Energie- und Klimaforschung—Plasmaphysik, 52425 Jülich, Germany
4
EUROfusion, PPPT, 85748 Garching, Germany
*
Author to whom correspondence should be addressed.
Appl. Sci. 2021, 11(24), 11653; https://doi.org/10.3390/app112411653 (registering DOI)
Submission received: 7 November 2021 / Revised: 27 November 2021 / Accepted: 29 November 2021 / Published: 8 December 2021
(This article belongs to the Special Issue Breeding Blanket: Design, Technology and Performance)

Abstract

:
Plasma facing components for energy conversion in future nuclear fusion reactors require a broad variety of different fabrication processes. We present, along a series of studies, the general effects and the mutual impact of these processes on the properties of the EUROFER97 steel. We also consider robust fabrication routes, which fit the demands for industrial environments. This includes heat treatment, fusion welding, machining, and solid-state bonding. Introducing and following a new design strategy, we apply the results to the fabrication of a first-wall mock-up, using the same production steps and processes as for real components. Finally, we perform high heat flux tests in the Helium Loop Karlsruhe, applying a few hundred short pulses, in which the maximum operating temperature of 550 °C for EUROFER97 is finally exceeded by 100 K. Microstructure analyses do not reveal critical defects or recognizable damage. A distinct ferrite zone at the EUROFER/ODS steel interface is detected. The main conclusions are that future breeding blankets can be successfully fabricated by available industrial processes. The use of ODS steel could make a decisive difference in the performance of breeding blankets, and the first wall should be completely fabricated from ODS steel or plated by an ODS carbon steel.

1. Introduction

In 2014 the EU started a Pre-Conceptual Design phase to explore and define the technical options for the European demonstration fusion power plant (DEMO). For the breeding blanket—a component within the vacuum vessel, in which neutron energy is converted to thermal energy and which also produces (“breeds”) tritium from lithium—initially four concepts were considered. After a revision of the European Fusion R&D program and strategy, the focus is now on the two most promising concepts, namely, the Helium-Cooled Pebble Bed (HCPB) and Water-Cooled Lithium Lead (WCLL) blankets. These blankets form a torus shaped surface towards the plasma, the first wall (FW), which in turn covers about 1000 m2. The number of single blanket boxes that form the blanket is in the order of 1000 pieces. The International Thermonuclear Experimental Reactor (ITER)—currently under construction in Southern France—will be equipped with testing ports for such blanket boxes. Within a Test Blanket Modul (TBM) program, specific HCPB and WCLL prototype blanket boxes will be tested. A general overview, as well as details, can be found in [1,2,3,4,5,6] and references therein.
By progressing towards the Conceptual Design Phase, there is an increasing demand for industrial and technological feasible processes and a distinctive focus on economic considerations. A preliminary cost estimate on several manufacturing routes for the first wall and other breeding blanket subcomponents showed that Electro Discharge Machining (EDM) or “wire cutting” is a technically and economically sound option for the fabrication of cooling channels in a TBM. For the larger HCPB blanket boxes in a DEMO reactor, however, other solutions might be more appropriate and cost-effective as well [5,7]. Cold Spraying, for example, in combination with subsequent Hot Isostatic Pressing (HIP) is a rather promising technology, not only for the first wall, but for every component that requires complex inner structures (details are given in [7,8]). Additive manufacturing, in general, offers various options in component fabrication for nuclear fusion components, which is outlined in a separate paper within this special issue.
Regardless of concept, design, or new fabrication routes, all approaches of blanket fabrication include similar processes, which play more or less important roles and that cannot be turned down. These are (1) machining, (2) joining, and (3) heat or thermo-mechanical treatments. Therefore, the main scope in the first part of this paper is a series of studies, in which the influence of such typical production processes on the mechanical behavior of the European reference low activation steel EUROFER97 are explored. In all cases, we applied industrially available and approved technologies only.
Moreover, we present in a second part of this paper, a high heat flux test campaign with a prototype (mock-up) of a typical HCPB blanket first wall. The mock-up was produced by applying the most suitable fabrication processes that have been identified in the beforementioned studies. In this context it is important to know that the operating limit of the starter blanket for a European demonstration fusion reactor (DEMO) is predefined by a neutron dose of 20 dpa. In a second stage, the possible lifetime extension of a more advanced blanket will be tested up to doses of about 50 dpa. With today’s available material technology, a dose of 50 dpa can only be survived by increasing the operating temperature in the steel parts to 350 °C or higher. Thus, most likely, the coolant for the second (advanced) blanket of the European DEMO will be helium gas [1,2,3,4].
Regardless of the different breeding blanket concepts, the plasma-facing surface and a layer of several millimeters below is the highest loaded part with regard to thermal as well as neutron load. In this area, at least three main damage modes have to be taken into account: (1) thermal fatigue due to the pulsed plasma operation with some ten-thousand cycles, (2) neutron irradiation hardening and embrittlement as a consequence of displacement damage, and (3) further material damage due to transmutation products, i.e., in steels, this mainly concerns the formation of helium bubbles. Hydrogen is also a transmutation product and may have an additional negative impact on the material properties. A relatively comprising set of irradiation data give a clear view on the displacement damage, which is mainly responsible for the observed irradiation hardening. The effect of helium transmutation in ferritic/martensitic 9Cr-steels, such as EUROFER97, has not been explored yet, sufficiently. Nevertheless, available results indicate that such steels will reach the end of their lifetime when the formation and growth of helium bubbles come to a critical amount or size. At this point, the component will fail by brittle fracturing [9,10,11].
For future fusion power plants, first wall operating temperatures in the range from 450 °C to 550 °C or even higher, would be an effective measure to reduce irradiation hardening significantly (see, for example, [12,13,14,15,16,17]). In this case, the lifetime of helium-cooled breeding blankets would then mainly be determined by the thermo-mechanical load response (thermal fatigue) and by the accumulation and growth of helium bubbles, but not by irradiation hardening and embrittlement. However, the possible effect of thermal aging, which might be enhanced by the neutron irradiation, has to be considered and investigated.
Based on the following facts and assumptions, we have developed a possible strategy for the mitigation of the before-mentioned design limiting material damage scenarios and first wall operating regimes: (1) Neutron dose and related transmutation rates decrease significantly from the first wall towards the back plates, that is, only a plasma-near volume of the blanket receives a critical neutron dose [18,19]. (2) Nanostructured oxide dispersion strengthened (ODS) steels can have an enormous trapping effect on helium, which slows down the formation of helium bubbles beyond a critical size [20]. (3) Compared to conventional steels, ODS steels have a better fatigue and creep resistance. As a consequence, they can be operated at higher temperatures, which would substantially reduce irradiation hardening [21,22,23]. In addition, 9Cr-ODS steels show higher uniform elongations under irradiation, which extends certain design ranges when applying codes such as RCC-MRx [17,24,25].
In summary, producing the plasma facing, highly neutron and heat loaded parts in blankets by an ODS steel in combination with EUROFER97 steel for the remaining structure, would allow a higher heat flux, a longer and safer operating period, and possibly more flexibility in the design. However, in the present study, we follow only a first step in this direction, which is not quite so ambitious, but which provides valuable information nevertheless. If we focus just on the superior thermo-mechanical properties, an ODS steel layer on top of the blanket first wall could, in principle, allow higher coolant temperatures and longer component operating-times. For this, an ODS steel plating of 2–3 mm on top of a EUROFER97 based cooling structure—the breeding blanket with cooling channels according to the current designs—would be required.
A first verification of the suggested strategy took about 7 years, starting with the idea and ending after the final destructive post-high-heat-flux-test analyses, during which we followed three main lines of research, development, and investigation: (1) production of thin ODS steel plates on the lab-scale as well as industrial size in the order of 100 kg; (2) design and manufacture of a testable DEMO breeding blanket first wall mock-up; and (3) cyclic high heat flux loading in a helium cooling loop and subsequent analyses.
The mock-up we discuss and report in this paper is a first-of-its-kind, worldwide. For both, ODS plate and mock-up fabrication, we placed the emphasis on available or technologically scalable processes that are especially appropriate for industrial applications. Another novelty of this study is the cyclic high heat flux test in a helium cooling loop, in which the surface temperature of a first wall mock-up could be intentionally increased above 550 °C, which is the common operating limit of the nuclear fusion steel EUROFER97.

2. EUROFER97

Within the European Fusion research program, the first so-called low-activation alloys CeTa and TaHf were produced in 1986. For these, all alloying elements with long decay times due to high activation by neutron irradiation (Nb, Mo, Ni, Al) were substituted by Ta, W, and Ce. The alloys were specified along the lines of international fusion material development programs. A variety of CrWVTa experimental alloys (LA series) had been already produced and tested, in particular by the Culham Laboratory/British Steel, UK. The specification of the alloys was based on activation calculations which, at that time, were characterized by contradictions regarding element activation due to different spectra, computation methods, and nuclear data libraries. At that time, at least in part, only simple neutron-induced collision processes were taken into account. Nonetheless, the introduction of sequential reactions allowed to plot generally accepted decay curves, which formed the basis for a new set of specifications for low activation steels. In these, several alloying elements were rejected or limited (Hf, Ta, W) and new upper limits were obtained for all tramp elements that would increase the activation. Part of these limits is found to be in the ppm and sub-ppm range and cannot be fully achieved metallurgically and analytically. This is the reason why these steels are also referred to as reduced activation ferritic/martensitic (RAFM) steels.
Then, the development line of the OPTIFER (Optimized Ferrite) alloys started at Forschungszentrum Karlsruhe in 1992 within the framework of the European Long-term Programme. The OPTIFER alloys are 9.5% Cr-Mn-V-Ta steels with 1% W or variants with germanium replacing tungsten. Parallel to the work on OPTIFER, a Japanese version of an 8% Cr-Mn-V steel with 2% W has been investigated since 1994. This RAFM steel, called F82H-mod, was produced as a batch of 5 tons by JAERI/NKK and made available in form of plate materials by IEA to European laboratories for joint examinations.
Based on the physical, mechanical, and structural data obtained for OPTIFER and F82H-mod, combined with the findings made by various European institutes with regard to low activation alloys (UK, France), BATMAN alloys (Italy), and OPTIMAX steels (Switzerland), a specification was set up for a European reference alloy—the EUROFER steel. Funded by the European Commission, the first so-called EUROFER97 batches were ordered from Böhler Edelstahl GmbH, Austria, in 1998. Motivation for this industrial heat can be summarized as follows:
  • Gathering experience with the industrial production of a high purity steel and comparison with experimental heat production details.
  • Gathering information about forming properties, homogeneity of mechanical and structural properties, and targeting specified mechanical and microstructural characteristics.
  • Gaining technological results from the production of a test blanket module with respect to forming and weldability.
Five melts were produced by vacuum arc-melting in a rotating electrode facility (ROTEL) and casted into cylindrical blocks of about 2 tons each. Thereafter, the blocks were remolten in another vacuum arc melting (VAR) facility: 3 blocks with diameters of 510 mm, 2 blocks with diameters of 410 mm. The 3 bigger blocks were then forged into slabs with cross-sections of 190 mm × 520 mm and the 2 smaller blocks were round forged to diameters of 200 mm. The slabs were hot-rolled to one plate of 8 mm, one of 14 mm, and two of 25 mm thickness at temperatures between 1150 °C and 1180 °C. The following final heat treatment was conducted: 980 °C for 27 min, followed by air cooling to room temperature, and tempering at 760 °C for 90 min, followed by air cooling. The final plate dimensions were 3500 mm × 1500 mm × 8 mm, 3600 mm × 1500 mm × 14 mm, and 3800 mm × 1200 mm × 25 mm. In addition, a 1.5 mm thick plate was produced. One of the cylindrical blocks was further forged, heat treated, and finally turned to a rod of 100 mm diameter. The second cylindrical block was used for pipe and wire fabrication. The wire with a diameter of 1 mm was later used as filler material for Tungsten-Inert-Gas (TIG) welding.
In total, the EUROFER97 semi-finished products, which were ultimately delivered in 1999, amounted to 3.5 tons, of which the plates weight 2.5 tons, the rod 800 kg, the wire 200 kg, and the pipes 90 kg. The heat numbers are: E83698 (1.5 mm, 8 mm and 14 mm plates), E83694 and E83697 (25 mm plates), E83699 (100 mm rods), and D83350 (1 mm wire).
In 2002, an order of a second EUROFER batch of about 8 tons was prepared and placed at Saarschmiede, Germany. By end of 2003, two 100 mm rods (heat no. 993378 and 993394) and in 2005, additional plates (8 mm—993394P, 14 mm—993393, 25 mm—993391 and 993402) were delivered. This second batch was then referred to as EUROFER97/2. An important goal of the procurement was to verify the reproducibility of the satisfying properties of the EUROFER97 alloy. This EUROFER97/2 material was mainly used for technological tests and further fabrication trials for Test Blanket Module mock-ups.
In the meantime, by order of Fusion for Energy (F4E), a third and a fourth batch (EUROFER97/3 and EUROFER97/4) was produced. The order of a fifth batch is in preparation.
The chemical compositions of the heats related to this paper are given in Table 1.

3. Heat Treatment

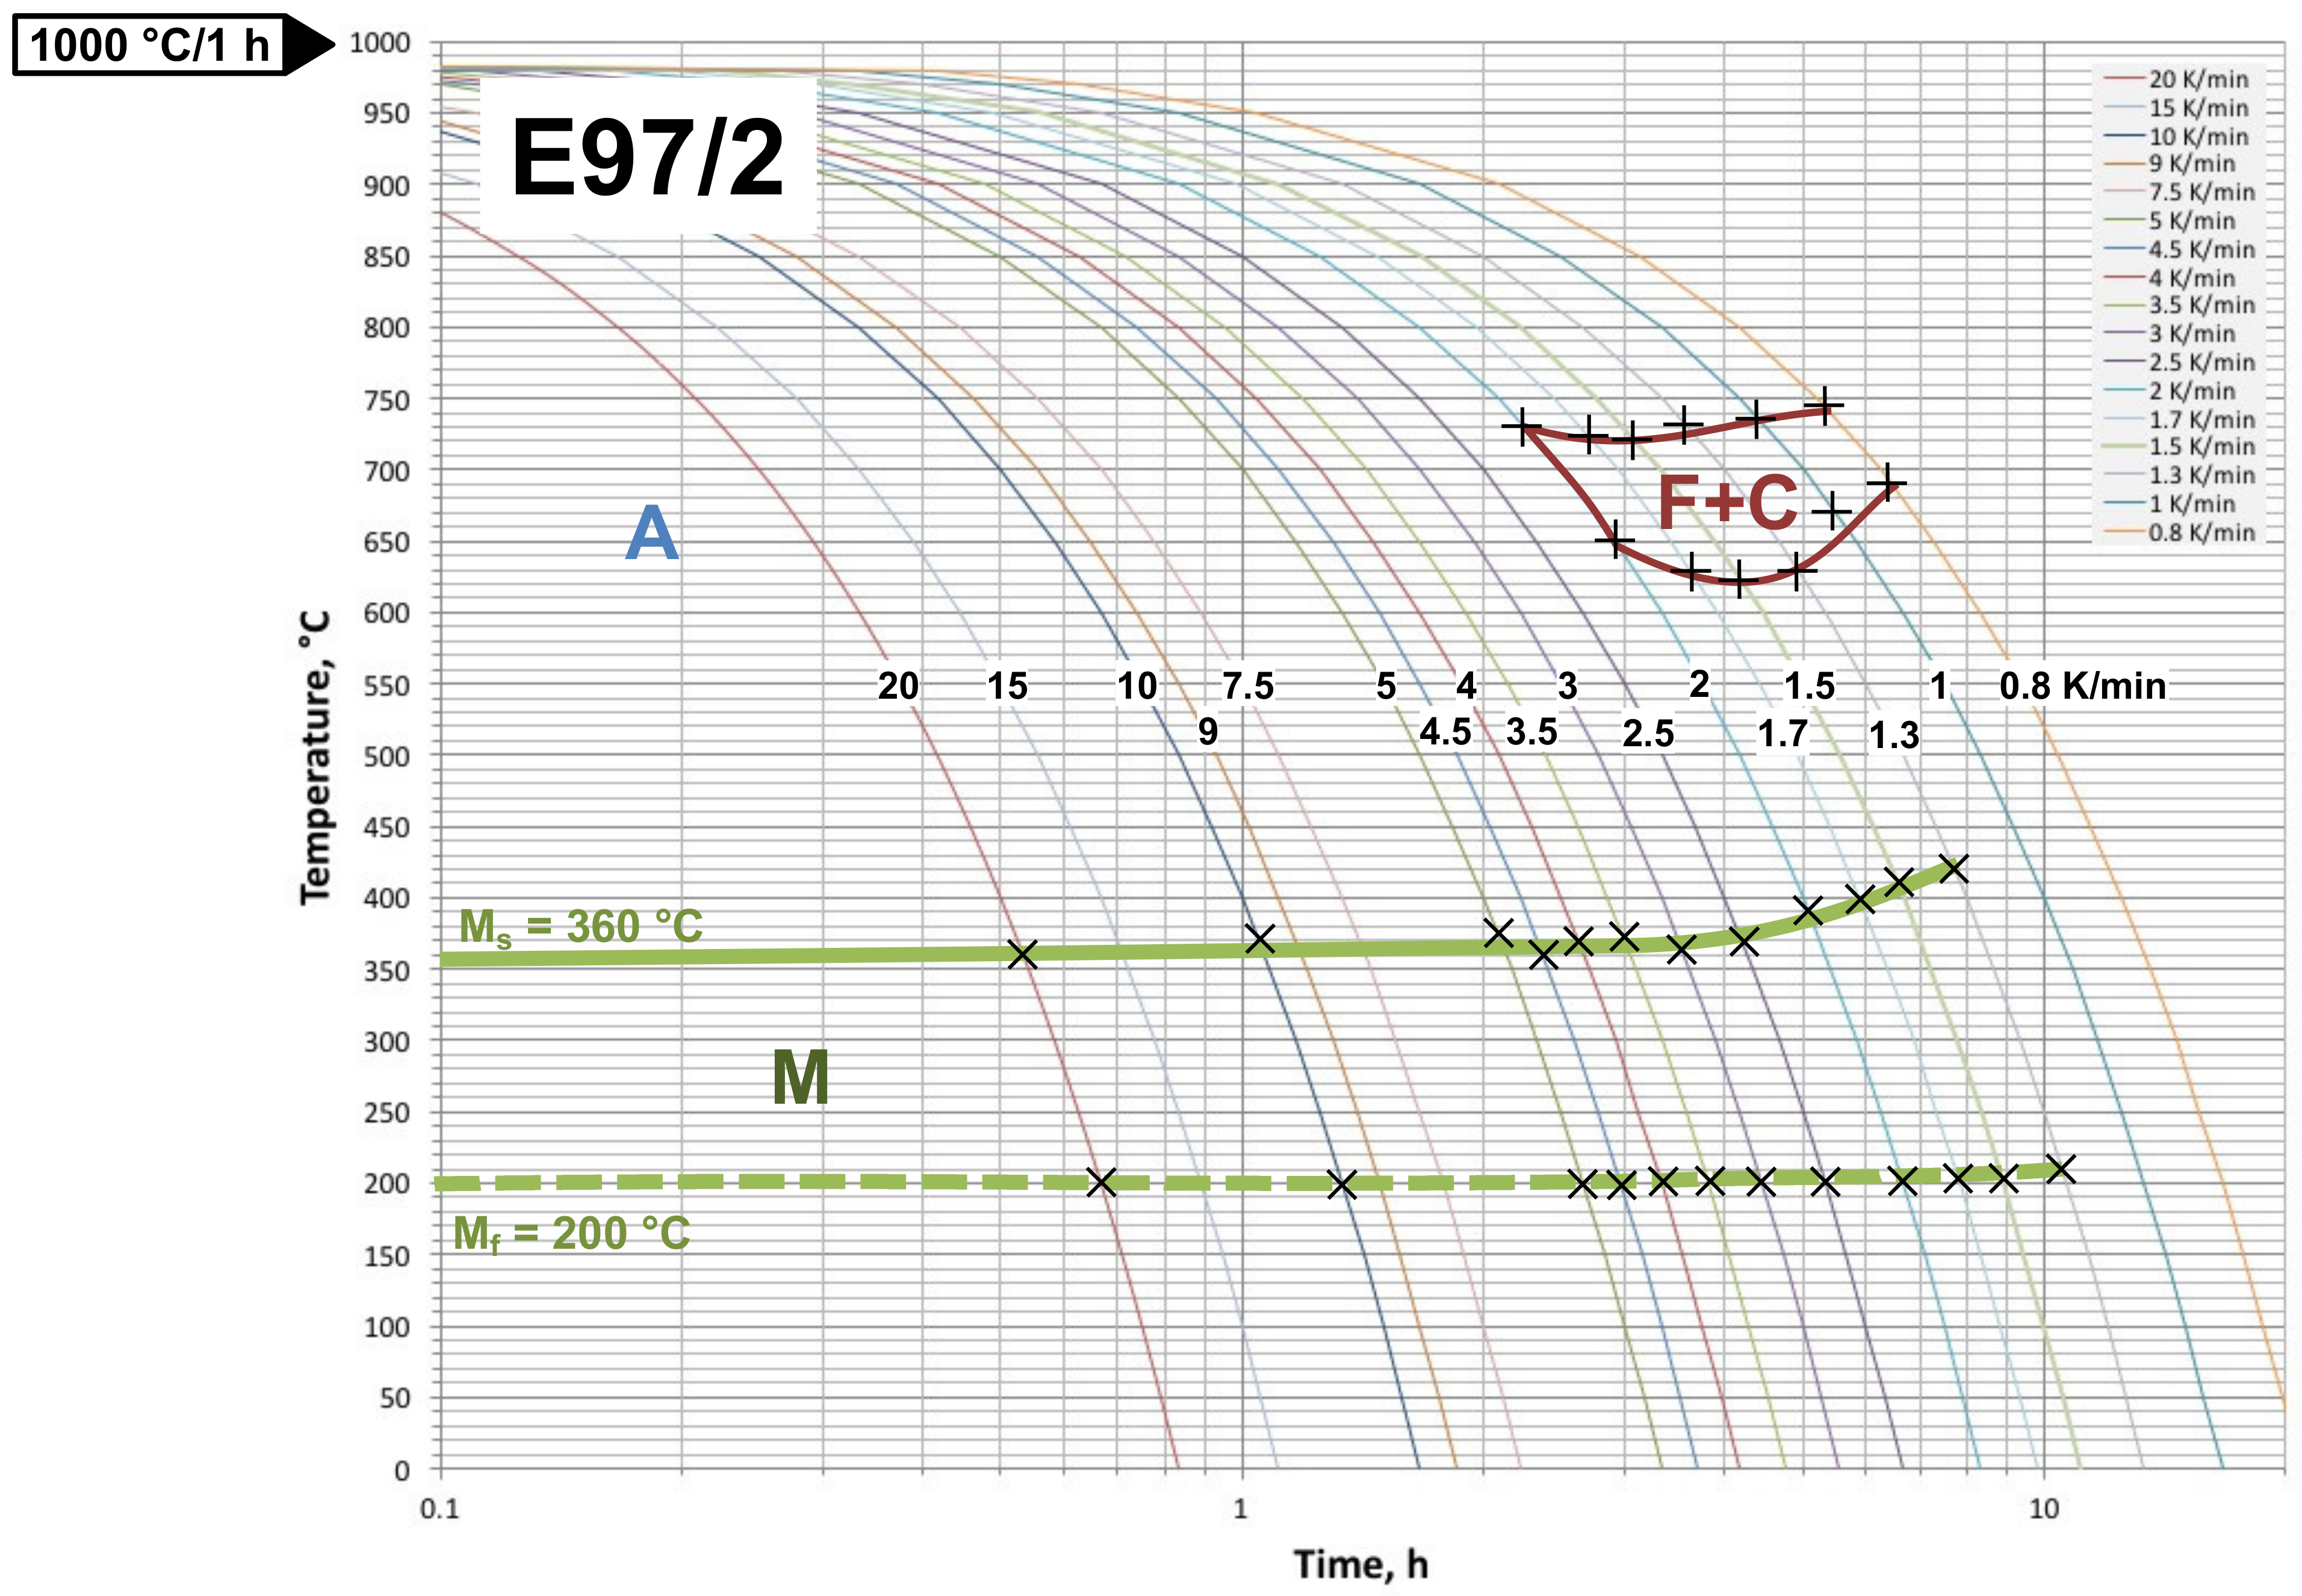
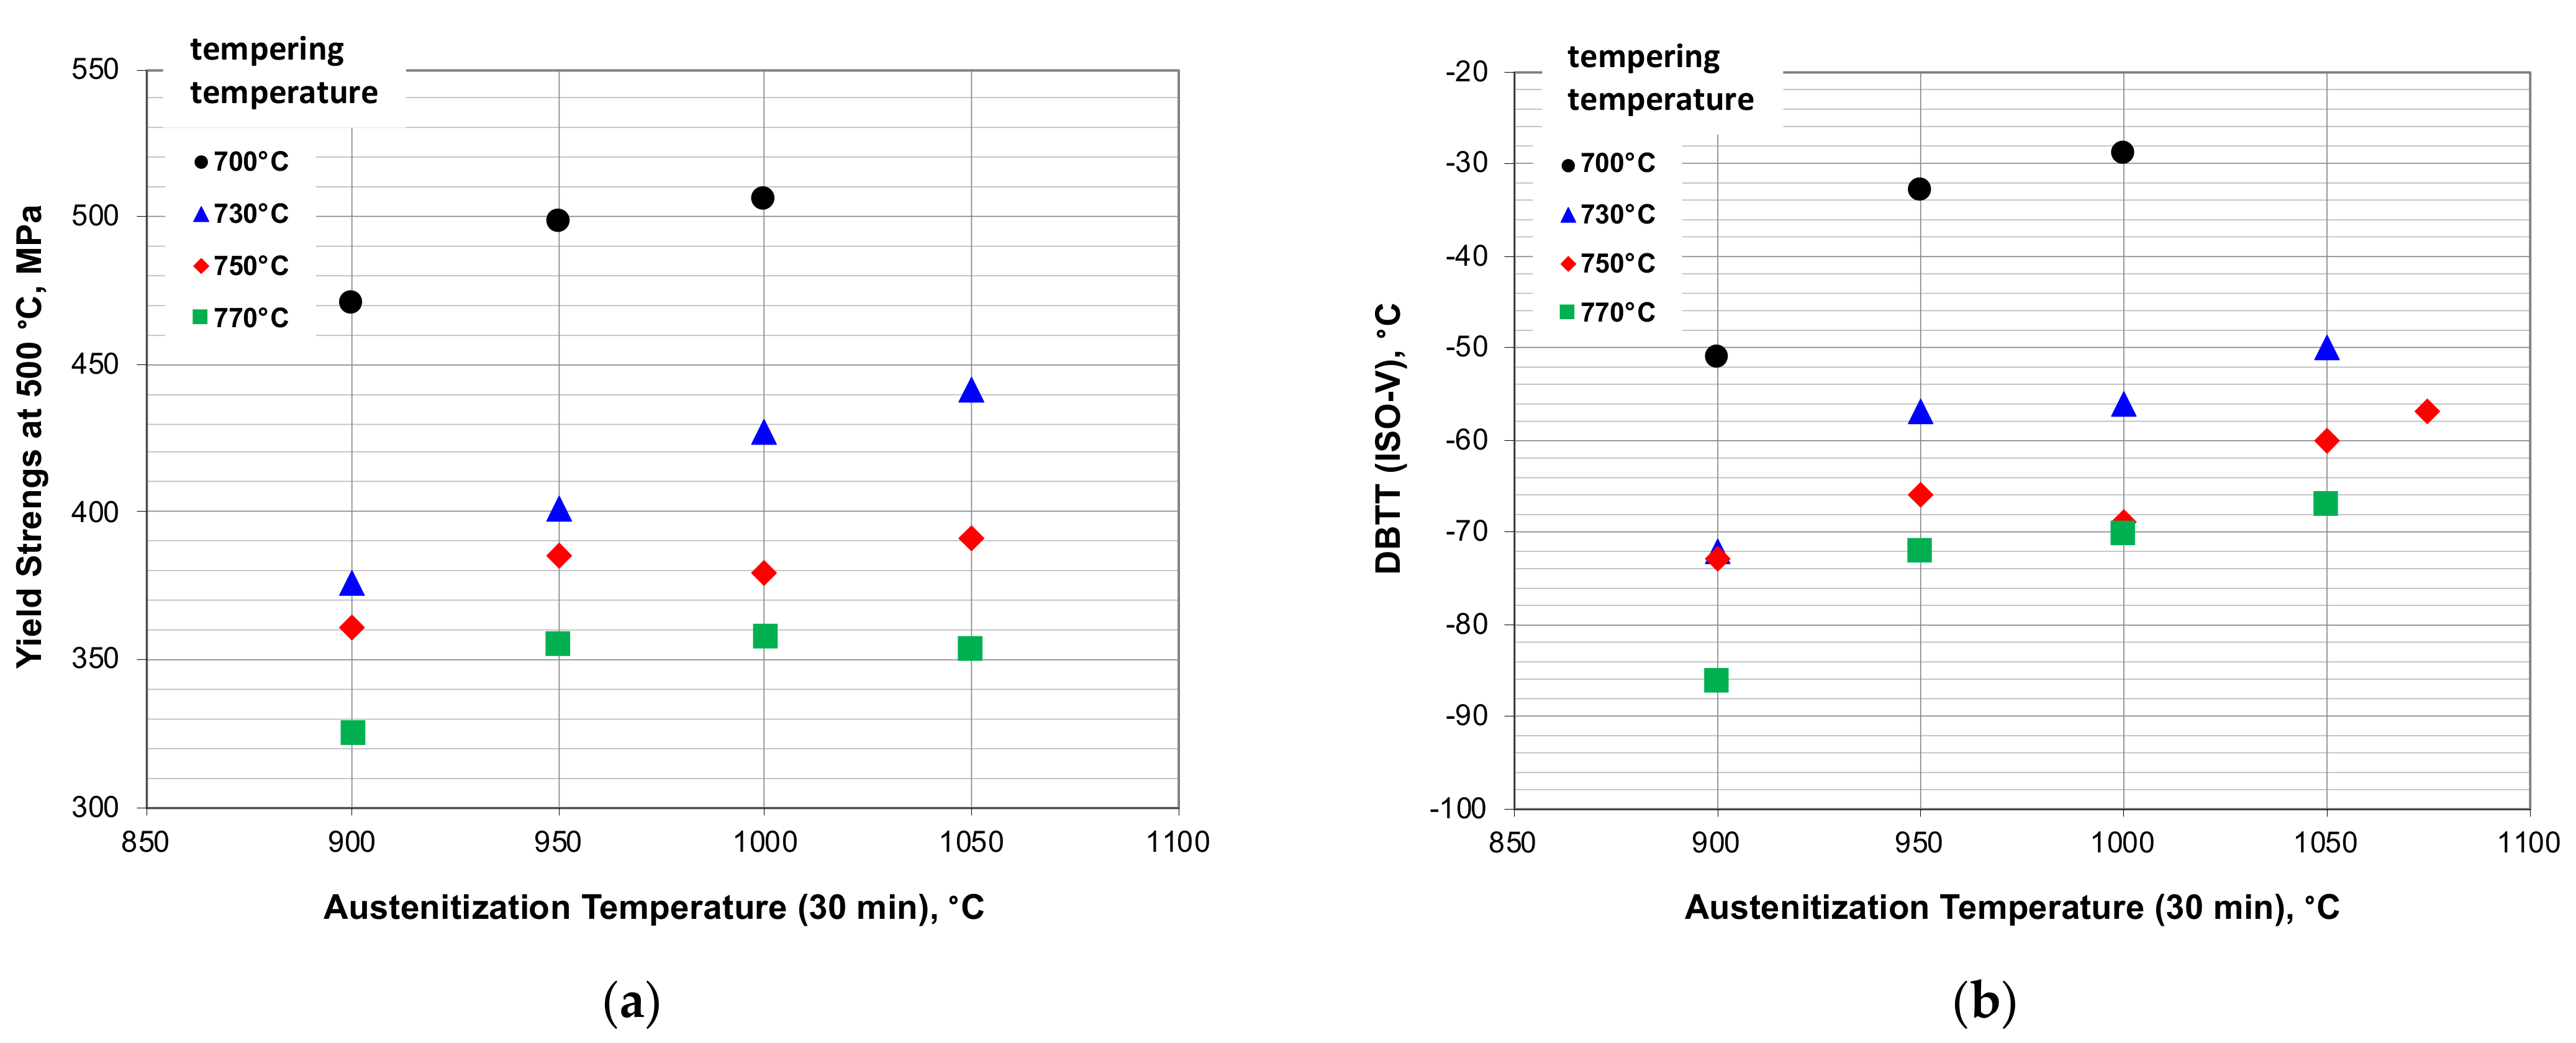
3.1. Austenitization, Quenching, Tempering, Phase Transitions, Mechanical Properties

Opposed to ferritic and austenitic steels, the mechanical properties of martensitic steels, such as EUROFER97, are tunable by thermal (or heat) treatments within a certain range. With an austenitization treatment (usually between 950 °C and 1100 °C for 30–60 min) the EUROFER97 alloys recrystallizes in the austenite phase above the austenite transition temperature Ac1. Depending on the degree of cold work and heating duration, the austenite grain size may be adjusted: the higher the temperature, the larger the grains (examples are given in [26]). However, this austenitic phase can only exist at temperatures higher than Ac1e. During quenching below a certain temperature Ms and exceeding a critical cooling rate (for martensitic steels, the cooling rates achieved in air are sufficient), the austenite phase transforms into a martensite phase, which hardens and embrittles the steel significantly. For EUROFER97, Ms is about 390 °C and the critical cooling rate for the formation of martensite is in the order of a few K/min. When quenching is performed below the critical cooling rate, the austenite phase decays into ferrite and carbide, which is a rather soft and ductile material state. The details of this austenite decay are compiled in so-called Time Temperature Transition (TTT) diagrams. In the case of cooling from the austenite phase with constant cooling rates, Figure 1 shows the corresponding diagram for EUROFER97/2. Figure 2 illustrates the situation for phase transitions that occur during constant tempering, immediately after austenitization.
The microstructure of martensite shows distinctive features: the prior austenite grains are interspersed by blocks that are oriented differently. The blocks, in turn, consist of parallel oriented needles. Sometimes, this material condition is called hard or hardened martensite. Austenite (existing at high temperatures) has a rather high solubility for carbon and nitrogen while in ferrite (forms below Ac1) the solubility of these elements is almost negligible. Therefore, quenching leads to an oversaturated (forced) solution of carbon, which, in turn, distorts the bcc unit cell into a tetragonal shape. This is also the reason for the formation of martensite blocks and needles.
Hardened martensite may be softened—accompanied by increasing ductility—by a tempering heat treatment. This has to be performed below the transition temperature Ac1b, which is at or around 800 °C for EUROFER97 steel (see Figure 3). Usually, tempering is performed at 700–780 °C for 2 h (see Figure 3) but the effect starts to show already at temperatures above 550 °C. During the tempering treatment, the carbon diffuses out of the oversaturated lattice to laths and prior austenitic grain boundaries and forms carbide precipitates (mainly M23C6, where M stands for Cr, W, Mn). Thus, the previously tetragonal lattice relaxes into bcc. However, the distinct microstructure containing blocks and needles mainly remains the same, but now the formation of carbides at the boundaries can be recognized in addition. The tempering treatment may be stopped after the carbon diffusion is completed. Since the diffusion rate is highly temperature dependent, the material is softer after tempering at a higher compared to a lower temperature for the same duration. This material condition is sometimes referred to as tempered martensite.
Heat treating EUROFER97 steels at 1100–1150 °C is called solution annealing, since at such high temperature, precipitates and intermetallic phases (e.g., MX, M23C6, laves, and sigma phase) dissolve completely in the matrix. By solution annealing, the EUROFER97 steel is transformed into one homogeneous phase—austenite. In summary, a full heat treatment of martensitic steels consists of (1) austenitization (or solution annealing), (2) quenching (in air, water, or oil), and (3) tempering. The first and second step is also called hardening (treatment). In the following, the term “standard heat treatment” for EUROFER97 steels is defined to be 980 °C/0.5 h + quenching + 750–760 °C/2 h.
EUROFER97 is in the martensitic state resistant to aging at temperatures up to 550 °C for periods of about 20,000 h. That is, at temperatures below 550 °C (and in the absence of irradiation effects) the microstructure of EUROFER97 steels remains stable on the time scale of several years. However, when exposed to 550 °C for longer periods, intermetallic phases (sigma and chi) begin to form in addition to carbide coarsening. Above 550 °C, aging accelerates.
Austenitization at temperatures between 900 °C and 1150 °C, leads to HV30 Vickers hardness between 400 and 420. By tempering, the hardness can be reduced significantly down to about 200 HV30, as can be clearly recognized in Figure 3. Figure 4 shows that the basic material properties yield strength and DBTT can be adjusted within a broad range by a suitable combination of austenitization and tempering treatment. For EUROFER97, the effect of the austenitization temperature on DBTT is higher than its impact on the yield stress at 500 °C.

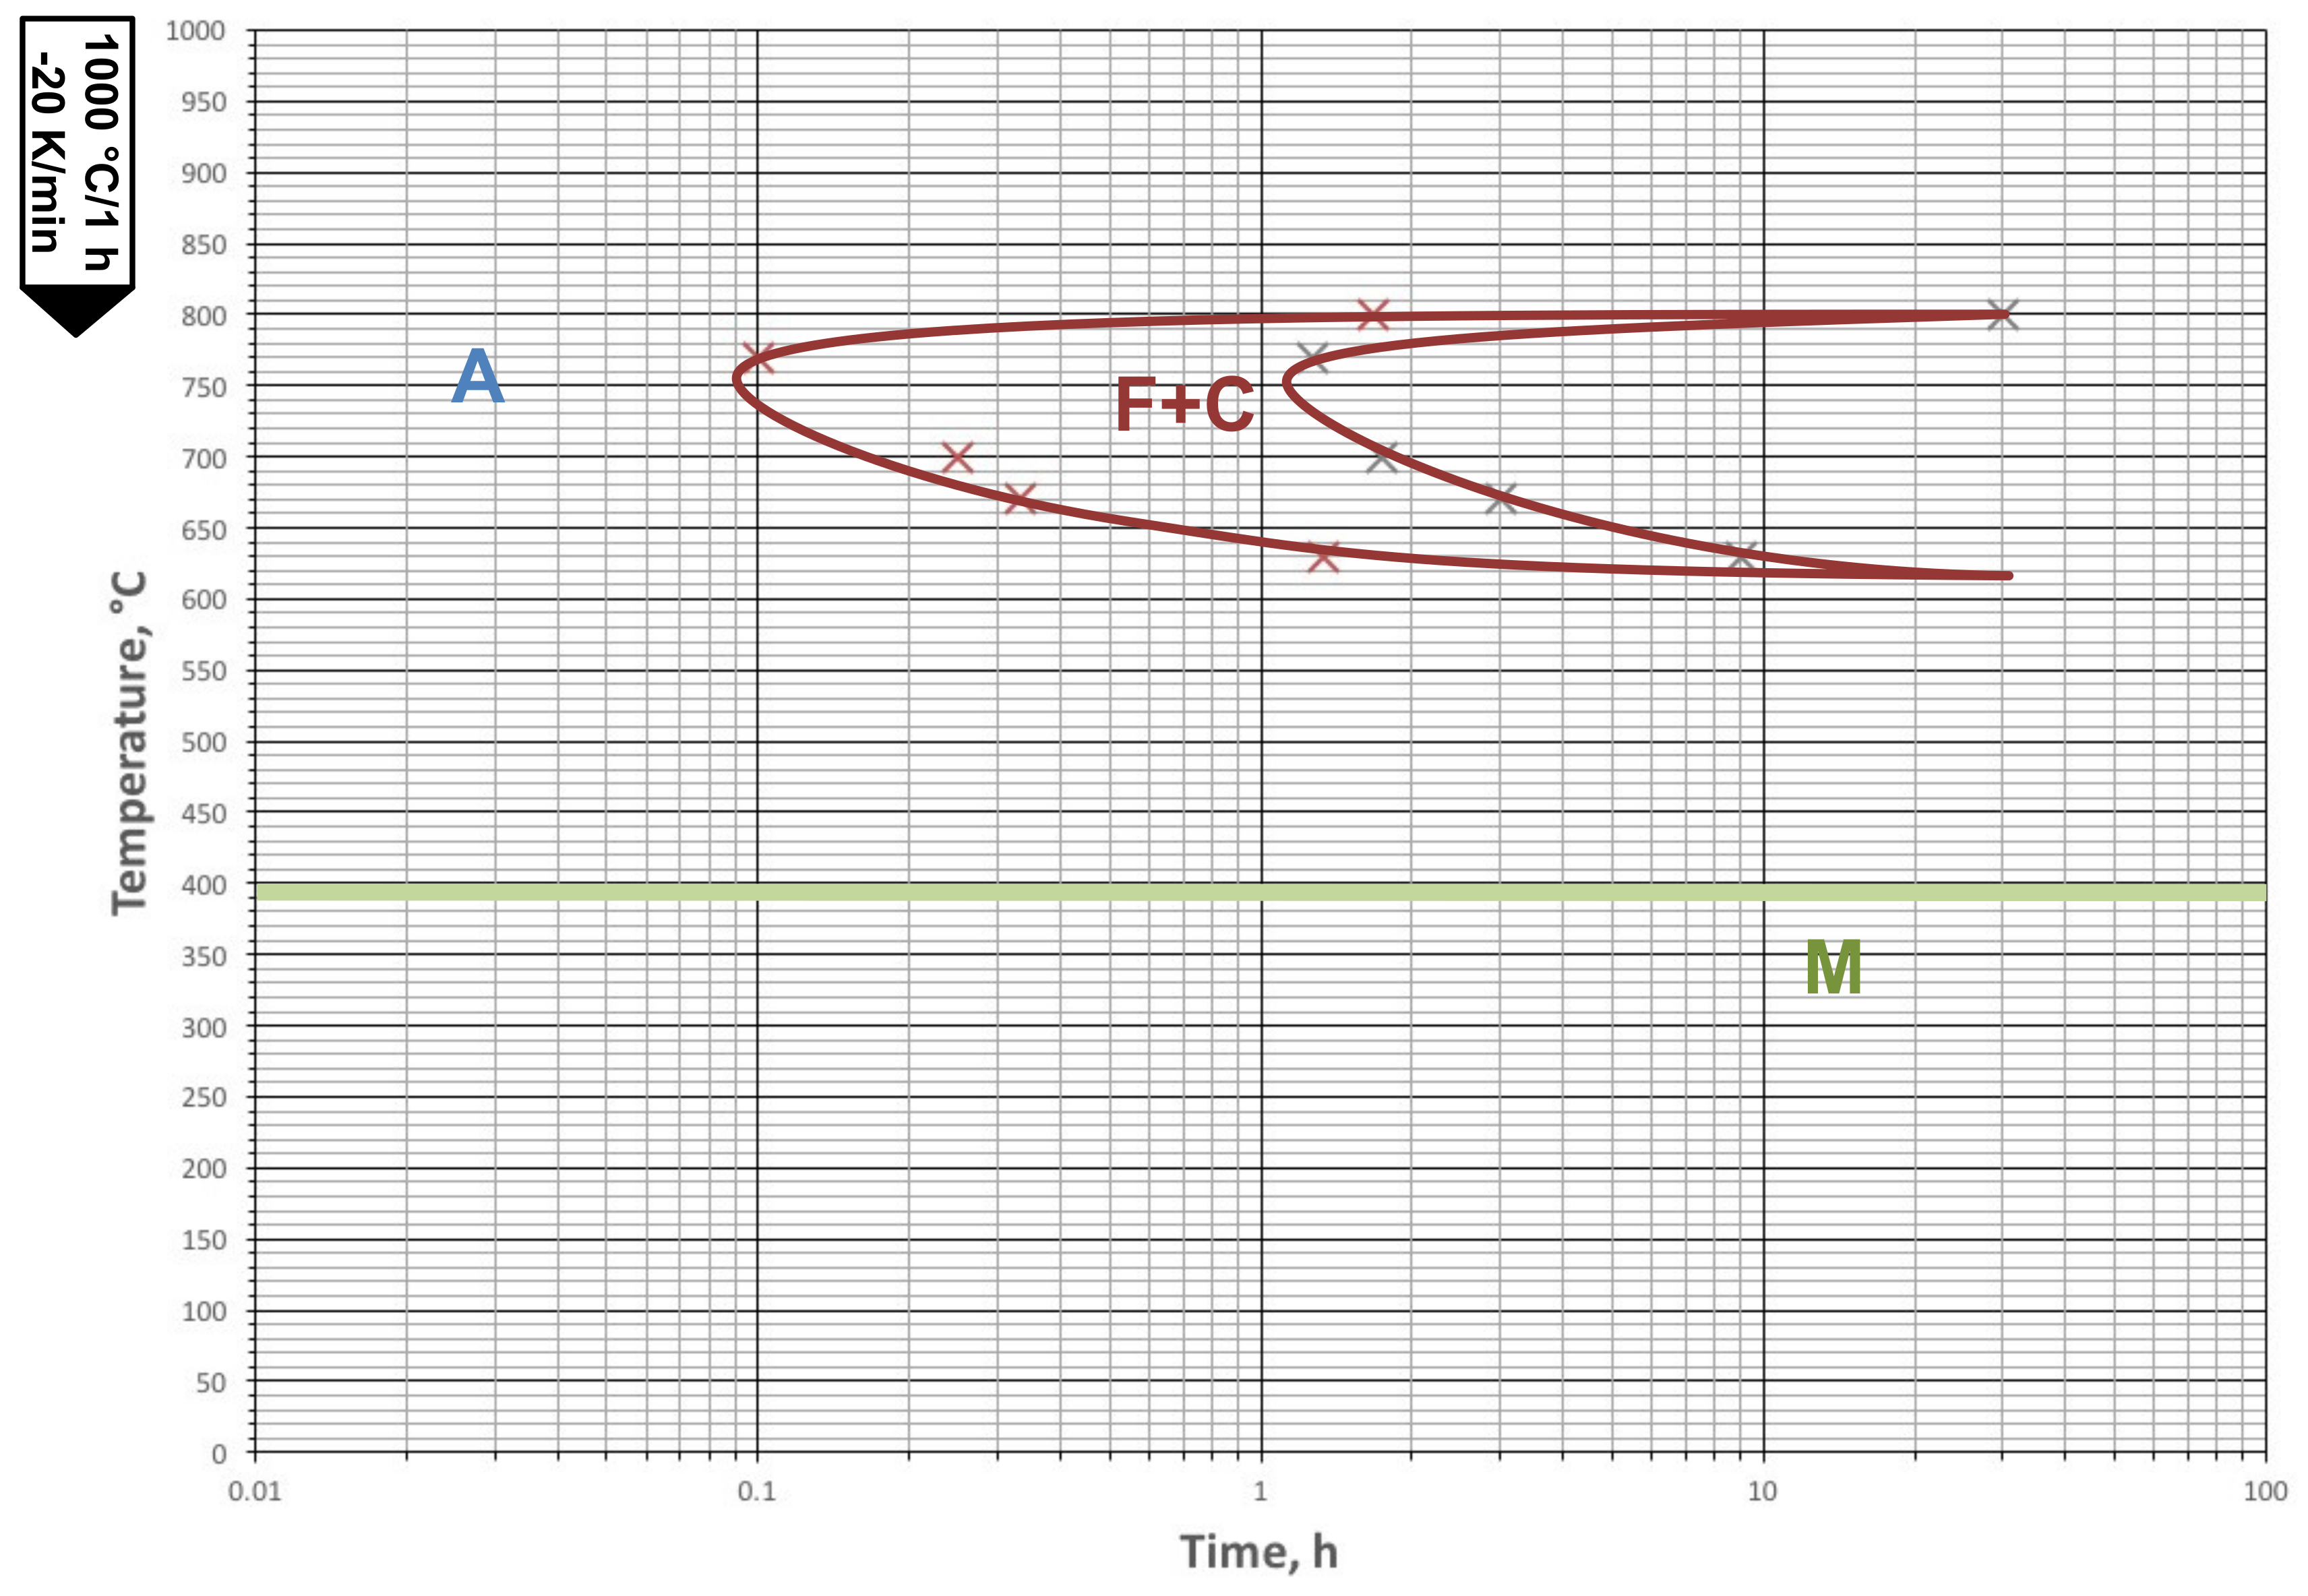
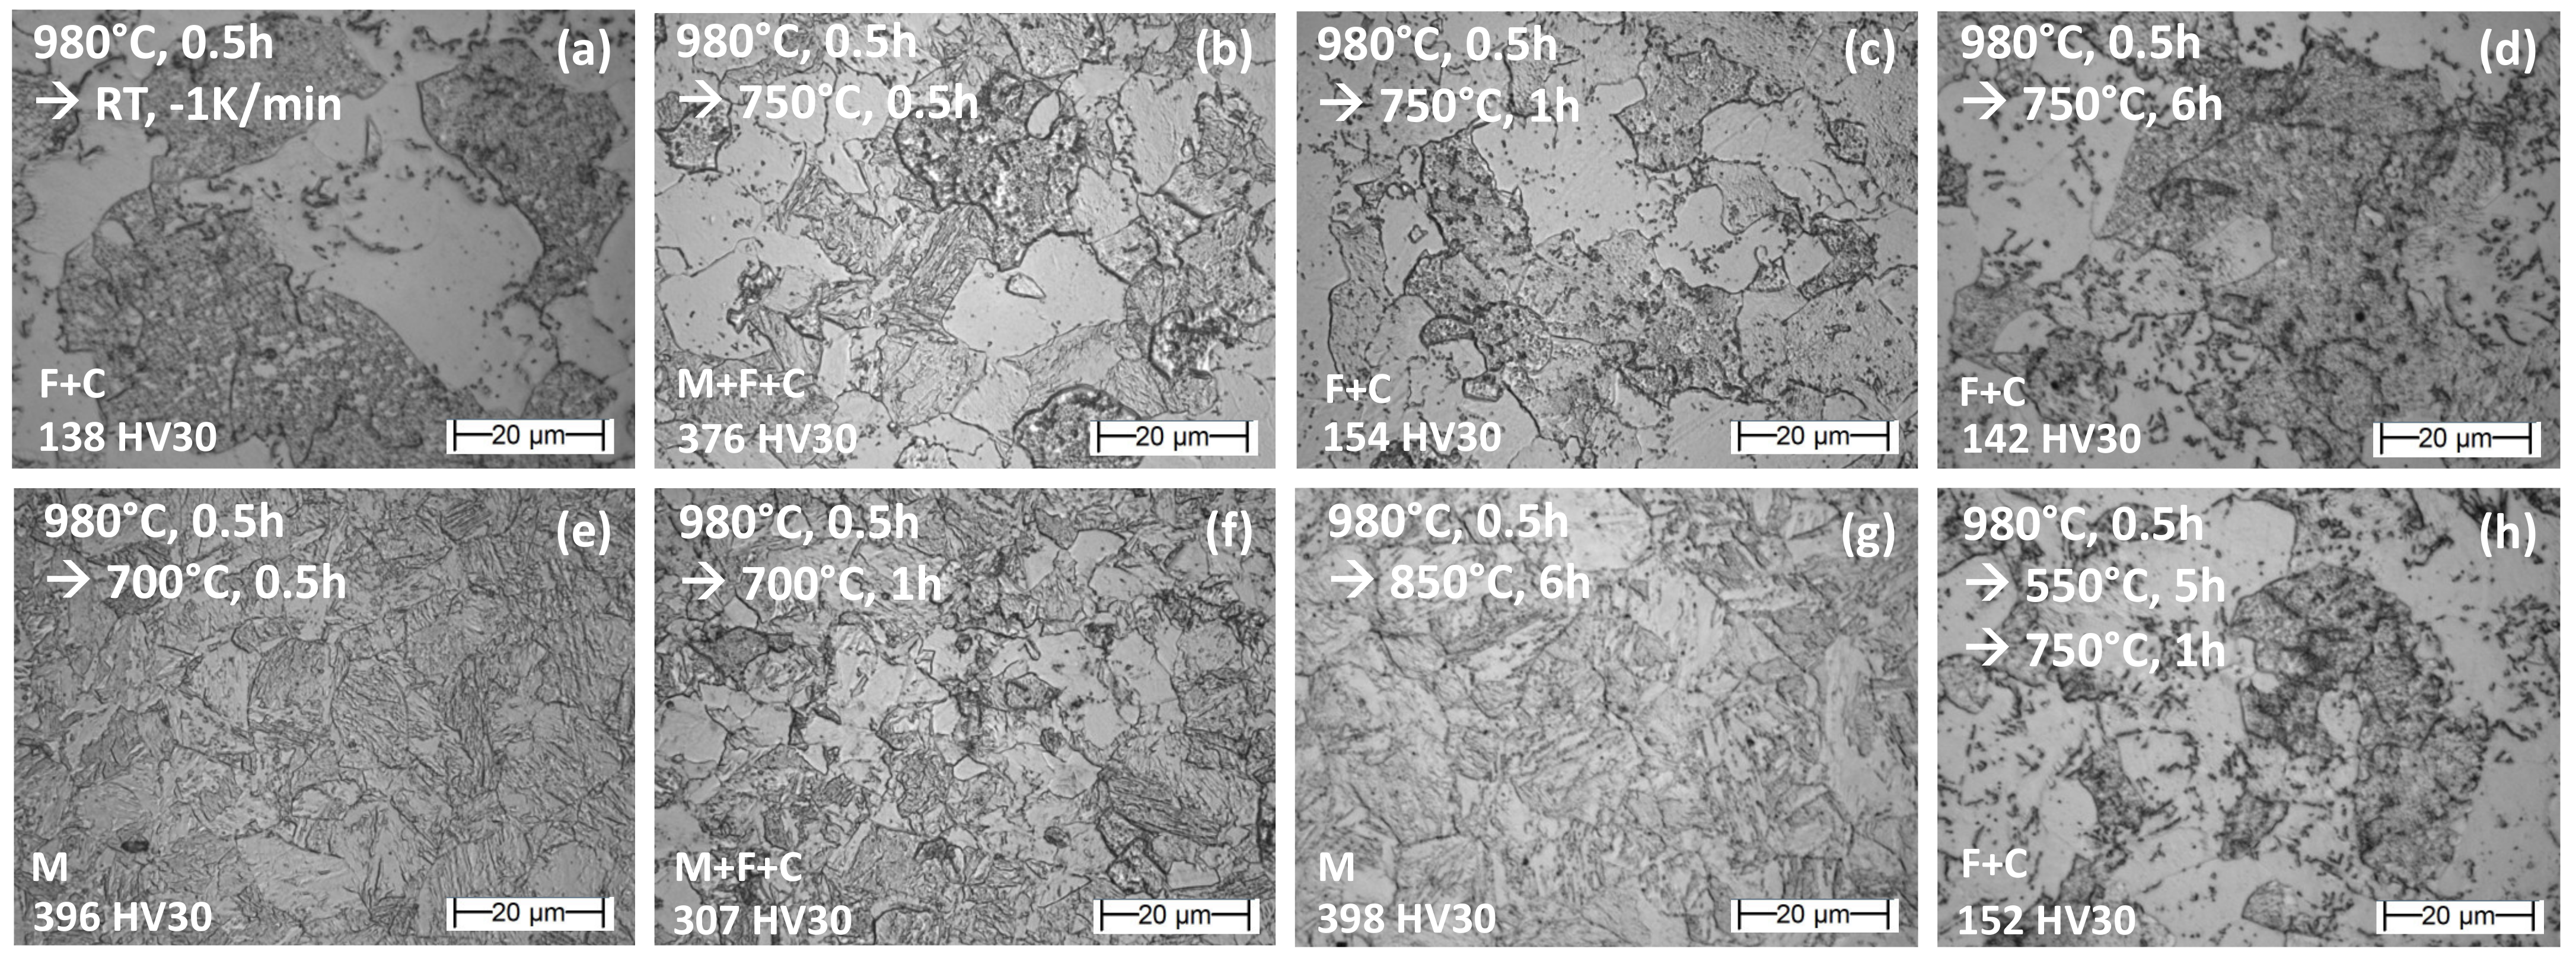
3.2. Uncontroled Temperature Excursions

There are many processes involved in manufacturing, which could lead, unintentionally or by accident, to uncontrolled excursions of the component’s temperature. These could be, for example, welding, heat treatment, or hot forming. In the worst case, such events lead to the formation of ferrite and carbide (see phase fields F + C in Figure 1 and Figure 2). A simple example is a slow cooling rate after austenitization. This might occur by switching of the furnace or by an electrical defect. In most cases, the microstructure of EUROFER97 ends up as F + C phases, which makes the piece of material or component very soft, as shown in Figure 5a. Depending on the EUROFER heat and austenitization temperature, this unwanted transformation occurs for cooling rates below about 3 K/min (see Figure 1 for the case of EUROFER97/2). The recovery of the work piece that in this F + C condition, would require solution annealing before the full heat treatment could be repeated, which is time consuming, can be costly, and in some cases is not feasible due to the high temperatures.
Another effect, which can easily happen during TIG welding, for example, is based on keeping the material (or parts of the work piece) on a constant high temperature immediately after austenitization. Possible phase formation can be predicted by applying the isothermal TTT diagram in Figure 2 for such cases. When the temperature in a fusion weld (e.g., TIG weld) drops to 750 °C and stays about constant for a while, then already 5 min time is sufficient to start the formation of the soft F + C phase. Experimental validation for this behavior is given in Figure 5b–d. While 30 min isothermal heating reduces the hardness notably, after one hour, full transition into F + C is reached. A further exposure to 750 °C, e.g., for 6 h, such as in case (d)—does not lead to additional changes.
Fortunately, this effect is quite sensitive to a small temperature interval around 750 °C. A further deviation in the range 650 °C to 800 °C shifts the starting point of the F + C formation toward higher periods. Examples for 700 °C are given in Figure 5e,f, where can be seen that even exposure of 30 min does not prevent fully martensite formation. After one hour at 700 °C, however, the onset of F + C phase reduces the hardness clearly.
Before we come to a final and possibly relevant case, let us discuss the following scenario. If an EUROFER97 work piece, starting from austenitization, is cooled to 550 °C, and then kept at 550 °C for a time, maybe even days, prior to the final air cooling, what would happen? It would fully transfer into martensite, as can be predicted by applying the TTT diagrams in Figure 1 and Figure 2. At 550 °C the undercooled austenite phase is stable and does not transform. Only during the final quench, it decays into martensite. But what would happen when in a similar scenario the temperature would be kept at 850 °C for 6 h before air quenching? Figure 2 shows that at 850 °C the material is still in the austenitic phase. Then, air quenching starting from 850 °C with typically 10 K/min leads to fully martensitic transformation (see Figure 1). The result is shown in Figure 5g.
Now we assume that the work piece, after austenitization, is kept at 550 °C for 5 h and then the temperature is increased up to 750 °C for one hour time, followed by the final air cooling. Applying the TTT diagram from Figure 2 could lead to the assumption that this temperature-time curve circumvents the F + C phase region, and therefore, full martensite transformation should be observed. But this is not the case! Since the second isothermal tempering step starts from austenite, the fact that the starting point is undercooled austenite, which is quickly heated up from 550 °C to 750 °C, does not make a difference; the “clock” for reading the TTT diagram has to be set to zero again. That is, the second step of 750 °C, in reality has to be considered as a new or first isothermal treatment. Therefore, the result (Figure 5h) is the same as for case (c) in Figure 5. This means, that whenever a workpiece or component of EUROFER97 steel is in the austenitic state (by subcooling this may the case at temperatures as low as about 400 °C), even short excursions into the 750 °C regime lead to the formation of the ferrite and carbide phases (F + C), which in turn causes the above mentioned negative impact on the material properties.

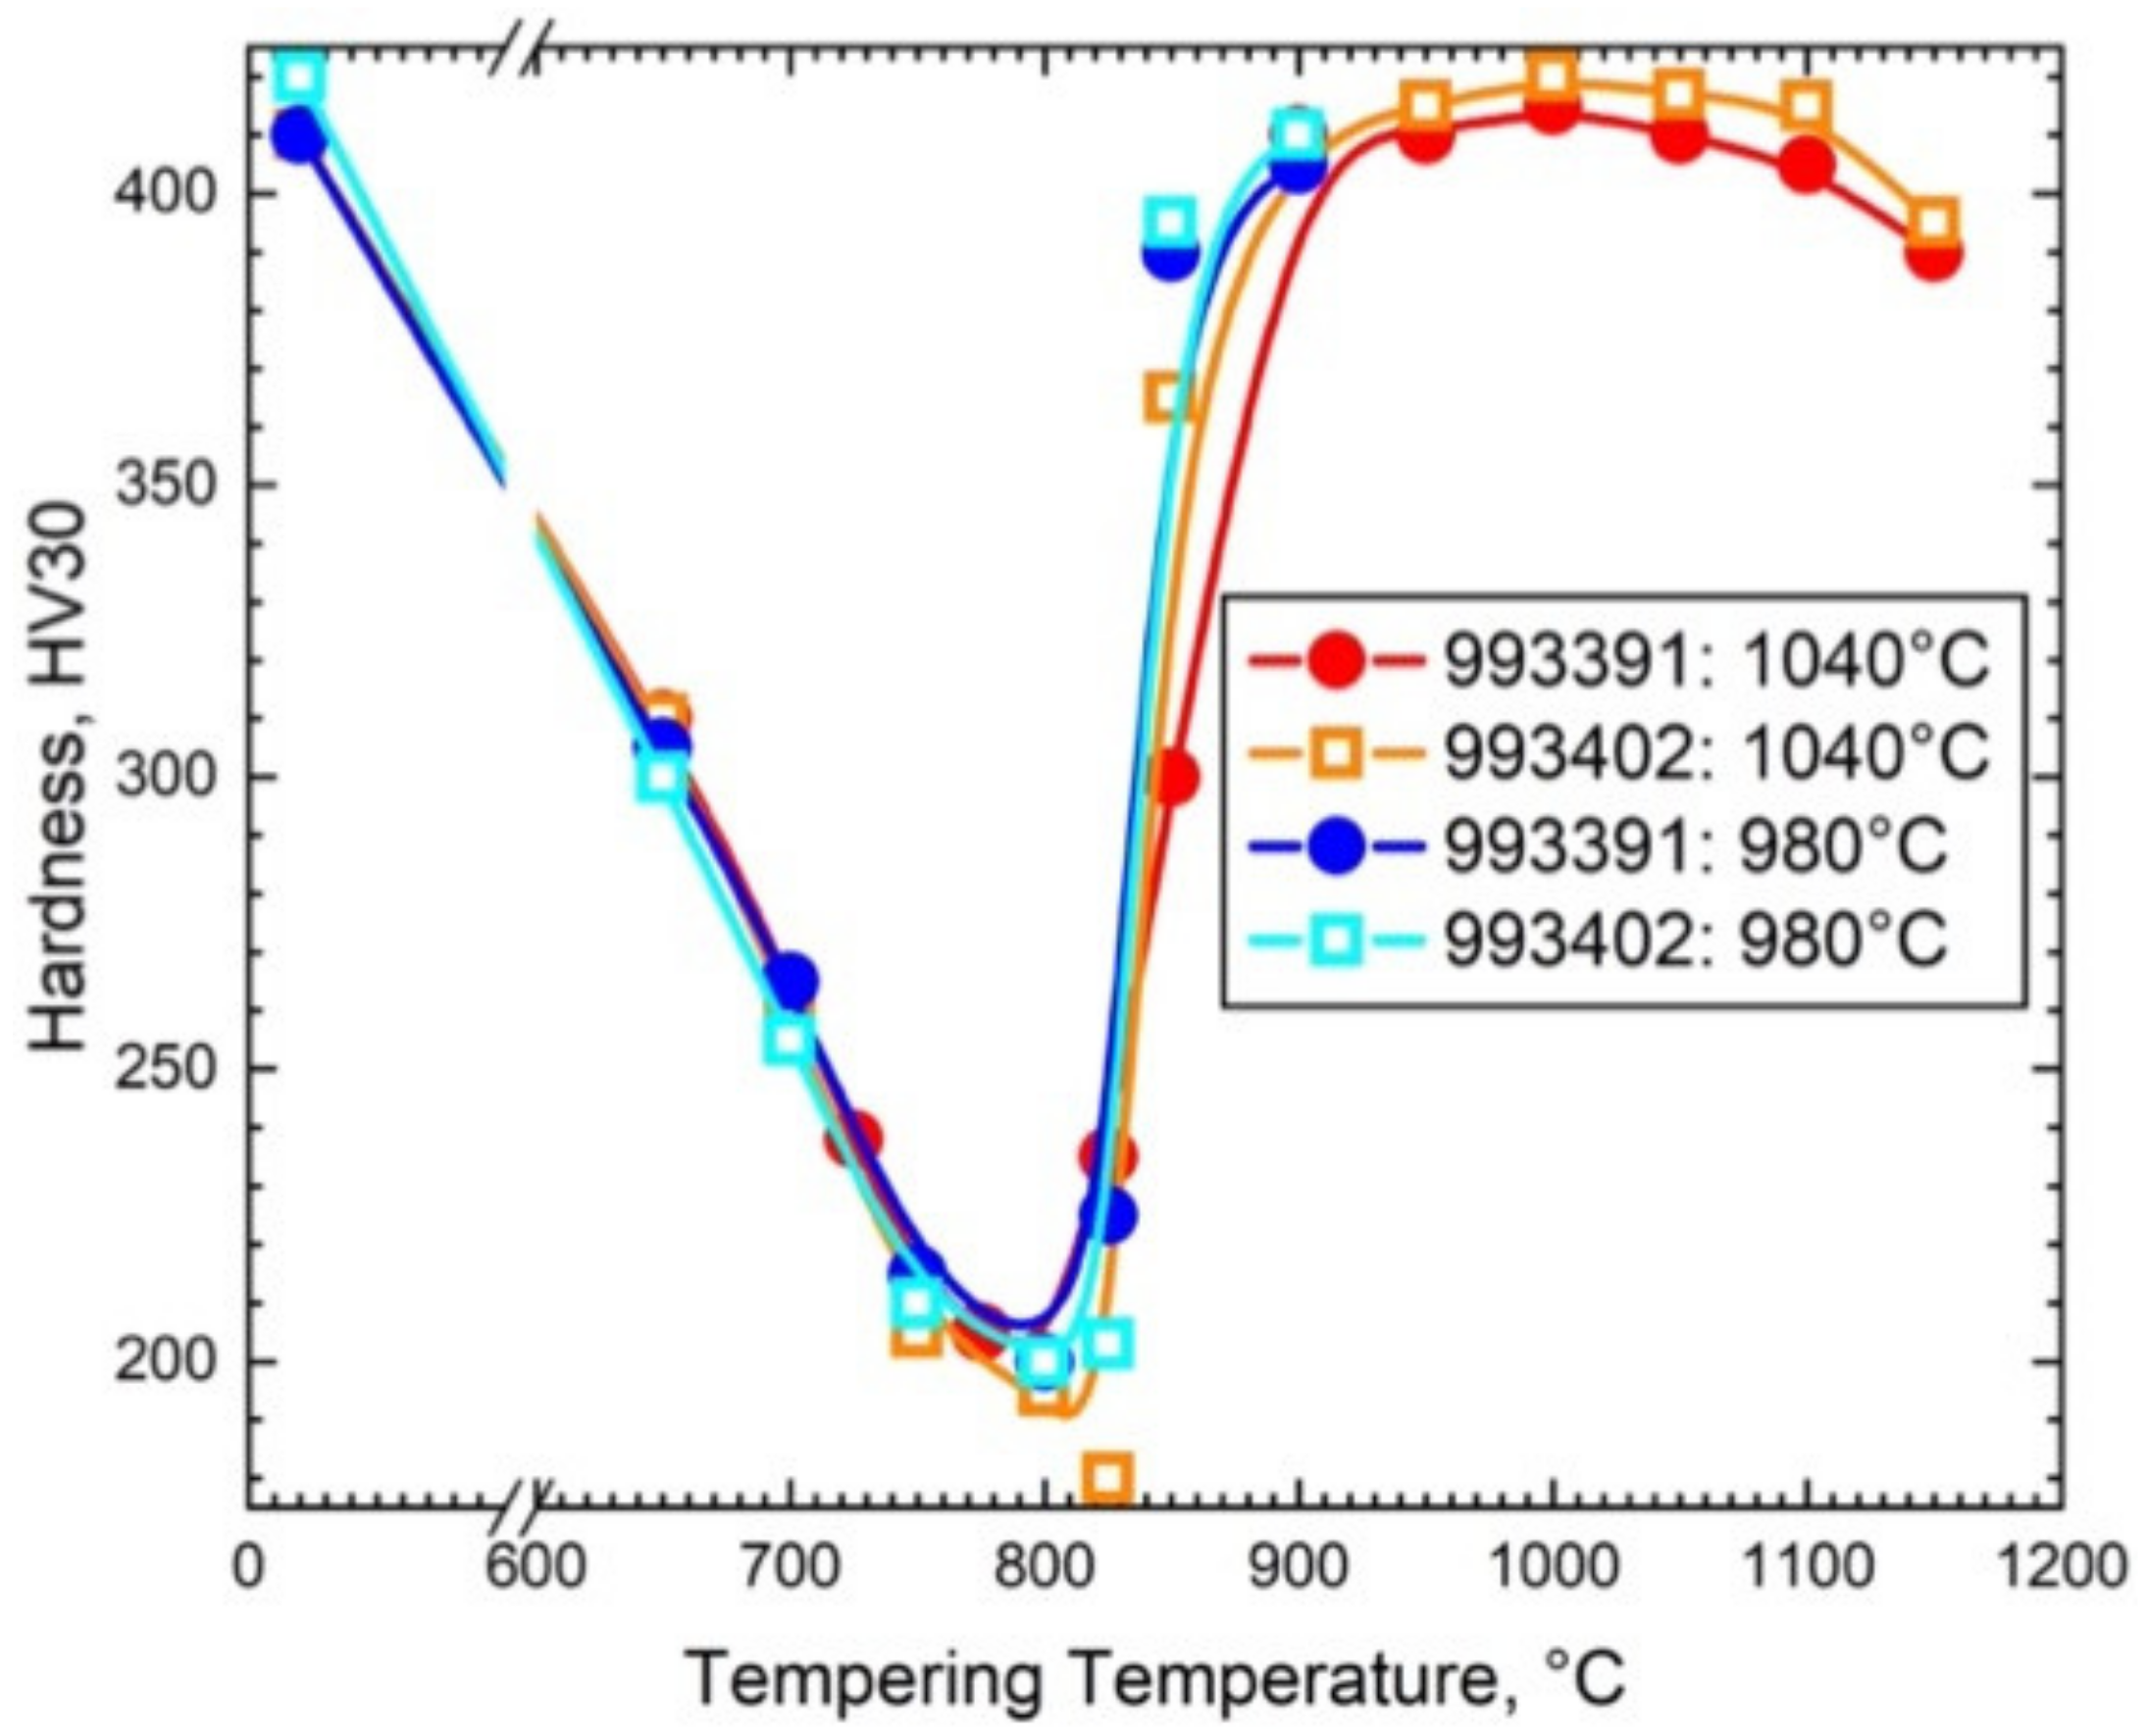
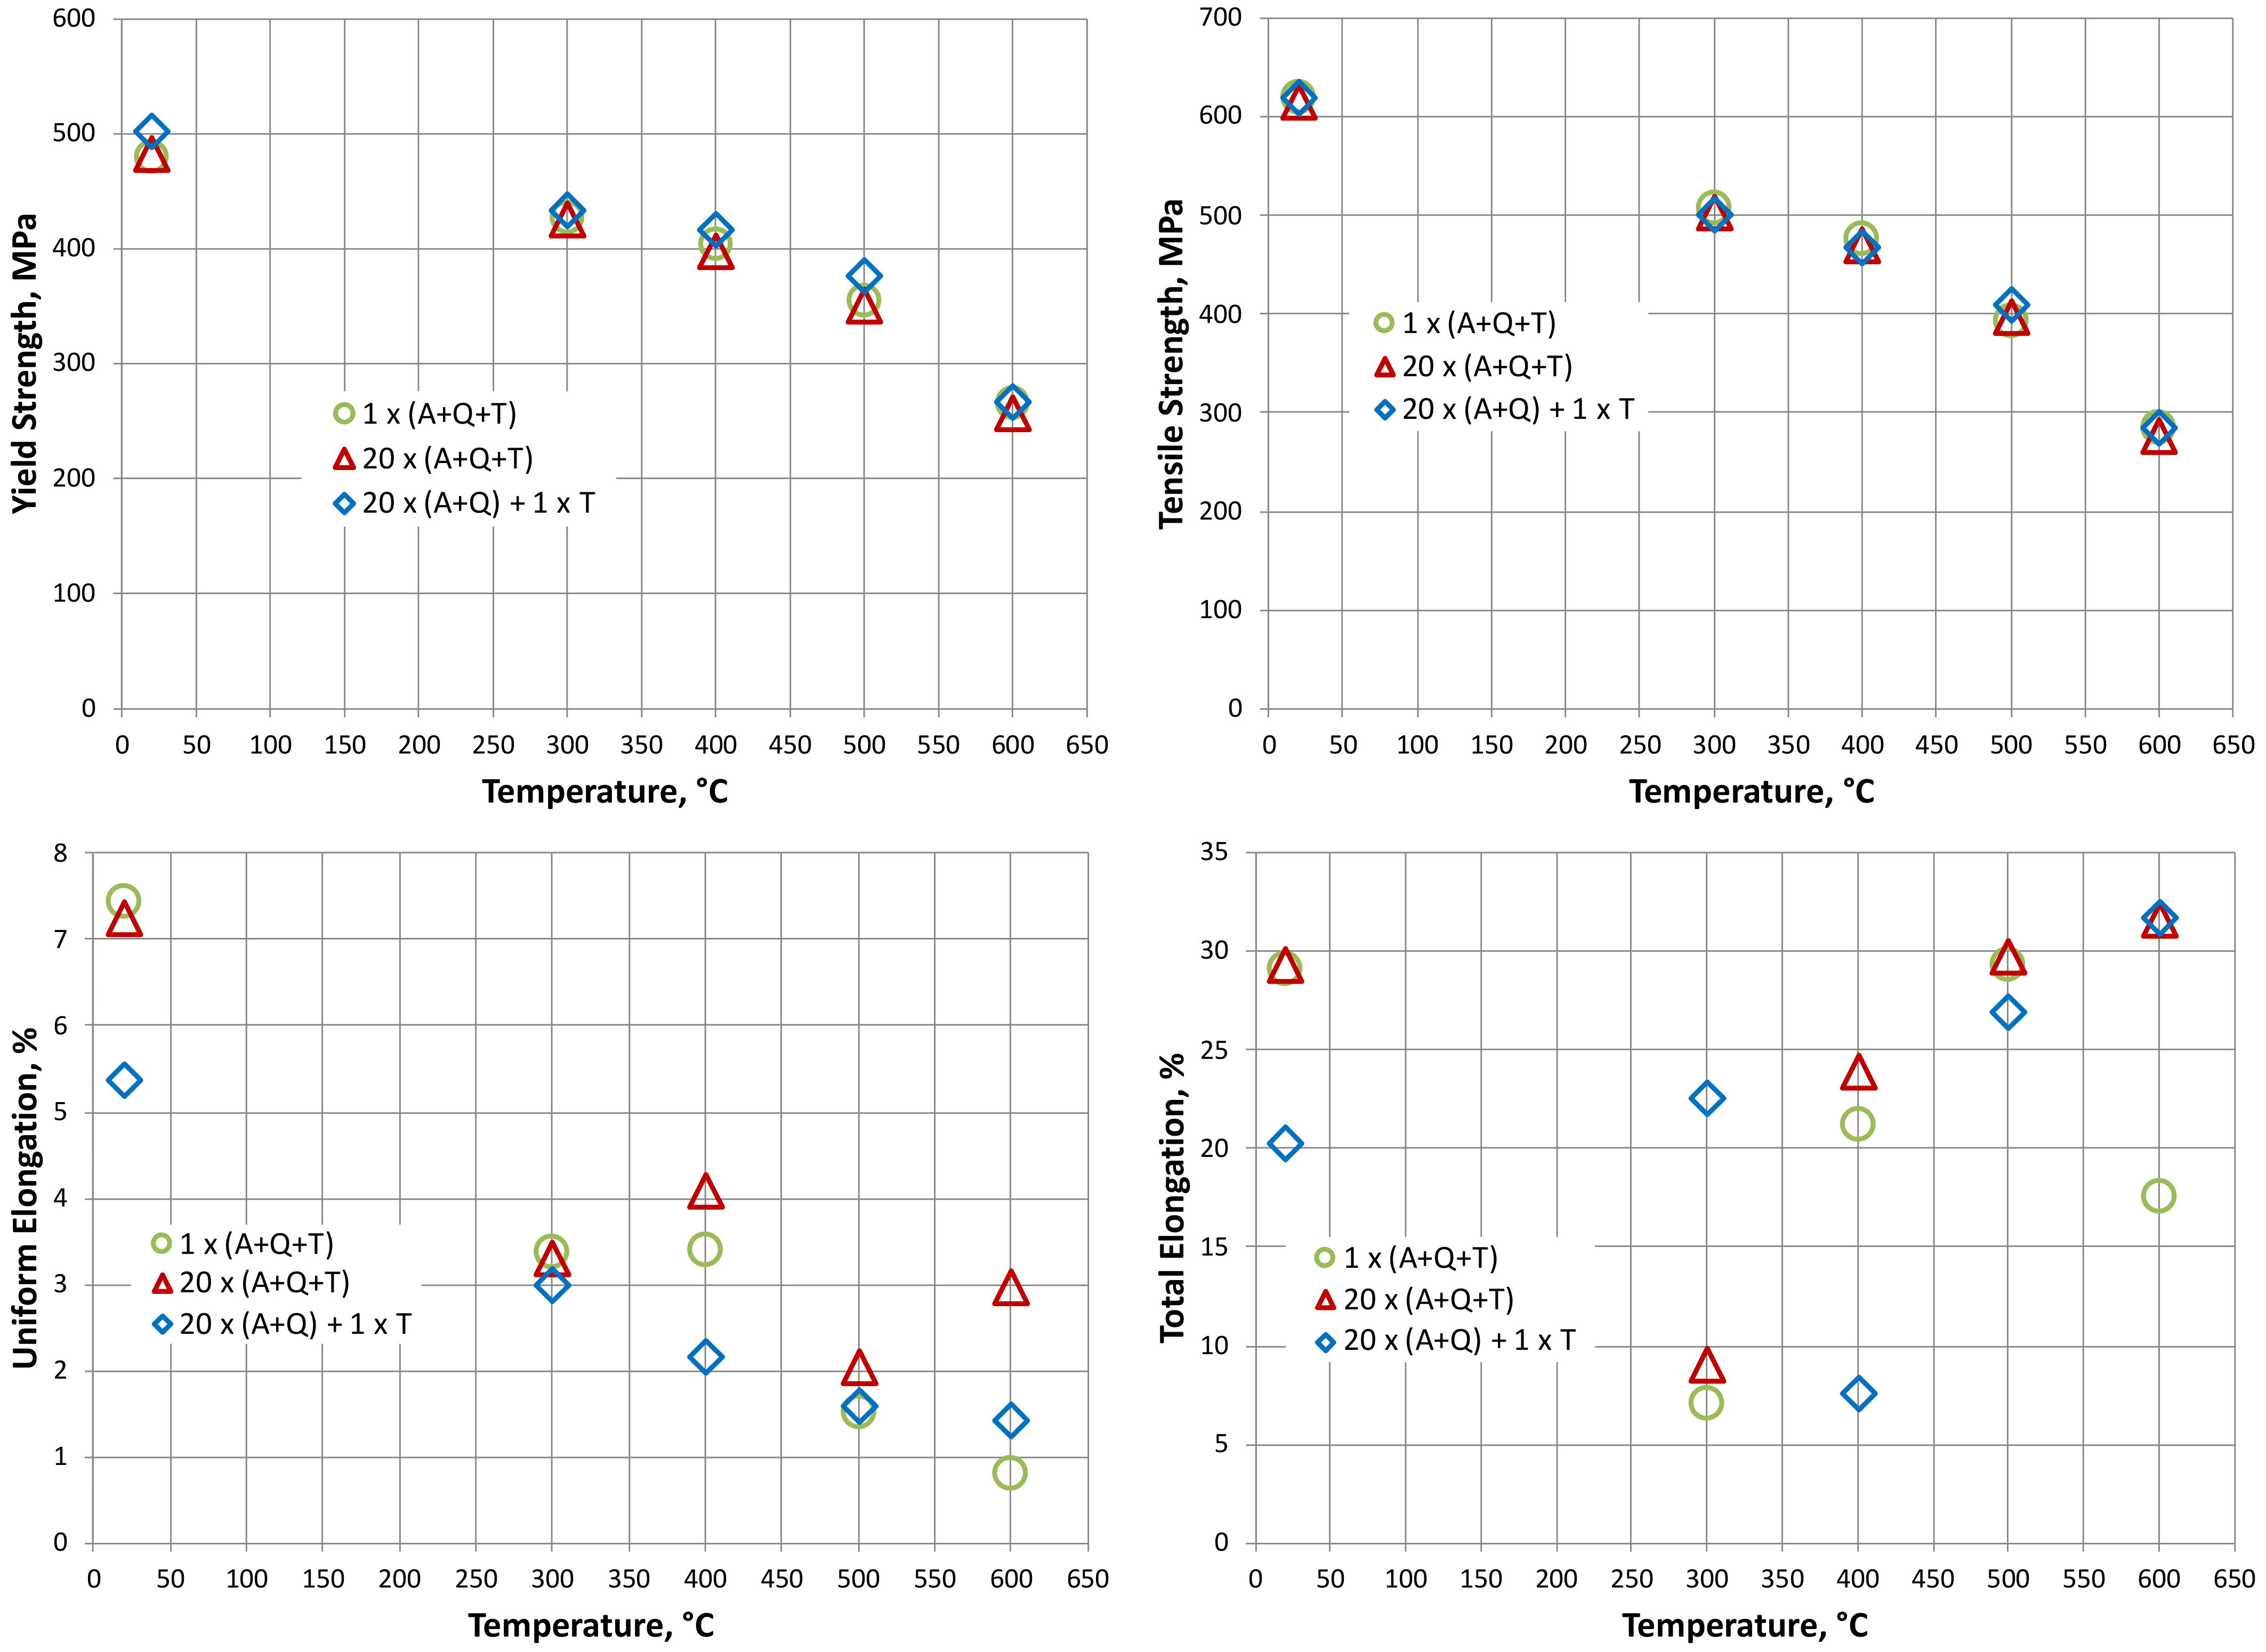
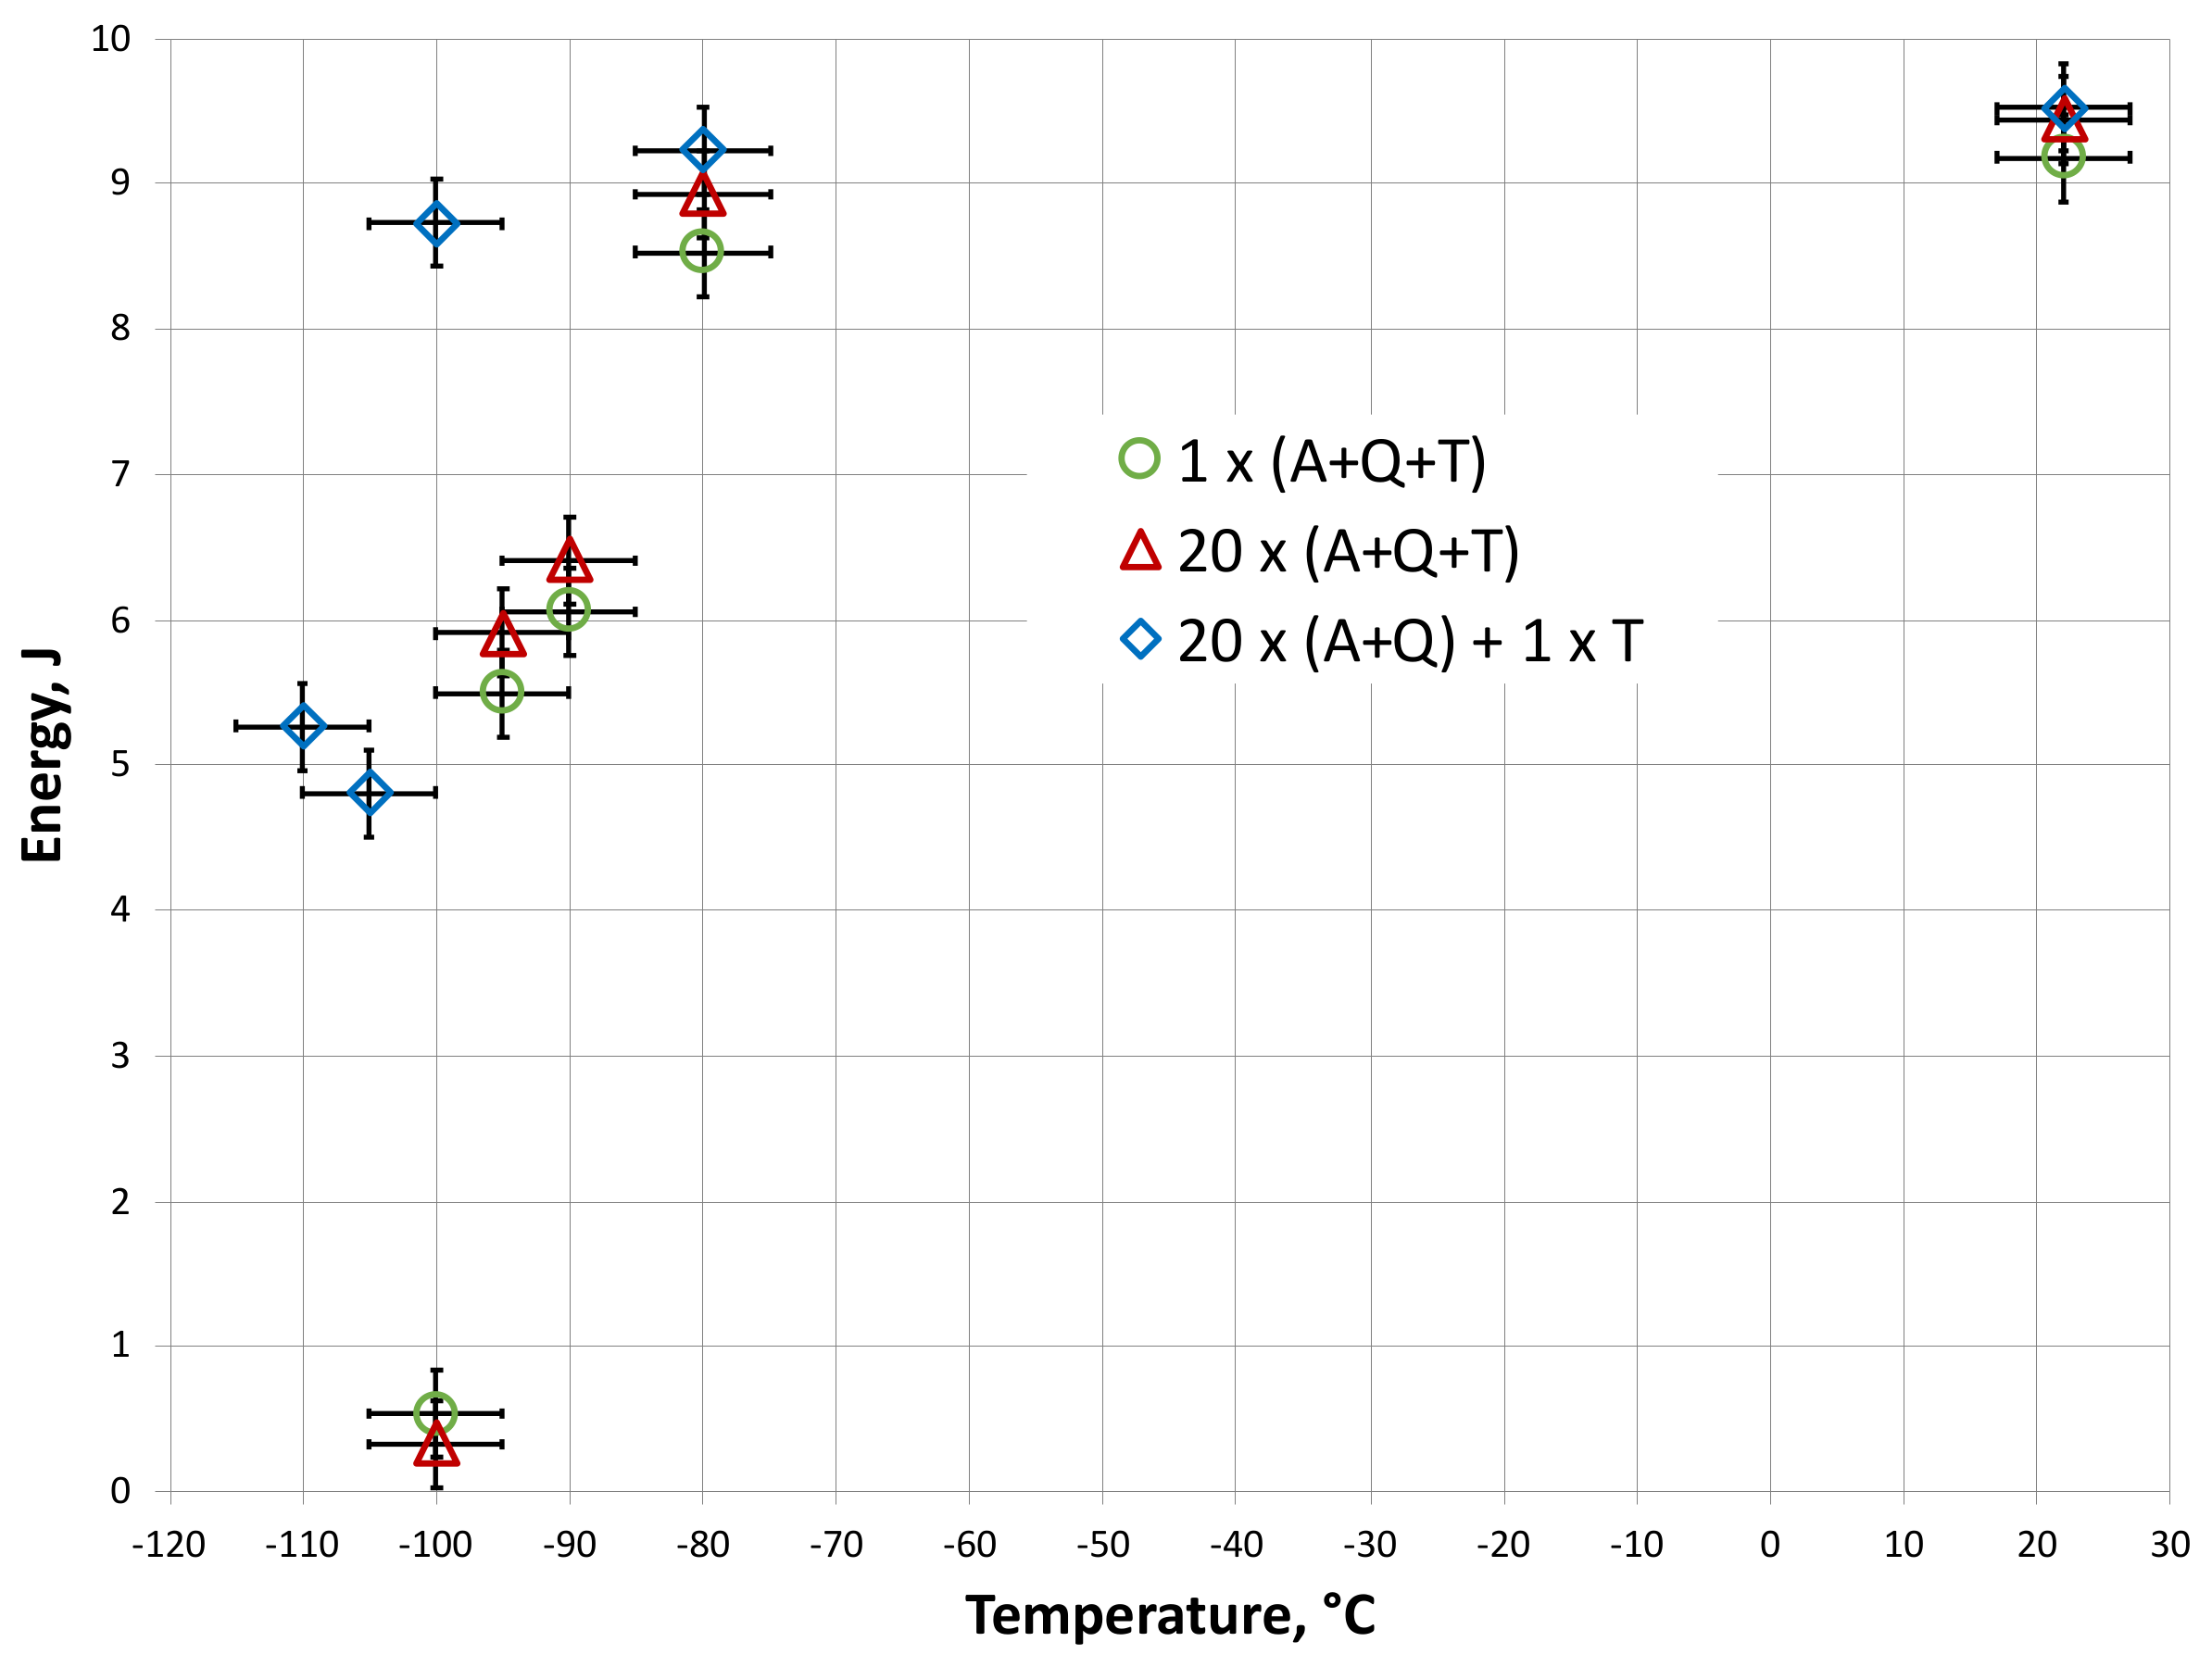
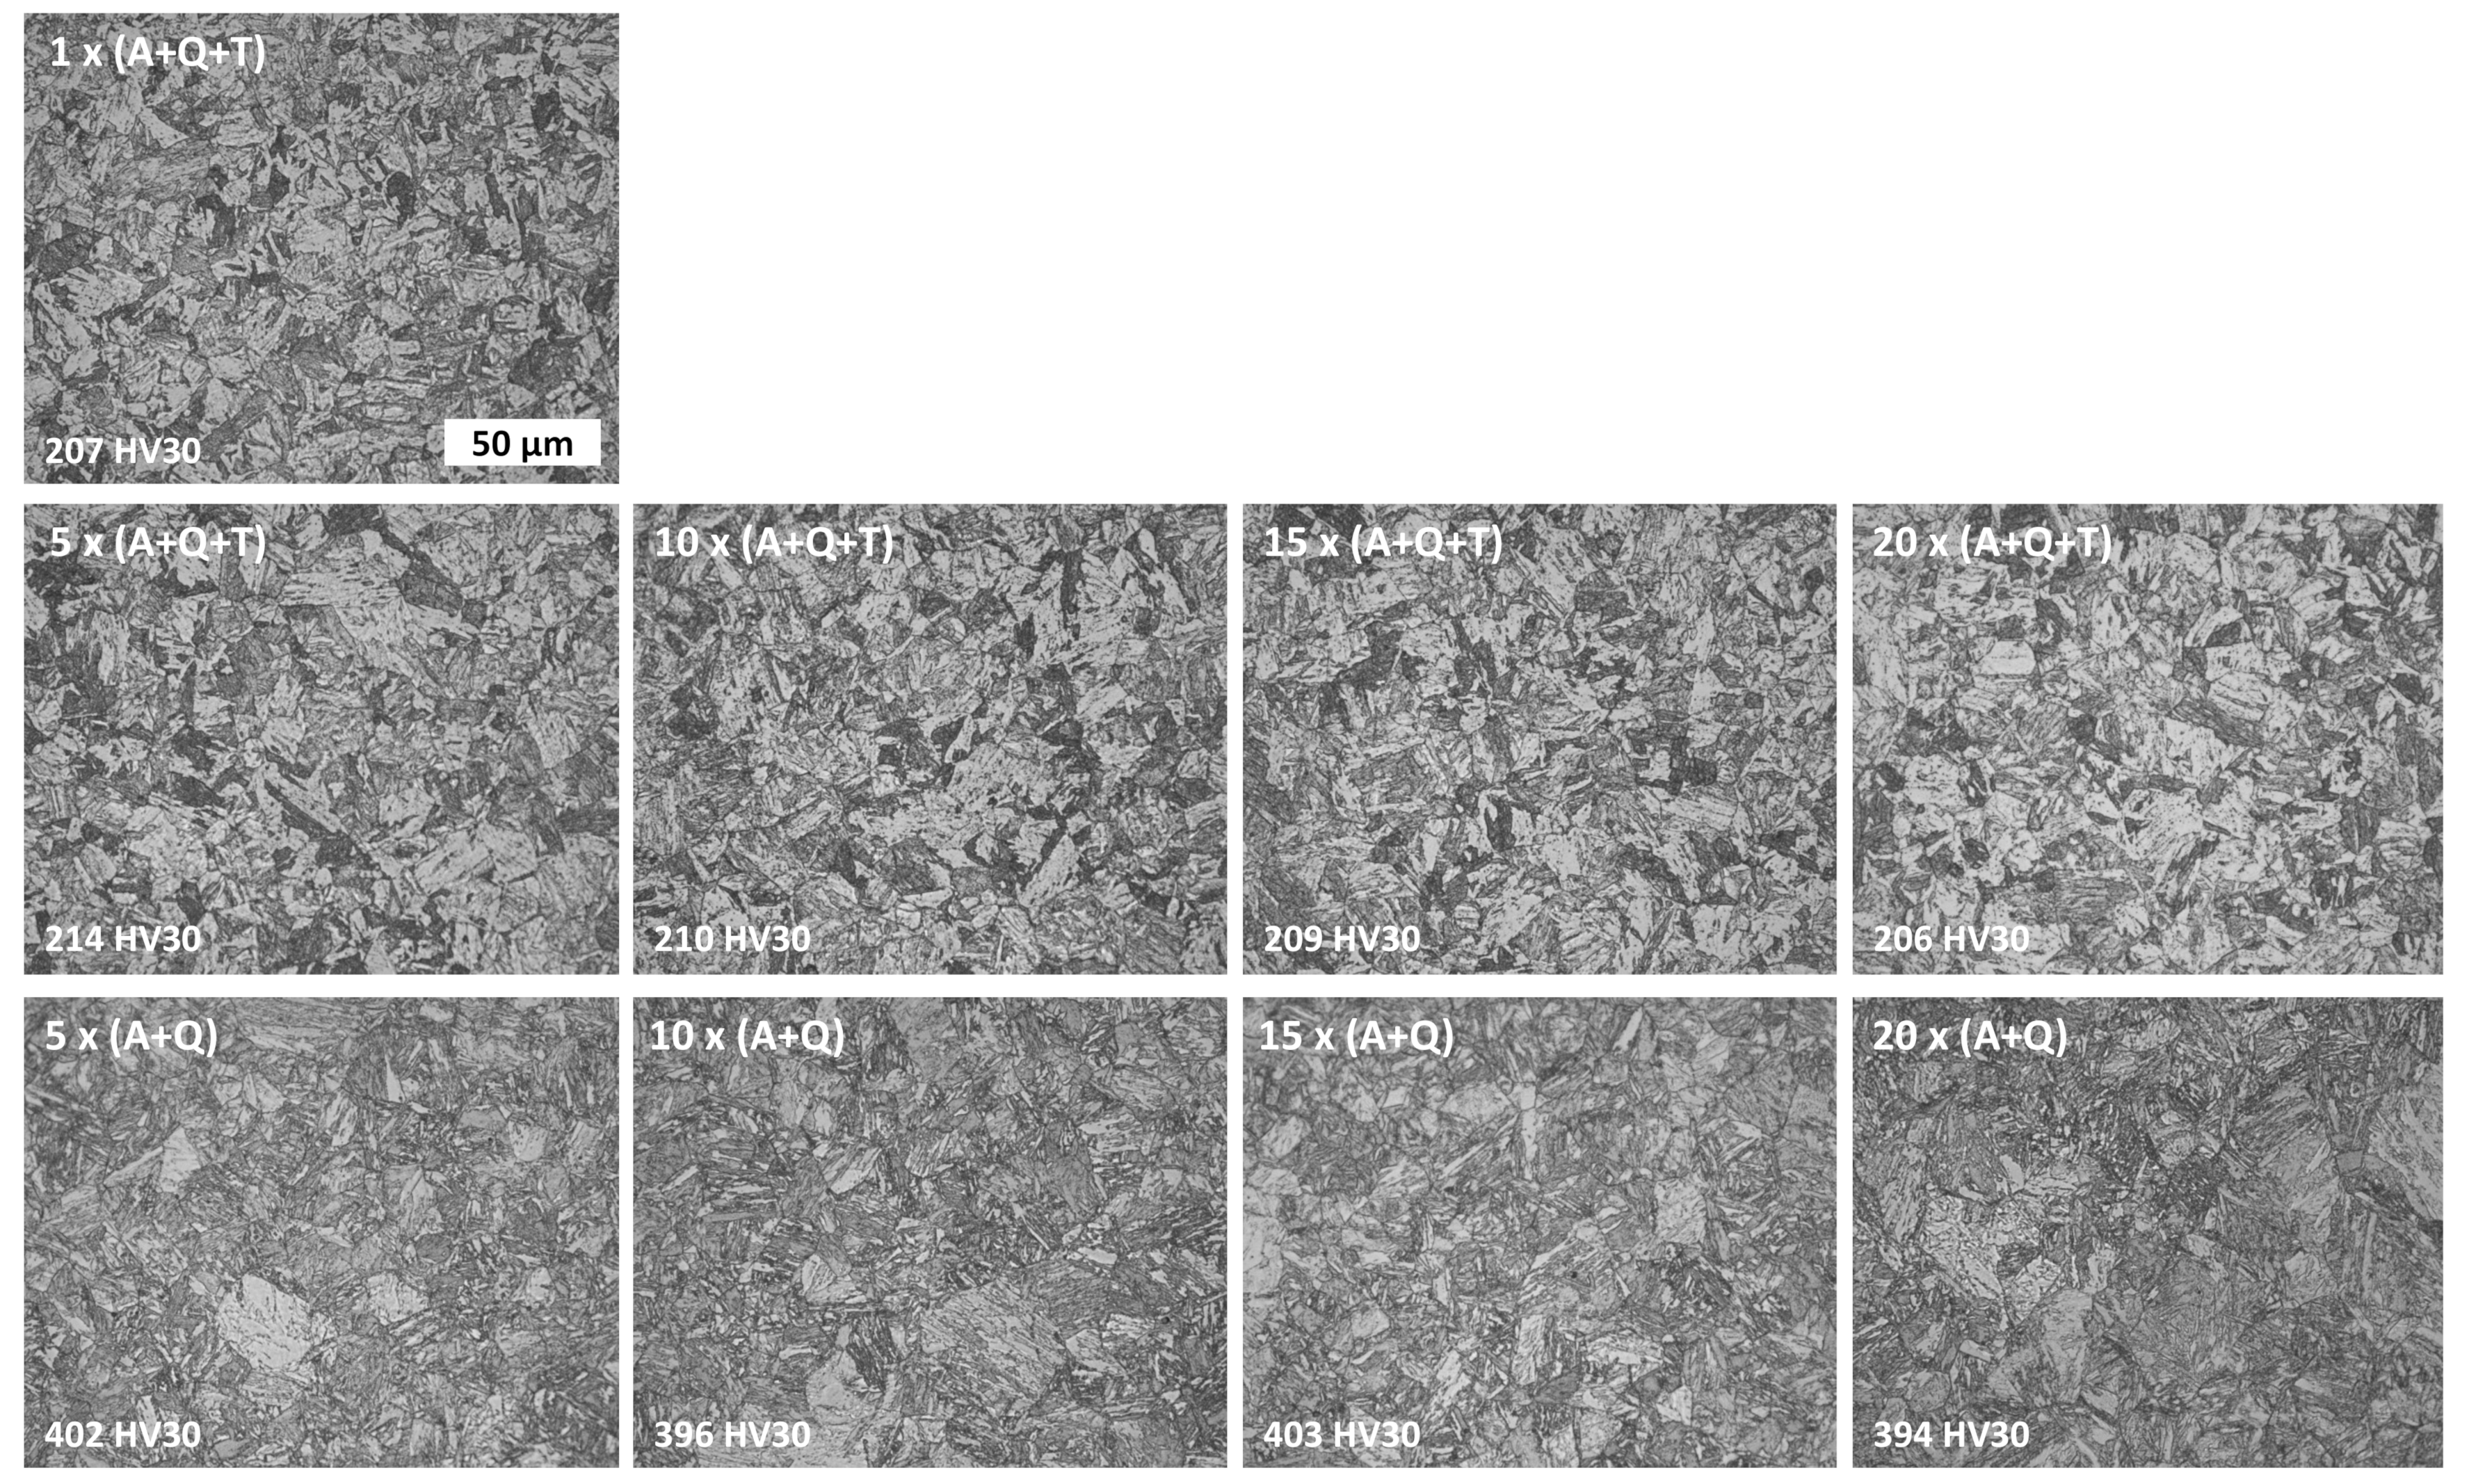
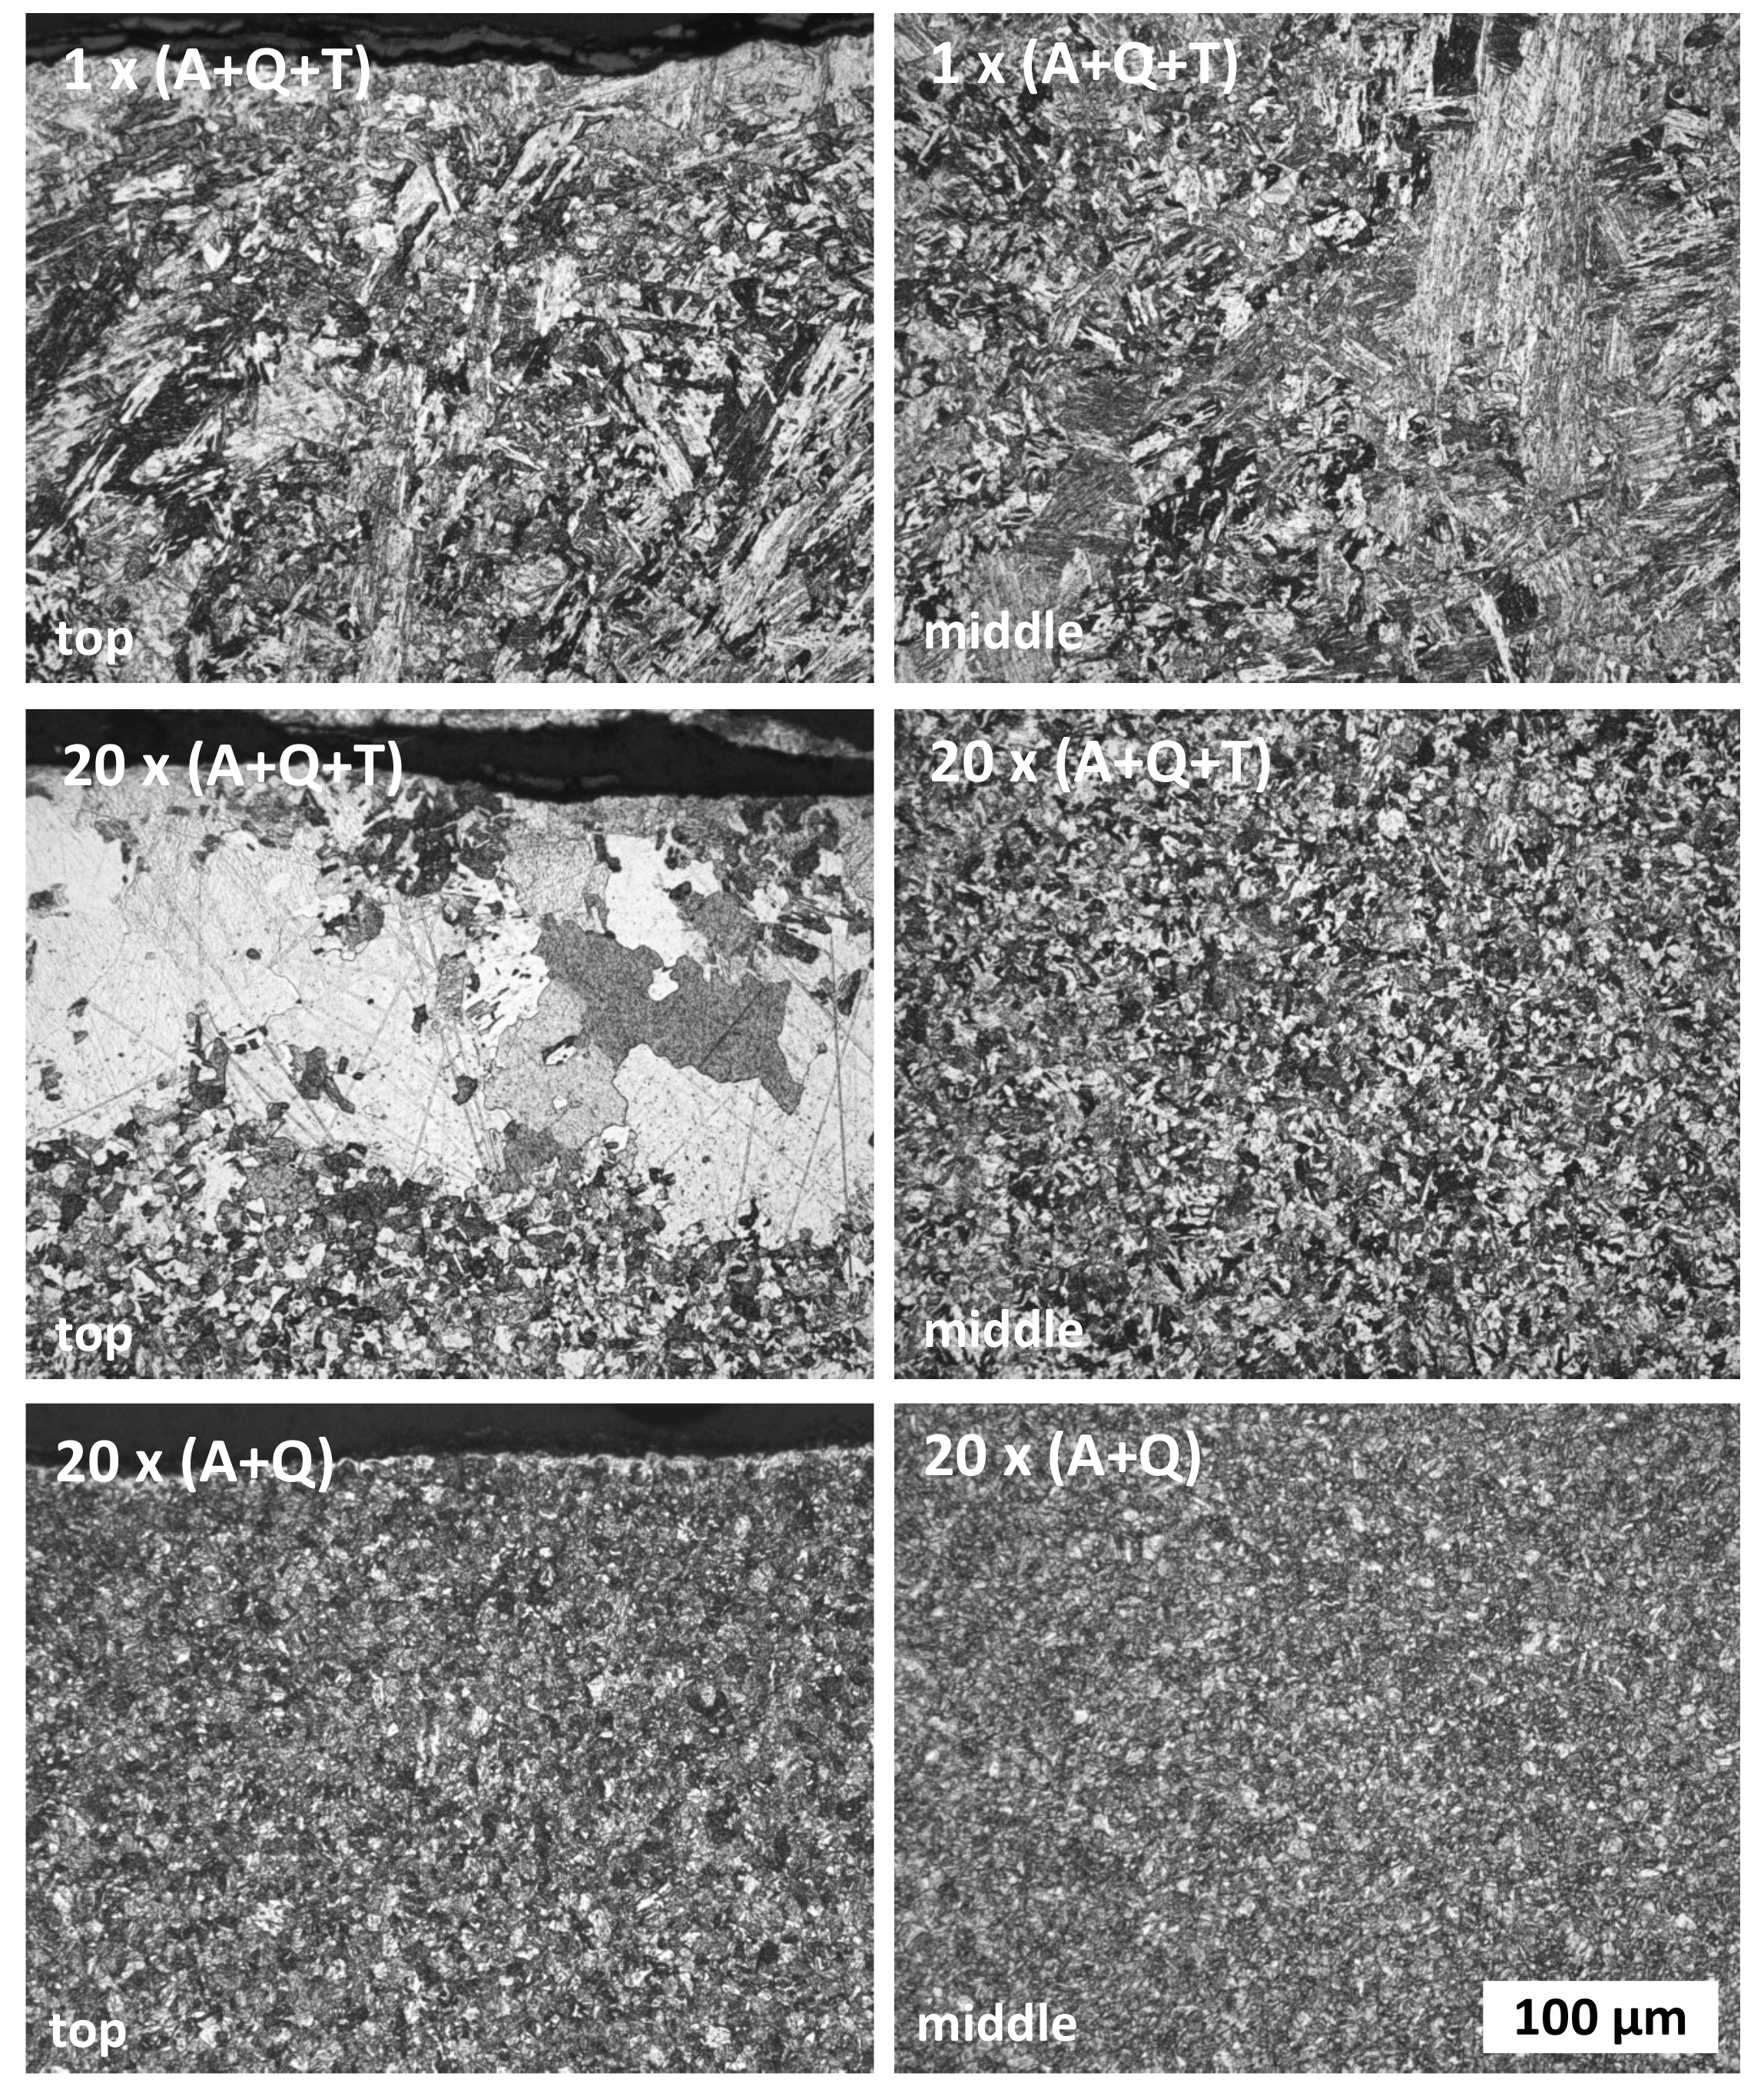
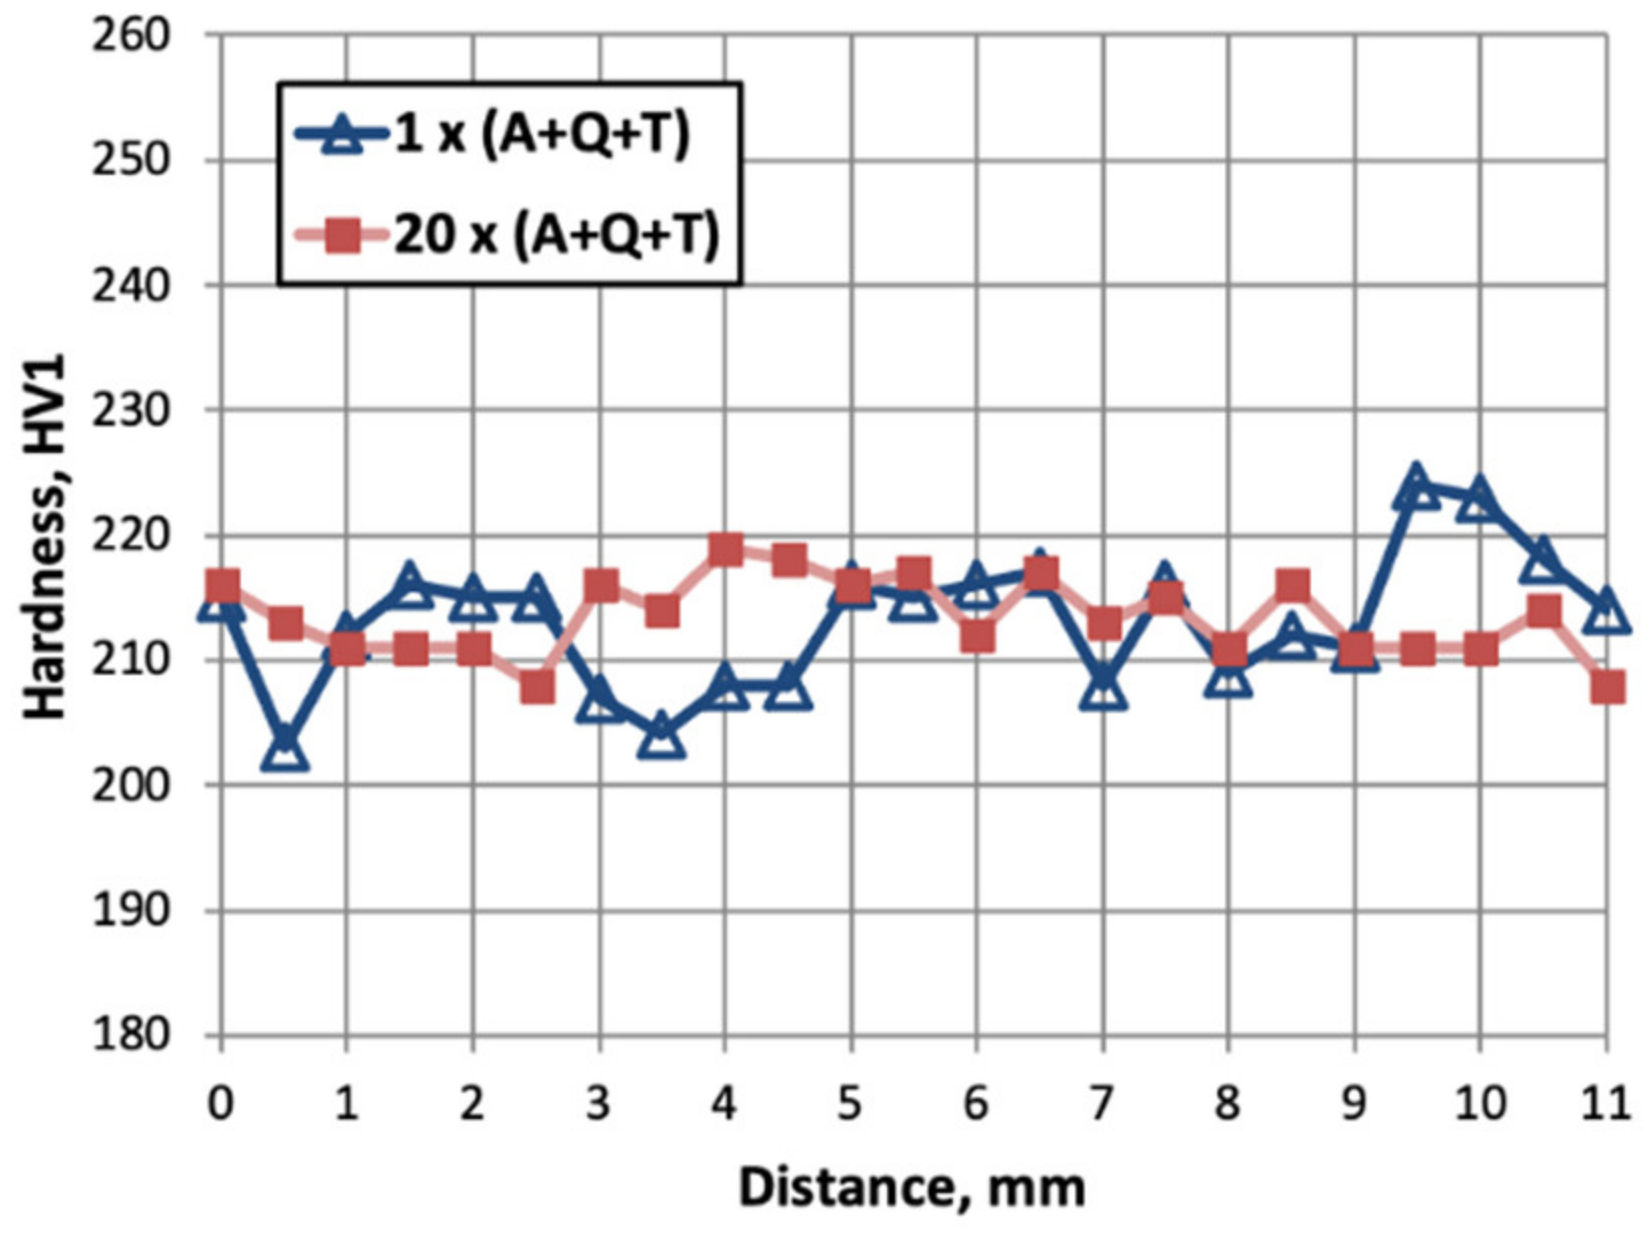
3.3. Repeated Heat Treatments

A component, or parts of it, sometimes have to undergo several heat treatments or thermal loads, either deliberately (e.g., post-weld heat treatments) or due to a fabrication process (e.g., diffusion bonding). Thus, the impact of repeated heat treatments on the material properties is of general interest for the component design and for the planning of efficient production steps. In a case study, the full standard heat treatment was applied to EUROFER97/2 pieces for 20 times. For a second set, austenitization and quenching was repeated 20 times, followed by one tempering treatment. Then the impact on the mechanical properties was determined by tensile, miniaturized instrumented Charpy, and Vickers hardness tests. The microstructure was analyzed by optical microscopy.
The tensile test results from the study are depicted in Figure 6. Yield and tensile strength do not show a significant influence from the repeated heat treatments. Also, uniform and total elongation as well as the Charpy upper shelf energy (see Figure 7) is rather similar within a typical scatter band. Only the DBTT for the condition 20 × (A + Q) + 1 × T seems to show a slight trend toward lower temperatures, but a more precise statement would require a much higher number of tests. Thus, we can draw the conclusion that repeated heat treatments do not significantly affect the mechanical properties of EUROFER steel, at least, if restricted to the conditions and parameters of this study.
Figure 8 shows the microstructural evolution during 5-, 10-, 15-, and 20-times repetition of the full standard heat treatment A + Q + T and of A + Q. Peculiar differences in the martensitic microstructures are not recognizable for both series. This is also supported by the hardness. Neither repetitions of A + Q + T nor A + Q led to significant deviations from the initial states, which are 207 and about 400 HV30. This further confirms the above-drawn conclusion that repeated applications of heat treatments do not alter the mechanical properties of EUROFER97, at least not significantly.

4. Fusion Welding

4.1. Overview

In addition to machining, joining is a highly important fabrication process for any complex parts, and this applies especially to energy conversion components. Here, pressurized pipes, cooling channels, or containers have to be joined by welding. Due to the high loads (thermal, mechanical, irradiation), the possible performance of the component is often defined by the quality of the weld.
In nuclear fusion, the breeding blankets are extreme cases for components with high complexity. While the conceptional design of the Helium-Cooled Lithium-Lead (HCLL) and the Helium-Cooled Pebble-Bed (HCPB) blankets for a European DEMO reactor are still under development, the investigations of ITER Test-Blanket Module fabrication technologies are far advanced. Here, both concepts include many similarities in terms of design and manufacturing. There are a number of sub-components (e.g., cooling plates, caps, stiffening plates, first wall, manifolds, back supporting structures), which require specific joining. Therefore, welding and heat treatment may be considered as key technologies for blanket fabrication. An overview on the designs and the present state of the related R&D can be found in [29,30] and references therein.
Fusion welding (i.e., parts are joined by melting their interface with or without filler material) are typically performed either by electron beam, laser beam, or by tungsten inert gas (gas tungsten arc) welding (hybrid methods are also known). Since the welds differ, not only in the underlying technology, but also in the geometry, and other specifics of the parts (thickness, gaps, alignment, orientation, etc.), a detailed recap of the single studies would go beyond the scope of this paper. Since the properties and behavior of basic EUROFER97 welds are, in principle, transferable to the more specific cases, the following sections focus on a selection of weld studies, including process details and defect analyses. In any case, fusion welded joints of martensitic steels require an appropriate PWHT. The effect of such treatments on the mechanical and microstructural properties are outlined in the final section of this chapter.

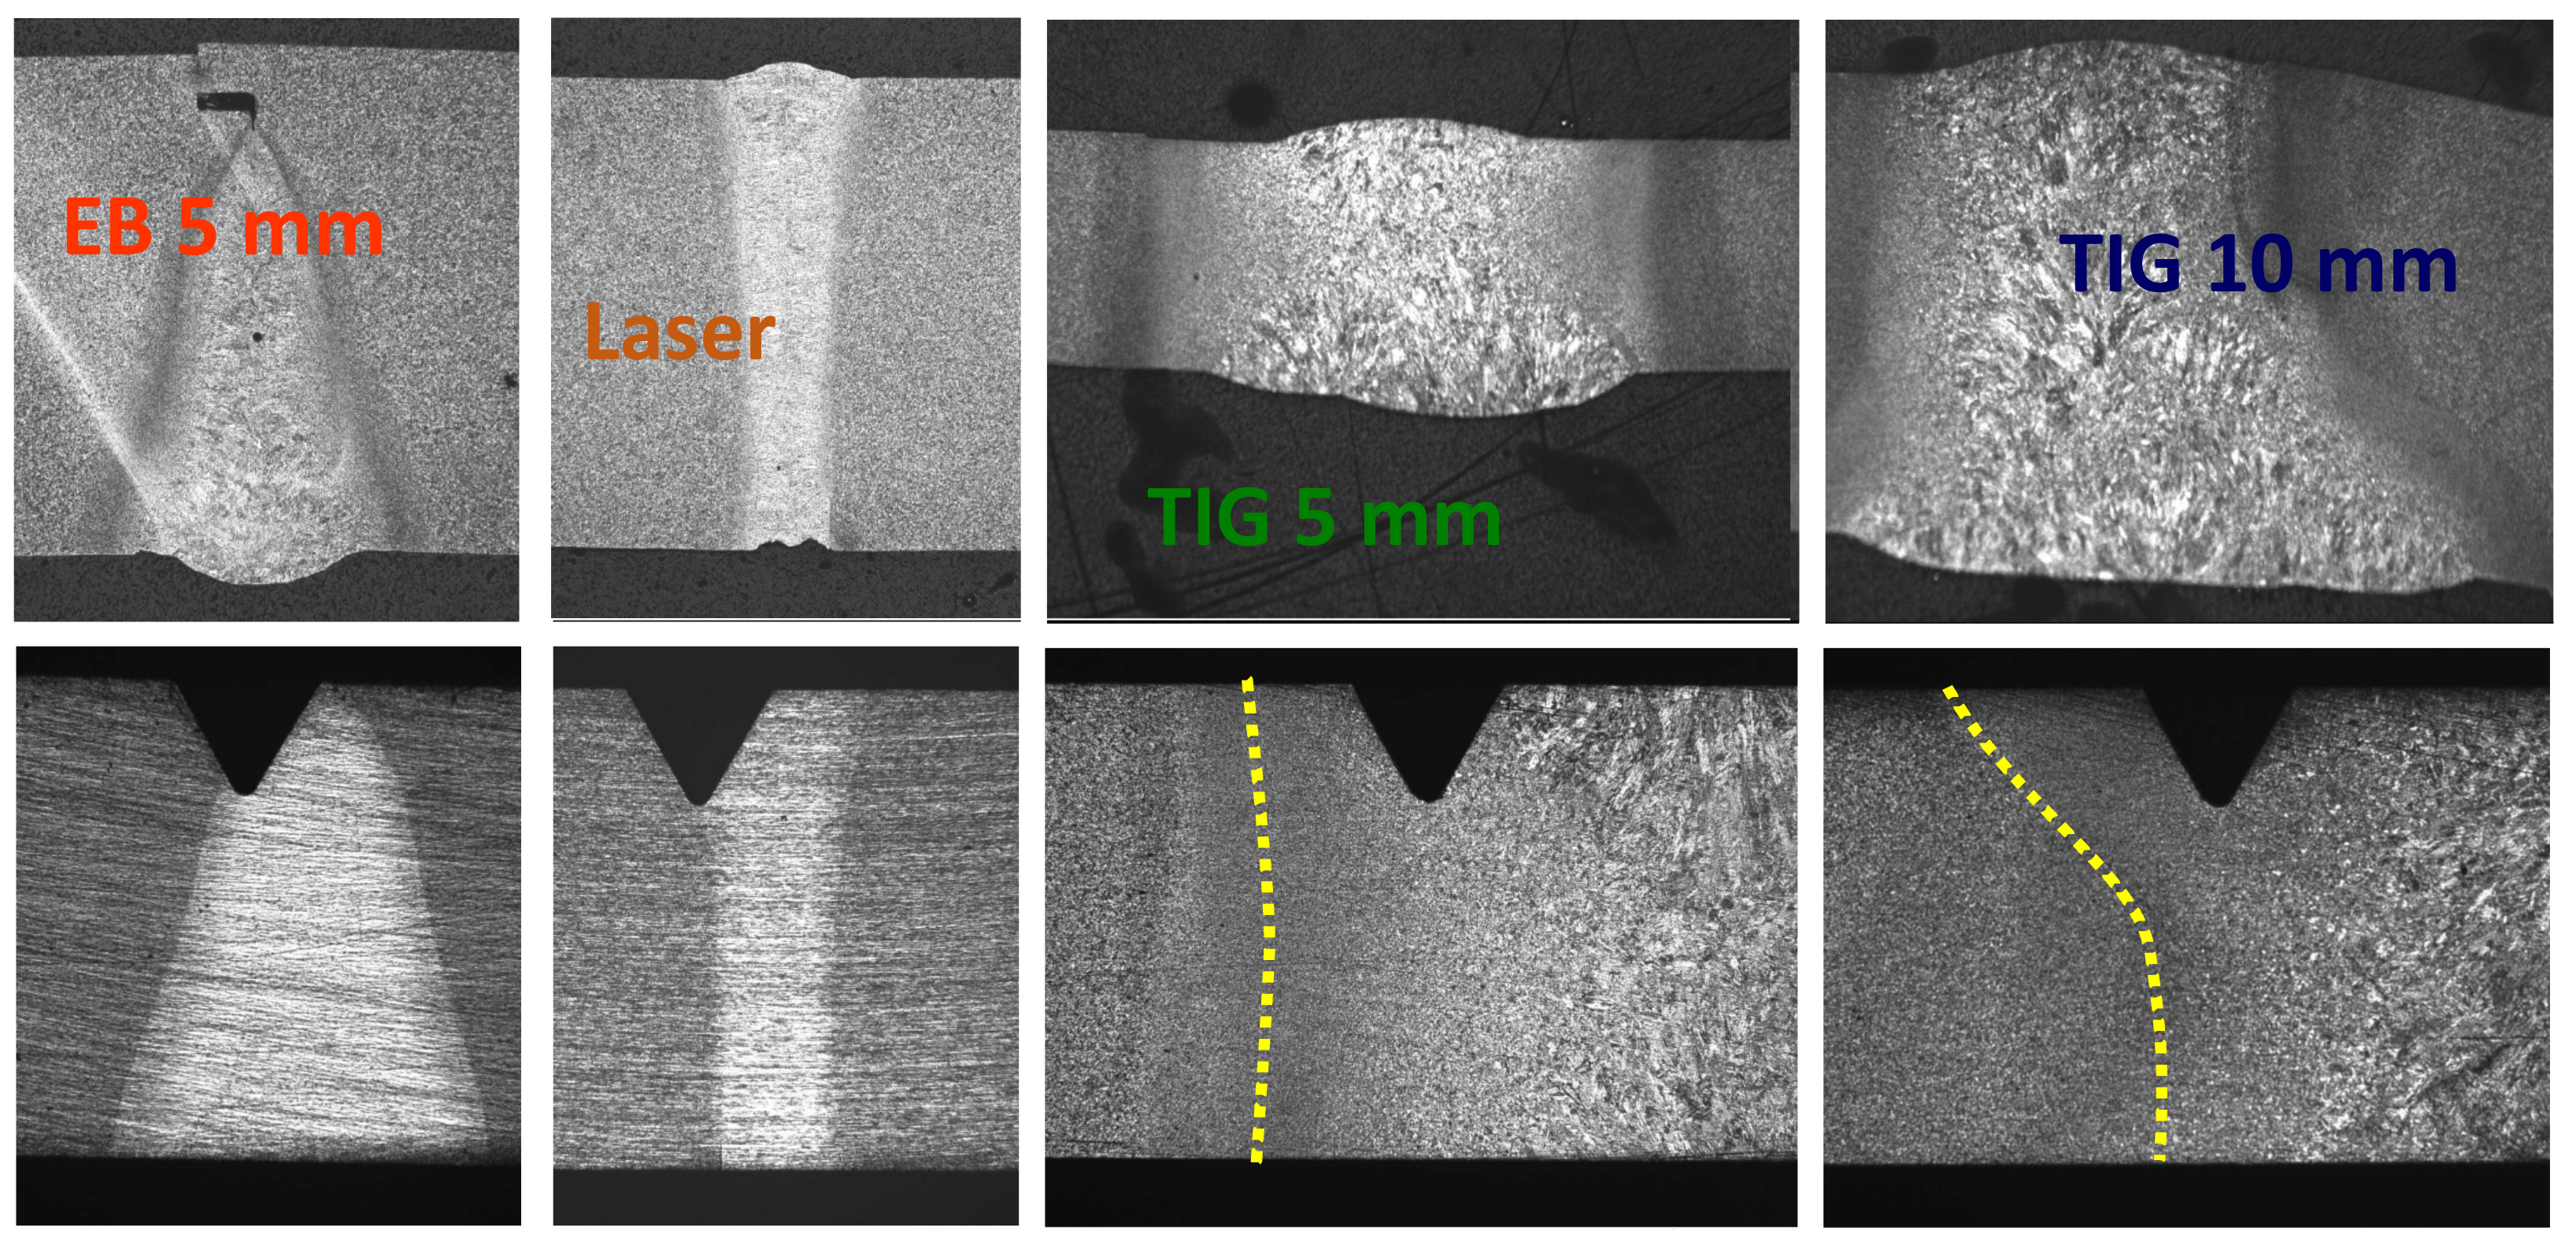
4.2. Sample Fabrication by Tungsten Inert Gas, Electron Beam, and Laser Welding

Electron beam (60 kV, 19 mA, 10 mm/s) and laser (5 kW, 750 J/cm, 4 m/min) welding were applied to 5 mm EUROFER97 plates in the condition as received, that is, after rolling and a heat treatment of 980 °C/30 min + 740 °C/2 h. From tests with a massive plate, it was assumed that an electron weld current of 19 mA combined with a welding speed of 10 mm/s would be sufficient to progress the melt down through the beam stopper. However, as can be seen from the micrograph in Figure 9, the beam intensity was too weak since the beam stopped about 0.5 mm above the bottom. That is, the beam stopper is still recognizable after welding, which should not be the case for a perfect EB weld. Also, the plates were not aligned exact. There is a remaining gap of about 0.2 mm beside the beam stopper. Grain coarsening in the weld is not as pronounced as in the TIG welds. Nonetheless, a small heat affected zone (HAZ) can be seen at the border of the symmetrically wedge-shaped weld.
With a power of 5 kW and with a welding speed of 4 m/min the penetration depth of the laser beam was adjusted perfectly, but the weld was not quite centered on the beam stopper. Therefore, a 0.5 mm long crack remained (barely visible in Figure 9 at the bottom right of the laser weld). The micrograph shows only little grain coarsening at the top of the weld. HAZs are hardly recognizable. Of all welds tested, this laser weld looks most homogeneous, and its borderlines are nearly parallel.
In addition, TIG welds on the same material (5 mm, 10 mm, and 12 mm plates) were produced using EUROFER97 filler wire (heat D83350). The TIG weld geometry was ½ V joint with a root height of 1 mm and a distance of 2 mm. All welds were fabricated parallel to the direction of the last rolling step that was applied during plate production. Immediately before welding, the joining plate surfaces were dry milled by 0.1 mm and, in the case of TIG welding, the filler wire was grinded. The TIG welds were manually fabricated in a glove box flooded with inert-gas. The weld engineer certified a good weldability of EUROFER97, but the diameter of the filler wire (1 mm) was revealed to be too small for large structures, such as 5 mm, 10 mm and 12 mm plates. Since there was no other wire at hand, the TIG welds were fabricated with the present one. It took five weld layers to fill the 2 mm gap in the 5 mm weld. The wire feeding speed was about 35 mm/min for the root layer and 100 mm/min for the middle and cover layers. The microstructure reveals clearly severe grain coarsening in the weld and a finer grained heat affected zone (HAZ) on both sides. The grain size obviously has a maximum at the top of the weld. For the 10 mm TIG weld, eight layers were needed to fill the 2 mm gap. Severe grain coarsening with maximum grain size in the upper part of the weld, as well as fine-grained HAZs, can be clearly identified in Figure 9.
Even though we used the same parameters as with the 5 mm and 10 mm TIG welds for fabricating a further 12 mm weld, there are significant differences. The grain coarsening in the weld is not so distinct and fine-grained HAZs are visible even in the transition region at the top and bottom of the middle layers (see Figure 10). All TIG welds are asymmetrically shaped due to their ½ V joint geometry. Since they were fabricated manually, it was difficult to reproduce the weld microstructure, even by using the same parameters. In case of the 12 mm TIG weld, the reason for the obvious differences was probably the fact that the 5 mm and 10 mm plates were welded in one pass, while the 12 mm plates were welded in several passes over several days. That is, between fabricating different weld layers, the plates had time to cool down to room temperature.
A second EB weld (60 kV, 80 mA, 10 mm/s) was fabricated with 12 mm plates. The plates were applied with beam stoppers (0.5 mm × 0.5 mm) at the lower part of the joining. As already observed for the 5 mm EB weld, the beam intensity was just a bit too low for a full penetration down to the bottom side. Moreover, rather coarse grains as well as a few cracks formed in the weld (see Figure 10). These cracks were observed in regular distances of about 10–20 mm along the weld line. These are so-called interdendritic shrinkage cavities, which makes clear that the parameters for this weld were wrongly chosen. Nevertheless, those parts of the weld without cracks were still used for specimen fabrication under the assumption that optimized parameters would produce a weld with similar properties, but without cracks. The fabrication of the 40 mm deep EB weld was proof for this assumption. At the border of the coarse-grained wedge-shaped weld, distinct HAZs are recognizable.
Finally, a 40 mm deep EB butt weld with an underlay as beam stopper was fabricated from two EUROFER97/2 plates (100 mm × 24 mm × 40 mm), also in the as-received condition. The weld was produced with a 150 kV/596 mA beam and the feed rate was 5 mm/s. It was fabricated to study the possible application of joining caps, back plates, or first walls by EB welding. The cross-section of the 40 mm deep EUROFER EB joint is shown in Figure 11, and, as can be seen, the fusion zone varies only between about 1.5 and 2 mm from top to bottom, which is rather constant and narrow. Its hardness varies between 440 and 480 HV1 and its grain is clearly coarser than that of the base material. A distinct fine-grained HAZ with a width of about 0.5 mm is also visible. Here, the hardness shows some single soft spots with much smaller values than the base material (220 HV1). Defects such as bubbles or micro-cracks have not been observed.
Tensile and Charpy specimens were fabricated perpendicular to the weld lines, joint surfaces, and rolling directions. The notches of Charpy specimens were fabricated at the weld center or in the heat affected zone (HAZ). Details are shown in Figure 9, Figure 10 and Figure 11.

4.3. Defects

Prior to specimen fabrication, the weld microstructures were investigated. All TIG and the 12 mm EB welds show coarse grain formation, which is typical for solidification microstructures that form during the welding cycles. Both 5 mm beam welds do not show this severe grain coarsening. Additionally, typical for TIG welds is the observation of soft regions in the HAZ. The lateral extension of the beam welds is significantly smaller and a distinct softening in the HAZ is not observed. Hardness in the fusion zones of all welds ranges from 400 to 450 HV1 (base material varies around 220 HV1). Only the 10 mm and 12 mm TIG welds suffer from softening in the HAZs on both sides, as is clearly recognizable in Figure 12. The 5 mm TIG weld shows only slight softening, while no effect can be seen in the hardness profiles of the beam welds.
All TIG welds show a very low defect density. In very rare cases formation of delta-ferrite could be detected, which is consistent to the theory and other studies [24,25,26,27,28] in the 5 mm weld, and some inclusions have been found in the 10 mm weld. With a carbon content of 0.1% in the fusion zone of TIG welds, de-carbonization of the filler material was not observed. All beam welds (EB and laser), however, revealed more or less extended bubbles. Their size and distribution depend primarily on the beam intensity and purity of the weld surfaces. While the 12 mm EB weld showed even small cavities, in the 5 mm EB weld gas pores with diameters of 20–40 µm have formed. In the 5 mm laser weld the pores are even smaller.

4.4. Post-Welding Heat Treatment (PWHT)

One of the motivations to produce these different welds with 5–12 mm plates was to investigate PWHTs for the final assembly of breeding units. That is, after filling the breeder units with beryllium pebbles, temperatures have to stay below 750 °C, which excludes the austenitization step and, therefore, omits the application of the EUROFER standard heat treatment.
In a first series six different two- and single-step PWHTs (see Table 2) have been applied to 5- and 10-mm welds in vacuum to examine their basic behavior. With respect to hardness all welds respond comparable to the PWHT (see Table 2). That is, both two-step heat treatments (PWHT 1 and 2) remove the coarse-grained weld microstructure and lead to hardness levels around or below 250 HV1. All single step treatments (PWHT 4–6) do not change the microstructure but soften the weld down to hardness levels of 290–350 HV1. Tempering below 700 °C does not lead to significant changes. PWHT 3 was just applied to verify a complete alpha-gamma transformation, which was the case, as can be clearly seen from the hardness of about 450 HV1.
The EUROFER standard heat treatment PWHT 1 restores nearly the same low hardness in the weld zone of all welds as in the base material, which is about 200 ± 10 HV1. Only the microstructure of the 5 mm EB and laser welds are almost restored, while a significant part of the dendritic, coarse grained melt structures of the TIG welds still remains. An overview on the weld microstructures after the different heat treatments is given in Figure 13. These findings have been taken into account for a second series of PWHTs that was applied to the 12 mm TIG and EB welds (see Table 3). The results of single-step heat treatments clearly show that longer tempering periods do not affect the hardness (PWHT 8, 11, and 13). Furthermore, below tempering temperatures of 700 °C, the hardness decreases not below 300 HV1 (PWTH 7–9) and for temperatures of 700 °C and above, there is not much difference (PWHT 10–14). Only a two-step heat treatment (PWHT 15) softens the fusion zone to values of about 250 HV1.
Before presenting the effect of PWHTs on the mechanical properties, the microstructural results from the heat treatment studies are summarized. During fusion welding, parts of the base material, as well as the filler wires during TIG welding, melt together. Therefore, especially during TIG welding, but also during high energy beam welding of thick components, the resulting microstructures of these welds are similar to those observed after casting, that is, the grains are extremely coarse, arranged in dendritic shapes, and in the case of EUROFER97, the martensitic laths are disordered and unevenly distributed. Adjacent to the weld zones are heat affected zones (HAZs) with much finer grained structures.
Without further treatment, EUROFER97 welds are rather hard and brittle. Therefore, a sufficient post-welding heat treatment—with regard to the demands of the corresponding design—has to be applied. The hardness level of all EUROFER welds could be almost restored by the standard heat treatment (980 °C, 0.5 h + air quenching + 760 °C, 2 h) as well as the microstructure of the 5 mm EB and laser welds. For the other welds, it would probably need higher austenitization temperatures, much longer annealing times, or repeated heat treatments to regain the original microstructure. Another result is the observation that the fine-grained HAZs can only be remove by austenitization. Moreover, without a preceding austenitization step, that is, just by tempering the welds between 550 °C and 800 °C, the original hardness level cannot be restored completely.

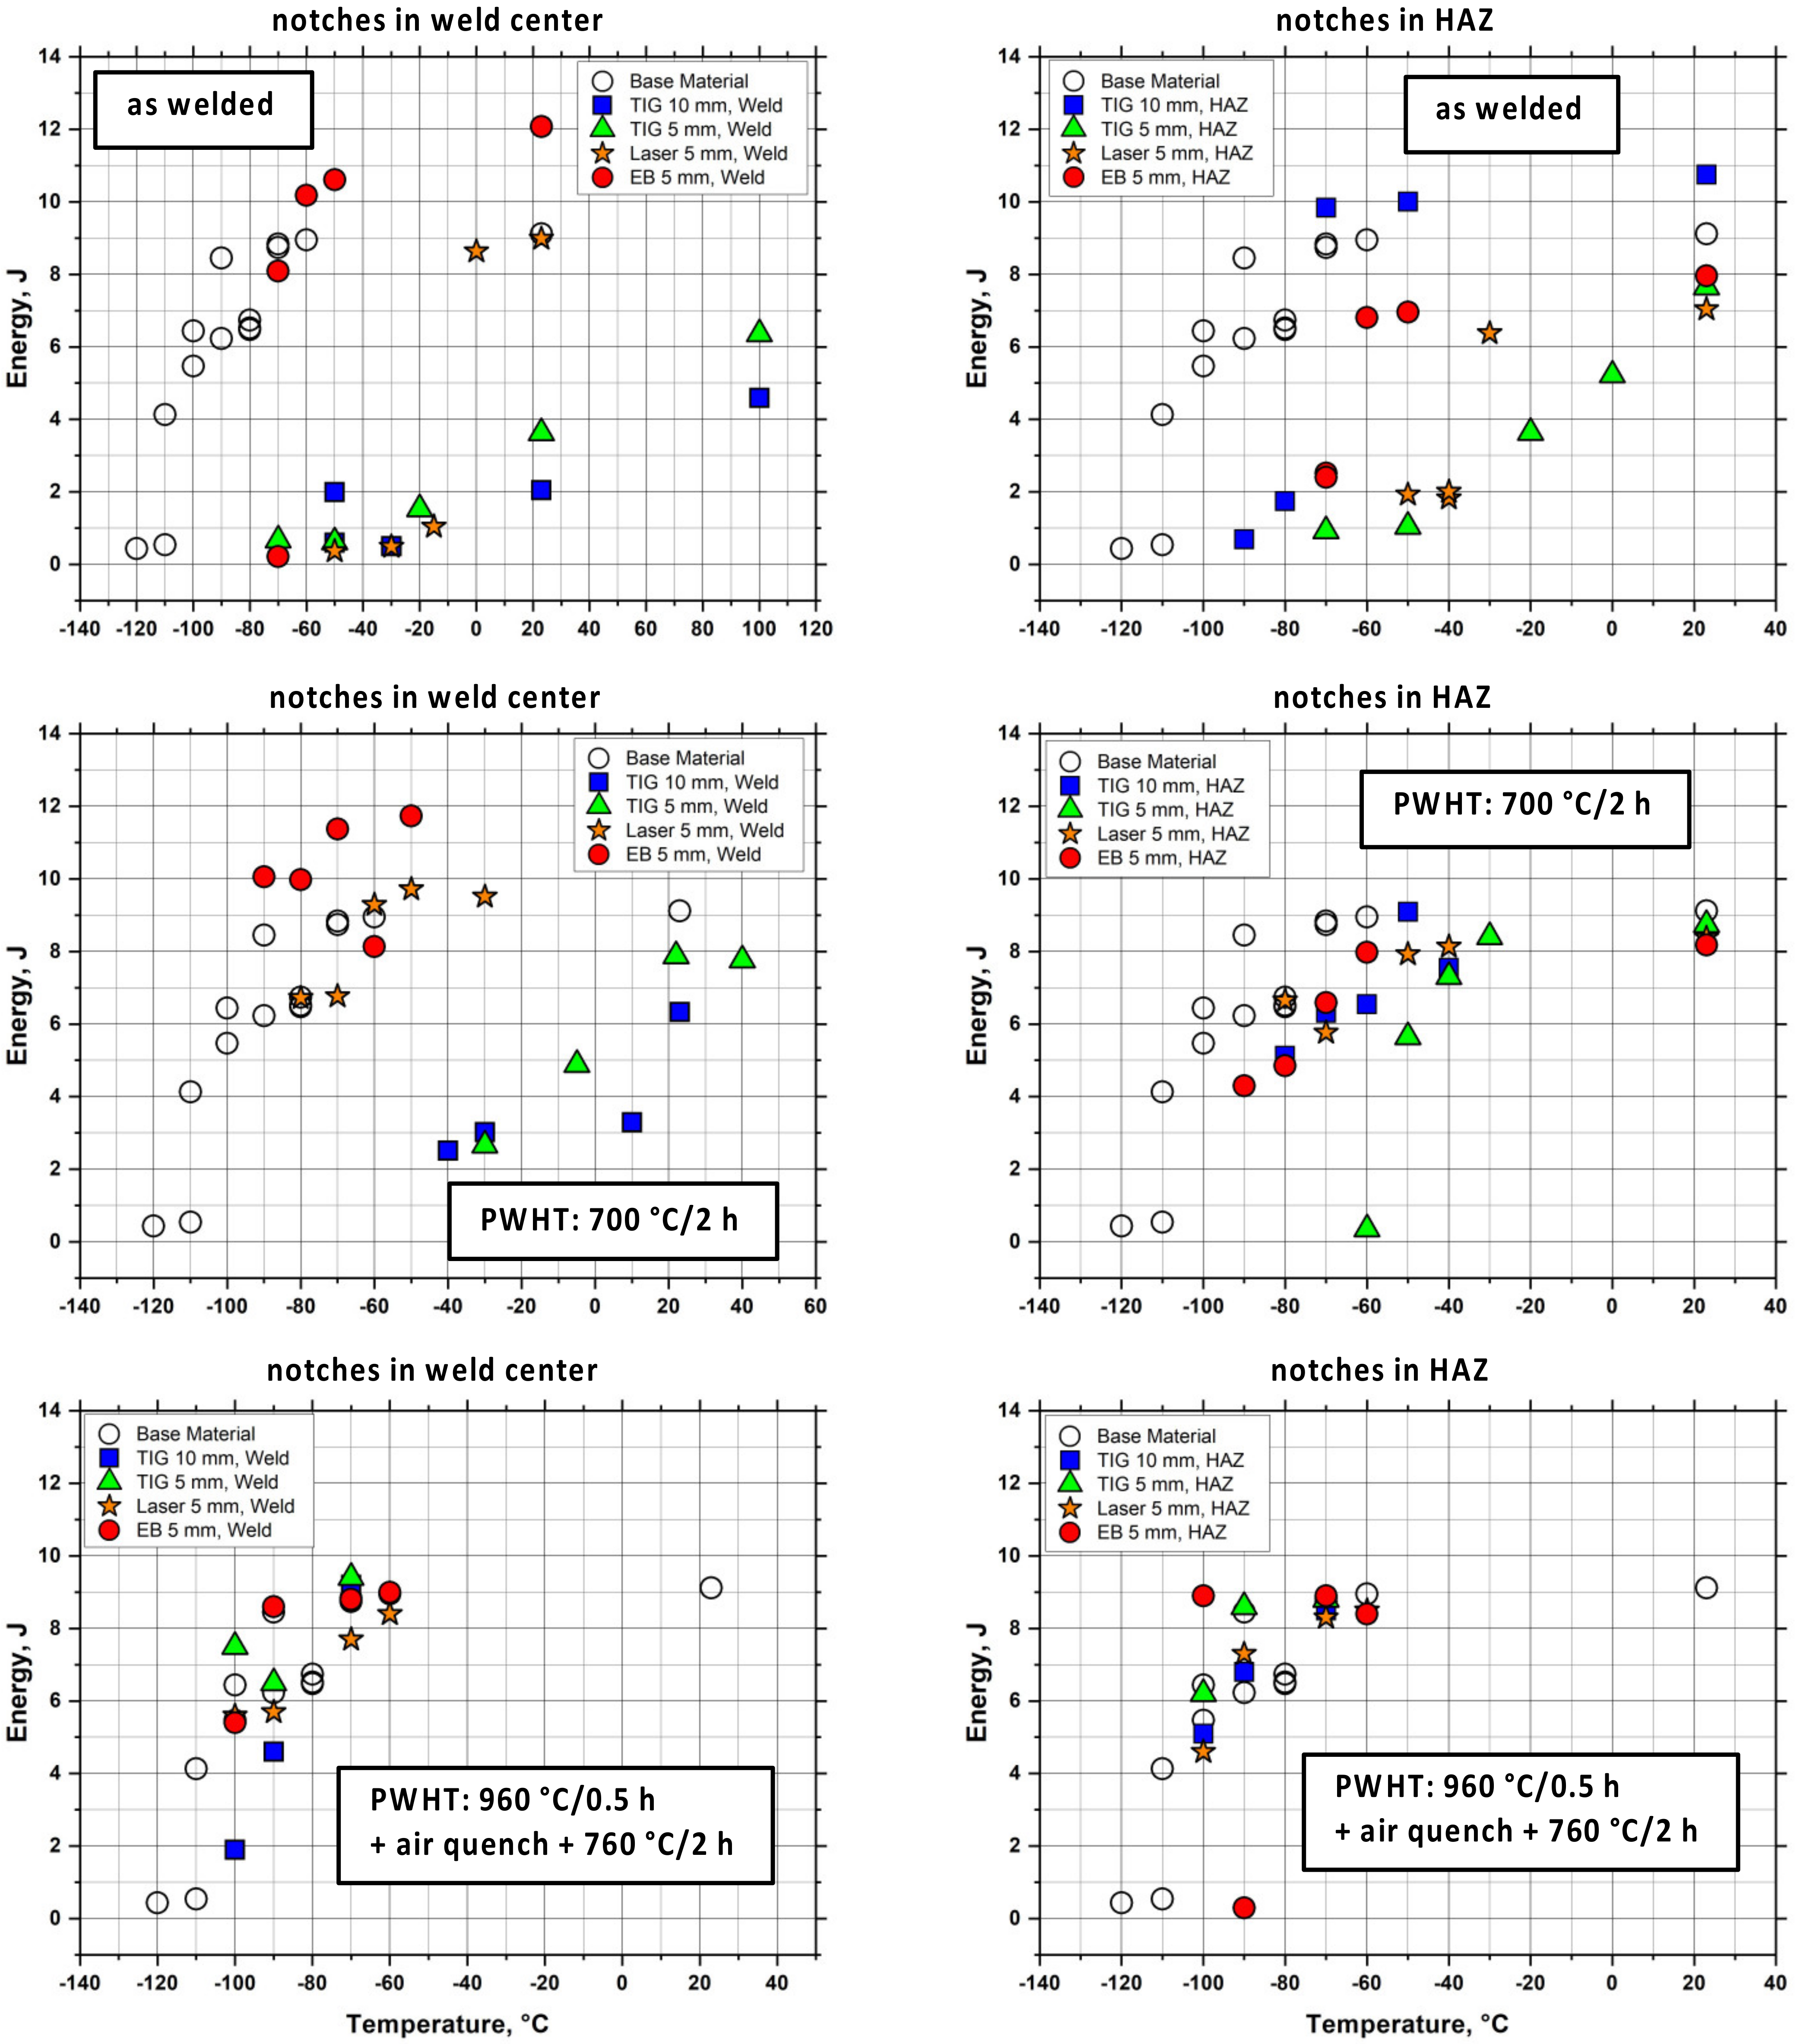
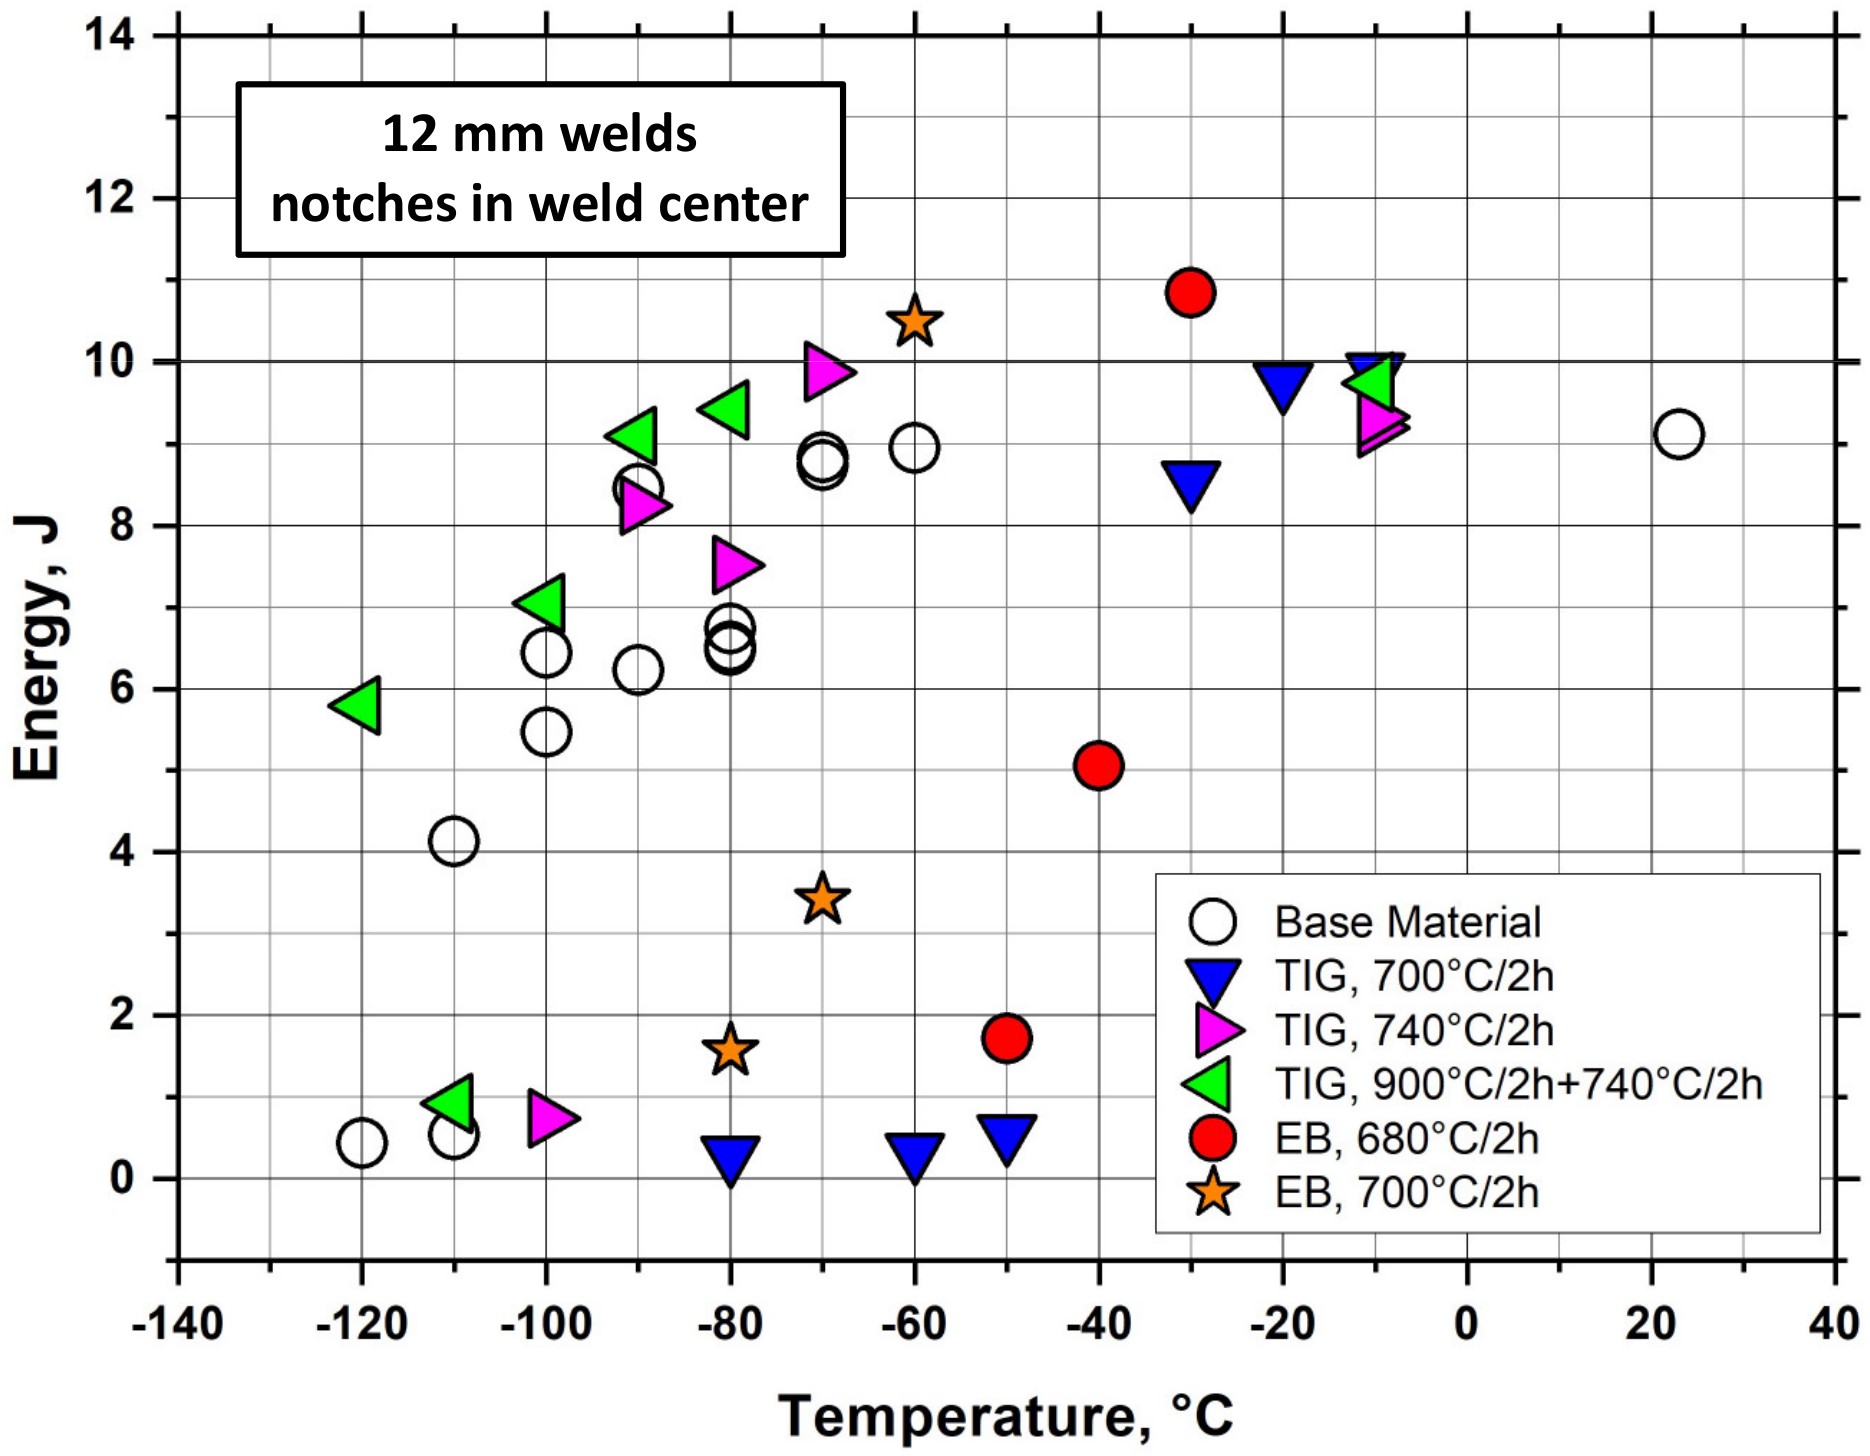
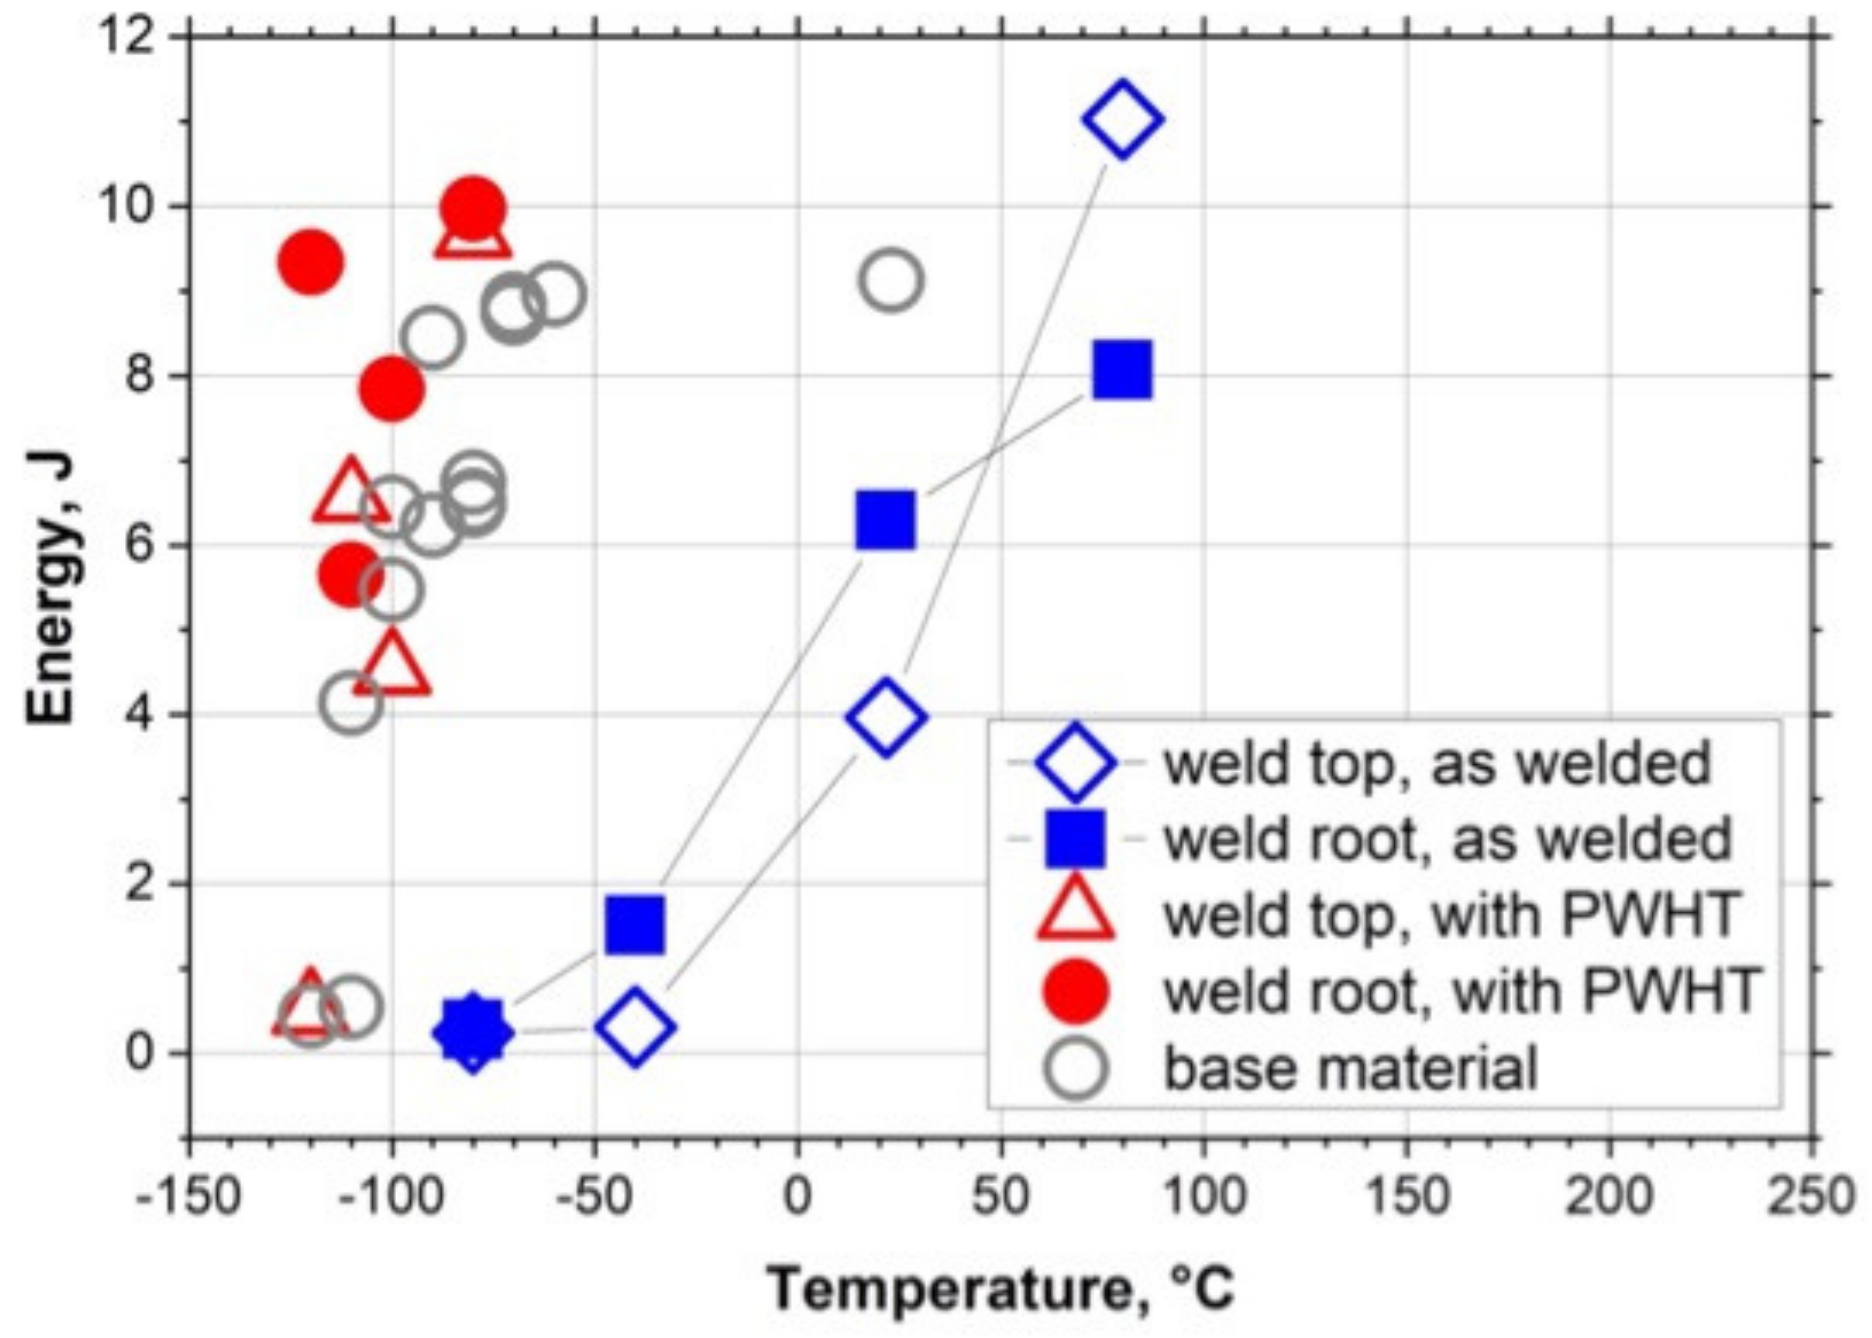
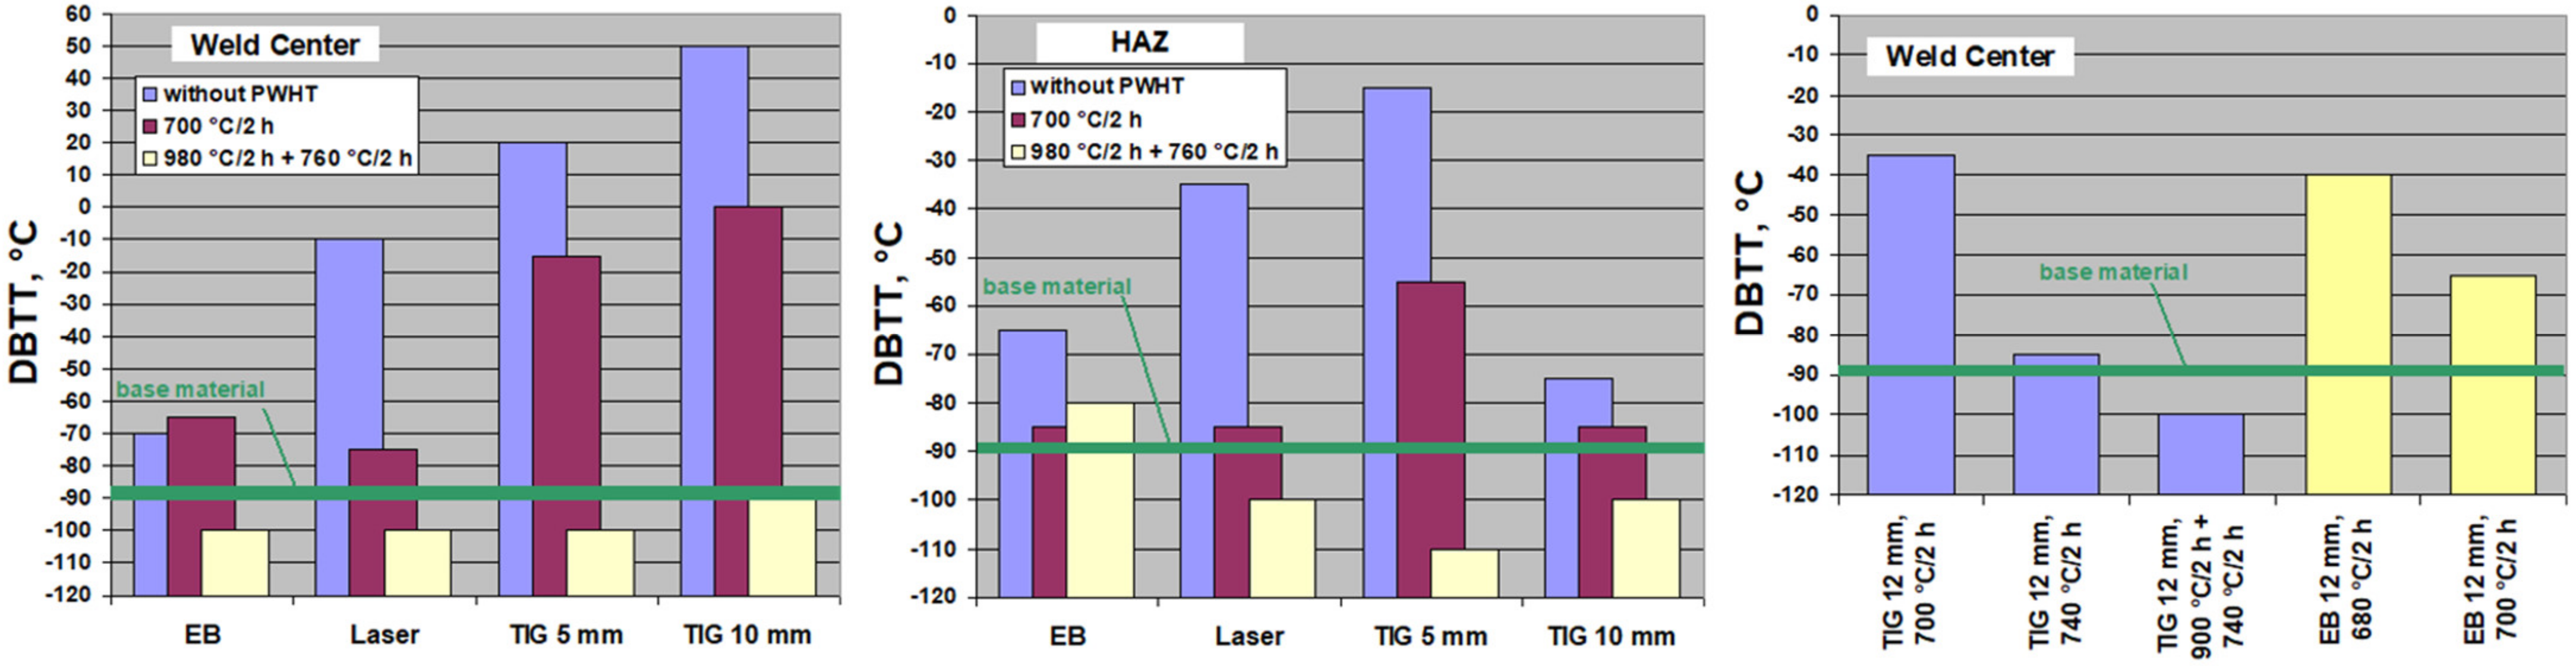
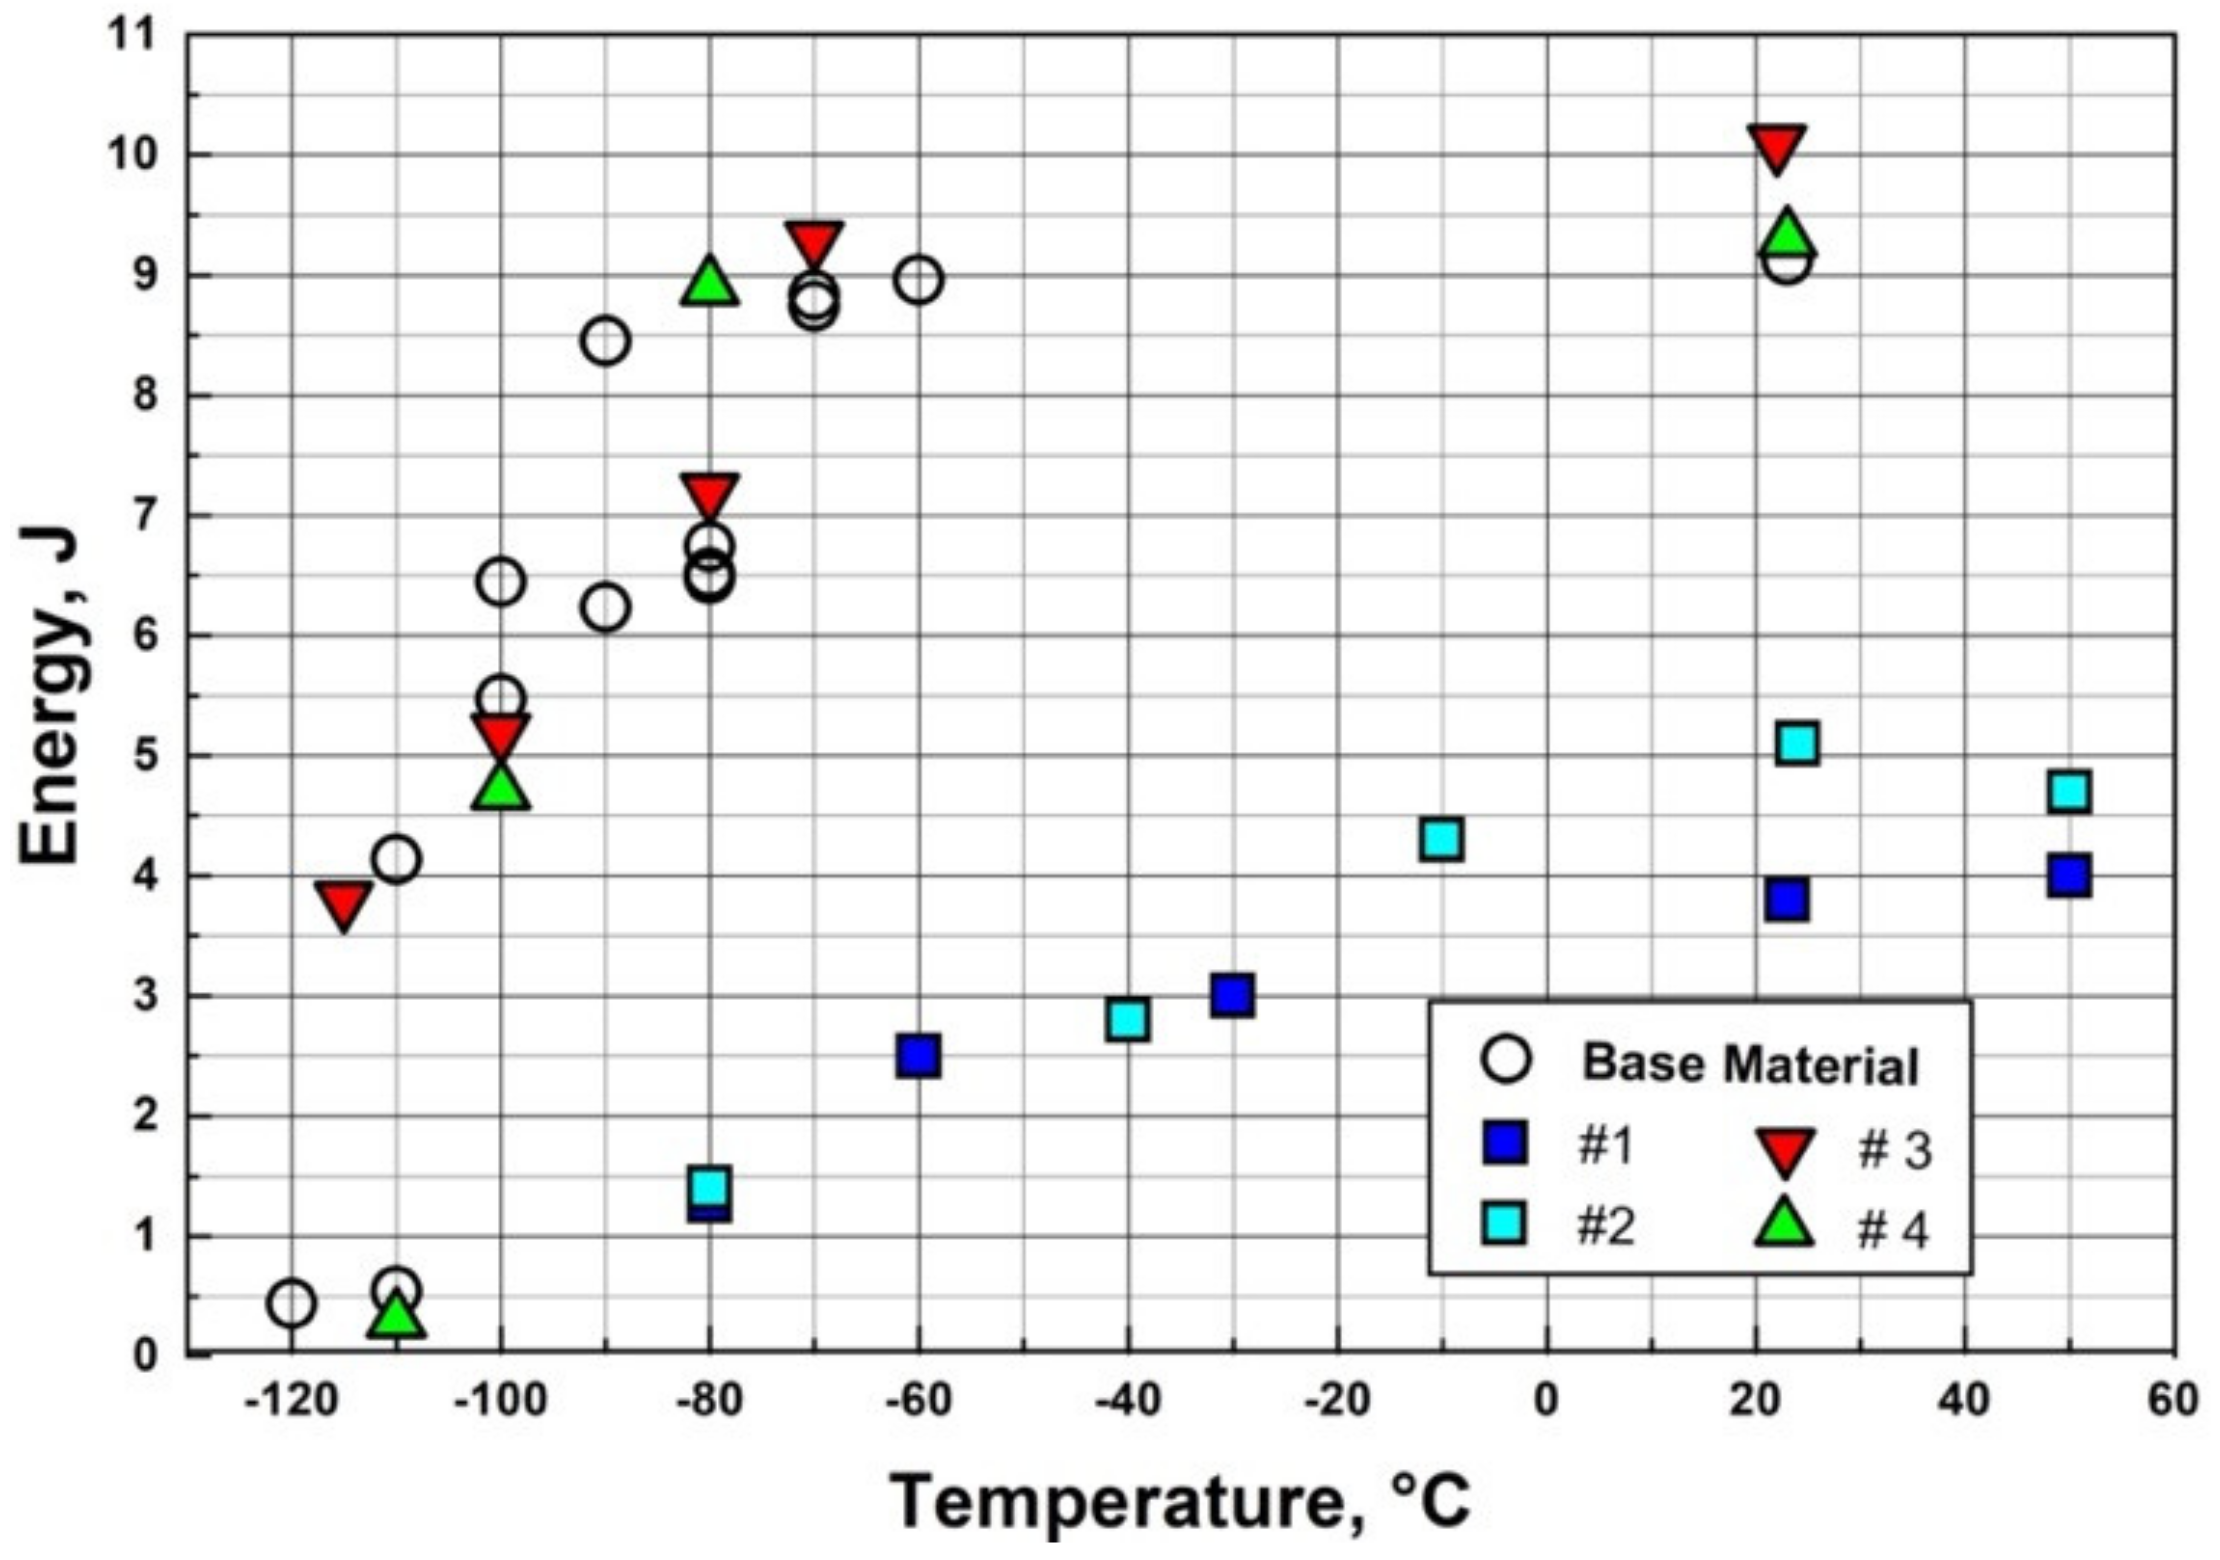
4.5. Effect of PWHT on Toughness

Charpy tests were performed first with specimens from the 5- and 10-mm welds. The Charpy properties of specimens notched within the HAZ seem to tend slightly to lower upper shelf energies (USE) but better DBTT values, compared to the specimens with notches in the weld center. In some cases, the measured impact energies of welds are even higher than the USE of the base material. This is due to bended crack propagations along the HAZs, which need more energy than the usual straight fractures. Figure 14 shows the results for these welds without and after PWHT 1 (standard two-step EUROFER heat treatment, see Table 2) and PWHT 5 (low temperature single-step treatment at 700 °C, see Table 2). After the standard heat treatment (PWHT 1), all welds behave almost as the base material (DBTT: −90 to −110 °C, USE: 9 J), which supports a full restauration of the microstructure.
Without a PWHT, all welds show a clear DBTT shift toward higher temperatures, either with specimens notched in the HAZ or weld center or both. A single-step PWHT at 700 °C (which would be perfectly safe for a final breeder unit assembly including Be pebbles) improves the toughness of the EB and laser welds to values comparable to the base material. The TIG welds, however, perform quite unconvincing with this low temperature one-step PWHT.
Based on these results, further Charpy tests on the 12 mm welds have been performed after PWHT 9, 10, 14, and 15 (see Table 3), with specimens notched directly at the weld fusion zone (see Figure 15). This study clearly demonstrates that base material ductility of TIG welds will only be restored by tempering temperatures of at least 740 °C or higher. Of course, the Charpy properties may be pushed to an optimum by grain refinement with help of a 900 °C austenitization step. The investigated 12 mm EB weld, however, leads to acceptable DBTT values (but still higher compared to the base material) even with a one-step heat treatment at 700 °C. Lower tempering temperatures are not expedient.
Finally, the test results for specimens from the 40 mm EB weld are presented in Figure 16. From the DBTT of about 20 °C, it is obvious that this weld is far too brittle to be useful without PWHT. However, as seen in the beforementioned studies, after a standard PWHT (980 °C/30 min + air cooling + 750 °C/2 h) ductility is fully restored. The results show further that the weld properties are distributed homogeneously (i.e., the Charpy energies from specimens of the weld top are comparable to those of the root). These results are encouraging for a possible application of the present EB welding process for joining the caps to the first wall or to the back plate of breeding blankets.

4.6. Discussion of the Charpy Test Results

An evaluation of the Charpy test series regarding DBTT is compiled in Figure 17. Due to its stochastic nature, the values scatter by at least ±5 K. DBTT of the base material is about −85 to −90 °C, as indicated by a green bar in the graphs. A comparison of the embrittlement shows that for all welds the weakest point with regard to embrittlement is in the weld center and not in the HAZ. Moreover, the upper shelf energies of the welds, in almost all cases, are comparable to or even higher than the USE of the base material. The reason for the higher energies goes back to curved crack propagations, e.g., along the HAZ. Anyway, there is a small tendency for softening, since in the HAZ the USE values are often lower by about 0.5–1.5 J compared to the base material.
Surprisingly, there is one weld with acceptable embrittlement behavior even without PWHT. This is the 5 mm EB weld with a DBTT of just 20 K worse than the base material. DBTT values of all other welds without PWHT are worse by 80–160 K. On the other hand, the applied two-step PWHTs lower the DBTTs at least down to the level of the base material. That is, the embrittlement of all welds could be completely restored by two-step heat treatments, where the lowest applied annealing temperature has been 900 °C in the case of the 12 mm TIG weld.
Another tendency which can be clearly seen is the lower embrittlement of the beam welds compared to the fusion welds. Since all 6 welds have been heat treated at 700 °C for 2 h, the resulting DBTT levels may be directly compared. Laser welding shows the lowest DBTT with −75 °C, followed by the 5 mm and 12 mm EB welds with −65 °C, and finally the 12 mm, 5 mm, and the 10 mm TIG welds with −35 °C, −15 °C, and 0 °C, respectively. That is, after the same (low temperature one-step) PWHT, beam welds show less embrittlement than the TIG welds.
Further, the other PWHTs demonstrate that TIG welds require at least 740 °C tempering to reach a DBTT comparable to the base material. On the other hand, if the PWHT temperature of the EB weld is just slightly reduce to 680 °C, the DBTT is increased by 25 K. Again, this is proof for the high sensitivity of the ductilization of EUROFER97 steels on the tempering temperature.
Another, more conservative method to assess embrittlement is to consider the lowest test temperature where still no brittle fracture is observed in Charpy tests. This so-called lowest temperature in the upper shelf (LTUS) is plotted in Figure 18. The LTUS values are more design-relevant, which can be seen by the fact that the LTUS values in Figure 18 are never better than those of the base material. This is not the case for the DBTT analysis given in Figure 17. However, for our welds there are no qualitative differences.
One goal of the present investigations was to test whether the PWHT temperature can be lowered to less than 750 °C. The answer may now be estimated as follows: beam welds require a PWHT of about 720 °C to show the same embrittlement as the base material. Applying just a 700 °C PWHT, DBTT is worse by about 15–25 K. TIG welds, on the other hand, need a PWHT of at least 740 °C to be comparable to the base material. By only applying a 700 °C PWHT to the TIG welds, DBTT is increased by at least 40 K.
Two step heat treatments have the potential to restore the mechanical properties of all welds. But as has already been shown in a previous section, the micro-structure along the TIG seam cannot be fully restored. Moreover, the soft and fine-grained parts of the HAZs can be removed by the austenitization treatment of a two-step heat treatment. And, as has been outlined in the context of Figure 4, restrictions in the choice of the allowable temperature of a two-step heat treatment would not affect the resulting mechanical properties, since these could be compensated by a suitable tempering step. Therefore, if two-step PWHTs are feasible, they are certainly the optimum choice for all EUROFER welds.
An extensive study investigating the influence of neutron irradiation on the mechanical properties of EB and TIG welds is described in [31]. One of the findings indicated that only welds that have hardness levels and, therefore, also DBTT values, as close as possible to the base material, achieve a high irradiation performance. The recommendation in [31] for an acceptable PWHT is 740 °C/2 h, which agrees with the findings of the present study for TIG welds.

4.7. Effect of PWHT on Tensile Properties

The tensile properties of all investigated welds without PWHT are shown in Figure 19, in comparison to the base material. Only the 12 mm TIG and EB welds delivered enough material for tests at temperatures up to 600 °C. The other welds have been tested only at room temperature. The effect of a single PWHT at 700 °C for 2 h was studied by tensile tests at room temperature, 500 °C and 600 °C. For the full PWHT (i.e., the standard heat treatment), only room temperature tests could be performed. All tensile specimens from the TIG welds fractured clearly out of the fusion zone, that is, inside or just at the base material. The determination of the fracture location for TIG welded specimens is difficult without a microstructural examination of the corresponding cross sections. Since most tensile specimens from the 12 mm TIG welds fractured nearly in the middle of the gauge length, it may be assumed that only here the fractures are mostly located in the fine-grained, soft HAZs.
Transverse tensile (the definition is given in [32]) tests characterize the strength of the whole joint, that is, they reveal the weakest part of the joint. If the fractures appear in the fusion zone, this means that the weld is the weakest part. Possible reasons might be defects, unsuitable chemical compositions of filler wires, oxidized surfaces before welding. A fracture in the HAZ usually indicates that the joint is good but that microstructural changes or diffusion processes during welding have led to a weak area between the fusion zone and the base material. Such soft regimes can only be removed by PWHTs (in the case of EUROFER97 by an austenitization step). Finally, fractures in the area of the base material indicate that the according joint has no weak part, i.e., the weldment is acceptable, at least with respect to tensile loading or straining.
Within certain scattering (10 MPa for tensile, 50 MPa for yield strength, 15% for total and 4% for uniform elongation) the tensile test results of all welds agree well with those of the base material. That is, the tensile behavior is not dominated by the weld zone but by the base material. In other words, the welds show a higher strength, which has been expected.
For a specific determination of the tensile behavior of the welds, the procedure according to [33] (longitudinal tensile test) has to be applied. Since this requires a larger amount of weld material, such a characterization could not be performed. However, from the instrumented Charpy tests, as described in the previous section, dynamic yield strength values were computed, which are closely correlated to the weld zone. This provided much higher values compared to the tensile results. Nevertheless, different heat treatments have been applied to selected welds and tensile tests have been performed at room temperature. The results are also plotted in Figure 19. For comparison, specimens have been prepared without PWHT, with a PWHT of 700 °C/2 h, and with the standard heat treatment (980 °C/30 min + air quenching + 760 °C/2 h). Similar to before, differences in strength (tensile as well as yield strength) are not recognizable. However, two tendencies could be derived from the elongation: (1) 5 mm beam welds are more ductile than 5 mm and 10 mm TIG welds, and (2) a full two-step PWHT slightly increases ductility compared to a one-step PWHT. These observations are in line with the analysis of the Charpy test results.

4.8. Effect of Repeated PWHT

A visual inspection of the micrographs in Figure 13 reveals that the distinct weld microstructures (coarse fusion and fine-grained heat affected zones) do not completely disappear after PWHTs. This is an indication for a certain degree of inhomogeneously distributed micro-structural features (e.g., impurities, secondary phases, segregates, dendritic structures, and/or others), even though the mechanical properties seem to be fully restored.
We have selected the 10 mm TIG weld as a typical case of the above-mentioned behavior, and performed two series of repeated heat treatments: (1) A + Q + T, and (2) A + Q. The initial weld microstructure near the top and in the middle part after one PWHT is compared to the situation after 20 repetitions in Figure 20. It is evident that one PWHT does not remove the coarse grained and irregular weld microstructure (first row in Figure 20). However, a 20-times repetition of A + Q fully restores an evenly distributed, fine-grained, homogeneous microstructure throughout the whole weld area (lower row in Figure 20).
Twenty-times repetition of a full treatment (A + Q + T) also renews the microstructure. Due to repeated tempering in air, the surface was depleted of carbon. Therefore, a decarbonization layer of 100–200 µm developed, which can be easily distinguished from the martensite structure below (left micrograph in the third row of Figure 20). The lack of carbon leads to a phase transition into ferrite, recognizable by the large bright grains.
We have already seen that the Charpy properties are fully restored after a full PWHT. Therefore, we tried to correlate the differences observed by visual inspection of the micrographs to the hardness profiles along the weld cross-section after one and 20-times repeated PWHTs. The result is illustrated in Figure 21. The average value of both series is the same and amounts to 213 HV1. Nevertheless, the hardness profile after 20 repetitions seems to proceed smoother compared to the case of one PWHT. This is confirmed by calculating the maximum and standard deviation, which amounts to 5.6 and 3.0 HV1 for 20-times repetition, and to 10.9 and 5.2 HV1 for the single PWHT.

5. Machining

In component fabrication, machining of semi-finished products is an important process, in which the final shape is generated. Turning, milling, sawing, and drilling are typical metal cutting processes, whereas sinking and spark wire eroding are electric discharge machining (EDM) processes. For the fabrication of the breeding blanket and its subcomponents, the application of both, cutting and EDM processes is probably unavoidable. This applies, in particular, to the joining surfaces, but also to all cases, for which a specific surface quality is important. We placed an emphasis on available or technologically scalable processes that are especially appropriate for industrial applications. Therefore, we analyzed common fabrication routes for their applicability in an industrial environment. The following two subsections present studies on the surface topology by (1) milling and (2) by wire-cut EDM.

5.1. Milling

For this study, we prepared several surfaces from pieces of EUROFER97/2 (heat 993402, heat treatment: 980 °C/0.5 h, air quenching, 760 °C/2 h) by dry milling, i.e., by machining without coolant. Four common milling procedures (# 1–4) have been applied according to the details given in Table 4 and Figure 22.
The different surfaces structures that resulted from procedures # 1–4 were visualized by electron microscopy (see Figure 23a–d). The images show clearly that the surfaces (a) and (b) (procedure # 1 and # 2), which were fabricated by the 4 teeth radius cutter, are rougher compared to the surfaces (c) and (d) produced by procedures # 3 and # 4. Both reveal distinct distortions due to chipping. They look like some chunks had been broken off from the surface. Surprisingly, roughness profiles (derived from 3d SEM image processing, normal to the milling direction) of all surfaces look quite similar and there are no noticeable differences in the characteristics.

5.2. Hardness Effect on Chipping

The mentioned irregular shaped surface distortions are due to specific chip removal conditions. Chipping strongly depends on the general material properties, that is, ductile or soft materials tend to “smear” during cutting, while chip removal from harder surfaces usually is less problematic. Since hard materials cause higher wear, there is an optimum for both, surface quality and abrasion of the tools, which in turn is relevant for cost efficiency. For verification of the hardness effect on chipping, we applied two different heat treatments prior to surface fabrication. One sample has been machined after an austenitization treatment of 980 °C/0.5 h and subsequent quenching in air. Another one was fabricated after austenitization and quenching, followed by tempering at the lowest possible and still effective temperature, i.e., at 630 °C for 2 h. The first one leads to slightly harder surfaces of about 400 HV30, the later to approximately 300–350 HV30. After the heat treatments, the surfaces were milled by applying milling procedure # 2. The results are compiled in Figure 24. Compared to Figure 23b—machined after a standard heat treatment including tempering at 760 °C, which leads to a hardness of 200–220 HV30—the harder surface of the specimens (a) and (b) in Figure 24 resulted in much smoother surfaces. This confirms that harder EUROFER97 surfaces positively affect the chipping behavior of milling. Therefore, an appropriate heat treatment proved that evenly structured surfaces on EUROFER97 parts may be produced by any milling tools.

5.3. Wire-Cut Electro Discharge Machining (EDM)

Wire-cut EDM is a common technology for splitting parts apart. In principle, any contour can be realized by this process, which provides some advantages over sawing. In the fabrication of breeding blankets and for some of their subcomponents, several fabrication concepts are based on the use of wire-cut EDM. For example, the fabrication of cooling-channels can be realized by long-wire EDM, which is possible up to 3 m length. Other methods require diffusion bonding of complex shaped parts, which are also produced by wire-cut EDM. An overview and more details are given in [34,35,36] and references therein.
To elaborate the differences of machined and spark-eroded surfaces, we performed a SEM examination and analysis on a piece of EUROFER steel that was prepared by wire-cut EDM. The results are depicted in Figure 25.
The cross-section reveals a considerable number of particle-like debris attached to the surface. From top-view, the appearance is indefinite and rather rough. It seems that the material that is removed by electro-spark machining, is partly redeposited on the surface. The EDX elemental maps show further that also particles, which were worn off from the wire, are present in this surface debris layer. Since the wire material is brass, the highlighted elements are Cu and Zn. It is obvious that wire-cut EDM does not produce shiny surfaces. Indeed, EDM machined parts look brownish in different shades (sometimes even black or rusty). Therefore, EDM processes require subsequent grinding, emerizing, sand blasting, or other mechanical cleaning and finishing steps. Of course, quality and further details of the surface constitution strongly depend on the process parameters (wire composition, wire thickness, wire feed rates, voltage, frequency, electrolyte, etc.). However, going further into detail would exceed the scope of this article. It suffices to summarize that (opposed to dry milling) surfaces are severely contaminated by wire-cut EDM, and therefore, might require additional cleaning steps.

6. Solid State Bonding

In contrast to fusion welding, in solid-state bonding, surfaces are merged by diffusion. To enable and speed up such joining processes, the surfaces are pressed together to maximize the contact area. Further, the joining interface has to be clean, that is, oxide layers (or others), which would impede solid-state diffusion, have to be removed. This also implies that the bonding process must take place in vacuum. Due to these facts, most often the parts are placed together (joining surface to surface) in a container, which is evacuated and sealed. Then the actual joining takes place in a hot isostatic press (HIP)—for plane interfaces, uniaxial presses are also applicable—at temperatures typically higher than about 60–70% of the melting point and under highest possible pressure.

6.1. Impact of Surface Machining

We produced weld samples from pairs of EUROFER97/2 pieces by hot isostatic pressing. The weld surfaces with cross sections of 25 mm × 25 mm were machined as defined in Table 4 by the procedures # 1–4. Then, the samples were tight sealed in vacuum by a 1–2 mm deep circumferential electron beam weld line along the surface of the joint. Thereafter, diffusion bonding was performed by a HIP cycle at 25 MPa/1050 °C/2 h, followed by a standard heat treatment at 980 °C/0.5 h, air quenching, and 760° C/2 h. Charpy specimens (KLST type, 3 mm × 4 mm × 27 mm, 1 mm notch depth) were fabricated perpendicular to the weld line, joint surface, and rolling direction, while the notches were oriented parallel to the weld surface. Specimen size and testing conditions (support span 22 mm, 50 J pendulum) followed European standards. The test results are presented in Figure 26.
Procedure # 1 and # 2 have been produced using the same milling cutter but with different parameters. Both surfaces (dark and light squares) showed a high density of chipping flaws (see Figure 23). Compared to the unwelded EUROFER97/2 base material (white circles), the Charpy properties are significantly deteriorated, while procedure # 3 and # 4 (different cutting plates in a 5-knife head tool) show about the same toughness as the base material. These differences can be directly linked to the surface structures and, therefore, to the different chipping behavior (see Figure 23). However, it is rather questionable to use surface structure or roughness as a measure for the diffusion bond performance, since there are other parameters, by which the bond properties may be affected even more. Hence, let us consider further studies.

6.2. Impact of HIP Parameters

The reason behind the relatively low pressure of only 25 MPa in the previous diffusion bond study was a specific concept for fabricating the cooling channels of a first wall or for the caps. For many applications, e.g., for plating the first wall, there are no limitations in pressure. Therefore, we examined the effect of a higher HIP pressure by performing a second cycle on sample ID 2. The result of such a HIP cycle at 1050 °C with 100 MPa for 2 h is illustrated in Figure 27. The cross-section after only one HIP cycle reveals the reason for its low toughness: there are remaining cavities in the weld surface. These cavities (but also the recognizable weld interface) are fully removed by the second HIP cycle at 100 MPa pressure, and this, in turn, has improved the Charpy properties, which are now as good as those of the base material.
In conclusion, higher bonding pressure may compensate for a low surface quality in terms of roughness or chipping; therefore, it may improve the weld properties. Further parameters that also promote diffusion are temperature and time. A common approximation of Fick’s 2nd law allows for assessing their impact. Hence, the diffusion length ld can be approximated by:
l d D · t ,
where D is the diffusion coefficient and t is time. For a plane diffusion bond, ld is the penetration depth in both directions. Therefore, the final bond width after time t is about 2 × ld. Since D is given by
D = D 0   e F k   T ,
with the diffusion parameter D0, activation energy F, Boltzmann’s constant k, and temperature T, it increases exponentially with temperature. Thus, the effect of temperature on the diffusion bond width (2 × ld) is much stronger than that of time. Another interesting side aspect of high HIP temperatures becomes relevant for production routes in typical industrial environments. This topic is addressed in the following section.

6.3. Corrosion and Contamination

Opposed to laboratory conditions, industrial fabrication procedures are usually far from perfect with respect to cleanliness and chronology of the production steps. Both are oriented towards high efficiency and easy application. Since for diffusion bonding clean surfaces are obligatory, there might be a discrepancy between optimum joining quality and commercial fabricability of large parts such as blankets.
Surface contamination includes two basically different effects, which may lead to and act as diffusion barriers, and thereby, deterioration of the weld properties. Evidently, one is oxidation. This applies especially to chromium steels, where the corrosion resistance is caused by thin Cr2O3 surface layers, which in turn suppress diffusion significantly. The other effect literally results from “dirt”. In industry, this typically results from contact with oil, coolants, dust, water, wrappings, and many more contaminants. That is, prior to diffusion bonding, the surfaces have to be cleaned. A problem arises here, since there might still remain traces of the cleaning agents or of the dirt or of both. In any case, such remnants could react locally with the surface before and during the HIP process, and they might also act as a diffusion barrier.
It is well known that 9%-Cr-steels such as EUROFER rust quickly in (sea-)water, in acids, or on contact with sweaty fingers. But the interesting question in connection with diffusion bonding is the rate at which an oxidation layer forms on a fresh fabricated surface in a common (industrial) environment. As previously demonstrated, the perfect final surface processing step consists in dry milling. Then, before the HIP process, both surfaces have to be fixed and joined together by a circumferential and vacuum tight electron beam weld line. During industrial production, there will always be a more or less extended period between both steps, and this means that more or less extended oxide layers will form.
This effect was studied by a first test series (see Table 5, ID T0–T4). The reference sample T0 was fabricated similar to the previously described surface procedure # 4. It was immediately sealed vacuum tight by an EB-weld after milling. Four other samples have been put in a humidor with a constant relative humidity of 70% for 24 h, 48 h, 72 h, and for 14 days (T1–T4) prior to sealing in the EB-weld chamber. Finally, the samples were put in a HIP for two hours at a pressure of 25 MPa and at a temperature of 1150 °C. We increased the HIP temperature, because it is well known that diffusion bonding in the range around 1050 °C is sensitive to oxide layers. At higher temperatures, these might dissolve. Therefore, we applied only a low pressure, to allow strong effects of the treatments. Thereafter, the standard post-weld heat treatment has been applied before fabrication and testing of the Charpy specimens.
The results are plotted in Figure 28. First of all, there are two clear outliers in the reference series at −80 °C, which otherwise comes rather close to the base material results. Further, it is remarkable that all oxidation conditions led to the same upper shelf energies and the DBTT is shifted by only 30 K, in the worst case. Nonetheless, there is an effect from different oxidation periods: It seems that 24 h oxide formation does not deteriorate the diffusion bond considerably. After 48 h, however, there is a deterioration of DBTT, but which is not further impaired by extending oxidation periods up to 2 weeks. Due to the mentioned outliers in the test results (e.g., T0 −80 °C or T2 −90 °C), this conclusion should better be treated as a tendency and not stressed too much. On the other hand, down to test temperatures of at least −70 °C, there is no brittle fracture, independent of the oxidation period. In other words, the maximum LTUS after treatments T0–T4 is −70 °C.
The effect of oxidation protection by using spray oil has been studied on two additional samples (T5 and T6). One has been cleaned with isopropanol after 14 days oxidation in air with a relative humidity of 70%. The other has been cleaned with industrial soap. The sample T4 from the previous study has been taken as a reference. As can be seen from Figure 29, oiling the surfaces may reduce oxidation, but obviously only isopropanol removes the oil without residues, since cleaning with soap leads to the same or even worse results compared to unprotected oxidation (scattering of the results impedes a definite assessment).
Finally, the influence of milling with coolant (as is standard in industry) on the weld quality was also studied by two samples. One sample was just wiped dry after milling (T7), the other was cleaned with isopropanol (T8). Figure 29 shows that the use of milling coolant has no effect on the diffusion bond process if the coolant is removed with isopropanol. Without cleaning, that is, just by drying the surfaces with wipes, the weld performance is clearly deteriorated. With the exception of treatment T7, this study leads to the same conclusion as the oxidation study: All samples (except for T7) show the same upper shelf energies and LTUS amounts to −70 °C, even in the worst case.
Microstructure analyses of the weld interfaces confirmed optimum structural bonds in all cases: the weld surfaces were not recognizable, i.e., roughness, oxide layers, dirt and other residues did not influence the diffusion bonding. Of course, we may further improve the bond properties by increasing the pressure to 100 MPa.

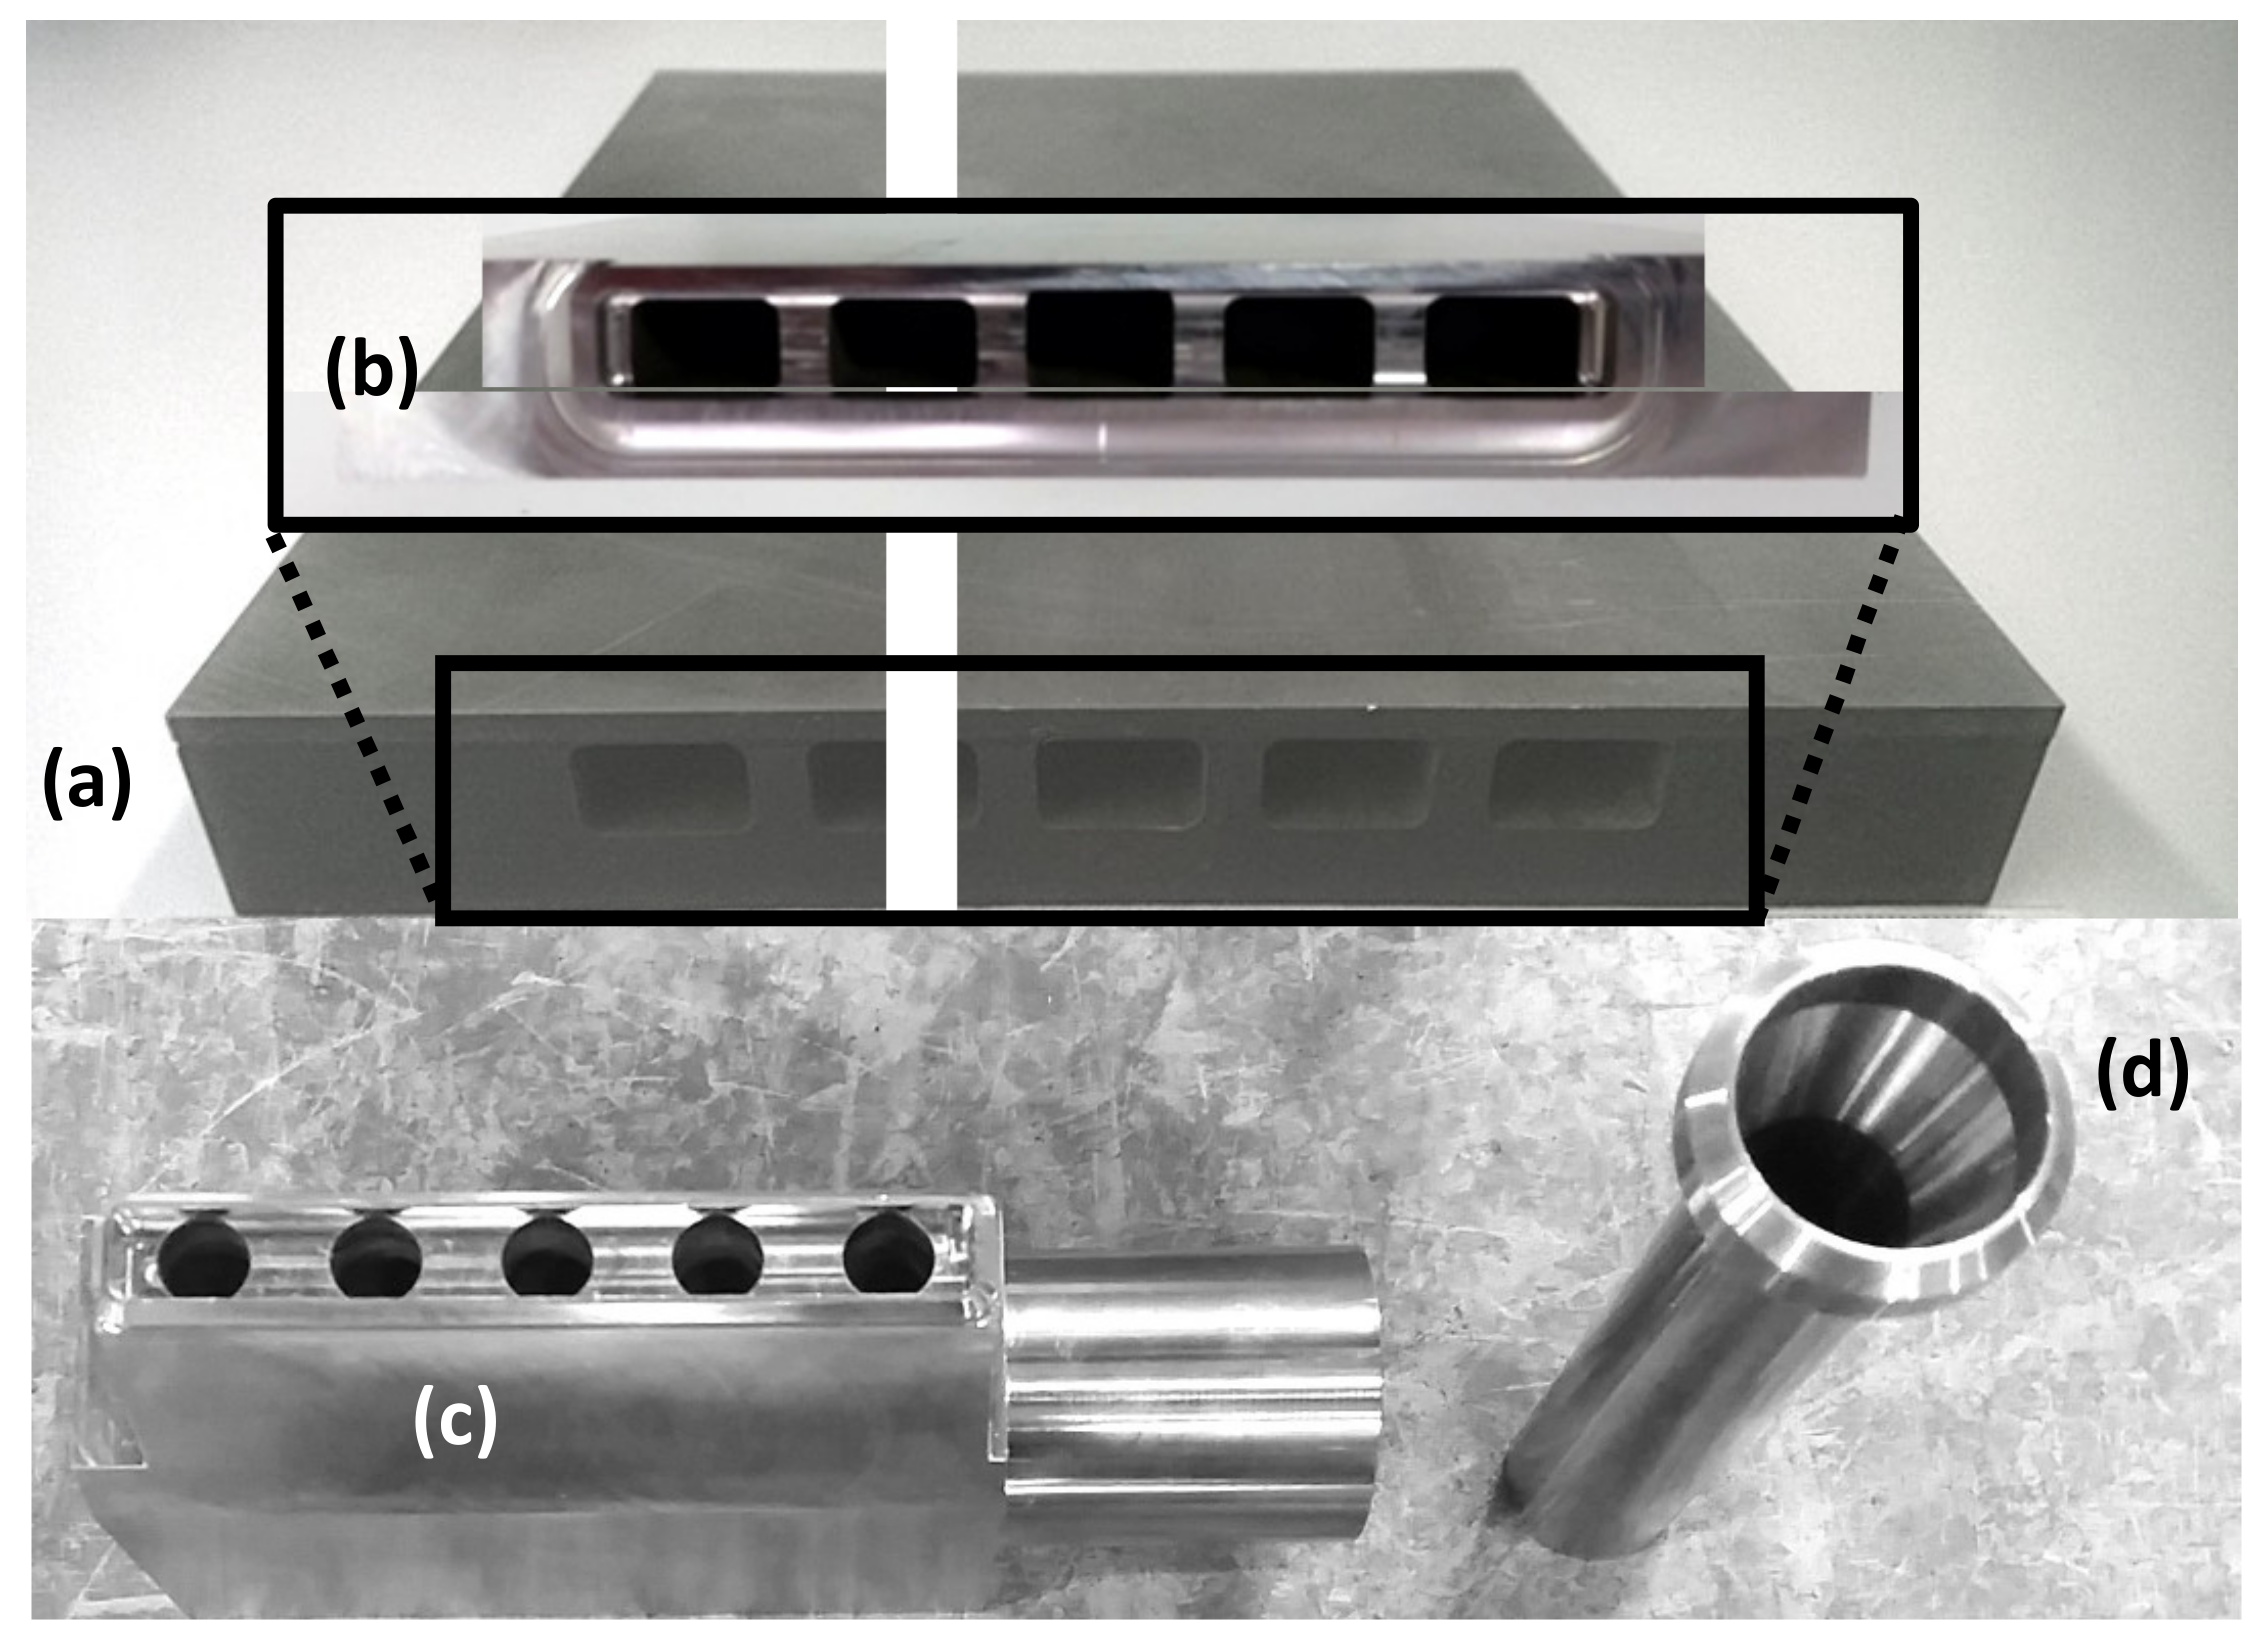
7. First Wall Mock-Up

At this point, after the investigation of the most important fabrication processes for breeding blankets from a materials technological point of view, in the following two sections we present a case study. For this, we designed and fabricated a mock-up, which was then tested in a high heat flux facility.

7.1. Design

We designed the mock-up to get a down-sized representative model of a typical first wall, e.g., that of a DEMO reactor, which may be installed in the Helium Loop Karlsruhe (HeLoKa) for high heat flux tests. In principle, an ODS steel-plated first wall could yield advantages for all breeding blanket concepts, e.g., in terms of longer life-times, but the water temperature is limited to a sub-critical operation regime (super-critical water cooling has not been taken seriously into account for a DEMO reactor). Therefore, the benefit of ODS steel plating might be higher for the helium-cooled concepts due to the possibility of increasing the operating temperature. From a fabrication point of view, i.e., regarding a possible ODS steel plating, there are no big differences between the blanket concepts. Thus, we decided to use the Helium-Cooled Pebble Bed (HCPB) breeding blanket concept as a reference for the mock-up design. Detailed outlines of the design are given, for example, in [34,35,36] and references therein.
The mock-up consists of six parts: a mock-up plate with 5 cooling channels (EUROFER97/2), an ODS steel plate (13Cr-1.1W-0.3Ti0.3-Y2O3), 2 helium distributors (P92), and 2 reducers (P92). P92 steel is a conventional 9Cr-2W-Mo steel, type 1.4901. For the TIG welds, P92 filler wires were used. The layout is illustrated in Figure 30. The helium distributors allow a homogenous mass flow distribution in the 5 channels. Their design was developed based on CFD analyses for a total mass flow rate of 40 g/s in each channel (i.e., 200 g/s in total), an inlet temperature of 300 °C and an inlet pressure of 8 MPa. The computed maximum deviation of 4% relative to the nominal mass flow rate is fully acceptable, since the effect on the temperature distribution on the mock-up during the experiment is negligible. Moreover, the total pressure-drop in the distributors and in the mock-up have been calculated to be 0.05 MPa only.
We designed the mock-up with five cooling channels. The geometry and details of the ODS steel plating are depicted in Figure 31. The inner surfaces of the channels were designed flat, i.e., they were not equipped with swirls or other turbulence enhancers. Note: The middle channel was intentionally misaligned, so that the weld seam of the ODS steel plating appeared at the corner, which is the highest stressed location. This generated two lines of preferential crack initiation.

7.2. Fabrication

For the mock-up fabrication, we followed a sequence of fabrication steps, which are, in principle, also applicable to the manufacturing of real-size breeding blankets: (1) fabrication, machining, and preparation of ODS and EUROFER97 steel plates, (2) ODS steel plating, (3) machining the cooling channels, connections, connector parts, and reducers, and (4) joining connectors to the mock-up plate connections and joining the reducers to the connectors.
We produced a lab-scale batch of ODS steel that was tailored to the mockup fabrication. Pre-alloyed powder (5 kg) was mechanically alloyed together with yttria powder in hydrogen atmosphere in an industrial attritor ball mill at Zoz GmbH, Germany. The as-milled powder with a chemical composition of Fe-13Cr-1.1W-0.3Ti-0.3Y2O3 was packed in Argon and sent to KIT for further processing in an Argon-filled glove-box to protect the powder from oxidation in air. Here, it was sieved and the fraction between 45 µm and 90 µm powder particle diameter was taken out. From this, 2.6 kg were filled in a cylindrical 316 L stainless steel capsule (diameter of 80 mm, height of 170 mm). After degassing at 400 °C in vacuum, the capsule was sealed and then hot-isostatic pressed at 1100 °C with a pressure of 100 MPa for 2 h. After taking off the top and bottom of the capsule, it was sent to OCAS, Belgium, for tempering and hot-cross-rolling at 1050 °C. Finally, the ODS steel plate surfaces were milled down about one millimeter to remove the leftovers of the stainless-steel capsule. Unfortunately, vibrations during milling caused grooves and an overall rougher surface than usual. Since such imperfections might have to be tolerated in an industrial production, we continued the mockup fabrication and used this as a robustness test. More details are given in [37]. The bonding surface of the EUROFER plate was also milled over (by about 0.1 mm) to remove the oxide layer and to ensure a proper diffusion weld process.
Instead of the usual encapsulation, we applied the procedure, which we already used for the sample fabrication for the surface treatment and solid-state bonding studies: after surface preparation, the ODS and EUROFER97/2 steel plates were fixed together in an electron beam welding facility. Then, a circumferential weld seam with a penetration depth of about 3 mm was prepared. Since the EB weld facility works in vacuum, both plates were encapsulated, evacuated, and sealed in one step (see also [38,39,40]). Diffusion bonding of the ODS plate with the EUROFER97/2 steel was accomplished at Bodycote, Germany, by hot isostatic pressing (HIP) in an industrial press with temperature and pressure control. Based on our previous studies, the joining was carried out for about 2 h at 1100 °C with a pressure of 100 MPa.
After joining, the block was milled to the final outer dimensions of 208 mm × 160 mm × 23.5 mm, reducing the thickness of the ODS steel plate to 3 mm in the process. Then, the block was sent to KRÜGER ERODIERTECHNIK for electro-discharge wire-cutting the cooling channels according to the drawing in Figure 31. Finally, the connections of the cooling channels to the connector parts were milled into both sides of the mock-up plate. The reducer, connector, and mock-up plate fabrication are compiled in Figure 32.
The joining of the plate and the additional parts was performed in two steps. In a first step, the reducers and helium distributors were assembled by TIG welding followed by a post-welding heat treatment of these parts. Then the connectors were TIG welded on both connections of the mock-up plate, followed by a second PWHT of 980 °C/1 h + air quenching + 750 °C/2 h to optimize the component for creep strength and toughness. The second PWHT was performed on the whole mock-up. Finally, the welds were examined by liquid penetration as well as by ultra-sonic testing. Both revealed neither cracks nor leaks.
In summary, the mockup fabrication was performed using solely industrial-based or commercially established processes, which could also be applied to the production of the real components—the breeding blankets. More information on the industrial scale production of the used ODS steel can be found in [37]. The fabrication included two weak points that would allow for assessing the robustness of the design in terms of (1) small imperfections in machining and handling a 2 m2 size surface of a massive component in the several tons range within an industrial environment and (2) possible crack initiation domains due to fabrication, material, operational, or processing shortcomings. The first one refers to milling grooves in the surface of the ODS steel plate that have not been removed before diffusion bonding, while possible crack initiation lines were included intentionally by design. Such a bold defect would most probably not occur in the real production process. In this case, however, the intention was to accelerate the time to failure during the high heat flux test, and, therefore, to determine the robustness of the outlined fabrication approach.

8. Test in the Helium Loop Karlsruhe

The European DEMO operating scenario for the starter blankets includes cycle numbers in the order of 10,000. Since that would have exceeded our available testing time contingent, the emphasis of this first experiment was rather placed on probing higher surface temperatures (i.e., 600 °C or even higher) than on reaching realistic cycle numbers.
Before the high heat flux testing, an engineering design of the experimental setup had to be developed. This included thermo-mechanical FEM simulations, safety analyses according to the RCC-MRx code, pressure test according to EN 13455-5:2014, and an instrumentation of the mock-up as well as of the test facility. This allowed recording of the mock-up surface temperature by infra-red (IR) camera, helium inlet/outlet temperatures, the total mass flow, and the absolute helium inlet pressure. Finally, the mock-up was installed in the Helium Loop Karlsruhe (HELOKA), described in detail, as an example, in [41,42,43,44].
After initial tests, the mock-up was loaded according to the defined goals, that is, high heat flux tests were carried out by operating the test facility in the reference scenario. Here the electron beam was switched on and off in 2-min intervals for a predefined number of cycles. Three fatigue test sequences with 100 cycles each were conducted, resulting in surface temperatures of 550 °C, 600 °C, and 650 °C. Then, a final sequence of 7 cycles with a pulse length of 2 h was performed (see Table 6).
During the first three sequences, the operating parameters remained within safe margins, indicating that the mock-up did not start to crack or fail. The remaining operating time for testing our mock-up was then used for a longer-pulse exposure at 650 °C surface temperatures. During the 7 pulses of 2 h each, creep or other thermal effects might have been activated that would damage the mock-up. However, a peculiar change in the operating parameters did not appear, which indicated that the structural integrity was (most probably) not affected.
In summary, the performed four test sequences of more than 300 high heat flux cycles in total can be marked as a full success. The predefined goals have not only been reached, but were even exceeded.

9. Post-Test Microstructure Analysis

After the high heat flux testing, we wanted to identify and investigate possible microstructural changes, defects, and surface modifications in the assumed critical zones of the mock-up. For this, several cross-sections through the mock-up were cut and prepared for optical and electron microscopy, i.e., scanning electron microscopy and Back Scattering Electron (BSE) imaging. Prior to the microstructure analysis, a representative piece of the mock-up was cut off, from which further samples were extracted and prepared for microscopy.
The first results are illustrated in Figure 33. The BSE images of the ODS steel/EUROFER97 weld interface were acquired close to the corners of channels A and C, as indicated in the sketch. Both are the high heat flux loaded hot areas. On the EUROFER side of the interface, an area of about 100 µm depth is recognizable that contains larger grains. In the following, we denote this area as weld interface zone (WIZ). The interface temperature during fabrication was 1100 °C for 2 h (followed by several heat treatments), during which the WIZ certainly has formed. We estimated the interface temperature between the channels during the test sequences #3 and #4 to about 500 °C, based on FEM analyses. This raises the question whether the WIZ grew further during the high heat flux tests. Hence, for comparison, we examined an interface area far away from the heat load zone (i.e., this region did not exceed temperatures of about 200–300 °C) and observed also WIZs with depths in the range from about 70–100 µm. This confirms (1) that the formation of the WIZ occurred during the solid-state bonding (ODS steel plating) and (2) that the zone did not grow during operation in the HELOKA facility.
Moreover, we could successfully determine the involved phases by performing a principal component analysis (PCA) on SEM-EDX datasets of an interface region inside the heat flux zone. In this case, we identified three phases (factors): Fe/Cr matrix, Cr/W carbides (i.e., M23C6), and Ti carbo-nitrides. The PCA maps are depicted in Figure 34.
The density of Cr-rich precipitates in the ODS ferrite (white dots in the M23C6 map) is increasing towards the interface. There are also Ti-rich precipitates in the ODS ferrite (white dots in the Ti (C, N) map), likely at grain boundaries. In addition to PCA, we performed an EBSD analysis of the interface region. This reveals the typical martensitic structure of the EUROFER area on the bottom and the extreme fine rolling texture of the ODS steel on top. Moreover, the coarse-grained WIZ appears now clearly in between and is fully distinguishable from the other phases.
With these observations, we conclude the following formation mechanism of the WIZ. The carbon content of the ferritic 13%-Cr ODS steel is lower by one order of magnitude compared to the 9%-Cr EUROFER97/2 material. During solid-state bonding (but also during the austenitization steps of the heat treatments), the EUROFER alloy is in the austenitic phase (at T = 1100 °C 0.8 Tm), in which C is in solid solution with the Fe/Cr matrix, i.e., the prior M23C6 carbides of the tempered martensite are fully dissolved. The ferritic ODS steel remains in the ferrite phase, which has very low solubility for carbon. Hence, there are two gradients of concentration, one for C from EUROFER (0.1 wt.%) to the ferritic ODS steel (less than 0.016 wt.%), the other for Cr from ODS (13 wt.%) to EUROFER steel (9 wt.%), which build the driving forces for diffusion. An estimation for the according diffusivities and diffusion lengths may be obtained by Equations (1) and (2) with data from [45,46,47].
The results are compiled in Table 7. Summarized, Cr diffusion is high in the ODS steel and low in the EUROFER zone. Therefore, the diffusivity values would predict a chromium-enriched weld zone on the EUROFER side in the order of 5 µm. We have verified this prediction by an EDX scan across the weld interface. As shown in Figure 35, the extent of the Cr concentration gradient amounts to 25–30 µm, which is almost in the same order of magnitude, compared to the prediction. For carbon diffusion the situation is similar, but the values predict diffusion on a length scale of several millimeters, which would not directly lead to the formation of a narrow weld interface zone.
These estimations lead to the assumption that carbon diffusion from EUROFER into the ODS steel comes to a rest after the formation of a depletion zone of about 100 µm. If this would be the case, then the observed WIZ could be explained by the formation of ferrite due to lack of carbon. From experiments on EUROFER-type alloys, it is known that the martensite transformation during air quenching does not occur for carbon contents below about 0.05 wt.%. Consequently, this would be an explanation for the occurrence of the WIZ. In addition, the grain structure in the WIZ of Figure 34 agrees well to the ferrite phase as observed many times in EUROFER steels. An example for the case of decarbonization at the surface of EUROFER samples was already given (see Figure 20). The depth of the ferrite zone is even comparable.
The Ti (C, N) precipitates, which are evenly distributed in the ODS region in Figure 34, most probably form as soon as the carbon atoms move along. In addition, nitrogen may also diffuse into the ODS steel and contribute to the Ti (C, N) phase. The high concentration of M23C6 precipitates, howerever, limited to the ODS region directly in front of the weld interface (see Figure 34), cannot form at temperatures higher than 850 °C, according to the phase diagram (see isopleth at 13 wt.% Cr in the C-Cr-Fe system). Therefore, the carbide formation can only take place during cooling, quenching, or tempering. Then, below 850 °C, the carbon solubility in the ferrite phase drops, which leads to the precipitation. The solely occurrence of M23C6 in the ODS region (the WIZ is free of carbides) can be explained by the higher Cr content of 13.5% compared to 9% in the WIZ, in which the M23C6 formation would start only at temperatures below 800 °C.
Finally, as outlined in Section 5.1, we implemented two features in the mock-up as a robustness test: (1) crack initiators in the upper corners of cooling channel A, and (2) chatter marks in the surface of the ODS steel plate. After thorough inspection of all cross-sections, sample parts, and specimens, there was no indication of defects, such as pores, cracks, delamination, Kirkendall voids, or other faults (see also Figure 33, the images of other examination areas look similar).

10. Summary and Conclusions

10.1. Fusion Welds

Charpy tests on beam welded specimens (especially EB welds) have shown surprisingly good results, even without post-weld heat treatment. Just by tempering at 700 °C for 2 h, the Ductile-to-Brittle-Transition-Temperatures (DBTT) of Laser and EB welds were almost as good as those of the EUROFER97 base material with a shift of only 10–30 K. Difficulties of these weld processes are connected to the selection of the beam characteristic to adjust penetration depth and shape of the fusion zone, the formation of pores, and the surface preparation. The ductility of the 12 mm TIG weld was acceptable after a one-step PWHT of 740 °C for 2 h. The 5- and 10-mm TIG welds required a two-step PWHT. Also, the results might be interpreted to that effect that thinner plates are better suited for beam welding compared to thicker ones, while for TIG welds it seems to be the other way around. However, the most important result of these investigations is that EUROFER may be welded by TIG, EB or Laser techniques with the necessity of just a one-step post-welding heat treatment that may be performed below 750 °C, i.e., without preceding austenitization. However, beam welding should be preferred when PWHT is restricted to one-step tempering. Besides the encouraging Charpy test results of the welded plates we have also to mention the downsides: They lose creep-strength of about 40 MPa at 600 °C, but since the maximum operation temperature for EUROFER is 550 °C, the reduction in creep strength, which is about 20 MPa at 550 °C, might still be tolerable. Investigations have shown that this loss in creep strength results from fine grain formation in the vicinity of the HAZs. (Note: These creep studies are published in [38]).
Finally, we present a list of conclusions and recommendations for further investigations on EUROFER welds:
  • Beam welds need fine adjustment to the specific geometry, especially power and feeding speed have to be adjusted for a correct penetration depth.
  • Misalignment after TIG welding is larger for thinner plates and has to be determined for a correct compensation (strongly depending on geometry).
  • All observed weld defects did not lead to fracture initiation.
  • Chemical composition of EUROFER filler wire is stable (no decarbonization).
  • Negligible traces of delta-ferrite have been detected in 5 mm TIG welds.
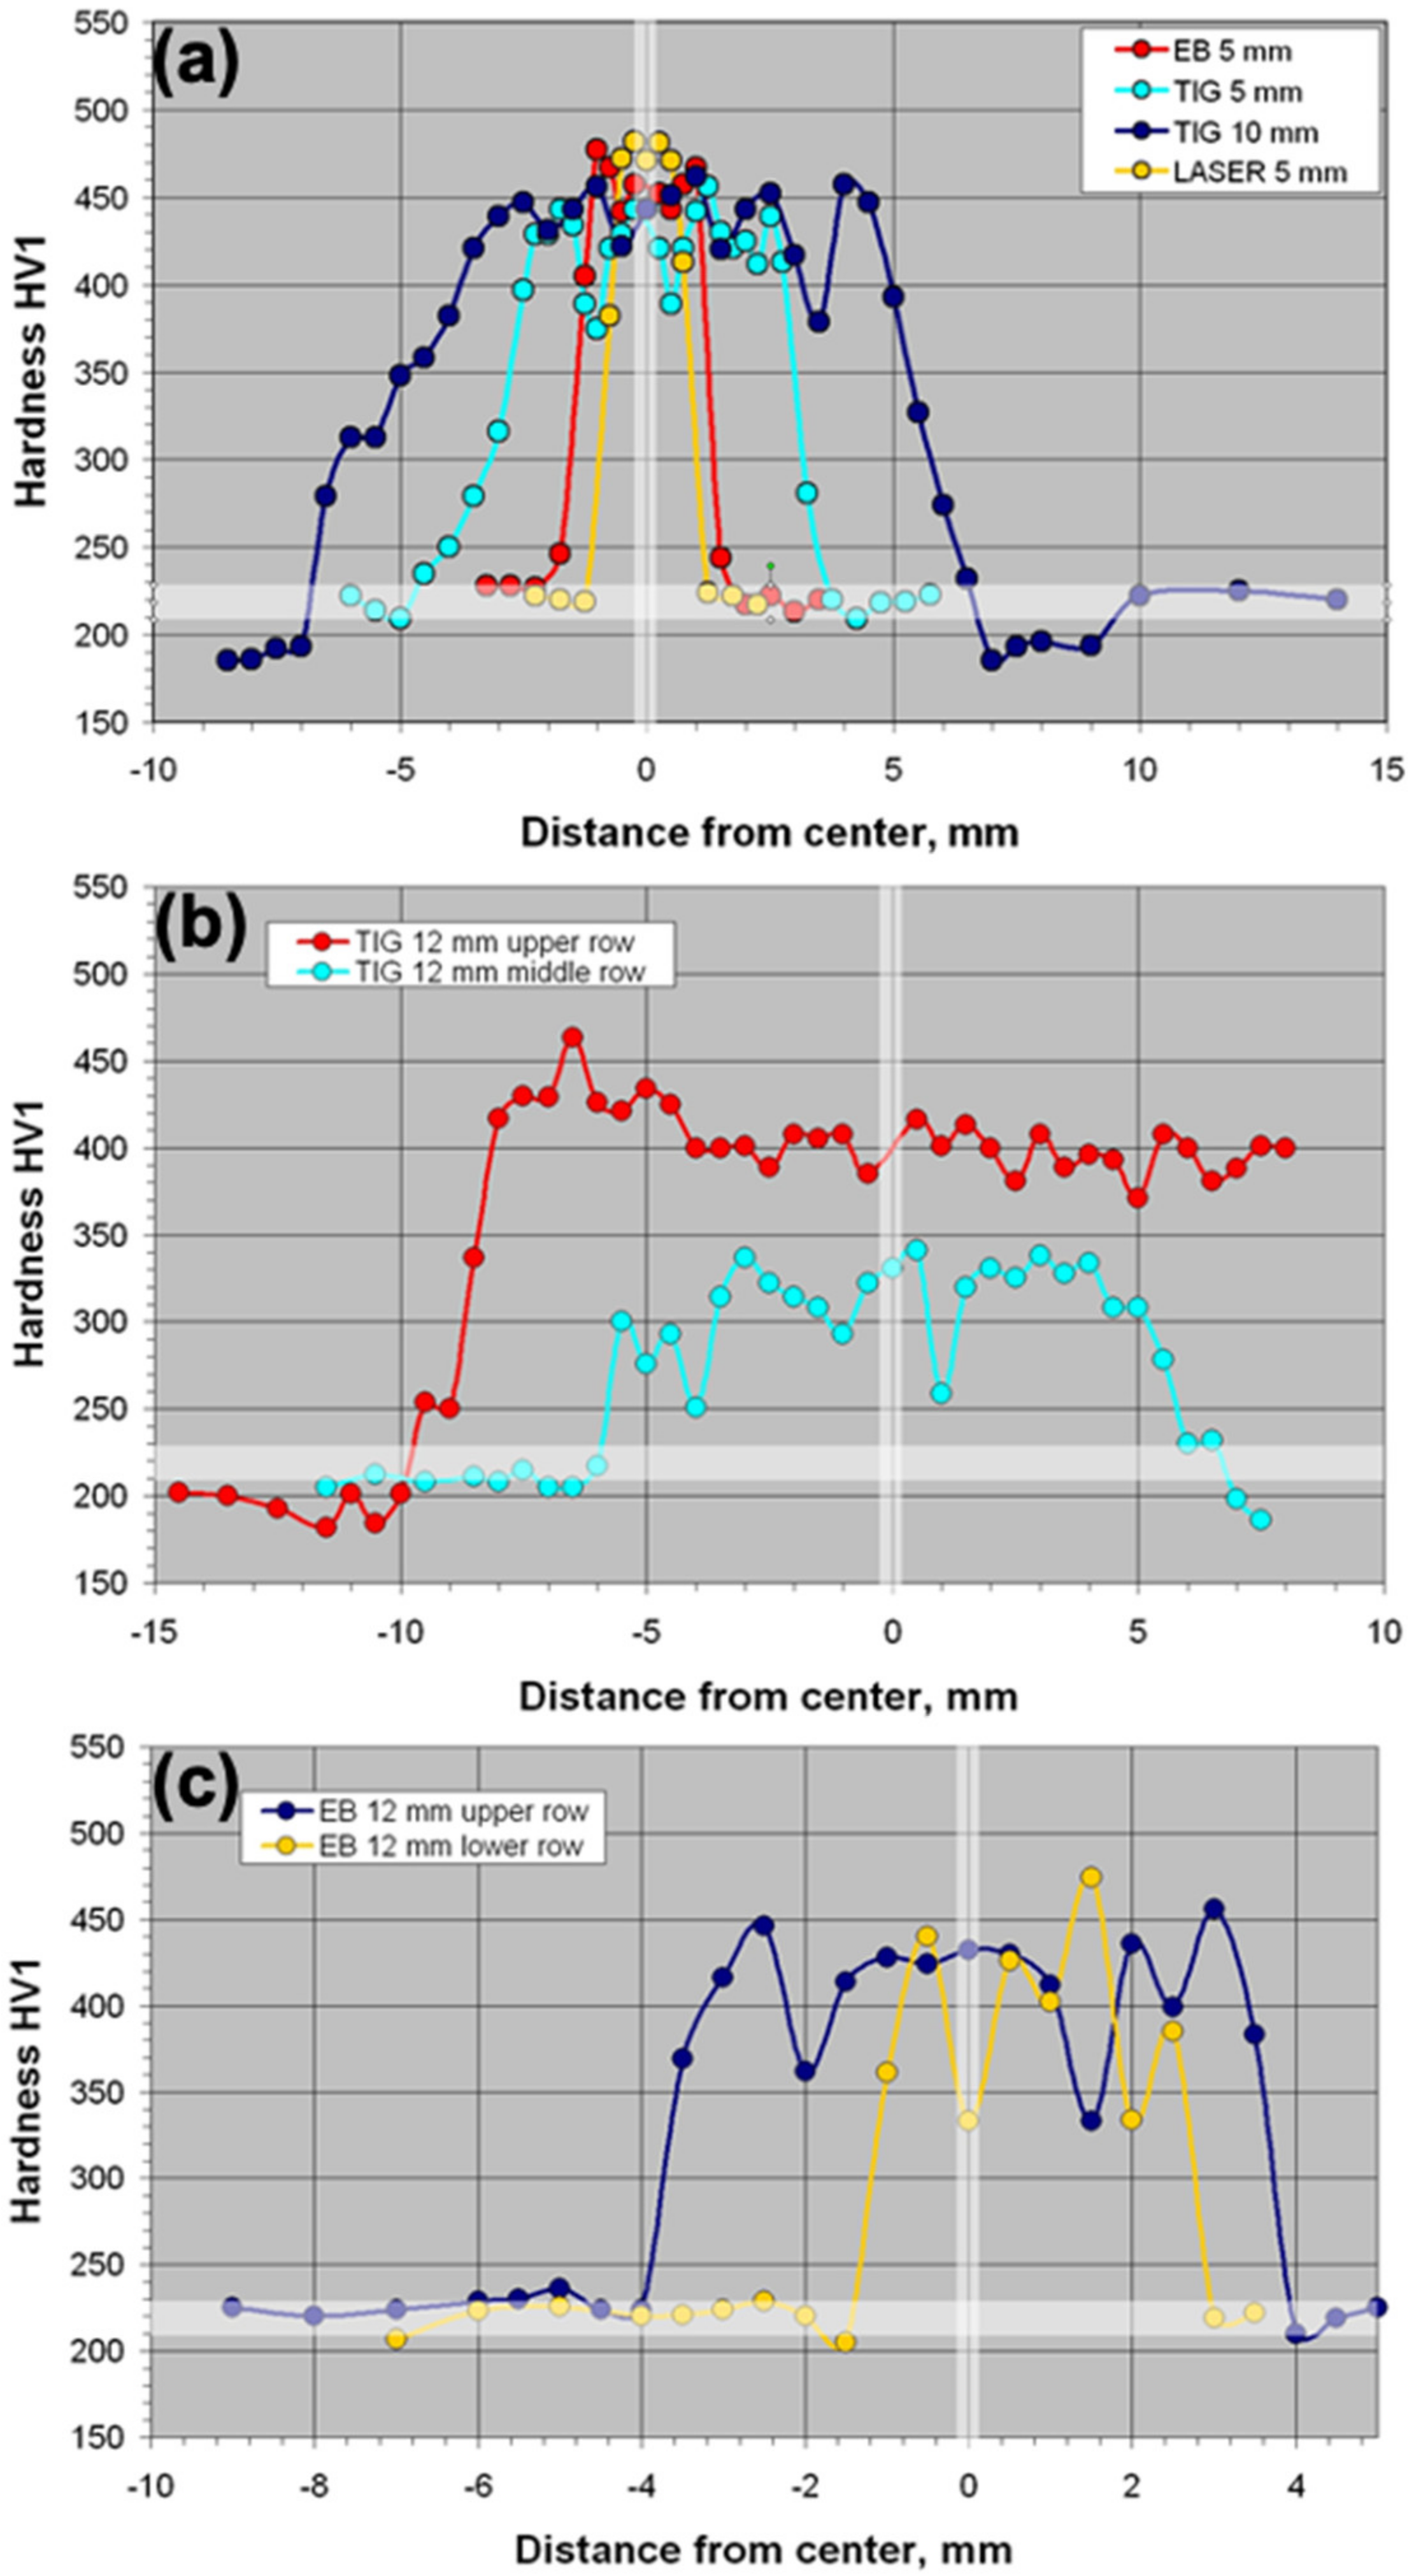
  • Extended softened zones form in TIG welds.
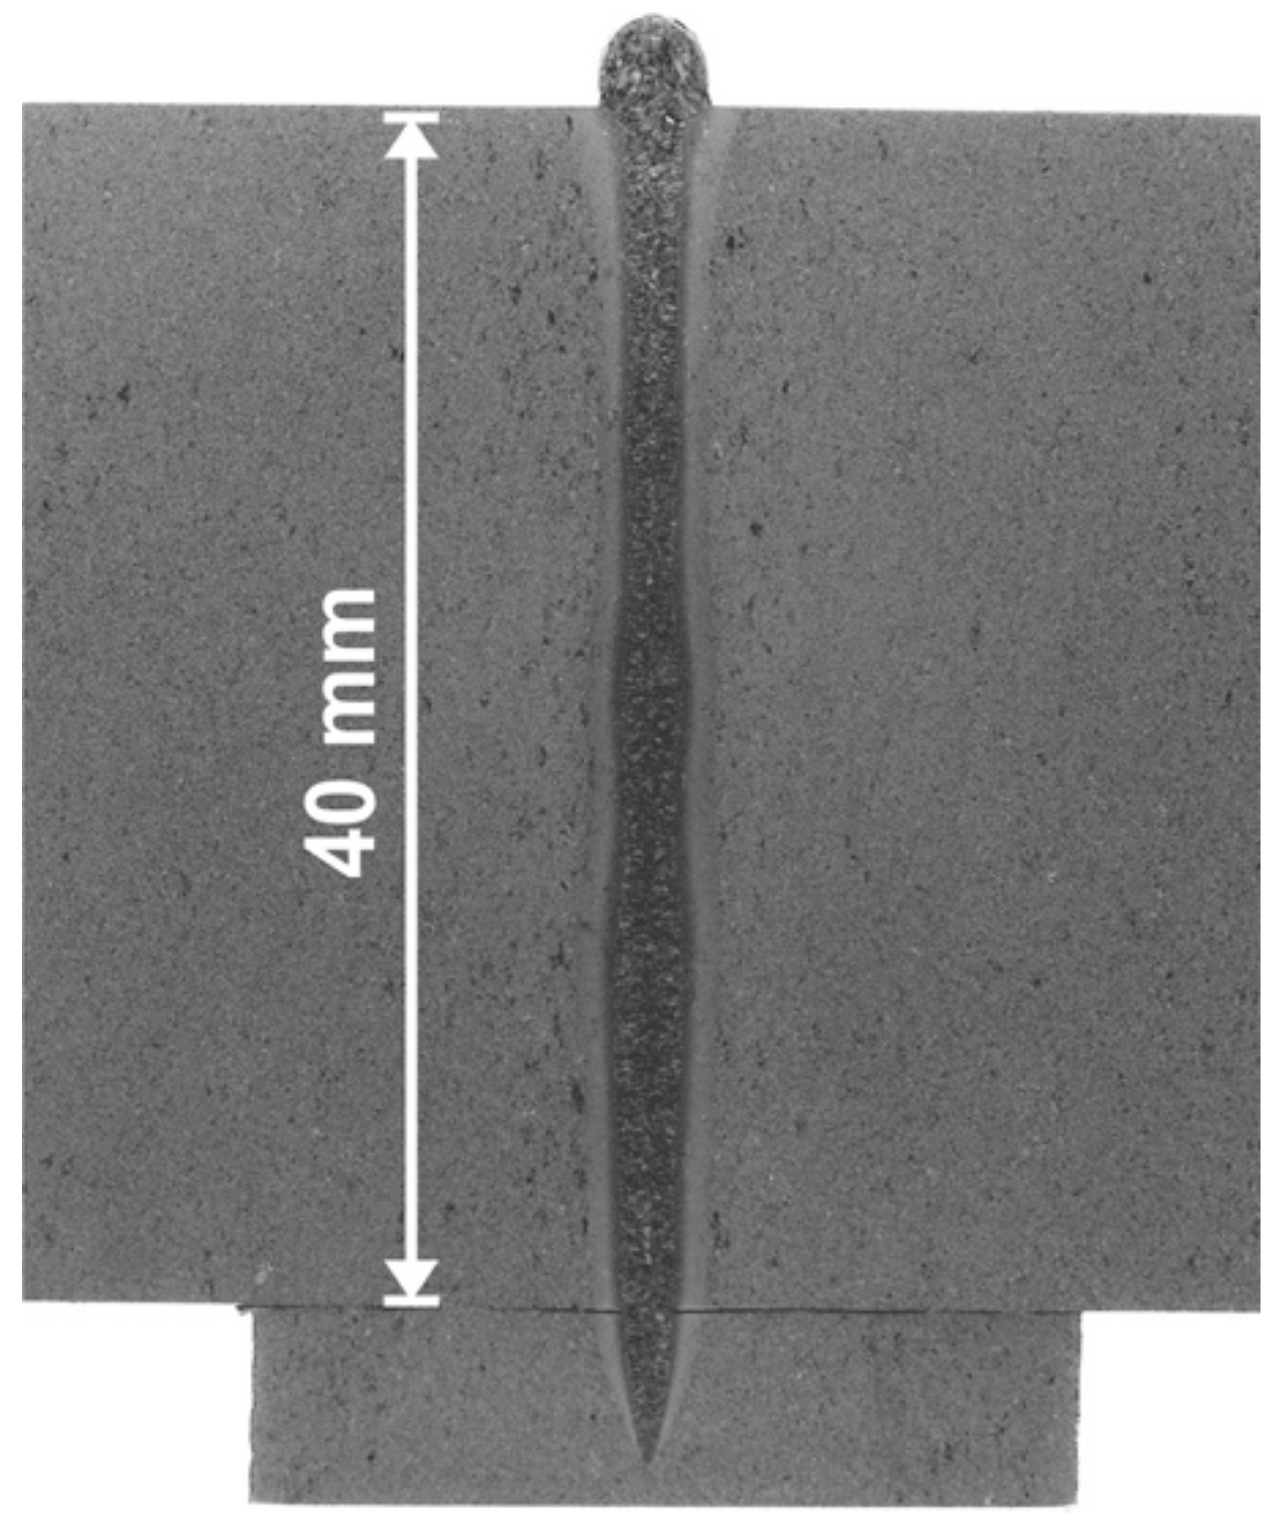
  • Coarse grain formation occurs in TIG welds and in thick beam welds.
  • Microstructure can only be restored by austenitization, i.e., annealing at temperatures above 900 °C.
  • Only 5 mm EB welds might be acceptable regarding ductility without PWHT.
  • Ductility of beam welds might be acceptable with just an one-step PWHT of T > 700 °C for 2 h (without austenitization).
  • TIG welds seem to require austenitization (due to coarse grain as well as softening in the HAZ) or at least higher tempering temperatures (T > 740 °C).
  • One-step PWHTs at temperatures less than 700 °C are not expedient.
  • Tensile properties (transverse tests) are nearly independent of the weld type since fracture occurs in the base material.
  • Future tensile studies should be performed just on untreated welds (in addition to creep and Charpy tests), since the results are not very informative.

10.2. Machining and Solid-State Bonding

The aim of our studies was to determine elementary diffusion bond parameters for EUROFER97 steel with respect to industrial production processes, which may be applied to future breeding blanket and/or TBM fabrication. The effects that have been studied are surface fabrication and surface contamination combined with cleaning. Moreover, possible fault-tolerant diffusion bonding processes were elaborated.
From the presented results the following conclusion may be drawn:
  • An appropriate choice of parameters allows very robust solid-state bonding processes. Only low pressure, low temperature bonding (e.g., p = 20–50 MPa and T < 1050 °C) makes the process sensitive to surface quality.
  • Whether or not a surface is suited for diffusion bonding cannot be determined by surface roughness measurement. It is better for surfaces to be additionally inspected and visually qualified.
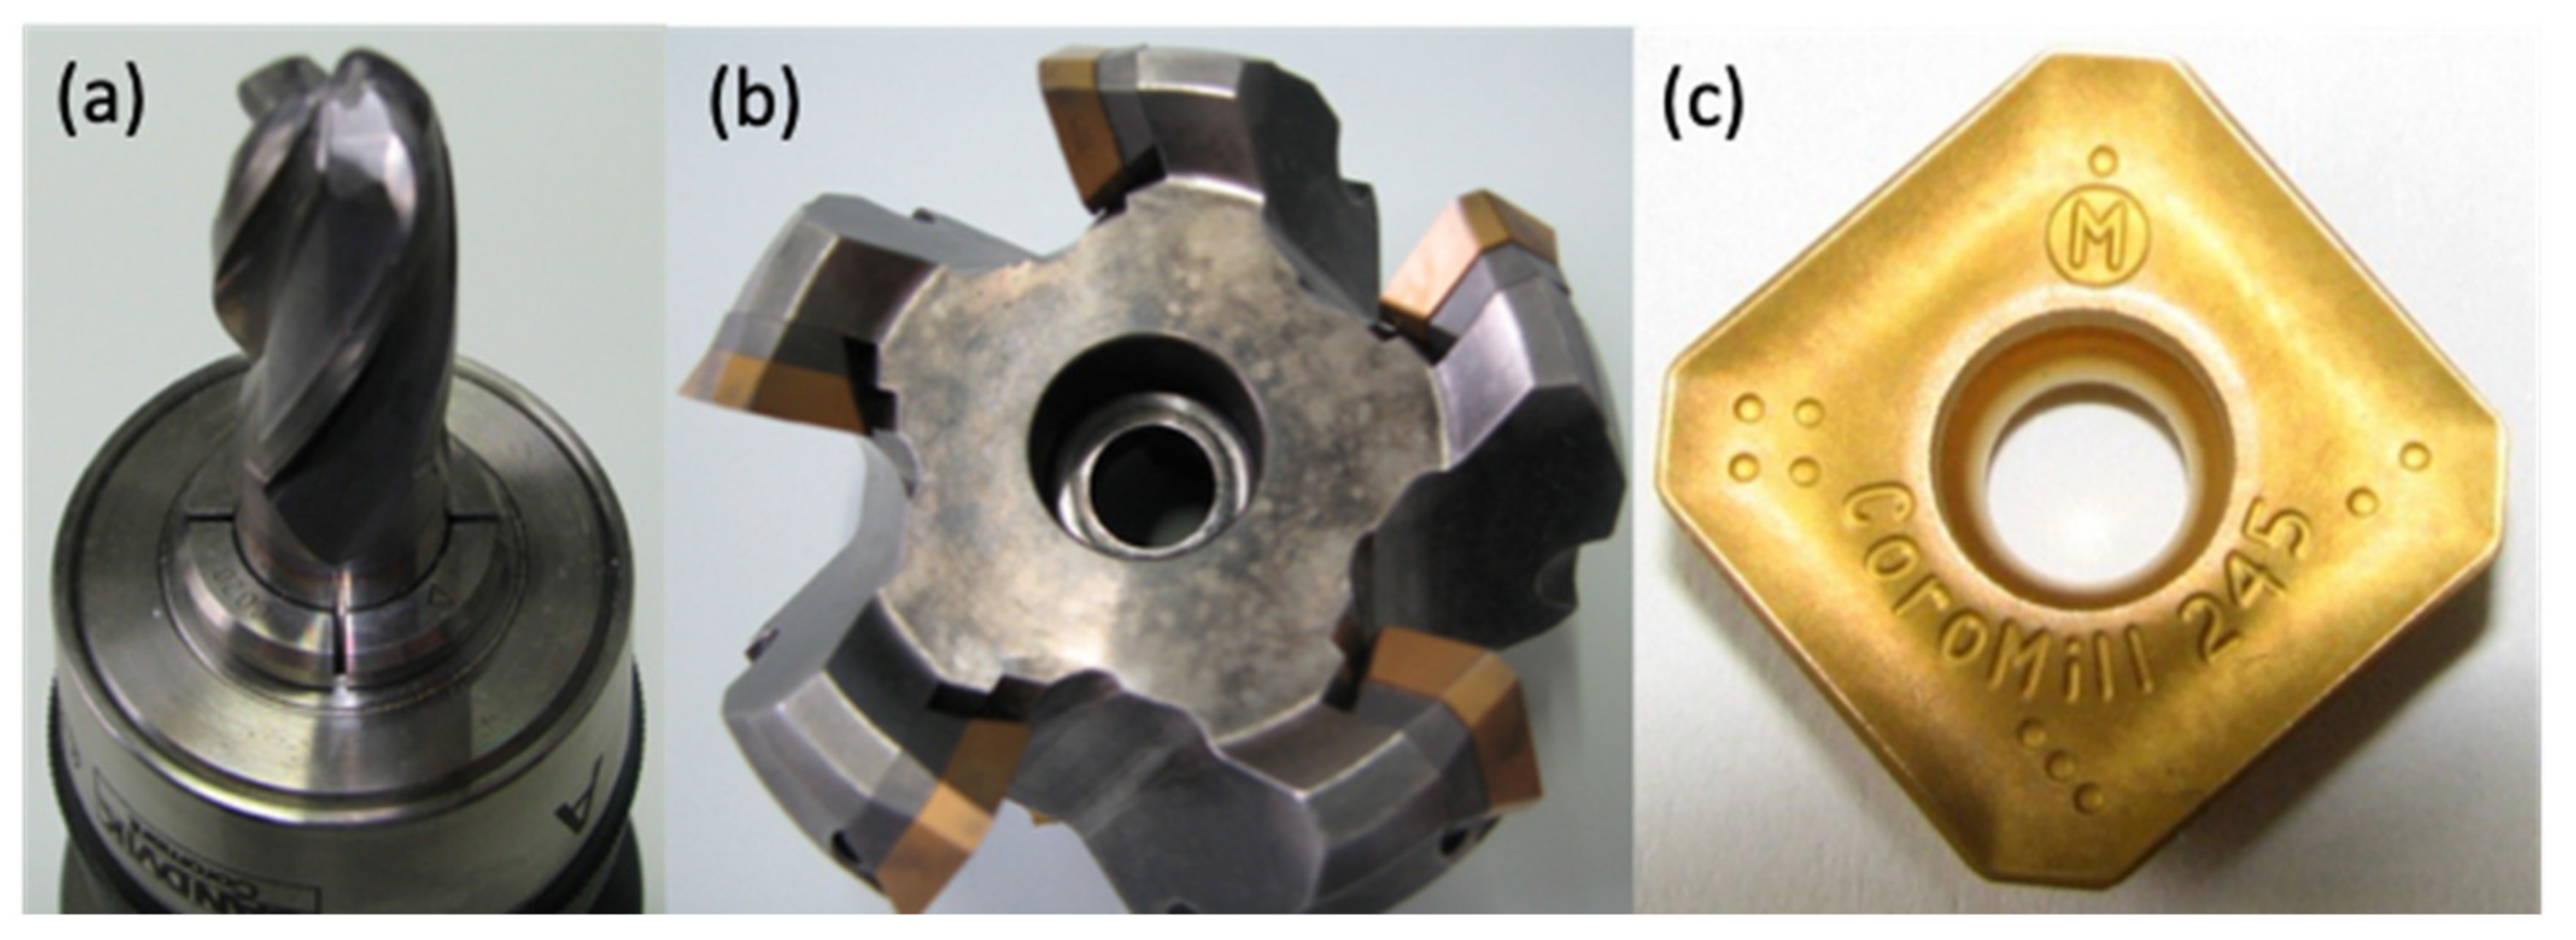
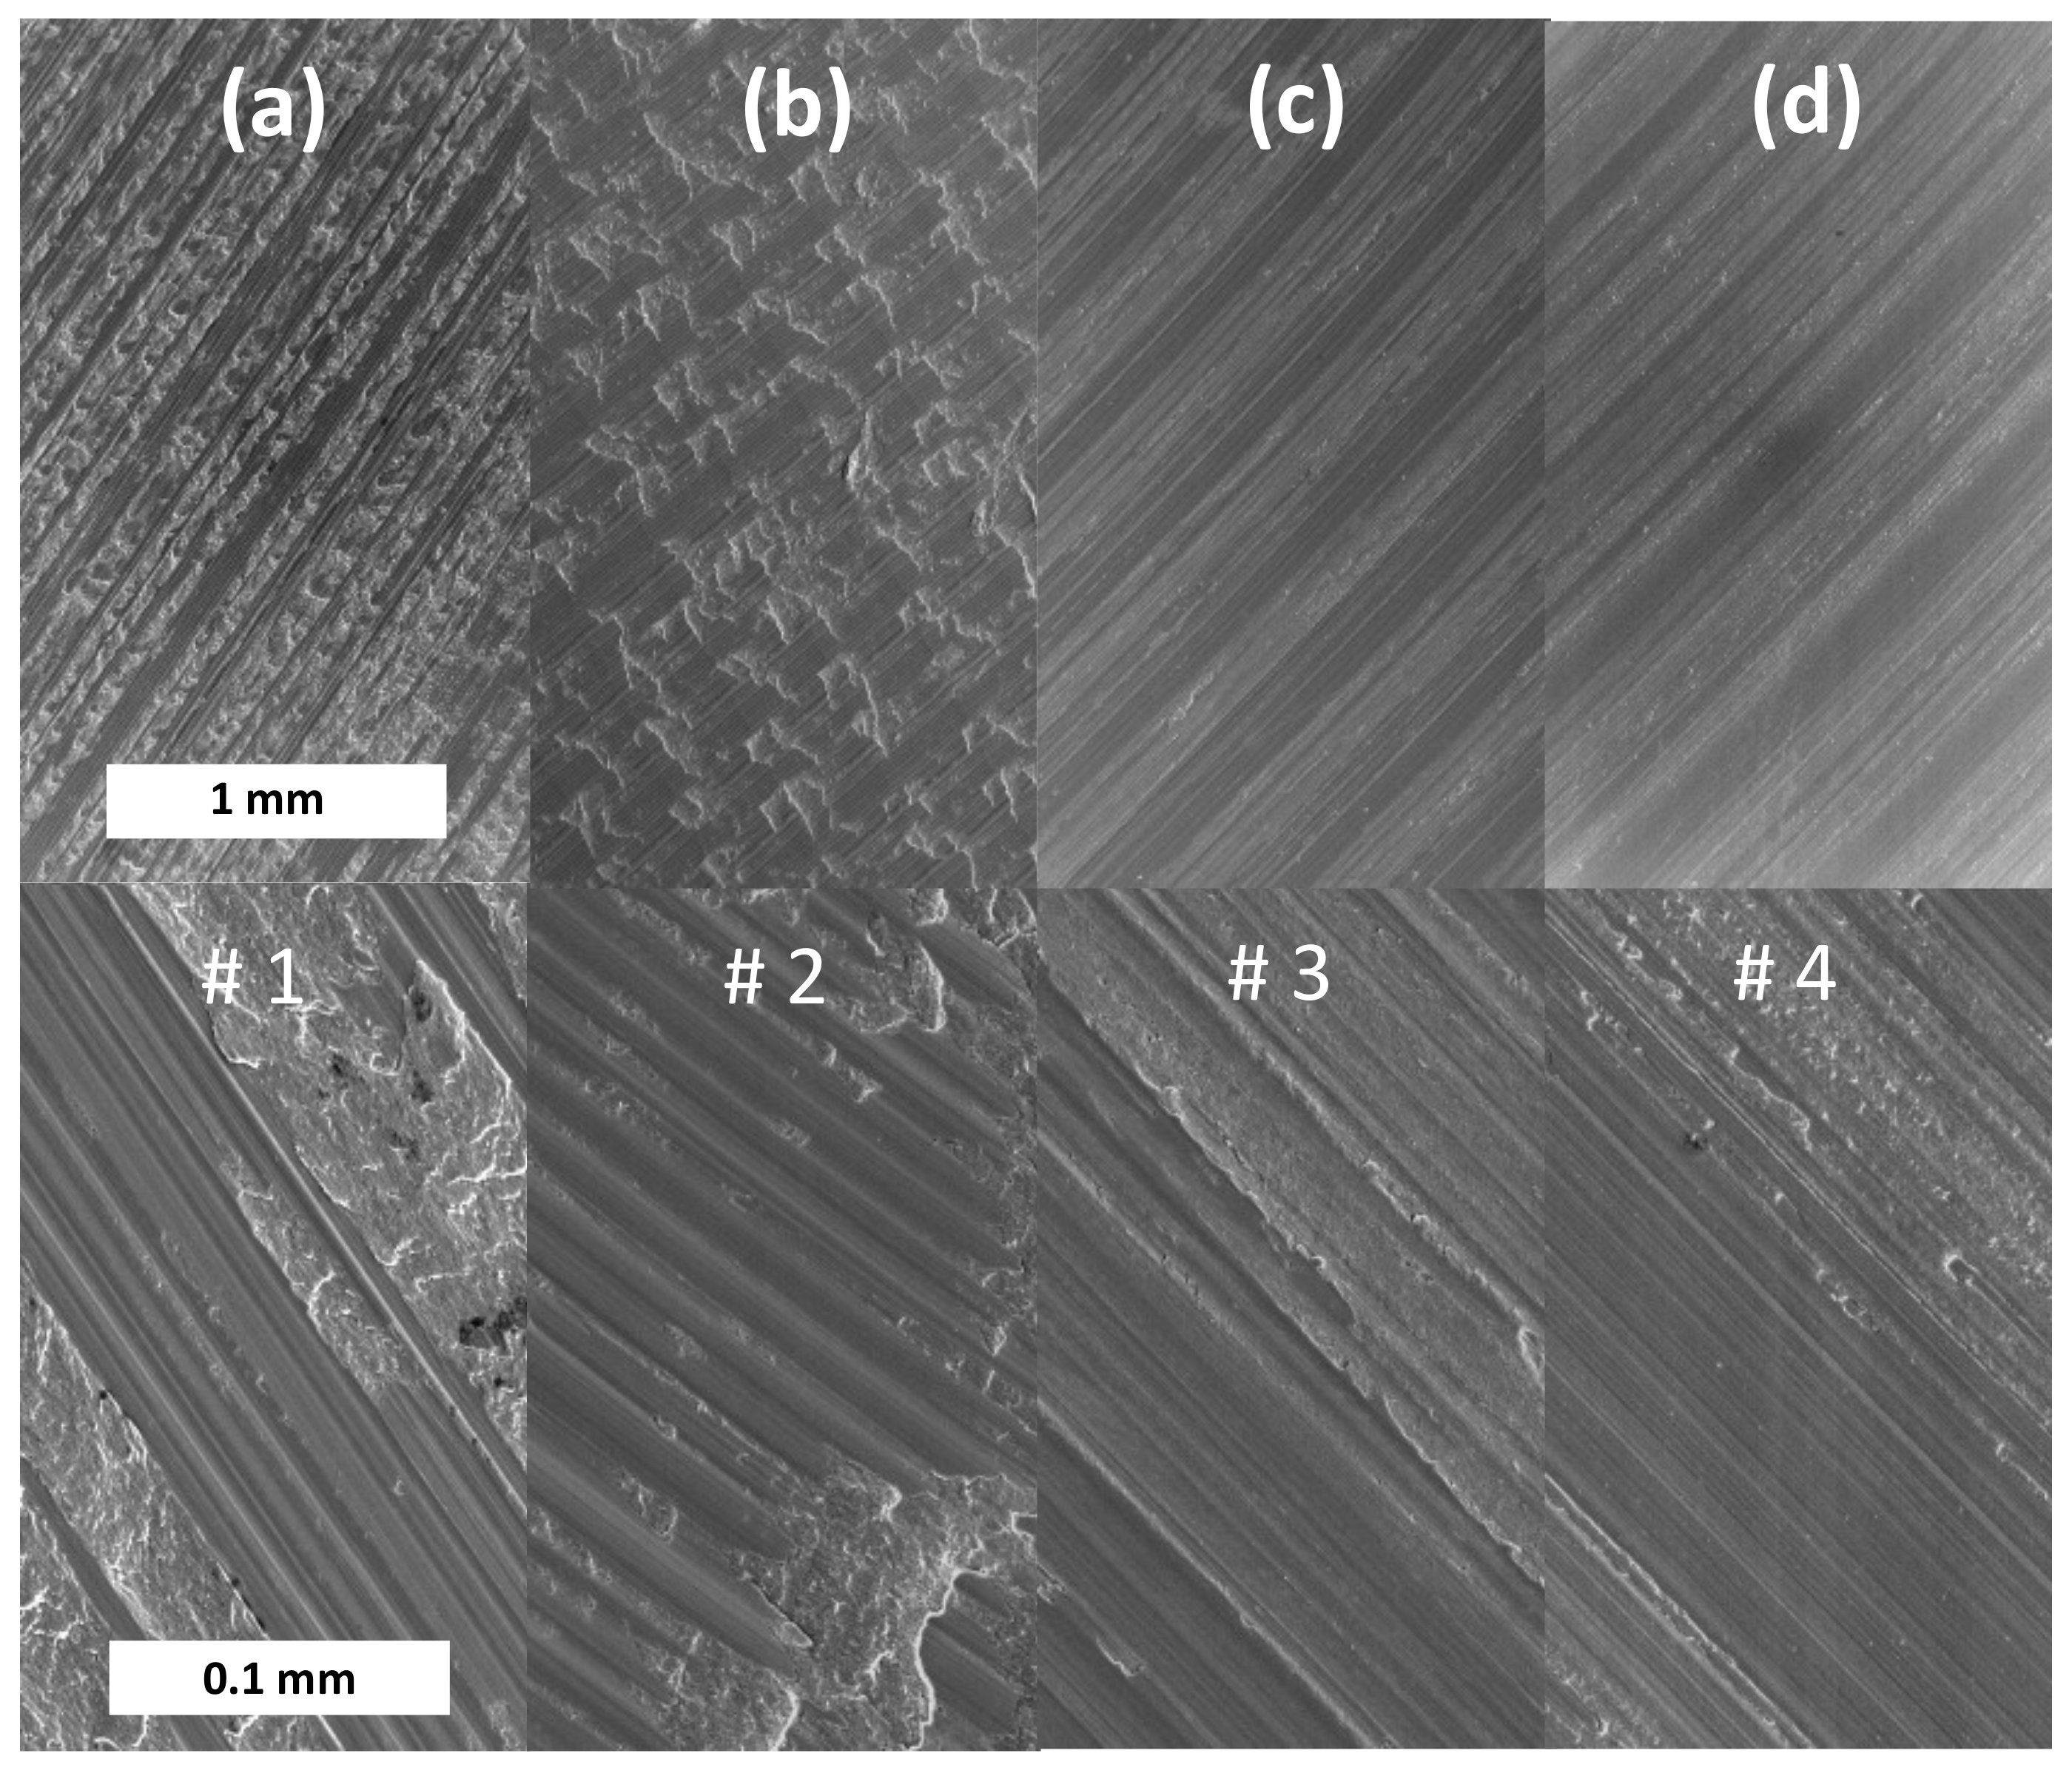
  • In principle, all common milling cutters can be used for surface fabrication. Special attention, however, has to be paid to chipping. If the chips break off inappropriately, the surface may be littered with pits, which could still remain after the welding procedure. Such cavities deteriorate the weld properties (upper shelf energy and DBTT).
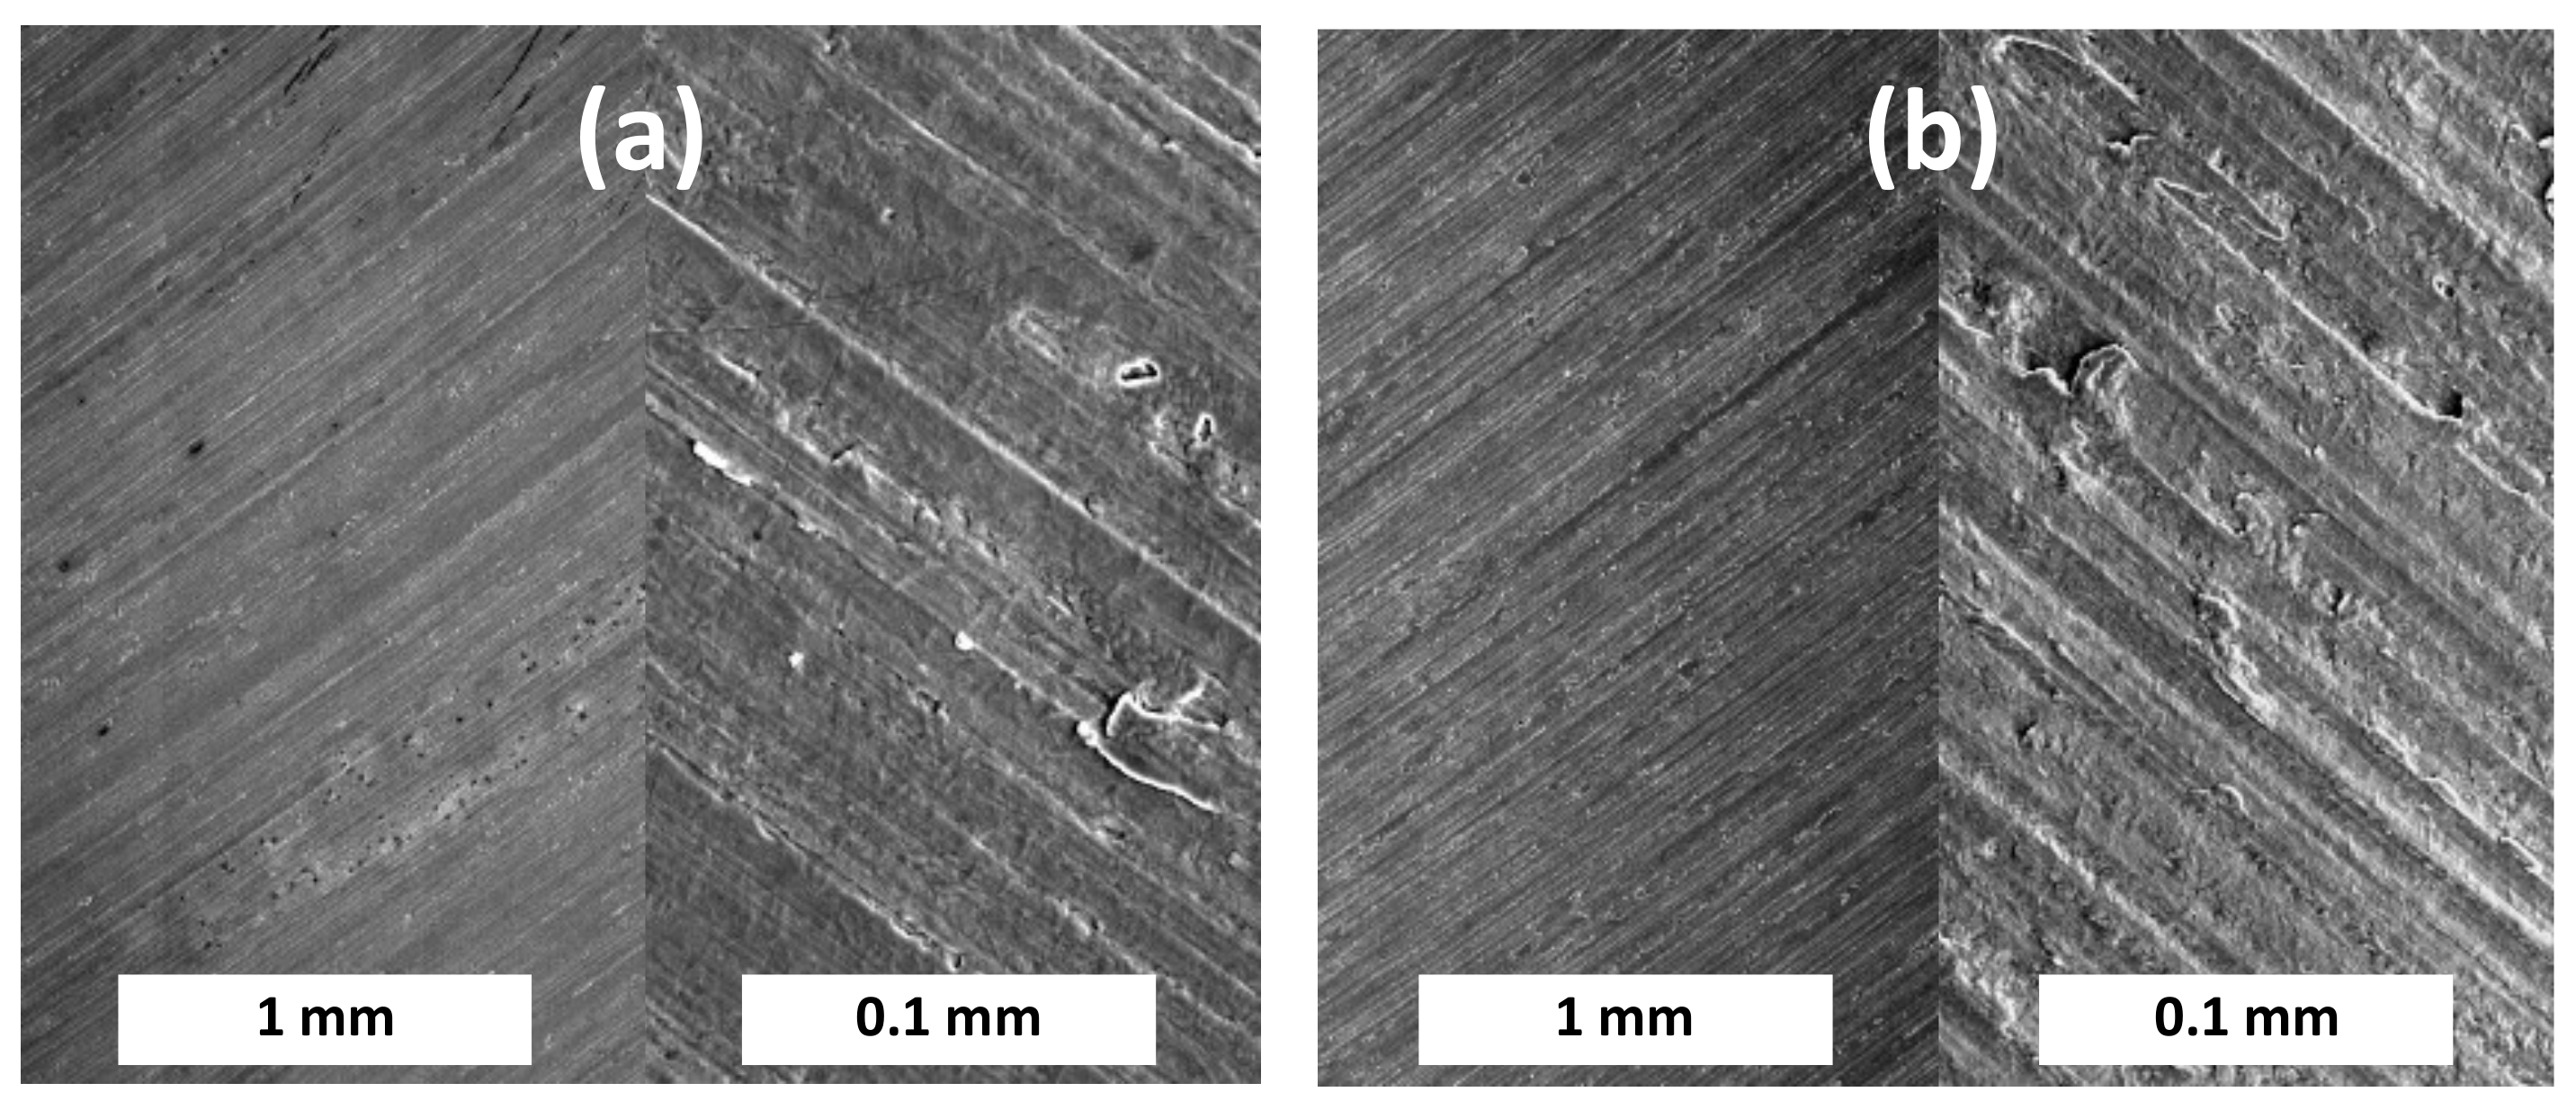
  • Unfavourable chipping and, therefore, surface quality can be mitigated by increasing the hardness with a pre-fabrication heat treatment.
  • Tensile tests are unsuitable for qualifying diffusion bonds. Charpy tests are much more sensitive to weld faults.
  • Weld defects are clearly mirrored in the fracture surface of Charpy specimens.
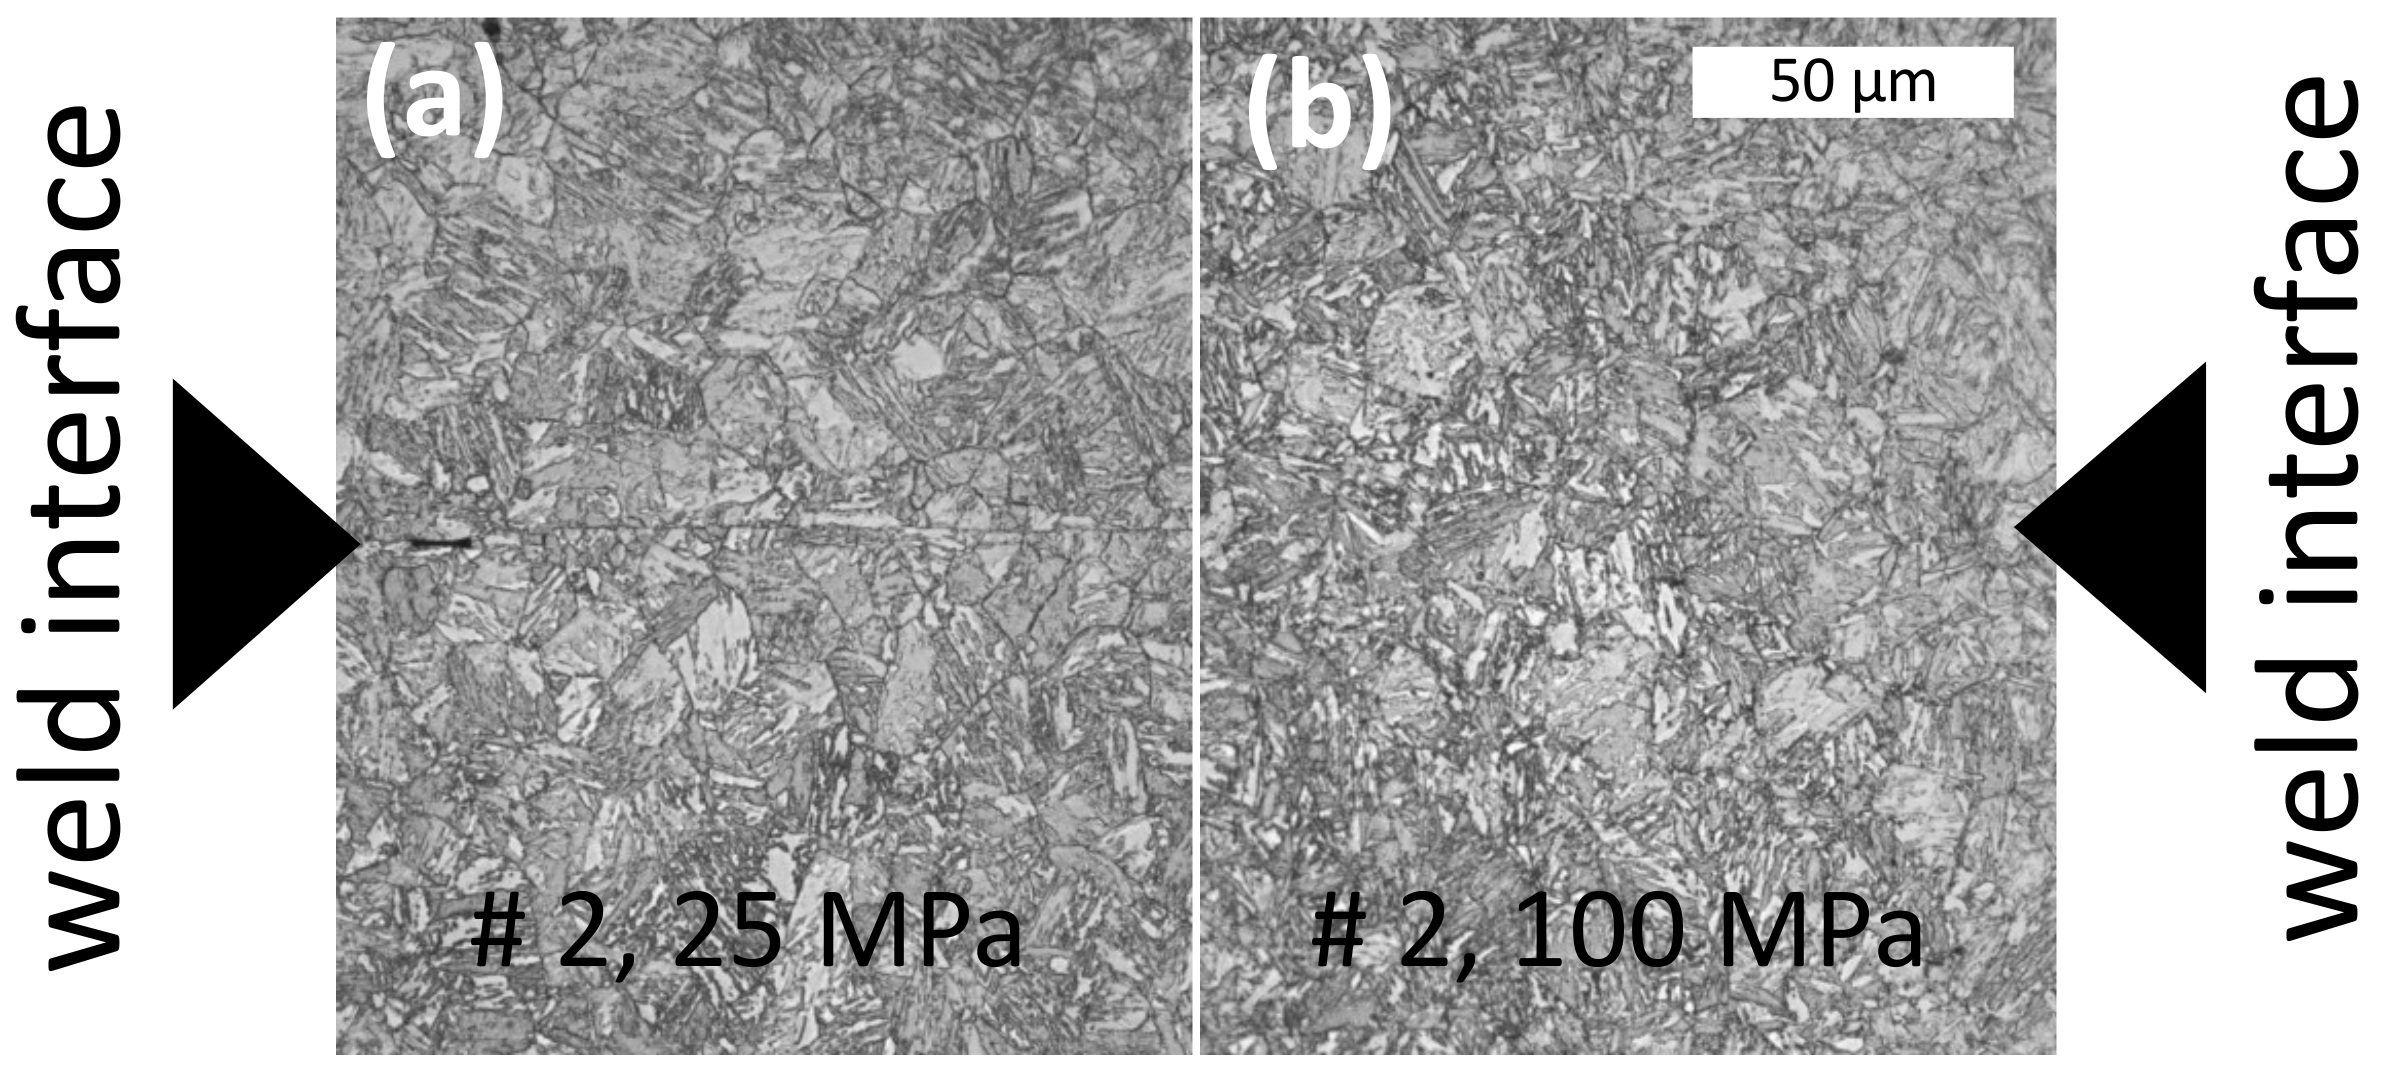
  • Remaining cavities (as a result of low-quality surfaces, for example) can be removed by a second high-pressure HIP step. Weld defects in the order of about 20 µm in diameter vanish after a HIP cycle of 100 MPa/1050 °C/2 h.
  • After surface fabrication, diffusion bonding should be performed within 24 h. Thereafter, formation of oxide layers leads to a significant reduction of the weld properties.
  • Further reduction of the weld properties does not take place if surfaces are already passivated (this is the case after about 48 h in air with 70% relative humidity).
  • Oxidation may be reduced, but not suppressed completely, by spraying the surfaces with oil.
  • Surface cleaning with alcohol (isopropanol) leads to better welds compared to cleaning with water and soap.
  • The use of coolant during surface machining is acceptable, but the surfaces have to be cleaned immediately after fabrication with isopropanol. Without cleaning (that is just drying) the diffusion bond properties are reduced clearly.
  • Increasing the HIP temperature to 1150 °C for diffusion bonding, reduces the negative effect of oxidation and cleaning to an acceptable amount.

10.3. Mock-Up Design and Fabrication, High Heat Flux Test, and Defect Analysis

The presented First Wall design strategy consists of plating the plasma-facing surface of the blankets with thin ODS steel plates. Nevertheless, a more effective strategy, but harder to realize, would be the replacement of EUROFER by ODS steel within a layer of about 300 mm, or even completely.
Referring to the outline of the current project as presented in the introduction section, we want to highlight the following assessments and outcomes:
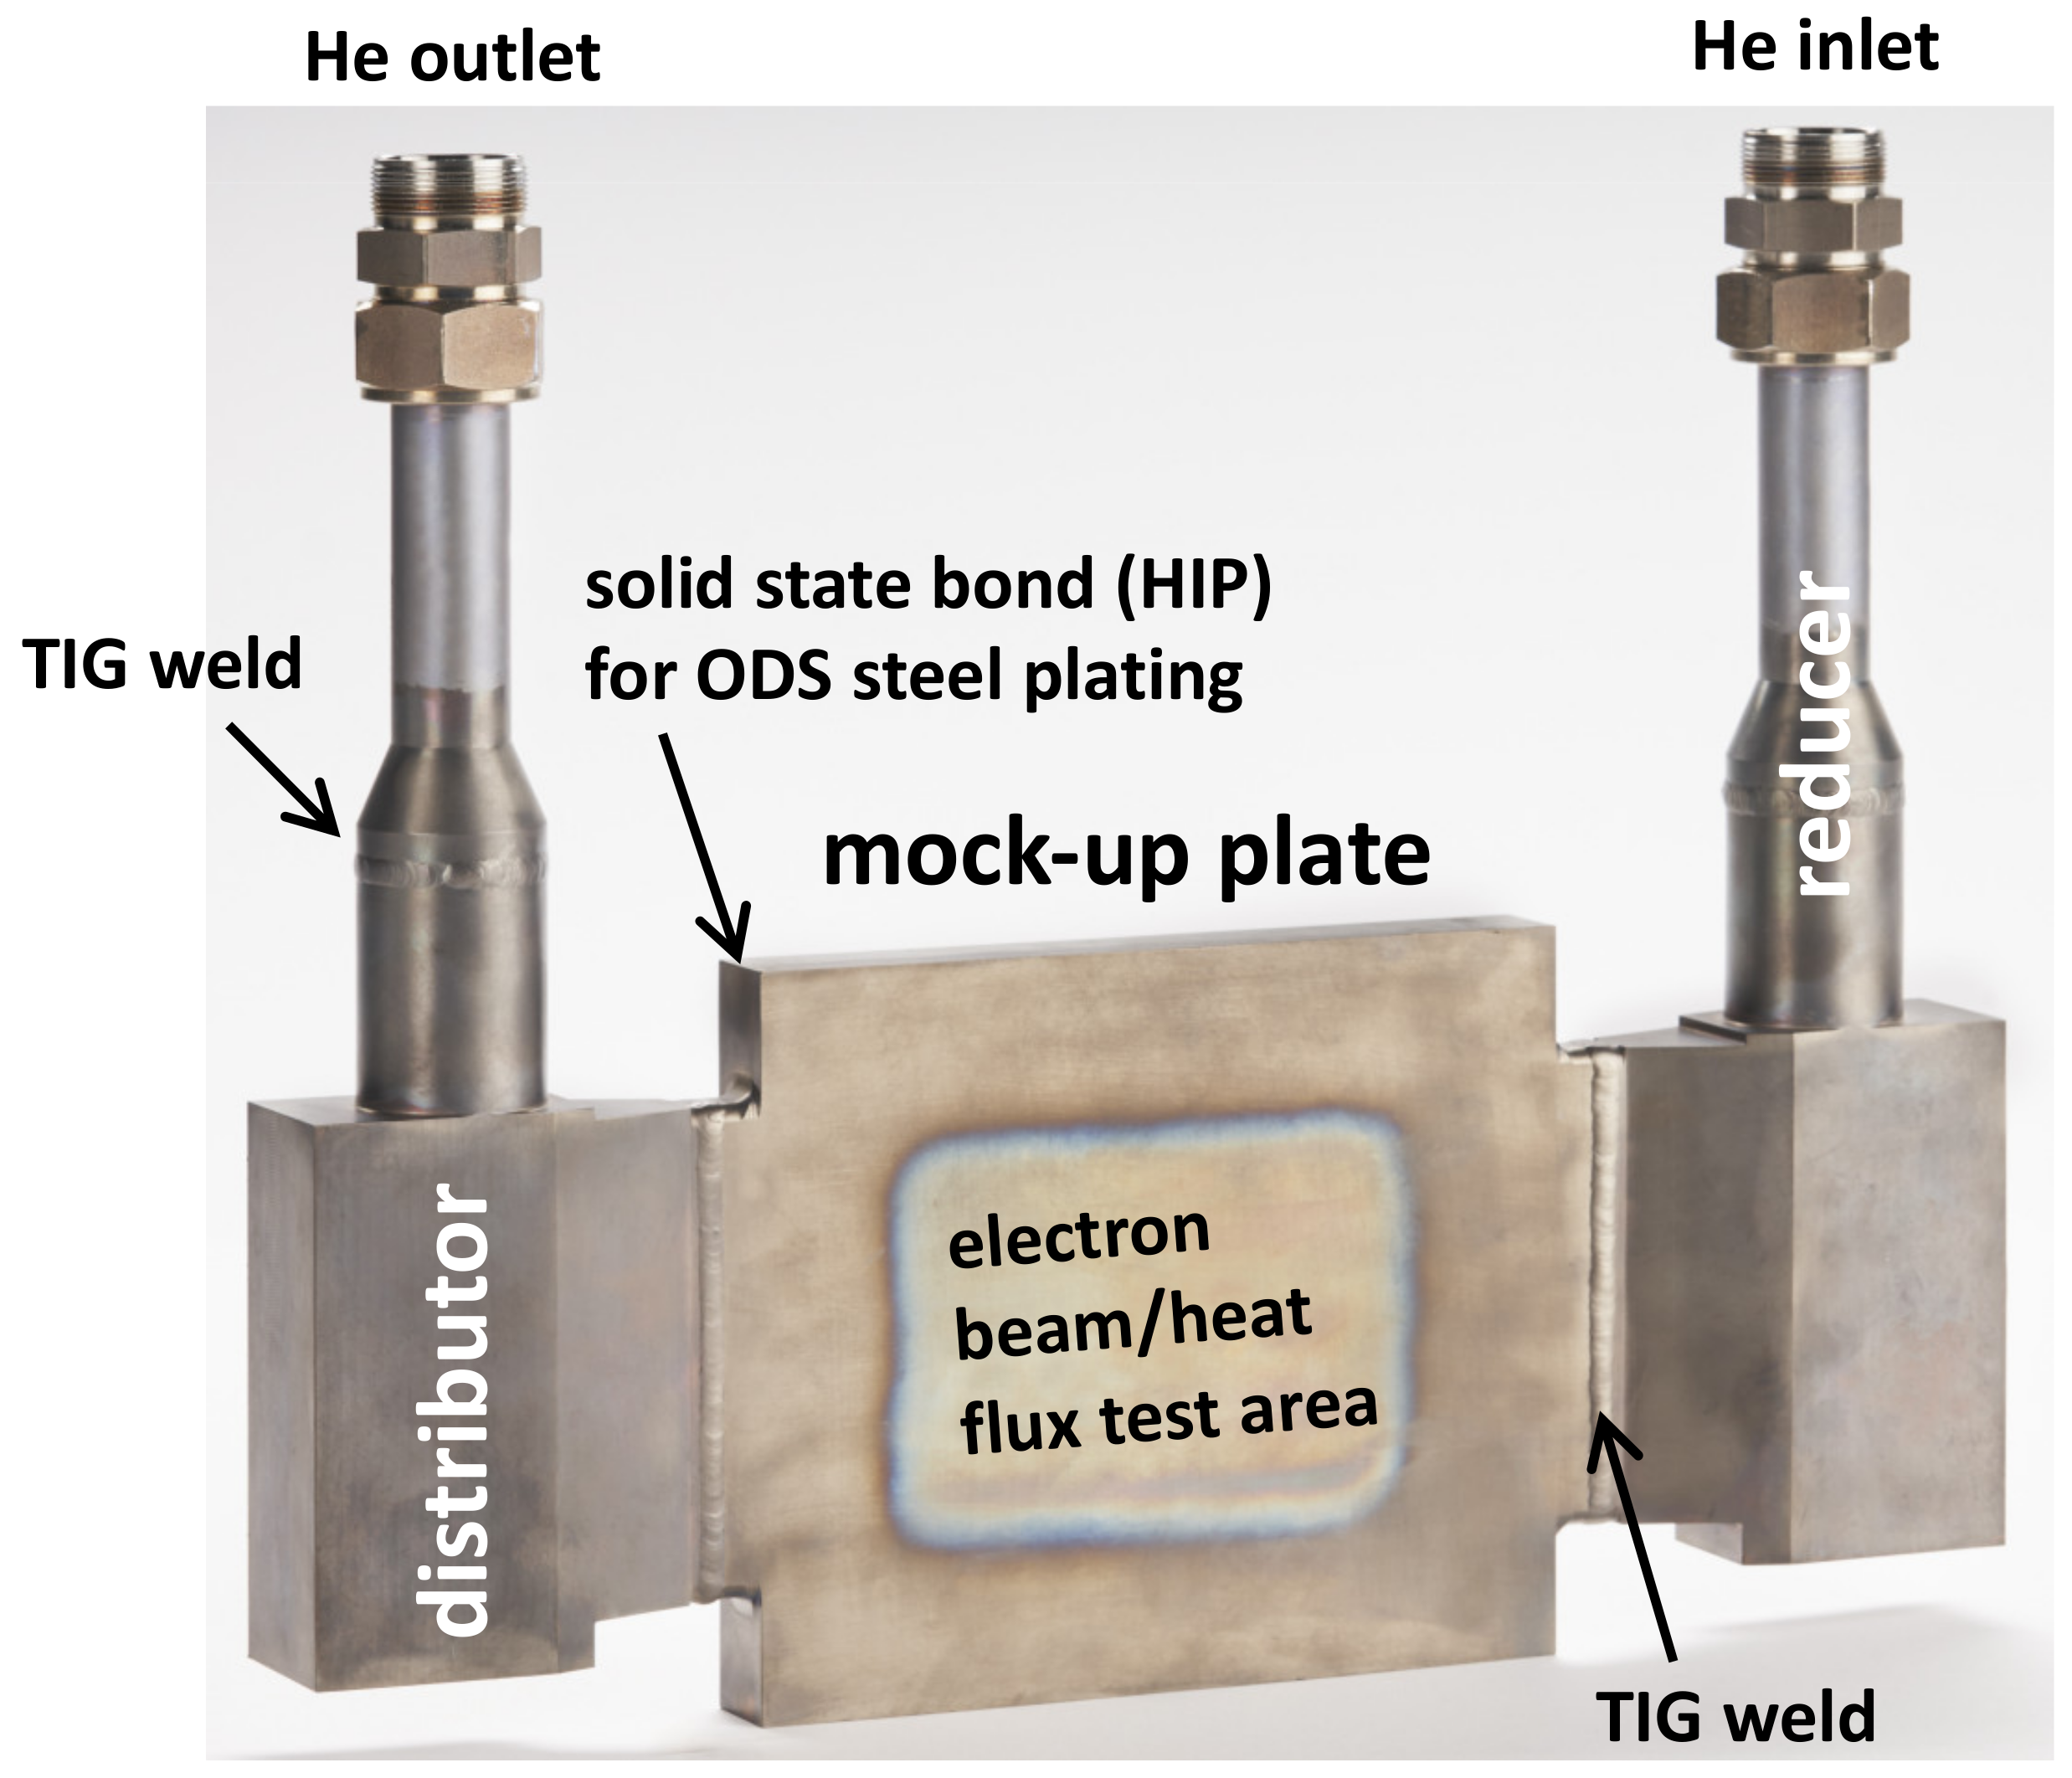
  • We demonstrated the availability, maturity, and robustness of industrial fabrication, machining, and production processes, which are required for ODS steel plating of flat blanket first walls.
  • By such plating, the surface operating temperature of a helium-cooled first wall mock-up could be increased to 650 °C for 100 heat flux pulses of 2 min and for additional 7 cycles of 2 h each.
  • The mock-up removed a heat flux of 0.9 MW/m2 by helium cooling without swirls, flow enhancers or other measures for an increased heat transfer.
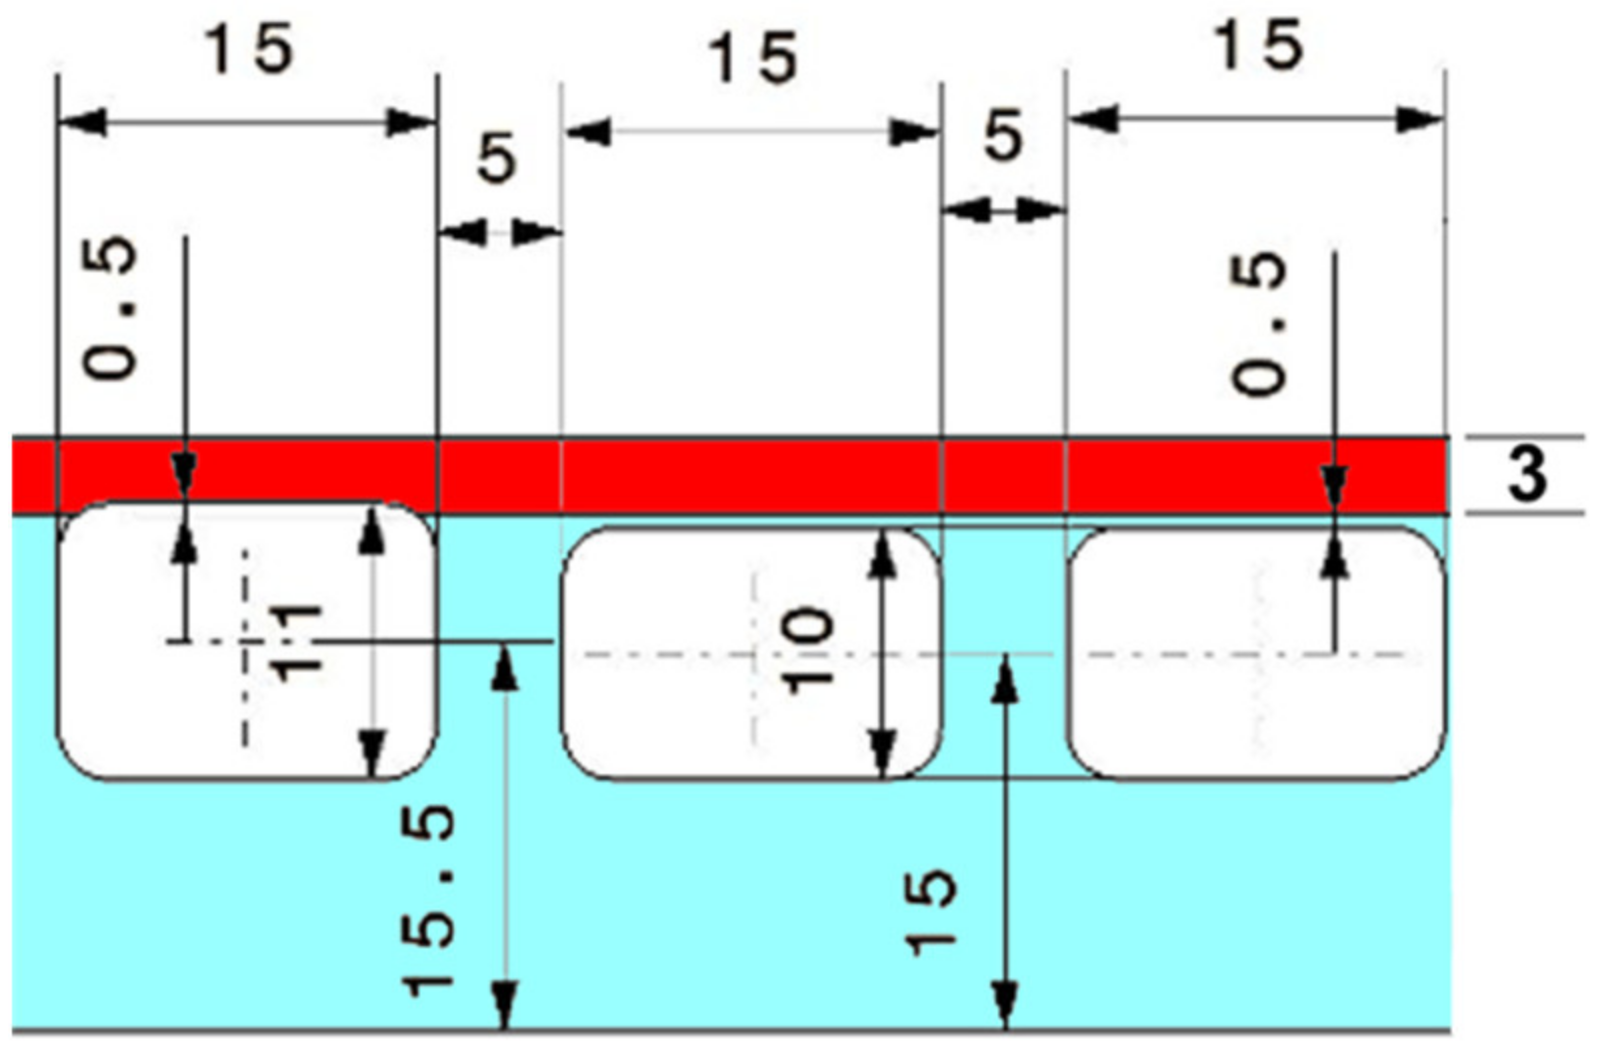
  • The mock-up did not develop cracks or other tendencies to fail. Even at intentionally introduced weak points (crack initiators), crack formation did not occur.
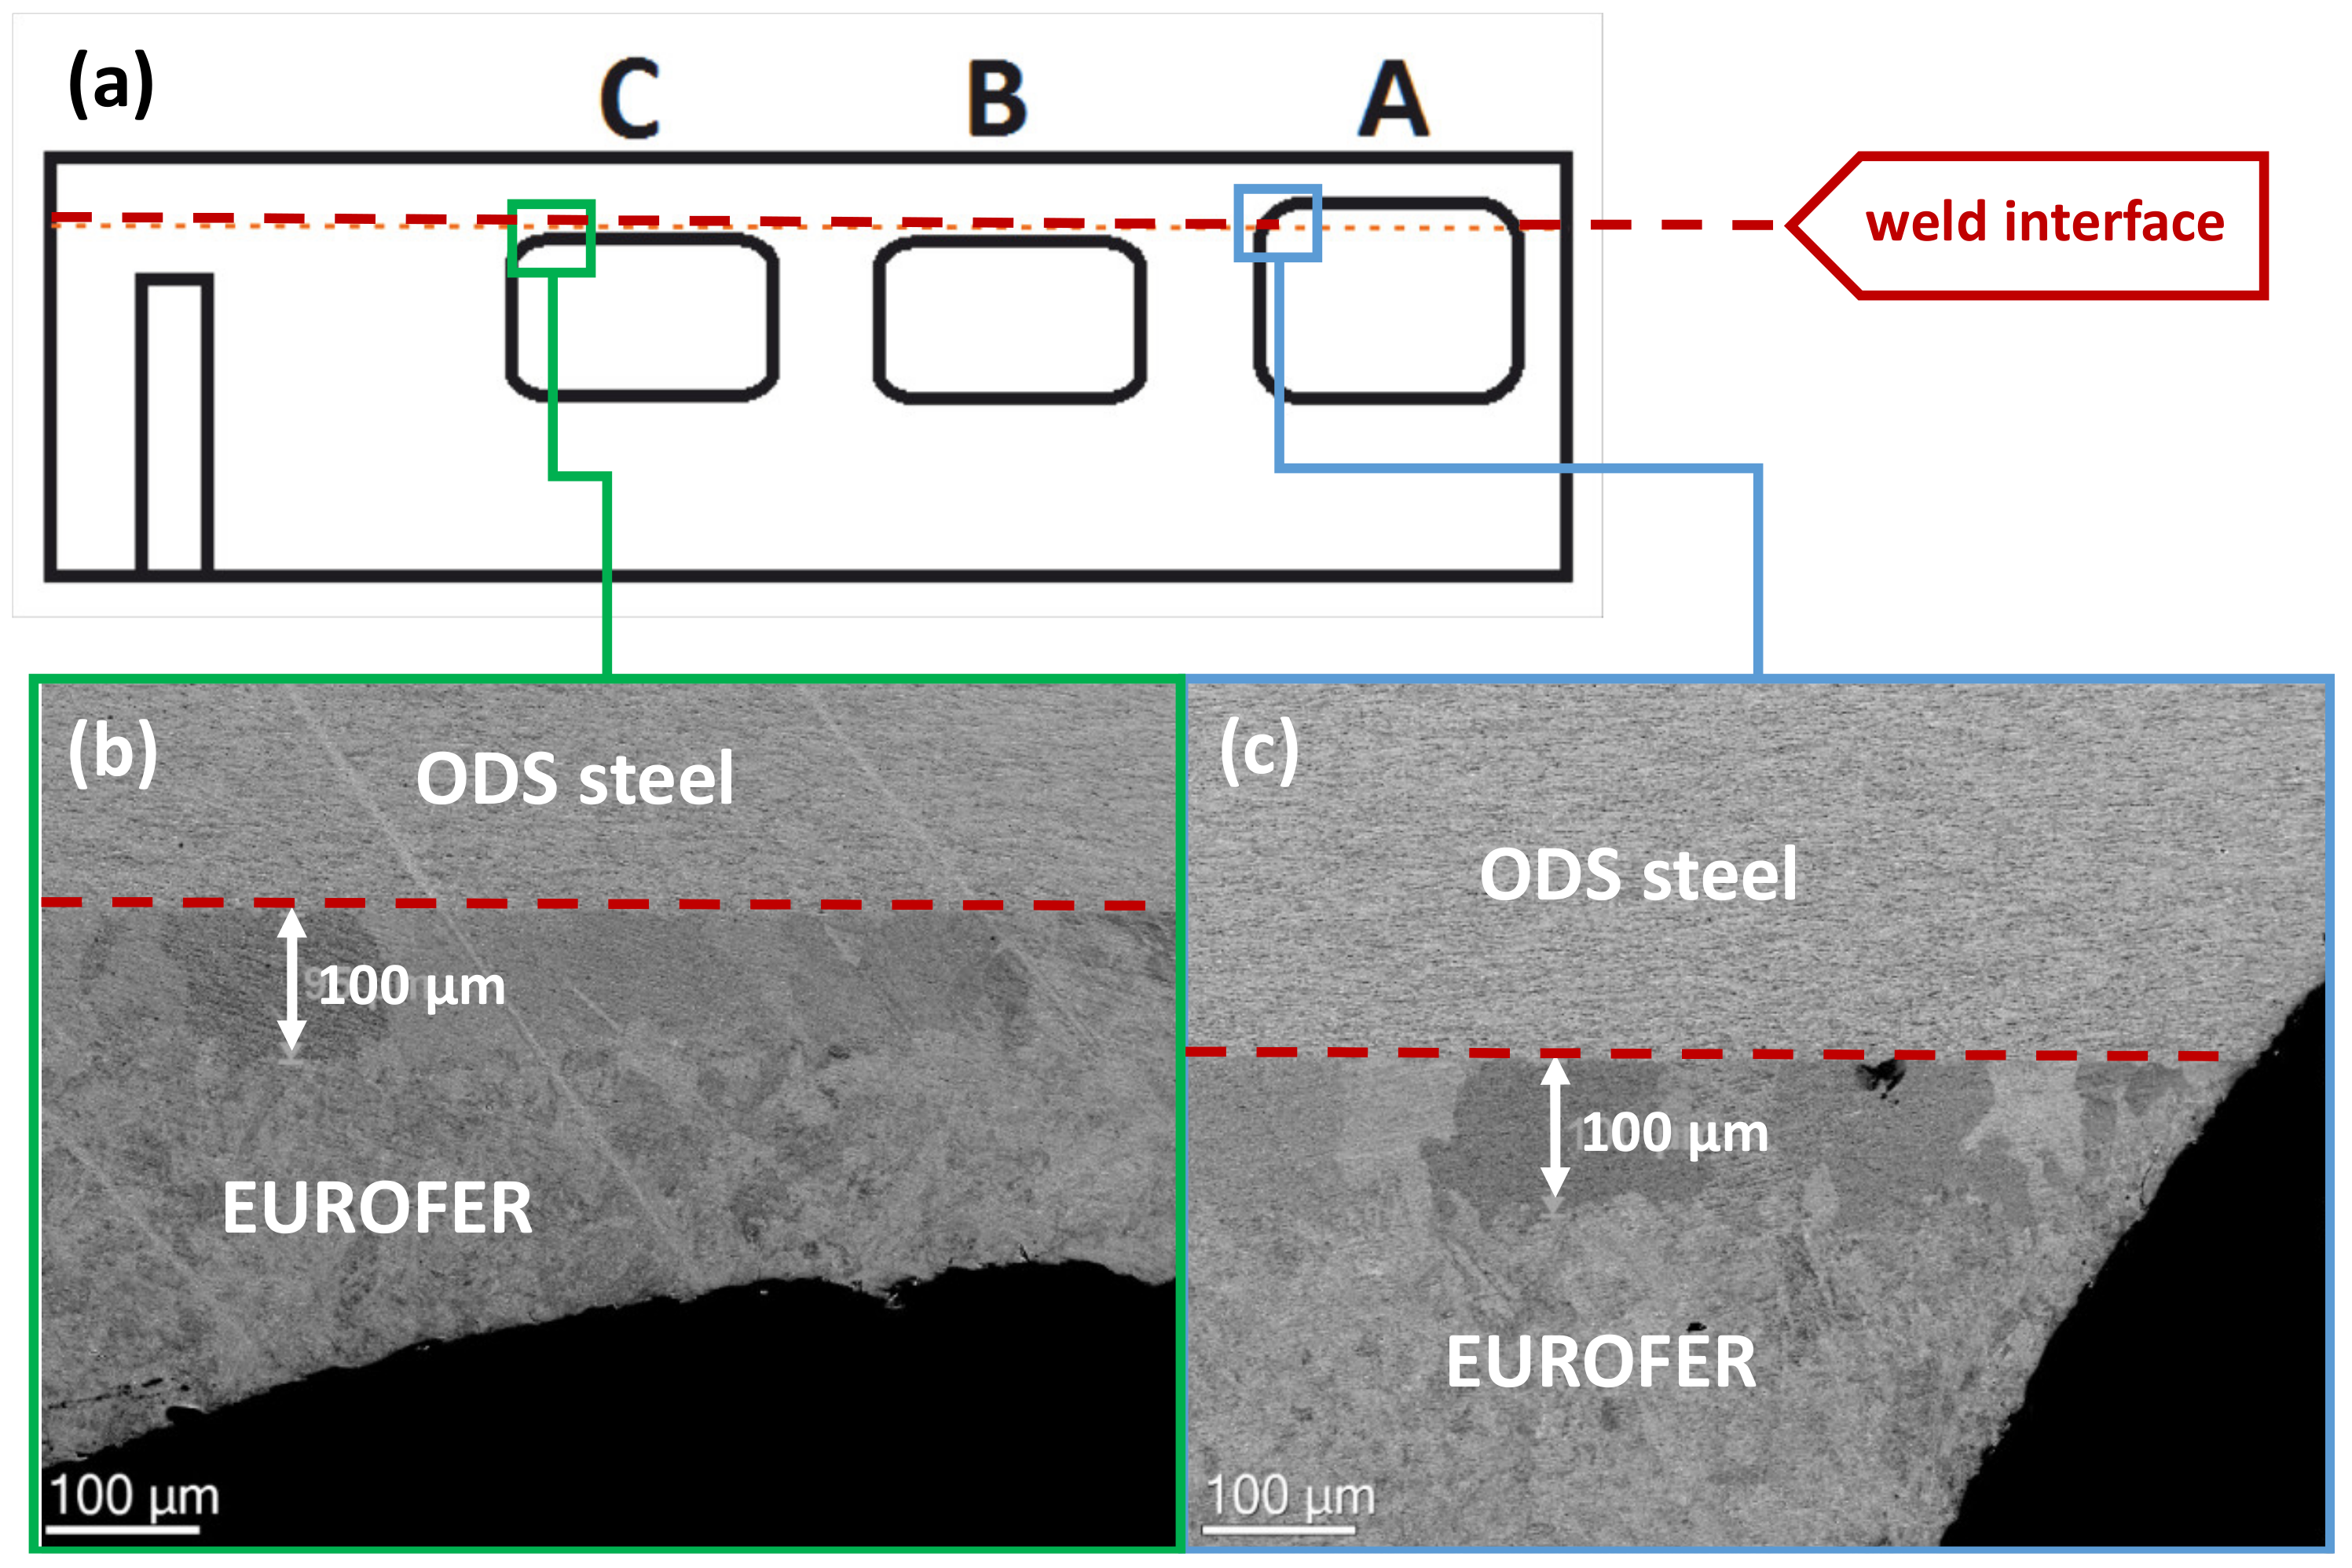
  • Post-experimental microstructural analyses by SEM did not reveal weld or production voids. Also, critical changes such as Kirkendall pores did not develop in and outside the interface region.
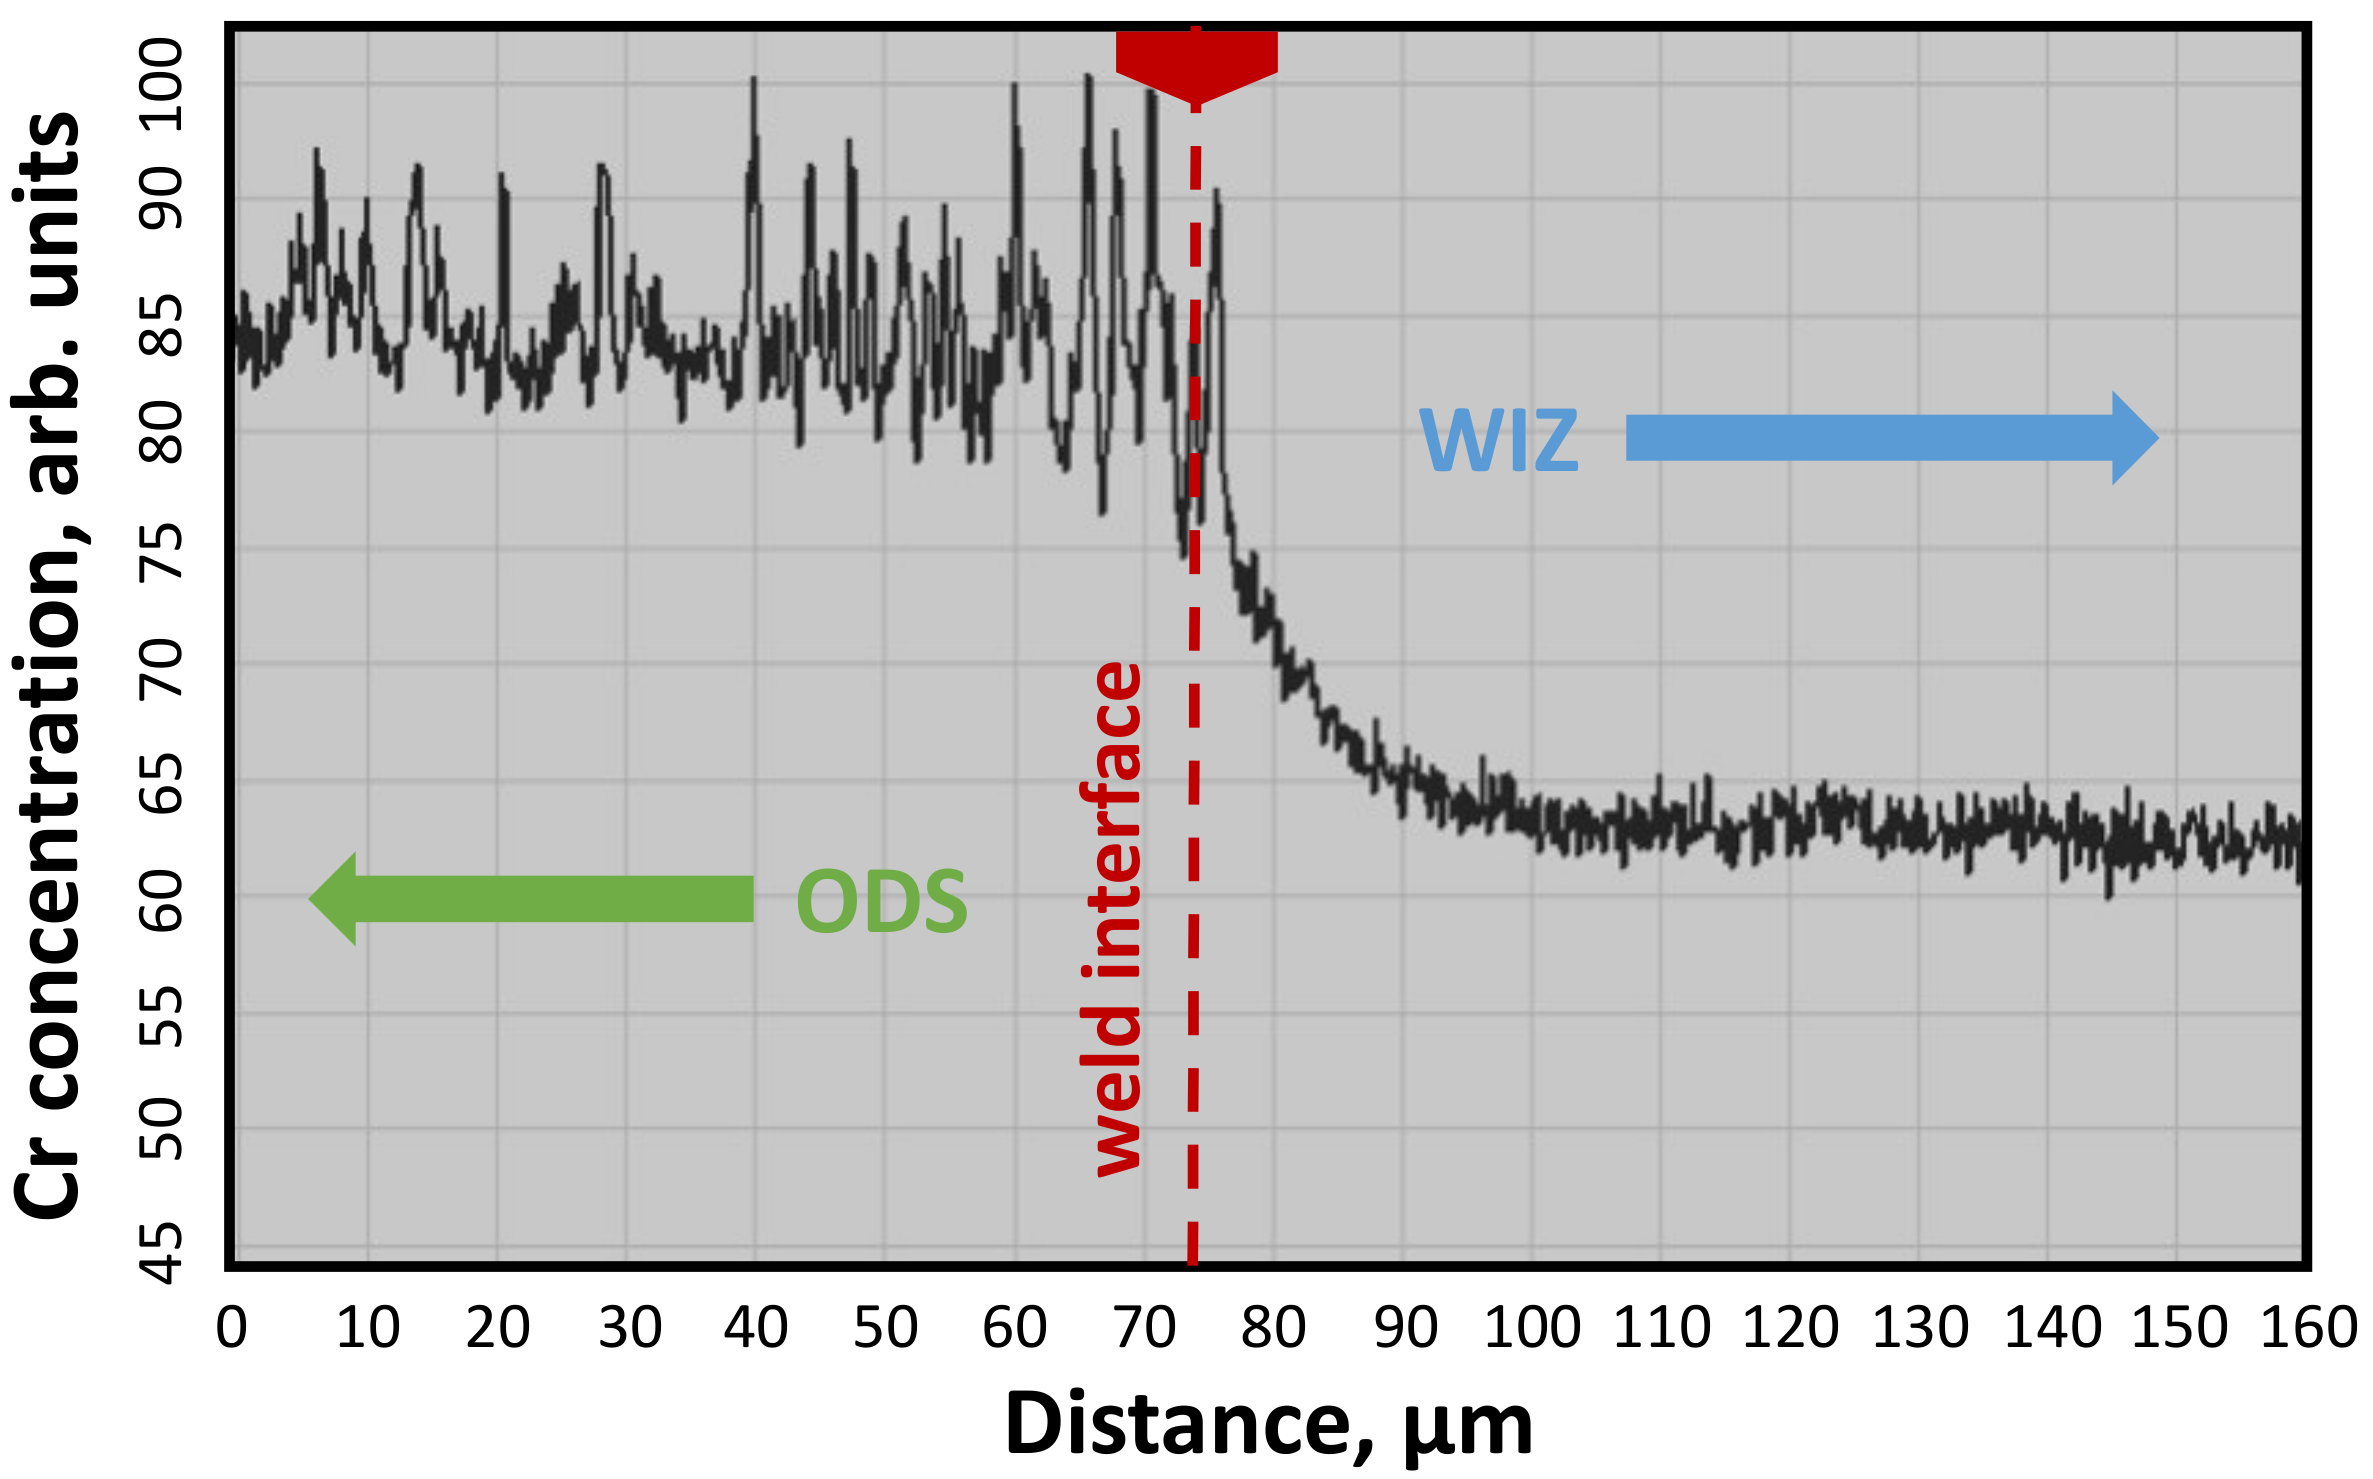
  • A coarse-grained weld interface zone formed on the EUROFER side, which is identified to be ferrite.
For an improved blanket concept, the formation of a weld interface zone should be prohibited, because such a ferrite layer could tend to embrittle under neutron irradiation. The easiest solution would consist in the use of an ODS steel type with the same carbon and chromium content as EUROFER97. This is the case, for example, for the 9Cr ODS-EUROFER steel. Of course, a full replacement of EUROFER97 steel by an ODS steel would also solve the problem.

Author Contributions

Conceptualization, writing—original draft preparation, writing—review and editing, M.R.; methodology, validation, formal analysis, investigation, M.R., J.H., S.A., M.D., S.B., T.B., E.S., U.J., M.K., C.B., B.-E.G., H.N., J.R., C.Z., M.R.; supervision, T.B., B.-E.G., M.R.; project administration, G.P., G.A. All authors have read and agreed to the published version of the manuscript.

Funding

This work has been carried out within the framework of the EUROfusion Consortium and has received funding from the Euratom research and training program 2014–2018 and 2019–2020 under grant agreement No 633053. The views and opinions expressed herein do not necessarily reflect those of the European Commission.

Institutional Review Board Statement

Not applicable.

Informed Consent Statement

Not applicable.

Acknowledgments

We want to thank Siegfried Baumgärtner, Daniel Bolich, Mirjam Hoffmann, Rainer Ziegler, Bernhard Dafferner, and Horst Zimmermann, all from Karlsruhe Institute of Technology (KIT, IAM), for their support regarding organization and dealing with infrastructural tasks such as testing, examinations, coordination of machining, photographing, and sample preparation. We are also grateful to the KIT CN workshop team with a special thanks to Tanja for the excellent EDM performance. Generally, we wish to express our gratitude to all colleagues who were involved the one or other way in this project.

Conflicts of Interest

The authors declare no conflict of interest. The funders had no role in the design of the study; in the collection, analyses, or interpretation of data; in the writing of the manuscript, or in the decision to publish the results.

Abbreviations

bccbody centered cubic (lattice)
BSEback scatter electron(s) (imaging or microscopy)
CFDcomputational fluid dynamics
DBTTductile to brittle transition temperature
DEMOdemonstration reactor
dpadisplacements per atom
EBelectron beam
EBSDelectron back scatter diffraction (analysis)
EDMelectro discharge machining
EDXenergy dispersive X-ray (spectroscopy)
EUROFEREuropean ferrite (steel)
F4EFusion for Energy
FEMfinite element method
FWfirst wall
HAZheat affected zone
HCPBhelium-cooled pebble bed (blanket concept)
HELOKAHelium Loop Karlsruhe
HHFhigh heat flux
HIPhot isostatic press(ing)
HTheat treatment
HVVickers hardness
IEAInternational Energy Agency
IRinfra-red
ITERInternational Thermonuclear Test Reactor
JAERIJapan Atomic Energy Research Institute
KLSTEuropean miniaturized standard Charpy specimen geometry (3 mm × 4 mm × 27 mm)
LAlow activation
LCFlow cycle fatigue
LTUSlowest temperature in the upper shelf
ODSoxide dispersion strengthened or strengthening
OPTIFERoptimized ferrite (steel)
P92martensitic 9Cr-2W-Mo steel, type 1.4901
PCAprincipal component analysis
PWHTpost-welding heat treatment
RAFMreduced activation ferritic-martensitic (steel)
ROTEL rotating electrode (melt facility)
SEMscanning electron microscope or microscopy
TBMtest blanket module (for ITER)
TEMtransmission electron microscope or microscopy
TIGtungsten inert gas (welding)
TTTtime temperature transition (diagram)
USEupper shelf energy
VARvacuum arc melting
WCLLwater-cooled lithium lead (blanket concept)
WIZweld interface zone

References

  1. Federici, G.; Biel, W.; Gilbert, M.R.; Kemp, R.; Taylor, N.; Wenninger, R. European DEMO design strategy and consequences for materials. Nucl. Fusion 2017, 57, 092002. [Google Scholar] [CrossRef] [Green Version]
  2. Federici, G.; Bachmann, C.; Barucca, L.; Biel, W.; Boccaccini, L.; Brown, R.; Bustreo, C.; Ciattaglia, S.; Cismondi, F.; Coleman, M.; et al. DEMO design activity in Europe: Progress and updates. Fusion Eng. Des. 2018, 136, 729–741. [Google Scholar] [CrossRef]
  3. Federici, G.; Boccaccini, L.; Cismondi, F.; Gasparotto, M.; Poitevin, Y.; Ricapito, I. An overview of the EU breeding blanket design strategy as an integral part of the DEMO design effort. Fusion Eng. Des. 2019, 141, 30–42. [Google Scholar] [CrossRef]
  4. Federici, G.; Bachmann, C.; Barucca, L.; Baylard, C.; Biel, W.; Boccaccini, L.V.; Bustreo, C.; Ciattaglia, S.; Cismondi, F.; Corato, V.; et al. Overview of the DEMO staged design approach in Europe. Nucl. Fusion 2019, 59, 066013. [Google Scholar] [CrossRef] [Green Version]
  5. Hernández, F.A.; Pereslavtsev, P.; Zhou, G.; Kang, Q.; D’Amico, S.; Neuberger, H.; Boccaccini, L.V.; Kiss, B.; Nádasi, G.; Maqueda, L.; et al. Consolidated design of the HCPB Breeding Blanket for the pre-Conceptual Design Phase of the EU DEMO and harmonization with the ITER HCPB TBM program. Fusion Eng. Des. 2020, 157, 111614. [Google Scholar] [CrossRef]
  6. Barucca, L.; Bubelis, E.; Ciattaglia, S.; D’Alessandro, A.; Del Nevo, A.; Giannetti, F.; Hering, W.; Lorusso, P.; Martelli, E.; Moscato, I.; et al. Pre-conceptual design of EU DEMO balance of plant systems: Objectives and challenges. Fusion Eng. Des. 2021, 169, 112504. [Google Scholar] [CrossRef]
  7. Neuberger, H.; Rey, J.; Arbeiter, F.; Hernandez, F.; Ruck, S.; Koehly, C.; Stratil, L.; Niewöhner, R.; Felde, A. Evaluation of conservative and innovative manufacturing routes for gas cooled Test Blanket Module and Breeding Blanket First Walls. Fusion Eng. Des. 2019, 146, 2140–2143. [Google Scholar] [CrossRef]
  8. Neuberger, H.; Hernandez, F.; Ruck, S.; Arbeiter, F.; Bonk, S.; Rieth, M.; Stratil, L.; Müller, O.; Volker, K.U. Advances in Additive Manufacturing of fusion materials. Fusion Eng. Des. 2021, 167, 112309. [Google Scholar] [CrossRef]
  9. Klimenkov, M.; Möslang, A.; Materna-Morris, E. Helium influence on the microstructure and swelling of 9%Cr ferritic steel after neutron irradiation to 16.3 dpa. J. Nucl. Mater. 2014, 453, 54–59. [Google Scholar] [CrossRef]
  10. Materna-Morris, E.; Lindau, R.; Moslang, A. Modifications of alloying elements in martensitic 8–10% Cr-steels and its influence of neutron irradiation on material properties. Mater. Sci. Forum 2010, 636–637, 631–636. [Google Scholar] [CrossRef]
  11. Klimenkov, M.; Möslang, A.; Materna-Morris, E.; Schneider, H.-C. Helium bubble morphology of boron alloyed EUROFER97 after neutron irradiation. J. Nucl. Mater. 2013, 442, S52–S57. [Google Scholar] [CrossRef]
  12. Klimenkov, M.; Jäntsch, U.; Rieth, M.; Möslang, A. Correlation of microstructural and mechanical properties of neutron irradiated EUROFER97 steel. J. Nucl. Mater. 2020, 538, 152231. [Google Scholar] [CrossRef]
  13. Brabänder, A.V.; Bredl, J.; Schneider, H.-C.; Kamlah, M. Registering hardness measurement of neutron-irradiated low-activation steels at high temperatures. Fusion Eng. Des. 2019, 146, 2734–2737. [Google Scholar] [CrossRef]
  14. Dethloff, C.; Gaganidze, E.; Aktaa, J. Review and critical assessment of dislocation loop analyses on EUROFER 97. Nucl. Mater. Energy 2018, 15, 23–26. [Google Scholar] [CrossRef]
  15. Schneider, H.-C.; Petersen, C.; Povstyanko, A.V.; Fedoseev, A.E.; Makarov, O. Repeatability of irradiation damage and of recovery by post-irradiation annealing of EUROFER base steels. Fusion Eng. Des. 2017, 124, 1019–1023. [Google Scholar] [CrossRef]
  16. Klimenkov, M.; Lindau, R.; Jäntsch, U.; Möslang, A. Effect of irradiation temperature on microstructure of ferritic-martensitic ODS steel. J. Nucl. Mater. 2017, 493, 426–435. [Google Scholar] [CrossRef]
  17. Materna-Morris, E.; Schneider, H.-C.; Möslang, A. Tensile behavior of RAFM alloys after neutron irradiation of up to 16.3 dpa between 250 and 450 °C. J. Nucl. Mater. 2014, 455, 728–734. [Google Scholar] [CrossRef]
  18. Gilbert, M.R.; Dudarev, S.L.; Zheng, S.; Packer, L.W.; Sublet, J.C. An integrated model for materials in a fusion power plant: Transmutation, gas production, and helium embrittlement under neutron irradiation. Nucl. Fusion 2012, 52, 083019. [Google Scholar] [CrossRef] [Green Version]
  19. Sato, S.; Maki, K. Analytical representation for neutron streaming through slits in fusion reactor blanket by Monte Carlo calculation. Fusion Eng. Des. 2003, 65, 501–524. [Google Scholar] [CrossRef]
  20. Zinkle, S.J.; Snead, L.L. Designing radiation resistance in materials for fusion energy. Annu. Rev. Mater. Res. 2014, 44, 241–267. [Google Scholar] [CrossRef]
  21. He, P.; Klimenkov, M.; Möslang, A.; Lindau, R.; Seifert, H.J. Correlation of microstructure and low cycle fatigue properties for 13.5Cr1.1W0.3Ti ODS steel. J. Nucl. Mater. 2014, 455, 167–173. [Google Scholar] [CrossRef]
  22. Straßberger, L.; Chauhan, A.; Czink, S.; Aktaa, J. High-temperature low-cycle fatigue behavior and microstructural evolution of an ODS steel based on conventional T91. Int. J. Fatigue 2017, 100, 50–57. [Google Scholar] [CrossRef]
  23. Chauhan, A.; Hoffmann, J.; Litvinov, D.; Aktaa, J. High-temperature low-cycle fatigue behavior of a 9Cr-ODS steel: Part 2—hold time influence, microstructural evolution and damage characteristics. Mater. Sci. Eng. A 2018, 730, 197–206. [Google Scholar] [CrossRef]
  24. Materna-Morris, E.; Möslang, A.; Rolli, R.; Schneider, H.C. Effect of 16.3 dpa neutron irradiation on fatigue lifetime of the RAFM steel EUROFER97. Fusion Eng. Des. 2011, 86, 2607–2610. [Google Scholar] [CrossRef]
  25. Materna-Morris, E.; Lindau, R.; Schneider, H.-C.; Möslang, A. Tensile behavior of EUROFER ODS steel after neutron irradiation up to 16.3 dpa between 250 and 450 °C. Fusion Eng. Des. 2015, 98–99, 2038–2041. [Google Scholar] [CrossRef]
  26. Rieth, M.; Schirra, M.; Falkenstein, A.; Graf, P.; Heger, S.; Kempe, H.; Lindau, R.; Zimmermann, H. Eurofer 97—Tensile, Charpy, Creep and Structural Tests; Scientific Report FZKA 6911; Forschungszentrum Karlsruhe: Karlsruhe, Germany, 2003. [Google Scholar]
  27. Materna-Morris, E. Structural Material EUROFER97-2, Characterization of Rod and Plate Material: Structural, Tensile, Charpy, and Creep Properties; Final Report on the EFDA Task TW4-TTMS-005 D2; Karlsruhe Institute of Technology: Karlsruhe, Germany, 2007. [Google Scholar]
  28. Schäfer, L.; Kempe, H. Wissenschaftliche Berichte, FZKA 6551, Zug- und Kerbschlageigenschaften des Stahles EUROFER ’97 (Vergleich mit OPTIFER); Forschungszentrum Karlsruhe: Karlsruhe, Germany, 2000. [Google Scholar]
  29. Forest, L.; Boccaccini, L.V.; Cogneau, L.; Puma, A.L.; Neuberger, H.; Pascal, S.; Rey, J.; Thomas, N.; Tosi, J.; Zmitko, M. Test blanket modules (ITER) and breeding blanket (DEMO): History of major fabrication technologies development of HCLL and HCPB and status. Fusion Eng. Des. 2020, 154, 111493. [Google Scholar] [CrossRef]
  30. Forest, L.; Thomas, N.; Cogneau, L.; Tosi, J.; Vallory, J.; Zmitko, M.; Poitevin, Y.; Soldaini, M.; Spagnuolo, G.A.; Lacroix, C.; et al. Fabrication technologies implemented for the European test blanket modules: Status for HCPB and WCLL. Fusion Eng. Des. 2021, 164, 1–6. [Google Scholar] [CrossRef]
  31. Rensman, J.W. NRG Irradiation Testing: Report on 300 °C and 60 °C Irradiated RAFM Steels, Petten, 30 August 2005, 20023/05.68497/P (Final Report EFDA for Subtask TW2-TTMS-001a D06 and TW2-TTMS-001b D12); NRG: Petten, The Netherlands, 2005. [Google Scholar]
  32. EN 895, Destructive Tests on Welds in Metallic Materials—Transverse Tensile Test, May 1999. Available online: https://www.document-center.com/standards/show/DIN-EN-895 (accessed on 8 October 2021).
  33. EN 876, Destructive Tests on Welds in Metallic Materials—Longitudinal Tensile Test on Weld Metal in Fusion Welded Joints, August 1995. Available online: https://standards.iteh.ai/catalog/standards/cen/0ffcdb36-3230-4007-af3b-ffed37329e25/en-876-1995 (accessed on 8 October 2021).
  34. Hernández, F.A.; Arbeiter, F.; Boccaccini, L.V.; Bubelis, E.; Chakin, V.P.; Cristescu, I.; Ghidersa, B.E.; González, M.; Hering, W.; Hernández, T.; et al. Overview of the HCPB Research Activities in EUROfusion. IEEE Trans. Plasma Sci. 2018, 46, 2247–2261. [Google Scholar] [CrossRef]
  35. Hernández, F.A.; Pereslavtsev, P.; Zhou, G.; Neuberger, H.; Rey, J.; Kang, Q.; Boccaccini, L.V.; Bubelis, E.; Moscato, I.; Dongiovanni, D. An enhanced, near-term HCPB design as driver blanket for the EU DEMO. Fusion Eng. Des. 2019, 146, 1186–1191. [Google Scholar] [CrossRef]
  36. Hernández, F.A.; Pereslavtsev, P.; Zhou, G.; Kiss, B.; Kang, Q.; Neuberger, H.; Chakin, V.; Gaisin, R.; Vladimirov, P.; Boccaccini, L.V.; et al. Advancements in the Helium-Cooled Pebble Bed Breeding Blanket for the EU DEMO: Holistic Design Approach and Lessons Learned. Fusion Sci. Technol. 2019, 75, 352–364. [Google Scholar] [CrossRef]
  37. Rieth, M.; Dürrschnabel, M.; Bonk, S.; Antusch, S.; Pintsuk, G.; Aiello, G.; Henry, J.; de Carlan, Y.; Ghidersa, B.-E.; Neuberger, H.; et al. Fabrication routes for advanced first wall design alternatives. Nucl. Fusion 2021, 61, 116067. [Google Scholar] [CrossRef]
  38. Rieth, M.; Rey, J. Specific welds for test blanket modules. J. Nucl. Mater. 2009, 386–388, 471–474. [Google Scholar] [CrossRef]
  39. Commin, L.; Rieth, M.; Dafferner, B.; Zimmermann, H.; Bolich, D.; Baumgärtner, S.; Ziegler, R.; Dichiser, S.; Fabry, T.; Fischer, S.; et al. A fail-safe and cost effective fabrication route for blanket First Walls. J. Nucl. Mater. 2013, 442, 538–541. [Google Scholar] [CrossRef]
  40. Rieth, M. Diffusion weld study for Test Blanket Module fabrication. Fusion Eng. Des. 2009, 84, 1602–1605. [Google Scholar] [CrossRef] [Green Version]
  41. Ghidersa, B.E.; Ionescu-Bujor, M.; Janeschitz, G. Helium Loop Karlsruhe (HELOKA): A valuable tool for testing and qualifying ITER components and their He cooling circuits. Fusion Eng. Des. 2006, 81, 1471–1476. [Google Scholar] [CrossRef]
  42. Ghidersa, B.E.; Marchese, V.; Ionescu-Bujor, M.; Ihli, T.H. HELOKA facility: Thermo-hydrodynamic model and control. Fusion Eng. Des. 2008, 83, 1792–1796. [Google Scholar] [CrossRef]
  43. Ghidersa, B.E.; Jin, X.; Rieth, M.; Ionescu-Bujor, M. KATHELO: A new high heat flux component testing facility. Fusion Eng. Des. 2013, 88, 854–857. [Google Scholar] [CrossRef]
  44. Ranjithkumar, S.; Yadav, B.K.; Saraswat, A.; Chaudhuri, P.; Kumar, E.R.; Kunze, A.; Ghidersa, B.E. Performance assessment of the Helium cooled First Wall mock-up in HELOKA facility. Fusion Eng. Des. 2020, 150, 111319. [Google Scholar] [CrossRef]
  45. Vasilyev, A.A.; Golikov, P.A. Carbon diffusion coefficient in alloyed ferrite. Mater. Phys. Mech. 2018, 39, 111–119. [Google Scholar] [CrossRef]
  46. Lee, S.J.; Matlock, D.K.; Van Tyne, C.J. An empirical model for carbon diffusion in austenite incorporating alloying element effects. ISIJ Int. 2011, 51, 1903–1911. [Google Scholar] [CrossRef] [Green Version]
  47. Tokei, Z.; Hennesen, K.; Viefhaus, H.; Grabke, H.J. Diffusion of chromium in ferritic and austenitic 9–20 wt-% chromium steels. Mater. Sci. Technol. 2000, 16, 1129–1138. [Google Scholar] [CrossRef]
Figure 1. Time Temperature Transition (TTT) diagram for EUROFER97/2 after austenitization for 60 min at 1000 °C. The lines correspond to cooling by different rates (note the logarithmic time scale). The phases that form during cooling are denoted: austenite A, martensite M, ferrite F, carbide C. Start and end of martensite formation Ms and Mf. The crosses symbolize data determined by dilatometry.
Applsci 11 11653 g001
Figure 2. Time Temperature Transition (TTT) diagram for the experimental heat J361 (it is similar to EUROFER97/2 but without Mn) starting with austenitization for 60 min at 1000 °C, followed by isothermal tempering (i.e., at constant temperature). This diagram corresponds to placing a piece material from one furnace at austenitization temperature to another furnace with a temperature given in this diagram. While changing the furnaces, the temperature drops with a rate of 20 K/minute. The corresponding horizontal line at this temperature indicates the start and end of a phase transition whenever the line enters or leaves a phase field boundary. The phases are denoted: austenite A, martensite M, ferrite F, carbide C. The crosses symbolize data that were determined by dilatometry. Note: For EUROFER97 steels the F + C phase field is slightly shifted towards longer durations and the martensitic phase starts at about 360 °C.
Applsci 11 11653 g002
Figure 3. Depending on the tempering treatment (temperature and duration), hardness can be adjusted after austenitization. Here, the effect on EUROFER97/2 (25 mm plates, heats 993391 and 993402) after austenitization at 1040 °C and 980 °C for 30 min, is illustrated. The tempering treatment was performed for 2 h. The temperature at the minimum of the hardness curve corresponds to the transition temperature Ac1b.
Applsci 11 11653 g003
Figure 4. Effect of austenitization between 900 °C and 1050 °C for 30 min followed by air cooling and tempering between 700 °C and 770 °C for 2 h (a) on the 500 °C-yield-strength of the EUROFER97 steel; (b) on DBTT of the EUROFER97 steel (measured with ISO-V Charpy specimens, for details see [28]). The yield strength and DBTT values are extracted and re-evaluated from the Charpy results given in [28].
Applsci 11 11653 g004
Figure 5. Micrographs of EUROFER97 after austenitization at 980 °C for 30 min and different subsequent tempering steps; (a) cooling to room temperature with a constant rate of −1 K/min (leads to ferrite and carbide formation: F + C); (b) isothermal annealing at 750 °C for 30 min (leads to martensite and a fraction of F + C); (c) isothermal annealing at 750 °C for 1 h (leads to F + C); (d) isothermal annealing at 750 °C for 6 h (leads to F + C); (e) isothermal annealing at 700 °C for 30 min (leads to martensite); (f) isothermal annealing at 700 °C for 1 h (leads to martensite and a fraction of F + C); (g) isothermal annealing at 850 °C for 6 h (leads to martensite); (h) isothermal annealing at 550 °C for 5 h followed by isothermal annealing at 750 °C for 1 h (leads to F + C). Note: the final isothermal treatments were followed by air cooling (quenching).
Applsci 11 11653 g005
Figure 6. The effect of multiple heat treatments on the tensile properties of EUROFER97/2 (25 mm plate, heat 993402). The reference samples (circles) were austenitized at 980 °C for 30 min (A), air quenched (Q), tempered at 750 °C for 2 h (T), and finally air cooled. For comparison, another set of samples was 20 times heat treated the same way, i.e., 20 × (A + Q + T). Finally, another set was prepared by 20 times repeating only austenitization and quenching, i.e., 20 × (A + Q), which was then followed by one tempering treatment (1 × T). The tensile tests were performed according to DIN EN ISO 6892-1 using cylindrical specimens (gauge: diameter 3 mm, length 18 mm). The tensile axis was always oriented parallel to the rolling direction.
Applsci 11 11653 g006
Figure 7. The effect of multiple heat treatments on the Charpy impact energy (KLST) of EUROFER97/2 (25 mm plate, heat 993402). The reference samples (circles) were austenitized at 980 °C for 30 min (A), air quenched (Q), tempered at 750 °C for 2 h (T), and finally air cooled. For comparison, another set of samples was 20 times heat treated the same way, i.e., 20 × (A + Q + T). Finally, another set was prepared by 20 times repeating only austenitization and quenching, i.e., 20 × (A + Q), which was then followed by one tempering treatment (1 × T). The instrumented Charpy tests were performed according to the EU standard for small size specimens (KLST type). The specimens were oriented in L-S direction.
Applsci 11 11653 g007
Figure 8. The effect of multiple heat treatments on the microstructure of EUROFER97/2 (25 mm plate, heat 993402). The optical micrographs show cross-sections of the plane T-S. Vickers hardness was measured on T-S cross-sections, too. The values are given in the lower left corner of the images. The heat treatment is indicated as follows: austenitization at 980 °C for 30 min (A), air quenching (Q), and tempering at 750 °C for 2 h (T).
Applsci 11 11653 g008
Figure 9. (Upper row) Cross-sections of 5 mm electron beam (EB) weld with beam stopper, 5 mm laser weld with beam stopper, 5 mm and 10 mm ½-V tungsten inert gas (TIG) weld; (lower row) the alignment of the notch of the Charpy specimens in the heat affected zone (HAZ). The dotted lines indicate the course of the softest area within the HAZ in the TIG welds.
Applsci 11 11653 g009
Figure 10. (Lower row) 12 mm ½-V tungsten inert gas (TIG) weld and 12 mm electron beam (EB) weld with beam stopper; (upper row) look on the weld lines from top.
Applsci 11 11653 g010
Figure 11. Cross-section of a 40 mm electron beam (EB) weld with an underlay.
Applsci 11 11653 g011
Figure 12. (a) Hardness profiles of 5 mm TIG, EB, and laser welds, and of the 10 mm TIG weld. The hardness level of the base material is shaded grey; (b) hardness profile of the 12 mm TIG weld from the top and middle cross-sectional part; (c) hardness profile of the 12 mm EB weld from the top and lower cross-sectional part.
Applsci 11 11653 g012
Figure 13. Microstructure of the welds without and after different PWHTs according to Table 2.
Applsci 11 11653 g013
Figure 14. Charpy test results of 5 mm and 10 mm TIG, laser and EB welds. The notches of the Charpy specimens were fabricated in the top of the weld centers and HAZs. The graphs show results from the condition as welded, after a PWHT of just tempering at 700 °C for 2 h, and after a PWHT of 960 °C/30 min + air quenching + 760 °C for 2 h. For comparison, each graph shows the properties of the base material (EUROFER97/2) after standard heat treatment.
Applsci 11 11653 g014
Figure 15. Charpy test results of 12 mm TIG and EB welds. The notches of the Charpy specimens were fabricated in the top of the weld center. The effect of PWHTS (indicated in the legend) is shown. For comparison, results of the base material (EUROFER97/2) after standard heat treatment are also plotted.
Applsci 11 11653 g015
Figure 16. Charpy test results of a 40 mm EB weld. The Charpy specimens were fabricated from the top and root of the weld with the notches centered to the fusion zone. The tests have been performed in the condition after welding (without PWHT) and after a PWHT (980 °C/30 min + air quenching + 750 °C/2 h).
Applsci 11 11653 g016
Figure 17. Ductile-to-brittle transition temperature (DBTT) of 5 mm, 10 mm, and 12 mm welds after different post-welding heat treatments. The notches of the Charpy specimens were fabricated either in the weld center or in the HAZ (as indicated). For comparison, the DBTT of the base material is plotted as a horizontal line.
Applsci 11 11653 g017
Figure 18. Lowest temperature in the upper shelf (LTUS) for 5 mm, 10 mm, and 12 mm welds after different post-welding heat treatments. The notches of the Charpy specimens were fabricated either in the weld center or in the HAZ (as indicated). For comparison, DBTT of the base material is plotted as a horizontal line in the graphs.
Applsci 11 11653 g018
Figure 19. Tensile properties of the EUROFER base material in the condition as delivered (squares) and of the different welds without and with two different PWHTs. The different welds are not discerned. They include 5-, 10-, and 12-mm EB, laser, and TIG welds, as described in the previous sections.
Applsci 11 11653 g019
Figure 20. The effect of multiple heat treatments on the microstructure of a ½-V TIG weld applied on 10 mm thick EUROFER97/2 plates. The weld pieces were machined from a 25 mm plate, heat 993402. The optical micrographs show cross-sections from the middle part of the 85 mm long weld lines. The micrographs were made from the top and middle parts of the cross-sections (indicated in the images). The heat treatment is indicated as follows: austenitization at 980 °C for 30 min (A), air quenching (Q), and tempering at 750 °C for 2 h (T).
Applsci 11 11653 g020
Figure 21. Hardness scan of the 10 mm TIG weld after one full PWHT (A + Q + T) and after twenty repetitions. The measurement was performed through a cross-section of the weld and about 3 mm from the top of the plate surface. The imprint spacing is 0.5 mm. The average hardness is the same in both lines: 213 HV1.
Applsci 11 11653 g021
Figure 22. (a) 4 teeth radius cutter used for procedure # 1 and # 2; (b) 5 teeth knife head with (c) Sandvik cutter plates 1025 R245-12 T3 E-M and 2040 R245-12 T3 K-MM, used for procedure # 3 and # 4.
Applsci 11 11653 g022
Figure 23. (ad) Scanning electron microscopy images of the surfaces machined by the procedures # 1–4 according to Table 4. The upper row shows a low, the lower row a high resolution of the surface images.
Applsci 11 11653 g023
Figure 24. Scanning electron microscopy images of surfaces that have been produced by procedure # 2 (see Table 4 and compare to Figure 23b) with (a) a preceding heat treatment of 980 °C/0.5 h and subsequent air quenching; and (b) 980 °C/0.5 h, air quenching, and 630 °C/2 h.
Applsci 11 11653 g024
Figure 25. (Left column) SEM images (cross-section and surface) of a EUROFER97 sample, machined by wire-cut EDM; (right column) EDX maps of the cross-section and surfaces. The contamination by the brass-wire (Cu and Zn) is clearly visible.
Applsci 11 11653 g025
Figure 26. Charpy test results of samples with surface machining procedure # 1–4 according to Table 4 after diffusion bonding by one HIP cycle at 25 MPa/1050 °C/2 h, followed by a standard heat treatment at 980 °C/0.5 h, air quenching, and 760° C/2 h.
Applsci 11 11653 g026
Figure 27. (a) Micrograph of the cross-section from the sample with surface machining # 2 after diffusion bonding by one HIP cycle at 25 MPa/1050 °C/2 h. In this case, the weld surface (indicated by the black arrows) is still recognizable; (b) The same cross-section after a second HIP cycle at 100 MPa/1050 °C/2 h. The weld surface cannot be identified anymore.
Applsci 11 11653 g027
Figure 28. Charpy test results of the samples with different oxidation periods prior to diffusion bonding at 25 MPa, 1150 °C for 2 h and after post-weld heat treatment of 980 °C/0.5 h + 760 °C/2 h. Oxidation times at 70% relative humidity: 0 h (T0), 1 day (T1), 2 days (T2), 3 days (T3), 14 days (T4). The circles represent results with the base material (EUROFER97/2, heat 993402).
Applsci 11 11653 g028
Figure 29. Charpy test results of samples with different cleaning and contamination treatments prior to diffusion bonding at 25 MPa, 1150 °C for 2 h and after post-weld heat treatment of 980 °C/0.5 h + 760 °C/2 h. For comparison, the results with the base material (EUROFER97/2, heat 993402) are plotted by circles. Details of the contamination treatments are given in Table 5.
Applsci 11 11653 g029
Figure 30. The design of the mock-up is illustrated by a photo that has been made after the high heat flux tests. There are 5 parts, which are joined by TIG welds (2 reducers, 2 distributors, the mock-up plate with internal cooling channels). The sixth part, an ODS plate, is joined by HIP on top of the mock-up plate.
Applsci 11 11653 g030
Figure 31. Dimensions of the mock-up plate and geometry of the cooling channels. The cooling channel cross-sections are 10 mm (height) by 15 mm (width) with a 2 mm radius at the corners. The channel in the middle (the left one in the drawing) is higher by one millimeter compared to the other four. That is, this channel exceeds the baseplate of EUROFER97/2 (cyan) and is machined into the ODS steel plating (red). Therefore, the diffusion bond-lines run along both upper corners. This means that we have placed the potentially weakest points (the weld seam) in the area of highest stress (this is due to stress concentration along the 2 mm radii of the corners).
Applsci 11 11653 g031
Figure 32. (a) The ODS plated mock-up block with the machined cooling channels; (b) connection milled in the mock-up plate on both ends of the cooling channels (indicated by lines); (c) connector part; (d) reducer.
Applsci 11 11653 g032
Figure 33. (a) Sketch indicating the cooling channel cross-sections A and C as well as the imaging areas; (b) BSE image acquired in the ODS steel/EUROFER interface area close to channel C. A distinct weld interface zone of about 100 µm depth can be recognized; (c) BSE image of the corner area in the vicinity of channel C. In this case, also a clear weld interface zone of about 100 µm has developed. Further, the intersection of the weld interface with the surface of the cooling channel (the intentionally created weak spot) does not show any defects.
Applsci 11 11653 g033
Figure 34. (a) Principal component analysis (PCA) of SEM-EDX data in the vicinity of channel A (see in Figure 33). It reveals the single phases, which are present in the respective sample areas. The weld interface and weld interface zone are indicated by dotted lines; (b) Electron backscatter diffraction (EBSD) analysis of the weld interface zone (WIZ).
Applsci 11 11653 g034
Figure 35. EDX scan through the weld interface, starting from the ODS steel region in the vicinity of channel A (see in Figure 33). The Cr concentration drops from about 14 at. % to about 10 at. % within a diffusion length of approximately 25–30 µm. The extension of the previously observed weld interface zone (WIZ) is clearly higher than that. Note: The atomic percentage of the Cr content in the ODS steel amounts to about 14. If the value of 85 on then y-axis is correlated to 14, then the value of 63 corresponds to 10 at. %, which is the Cr content in EUROFER.
Applsci 11 11653 g035
Table 1. Chemical composition of different EUROFER heats. Values are given in weight % by the manufacturer [26,27]. Note: Ti and Si were not analyzed for all heats.
ElementEUROFER97
Heat E83698
14 mm Plate
EUROFER97
Heat D83350
Ø1 mm Filler Wire
EUROFER97/2
Heat 993402
25 mm Plate
Cr8.828.938.95
C0.110.110.11
Mn0.470.390.55
V0.200.190.20
W1.091.091.04
Ta0.130.140.14
N0.0200.0260.038
O0.00100.00180.0011
P0.005<0.0050.0025
S0.0040.0040.001
B<0.001<0.00050.0008
Ti0.0050.006
Nb<0.0016<0.0010.004
Mo<0.00100.0010.005
Ni<0.02000.020.03
Cu0.00160.0740.005
Al0.0090.0070.005
Si0.04
Co0.0060.0050.009
As + Sn + Sb + Zr<0.015<0.02<0.009
Table 2. PWHTs applied to 5- and 10-mm welds (TIG, EB, and Laser).
PWHTAnnealing TemperingHardness in the Fusion Zone (HV1)
1980 °C/0.5 h760 °C/2 h220–230
2900 °C/2 h760 °C/2 h250–255
3900 °C/2 h 445–450
4 760 °C/2 h290–295
5 700 °C/2 h320–340
6 650 °C/2 h330–350
Table 3. PWHTs applied to 12 mm EB and TIG welds. Hardness is given in pairs where the left number refers to EB and the right to the TIG weld (EB/TIG).
PWHTAnnealing TemperingHardness in the Fusion Zone of the 12 mm EB Weld (HV1)Hardness in the Fusion Zone of the 12 mm TIG Weld (HV1)
7 650 °C/2 h305 335
8 650 °C/16 h318320
9 680 °C/2 h312310
10 700 °C/2 h290285
11 700 °C/16 h285295
12 720 °C/2 h280285
13 720 °C/4 h275315
14 740 °C/2 h270280
15900 °C/2 h740 °C/2 h245250
Table 4. Milling parameters for four surface machining procedures (# 1–4), performed by an industrial CNC facility.
#Cut Velocity (mm/s)Feed Rate per Tooth (mm/s)Rotations (1/s)Infeed
(mm)
Feed Rate (mm/s)Tool
1500.059950.05190hard metal radius, Ø16 mm, 4 teeth, rolling
2500.089950.15318hard metal radius, Ø16 mm, 4 teeth, pitch 20°
31000.075100.15178knife head, Ø63 mm, 5 × 45° E-M plates
4800.14050.15202knife head, Ø63 mm, 5 × 45° K-MM plates
Table 5. Preparation and fabrication details of the surface contamination study. The different surface treatments are denoted as T0–T8.
IDSurface Treatment/Preparation/Condition
T0Reference surface = dry milled, similar to procedure # 4 in Table 4,
then immediately sealed by EB-welding
T1Reference surface, 24 h in humidor (70% rel. humidity), then EB-welded
T2Reference surface, 48 h in humidor (70% rel. humidity), then EB-welded
T3Reference surface, 72 h in humidor (70% rel. humidity), then EB-welded
T4Reference surface, 14 days in humidor (70% rel. humidity), then EB-welded
T5Reference surface, sealing with WD40 (spray oil),
14 days in humidor (70% rel. humidity), cleaning with isopropanol in ultrasonic bath and drying with wipes, then EB-welded
T6Reference surface, sealing with WD40 (spray oil),
14 days in humidor (70% rel. humidity), cleaning with soap and drying with wipes, then EB-welded
T7Surface milled with coolant (industrial standard), drying with wipes, then EB-welded
T8Surface milled with coolant (industrial standard), cleaning with isopropanol in ultrasonic bath and drying with wipes, then EB-welded
Table 6. High heat flux fatigue test sequences for the mock-up in the Helium Loop at KIT (HELOKA) facility.
Test SequenceCycles Heat Flux
(MW/m2)
Pulse Length (on/off)Surface
Temperature
#11000.7 2 min/2 min~550 °C
#21000.8 2 min/2 min~600 °C
#31000.9 2 min/2 min~650 °C
#470.9 2 h/>2 min~650 °C
Table 7. Estimated diffusion lengths and diffusivity values for chromium and carbon in EUROFER and 13% Cr ODS steel at 1100 °C according to Equations (1) and (2). Note: At this temperature, EUROFER steel is in the austenitic phase. For chromium diffusion in ferrite and austenite, D0 of 0.15 and 1.11 × 10⁻⁷ m2/s, and for F/(kT) values of 26.38 and 17.4 were used. For carbon diffusion in ferrite and austenite, D0 of 0.02 cm2/s, and for F/(kT) values of 7.38 and 9.8 were applied (see [45,46,47]).
1100 °C
in
Diffusivity D,
Chromium
ld after 2–3 h,
Chromium
Diffusivity D,
Carbon
ld after 2–3 h,
Carbon
ODS steel0.5 µm2/s60–75 µm1250 µm2/s3–3.7 mm
EUROFER0.003 µm2/s4.5–5.5 µm109 µm2/s0.9–1.1 mm
Publisher’s Note: MDPI stays neutral with regard to jurisdictional claims in published maps and institutional affiliations.

