Article

Application of a Geotextile in the Treatment of Post-Subsidence in Karst Areas

1
School of Architecture and Transportation Engineering, Guilin University of Electronic Technology, Guilin 541004, China
2
Sinohydro Bureau 5 Co., Ltd., Chengdu 610061, China
3
China Nuclear Industry 23 Construction Co., Ltd., Beijing 101300, China
*
Author to whom correspondence should be addressed.
Appl. Sci. 2021, 11(24), 11826; https://doi.org/10.3390/app112411826
Submission received: 7 November 2021 / Revised: 4 December 2021 / Accepted: 8 December 2021 / Published: 13 December 2021
(This article belongs to the Special Issue Advances in Geosynthetics)

Abstract

:
The use of a geotextile to treat subgrade subsidence after subsidence has occurred is investigated in this paper. To optimize the anchorage length and buried depth of the geotextile and evaluate the influences of the two factors on subgrade subsidence treatment, finite element analysis is performed and validated with existing model tests. The soil pressure, displacement, tensile force and deformation of the geotextile are studied. The results showed that the geotextile prevented an upward development of subsidence and stabilized the upper soil. The increase of the anchorage length of the geotextile transferred greater soil pressure from the subsidence to a stable area, induced a greater tensile force in the geotextile, and resulted in less soil displacement. As the anchorage length of the geotextile increased from 375 mm to 1500 mm, the surface settlement was effectively reduced from 1.05% to 34.18% when comparing to the situation without a geotextile. As the buried depth of the geotextile increased from 2 m to 6 m, the percentage of surface settlement was effectively reduced from 29.14% to 65.91% when comparing with the settlement corresponding to a buried depth of 2 m. It is suggested that the anchorage length of a geotextile should be the length of the subsidence with respect to width and that the buried depth of the geotextile should be 3–4 m for subsidence treatment. This provides insight into the treatment of sinkholes using geosynthetic approaches in karst areas.

1. Introduction

Sinkhole hazards in karst areas have been identified throughout the world and cause serious damage to infrastructure [1,2,3,4,5,6]. Measures used to mitigate sinkhole hazards, such as soil-filling, grouting, or the use of deep foundations can be time-consuming and costly [7,8,9]. To overcome these disadvantages, geosynthetic products have been increasingly used to create reinforced soil structures [10,11,12] and have been used as reinforcement layers to treat subsidence caused by sinkholes. A geosynthetic product acts as tensioned membrane that is combined with soil aching to support the upper soil mass [13,14,15,16], which has proven to be an effective alternative measure.
The application of geosynthetic reinforcement has been in use since the early 1980′s to support the bases of embankments constructed in areas prone to void changes [17]. Numerous experimental and numerical studies have been conducted regarding the mechanisms of geosynthetics in bridging sinkholes to support the soil mass over a sinkhole. In experimental studies, Tano et al. [18] carried out a new large-scale test to assess the efficiency of geosynthetic reinforcement with respect to the limitation of deformation with a geosynthetic lining system (GLS) over a cavity 0.5 m in width and found that the different spatial distribution of the strain between the geomembrane and geogrid was due to the conical shape of the collapsed zone. Huckert et al. [19] studied the load transfer mechanisms of a geosynthetic over a circular cavity under cyclic loading with full-scale experiments, finding that the geosynthetic, with progressive deformation, had a parabolic shape when it reinforced the granular soil. Sireesh et al. [20] observed that a geocell mattress could substantially increase the bearing capacity and reduce the settlement of a clay subgrade with a void through a model test. It was pointed out that the geocell mattress should spread beyond the void at least a distance equal to the diameter of the void. Le et al. [15] found that the deformation of a geosynthetic basal reinforcement approximated a parabolic or circular curve by model tests of subsidence with reinforced soil over a void.
In numerical studies, Tran et al. [21] conducted three-dimensional analysis of geogrid-reinforced soil, finding that the geogrid layer prevented the soil from caving into the induced void and improved the fill stability. Lawson and Yee [22] observed that the serviceability for a reinforced basal embankment spanning a void was primarily related to the embankment height to void width ratio when using modeling established by the finite difference software program FLAC 2D. Villard et al. [23] demonstrated that the cavity opening mode has a great influence on the shape of the load transferred to the geosynthetic sheet above a cavity by testing two numerical processes. Lai et al. [24] found that the amount of soil arching caused by differential settlement in a low geosynthetic-reinforced (LGR) embankment increased with an increasing embankment height (H < 3 m) when using finite element analysis combined with a normalization method.
Theoretical studies regarding geosynthetic reinforcements subjected to localized sinkholes have also been conducted, where Galve et al. [25,26] studied an optimization scheme for treating sinkholes with geosynthetics based on cost–benefit analyses. Giroud et al. [16] provided a more complete approach combining tensioned membrane theory (for the geosynthetic) with arching theory (for the soil layer) to design geosynthetic system designed for a soil layer to span a void. Chen et al. [27] proposed a new calculation method for spanning a trench void using a geosynthetic, discovering that the vertical displacement and strain of the geosynthetic increase with an increase in the void width. Villard and Briançon [28] considered the displacement of a geosynthetic in the anchorage areas on either side of a cavity with a proposed analytical method. Feng et al. [29,30] proposed new analytical models to predict the load and membrane effect acting on a geosynthetic overlying a void, observing that minimal soil pressure acting on the geosynthetic existed under an optimal subsidence width, where they further determined the maximum geosynthetic strain and the maximum surface settlement.
The geogrid and geocell, which are commonly used as treatment measures, are set at the bottom of the subgrade above a sinkhole before subsidence occurs; however, the use of a geosynthetic for post-subsidence treatment has rarely been reported. To obtain sufficient tensile strength to ensure the stability of the newly reinforced soil structure and achieve appropriate porosity, thus ensuring a prerequisite osmotic coefficient and preventing the loss of soil particles, the use of a geotextile is proposed for post-subsidence treatment. In this paper, it is proposed that the geotextile lays above the sinkhole as a kind of reinforcement material in the process of soil filling after the subgrade subsidence has occurred. Since the geotextile transfers greater soil stress to the stable area from the subsidence area by the tensioned membrane effect and soil arching effect, the stability of the newly reinforced soil structure may be increased.
The optimization of the buried depth and specific geotextile was explored through numerical modeling with eleven different conditions and was conducted via finite element analysis with the PLAXIS 2D software package. By comparing the numerical test results with model test results, the soil pressure, displacement of soil, tensile force, and the geotextile deformation are analyzed to explore the effects of the anchorage length and buried depth on the treatment of subsidence after it has occurred.

2. Research Methodology

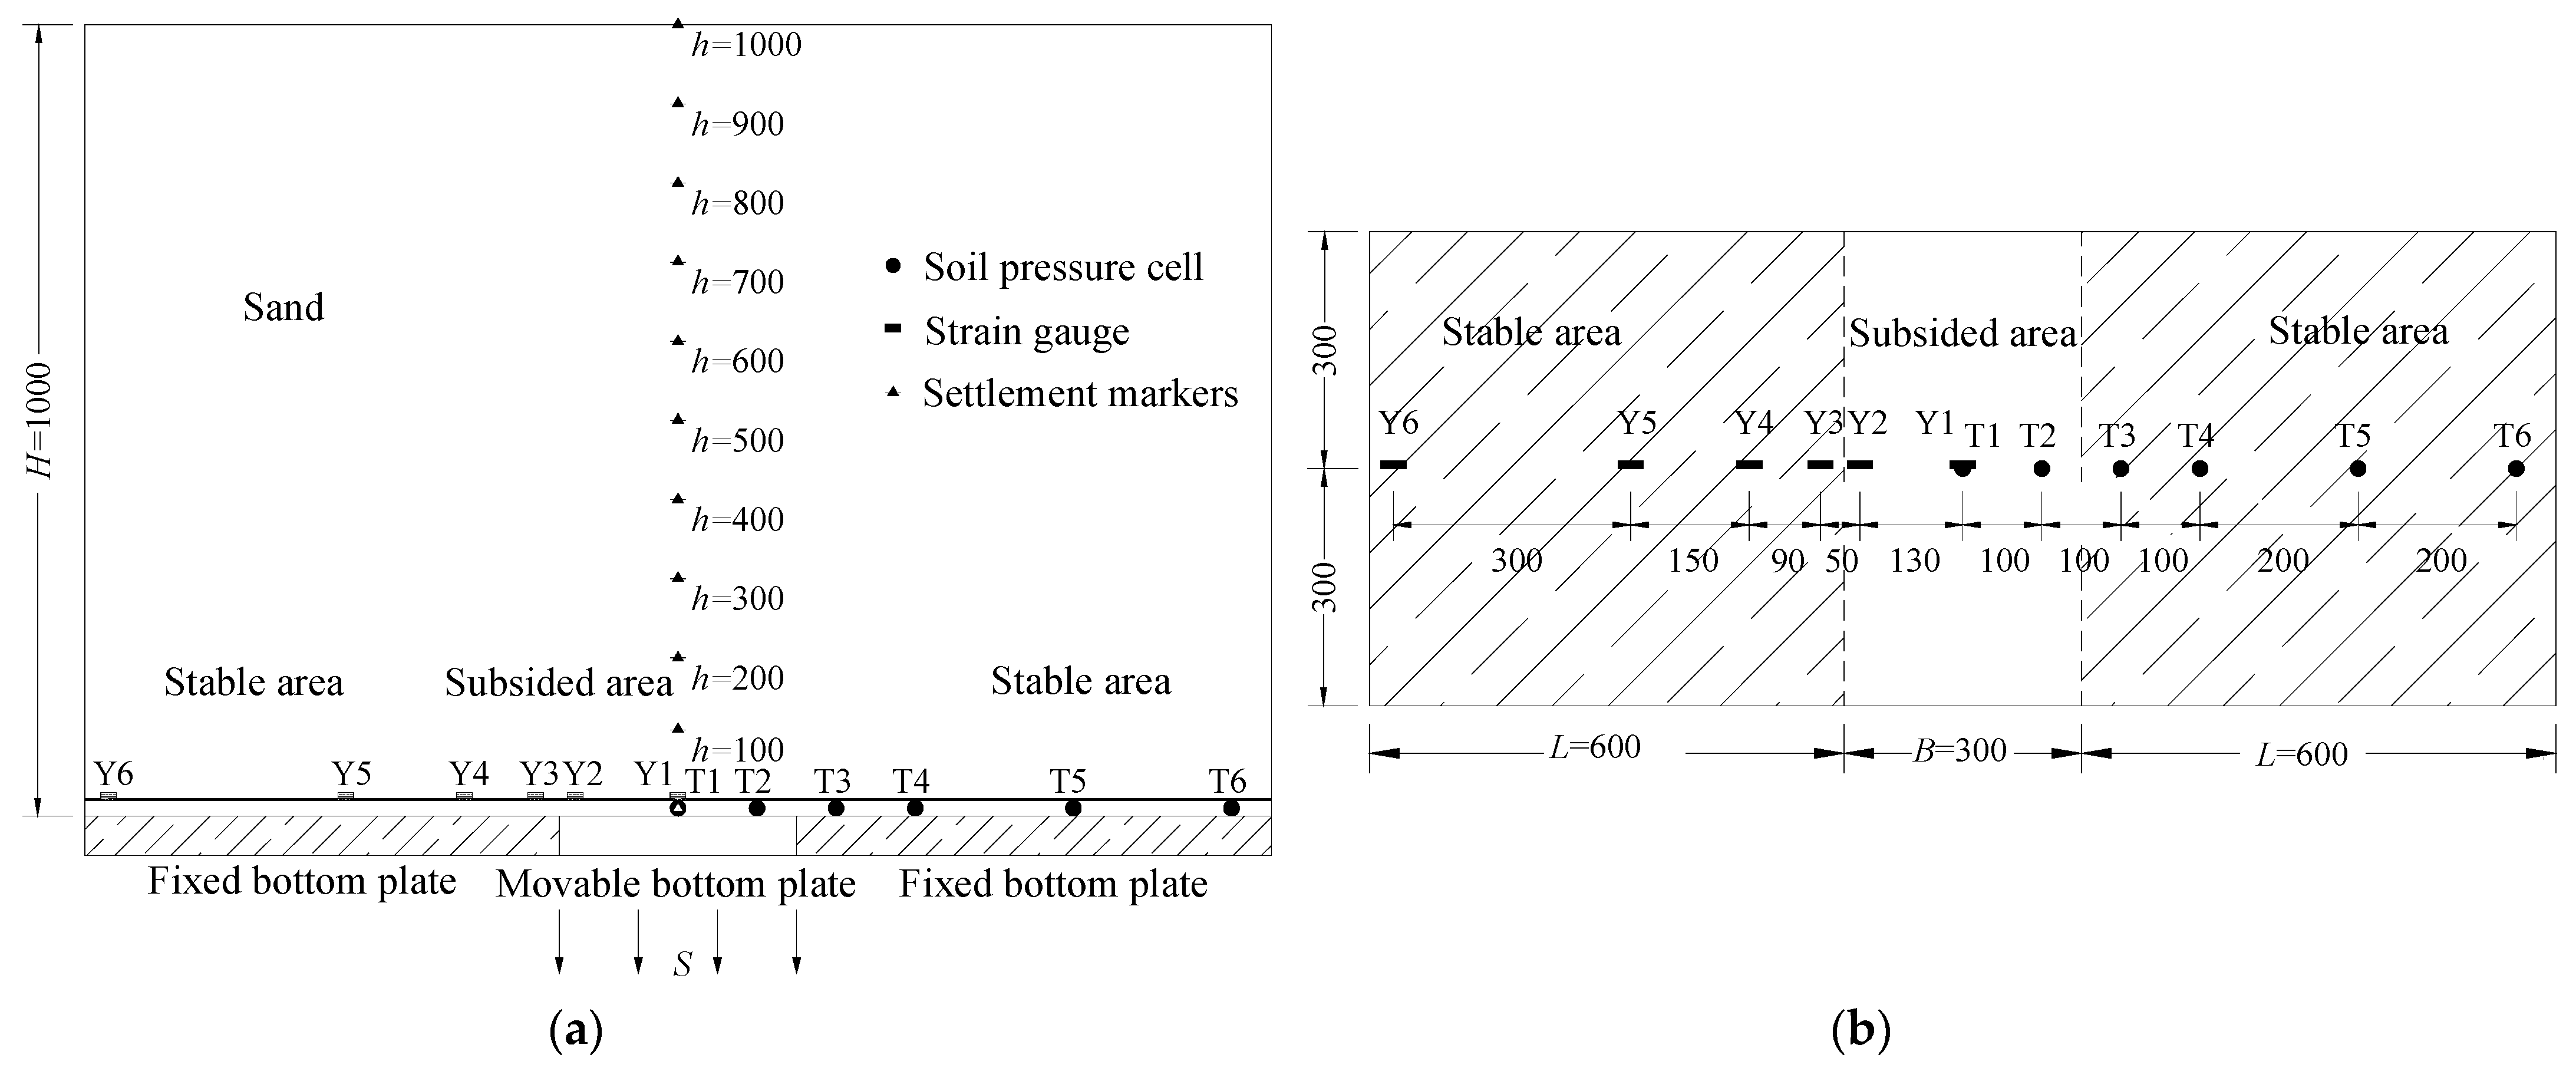
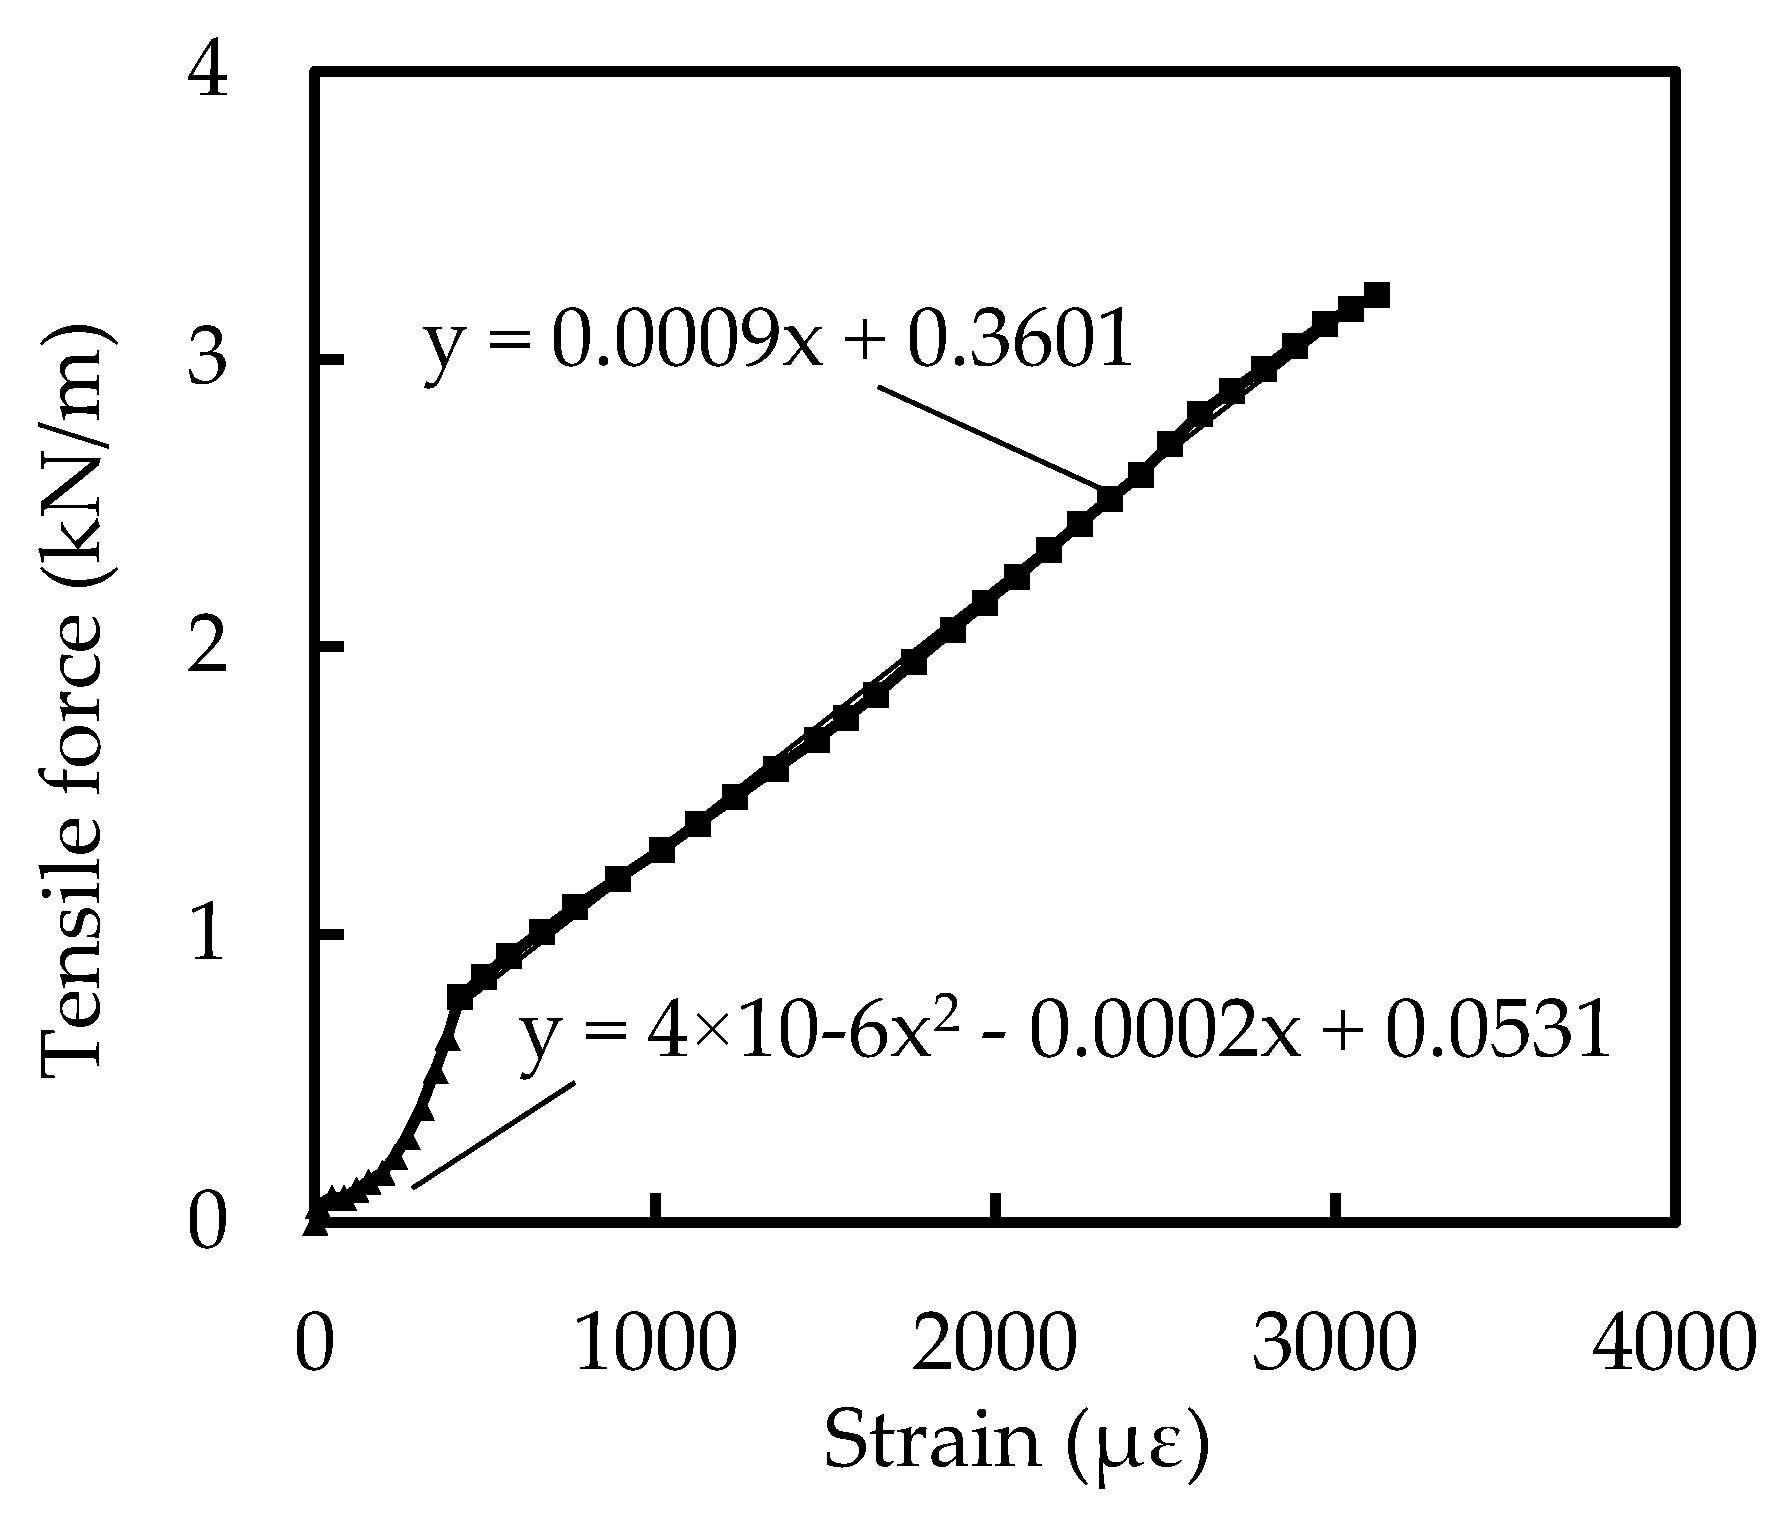
2.1. Large-Scale Model Test

To evaluate the influence of the anchorage length and buried depth of a given geotextile on the treatment of subgrade subsidence in karst areas, large-scale model tests have been conducted by Wu et al. [31,32]. The sinkhole prototype used in this work was that used for a project regarding the treatment of subgrade subsidence at Xihuan Road in Hechi City, Guangxi, China. The dimensions of the subsidence were 1.5 m in length, 1.2 m in width, and 4 m in depth. The site consisted of sandy soil. A large model test box with an effective volume of 1.5 m × 0.6 m × 1.5 m (length × width × depth) was used in the model tests. It consisted of a main frame made of channel steel and a front side made of tempered glass with a thickness of 25 mm to observe the soil deformation by using particle image velocimetry (PIV) equipment. The similarity ratio of the scale model was 1:5, corresponding to a scaling factor N of 5.0. The physical quantities of the model and prototype would satisfy Equation (1) based on the similarity analysis given by Westine et al. [33].
Ip = NIm
where Ip denotes the physical quantities of the prototype, Im denotes the physical quantities of the model, and N is the scaling factor. Table 1 lists the common scaling factors in the scale model test.
The soil used in the model test was sand from Li River in Guilin and had a density of 1.68 g/cm3, a moisture content of 1.03%, a cohesion value of 0.2 kPa, and an internal friction angle of 32.8°. It was suggested by Wang et al. [34] that gauze is a reasonable substitute for a geotextile prototype according to a similarity criterion. The medical gauze considered had a tensile strength of 3.22 kN/m and a tensile stiffness of 48 kN/m. The thickness of the medical gauze was 0.16 mm and the weight per unit area was 60 g/m2. Due to the similar values of property parameters with a prototype geotextile according to the similarity factors (Table 1), the medical gauze was chosen to simulate a prototype geotextile in the large-scale model tests.
Table 2 lists the large-scale model tests conducted by Wu et al. [31,32]. The subsidence width B was set as 300 mm for the model test according to the dimension of the prototype and the scaling factor N was equal to 5.0. Tests T1, T2, T3, and T4 represent tests with anchorage lengths for the geotextile (denoted as L) of 600 mm, 300 mm, 150 mm, and 75 mm, respectively, which were conducted to study the effect of the anchorage length of the geotextile on the treatment of subsidence [31]. The anchorage ratio L/B in Table 2 is the ratio of the anchorage length of geotextile L to the subsidence width B. Test T5 was a parallel test conducted without a geotextile, and thus the anchorage ratio L/B equals 0. By comparing test T5 with T1 to T4, the effect of the use of a geotextile was evaluated. Comparing with test T1, test T6 was conducted with a buried depth of 500 mm to study the effect of the buried depth of the geotextile on the treatment of subsidence, as shown in Table 2 [32].
Figure 1 shows the model size (unit: mm) and layout of instruments including six earth pressure cells and six strain gauges in every model, and more details could be found in the work by Wu et al. [31,32]. Soil pressure cells T1, T2, T3, T4, T5 and T6 were placed at the distance of 0 mm, 100 mm, 200 mm, 300 mm, 500 mm and 700 mm, respectively from the center of the subsidence area, which were used to measure the soil pressure beneath the geotextile. Strain gauges Y1, Y2, Y3, Y4, Y5 and Y6 monitored on the model geotextile (i.e., medical gauze) were located at the distance of 0 mm, 130 mm, 180 mm, 270 mm, 420 mm and 720 mm, respectively from the center of the subsidence area. In this study, the strain of model geotextile pasted strain gauges were measured and converted to the tensile force of model geotextile (See Figure 2). The settlement markers were applied to acquire the vertical displacement of soil.
During the subsidence simulation, which was controlled by a movable bottom plate, an earth pressure cell and strain gauges were used to measure the vertical stress of the soil and the deformation of the geotextile, respectively. Additionally, the displacement of a settlement device was monitored by a displacement sensor and the displacement of soil was captured by particle image velocimetry (PIV) equipment.

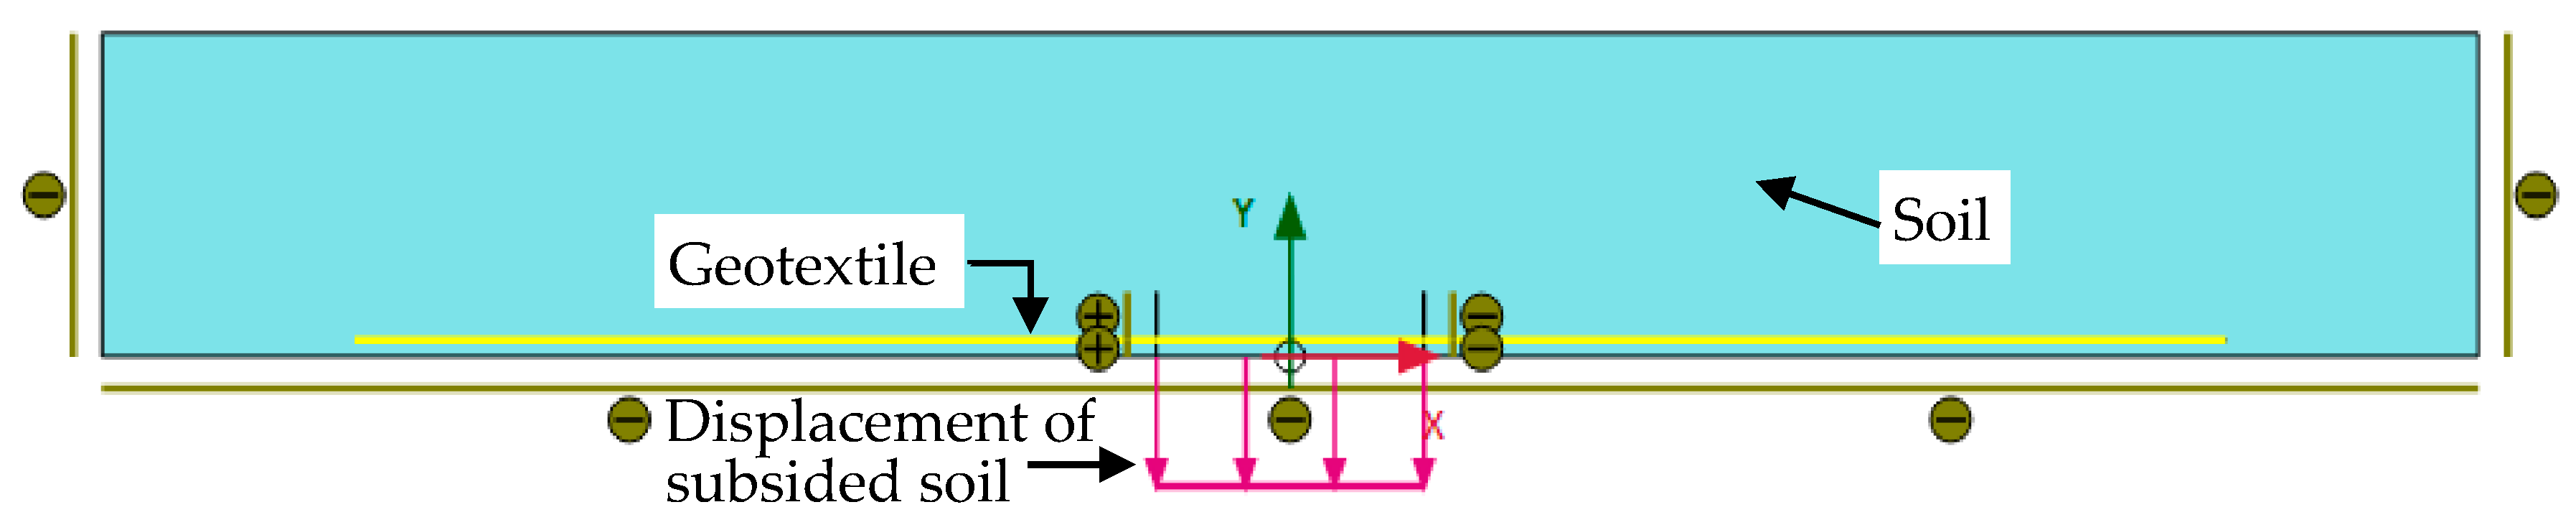
2.2. Numerical Modeling

To study the influence of the anchorage length and the buried depth of the geotextile on the treatment effect of subgrade subsidence in karst areas, a numerical model (shown in Figure 3) was established based on the prototype of subgrade subsidence. Triangular fifteen-node solid elements were used to represent the soil element and a Mohr–Coulomb constitutive model with a drainage condition was used. The geotextile was modeled as an elastoplastic using the line elements of the geogrid. In Table 3, the material parameters of the soil and geotextile are shown. The interface coefficient between the geogrid and soil was set as 0.9. The displacement of the subsided soil in the subsidence area beneath the geotextile was specified to simulate the subsidence shown in Figure 3. The size of the numerical model was 40 m × 5 m (length × depth) and the subsidence width was 1.5 m. To minimize the boundary effect, the length of the numerical model was greater than the scale model. The horizontal displacement was constrained at both lateral boundaries. Both the horizontal and vertical displacement were constrained at the bottom boundary.
Table 4 lists a total number of 11 numerical models. The subsidence width B of 1500 mm, which is the same as the prototype, was used in the numerical modeling. In Table 4, to study effect of the anchorage length of geotextile on the treatment of subsidence, numerical models M1 to M6 were constructed with anchorage lengths of the geotextile (L) of 0 mm, 375 mm, 525 mm, 750 mm, 1125 mm, and 1500 mm, respectively. The corresponding anchorage ratios L/B for the six models were 0, 0.25, 0.35, 0.50, 0.75, and 1.00, respectively. To study effect of the buried depth of the geotextile on the treatment of subsidence, numerical models M7 to M11 featured different buried depths of the geotextile of 2000 mm, 3000 mm, 4000 mm, 5000 mm and 6000 mm, respectively.

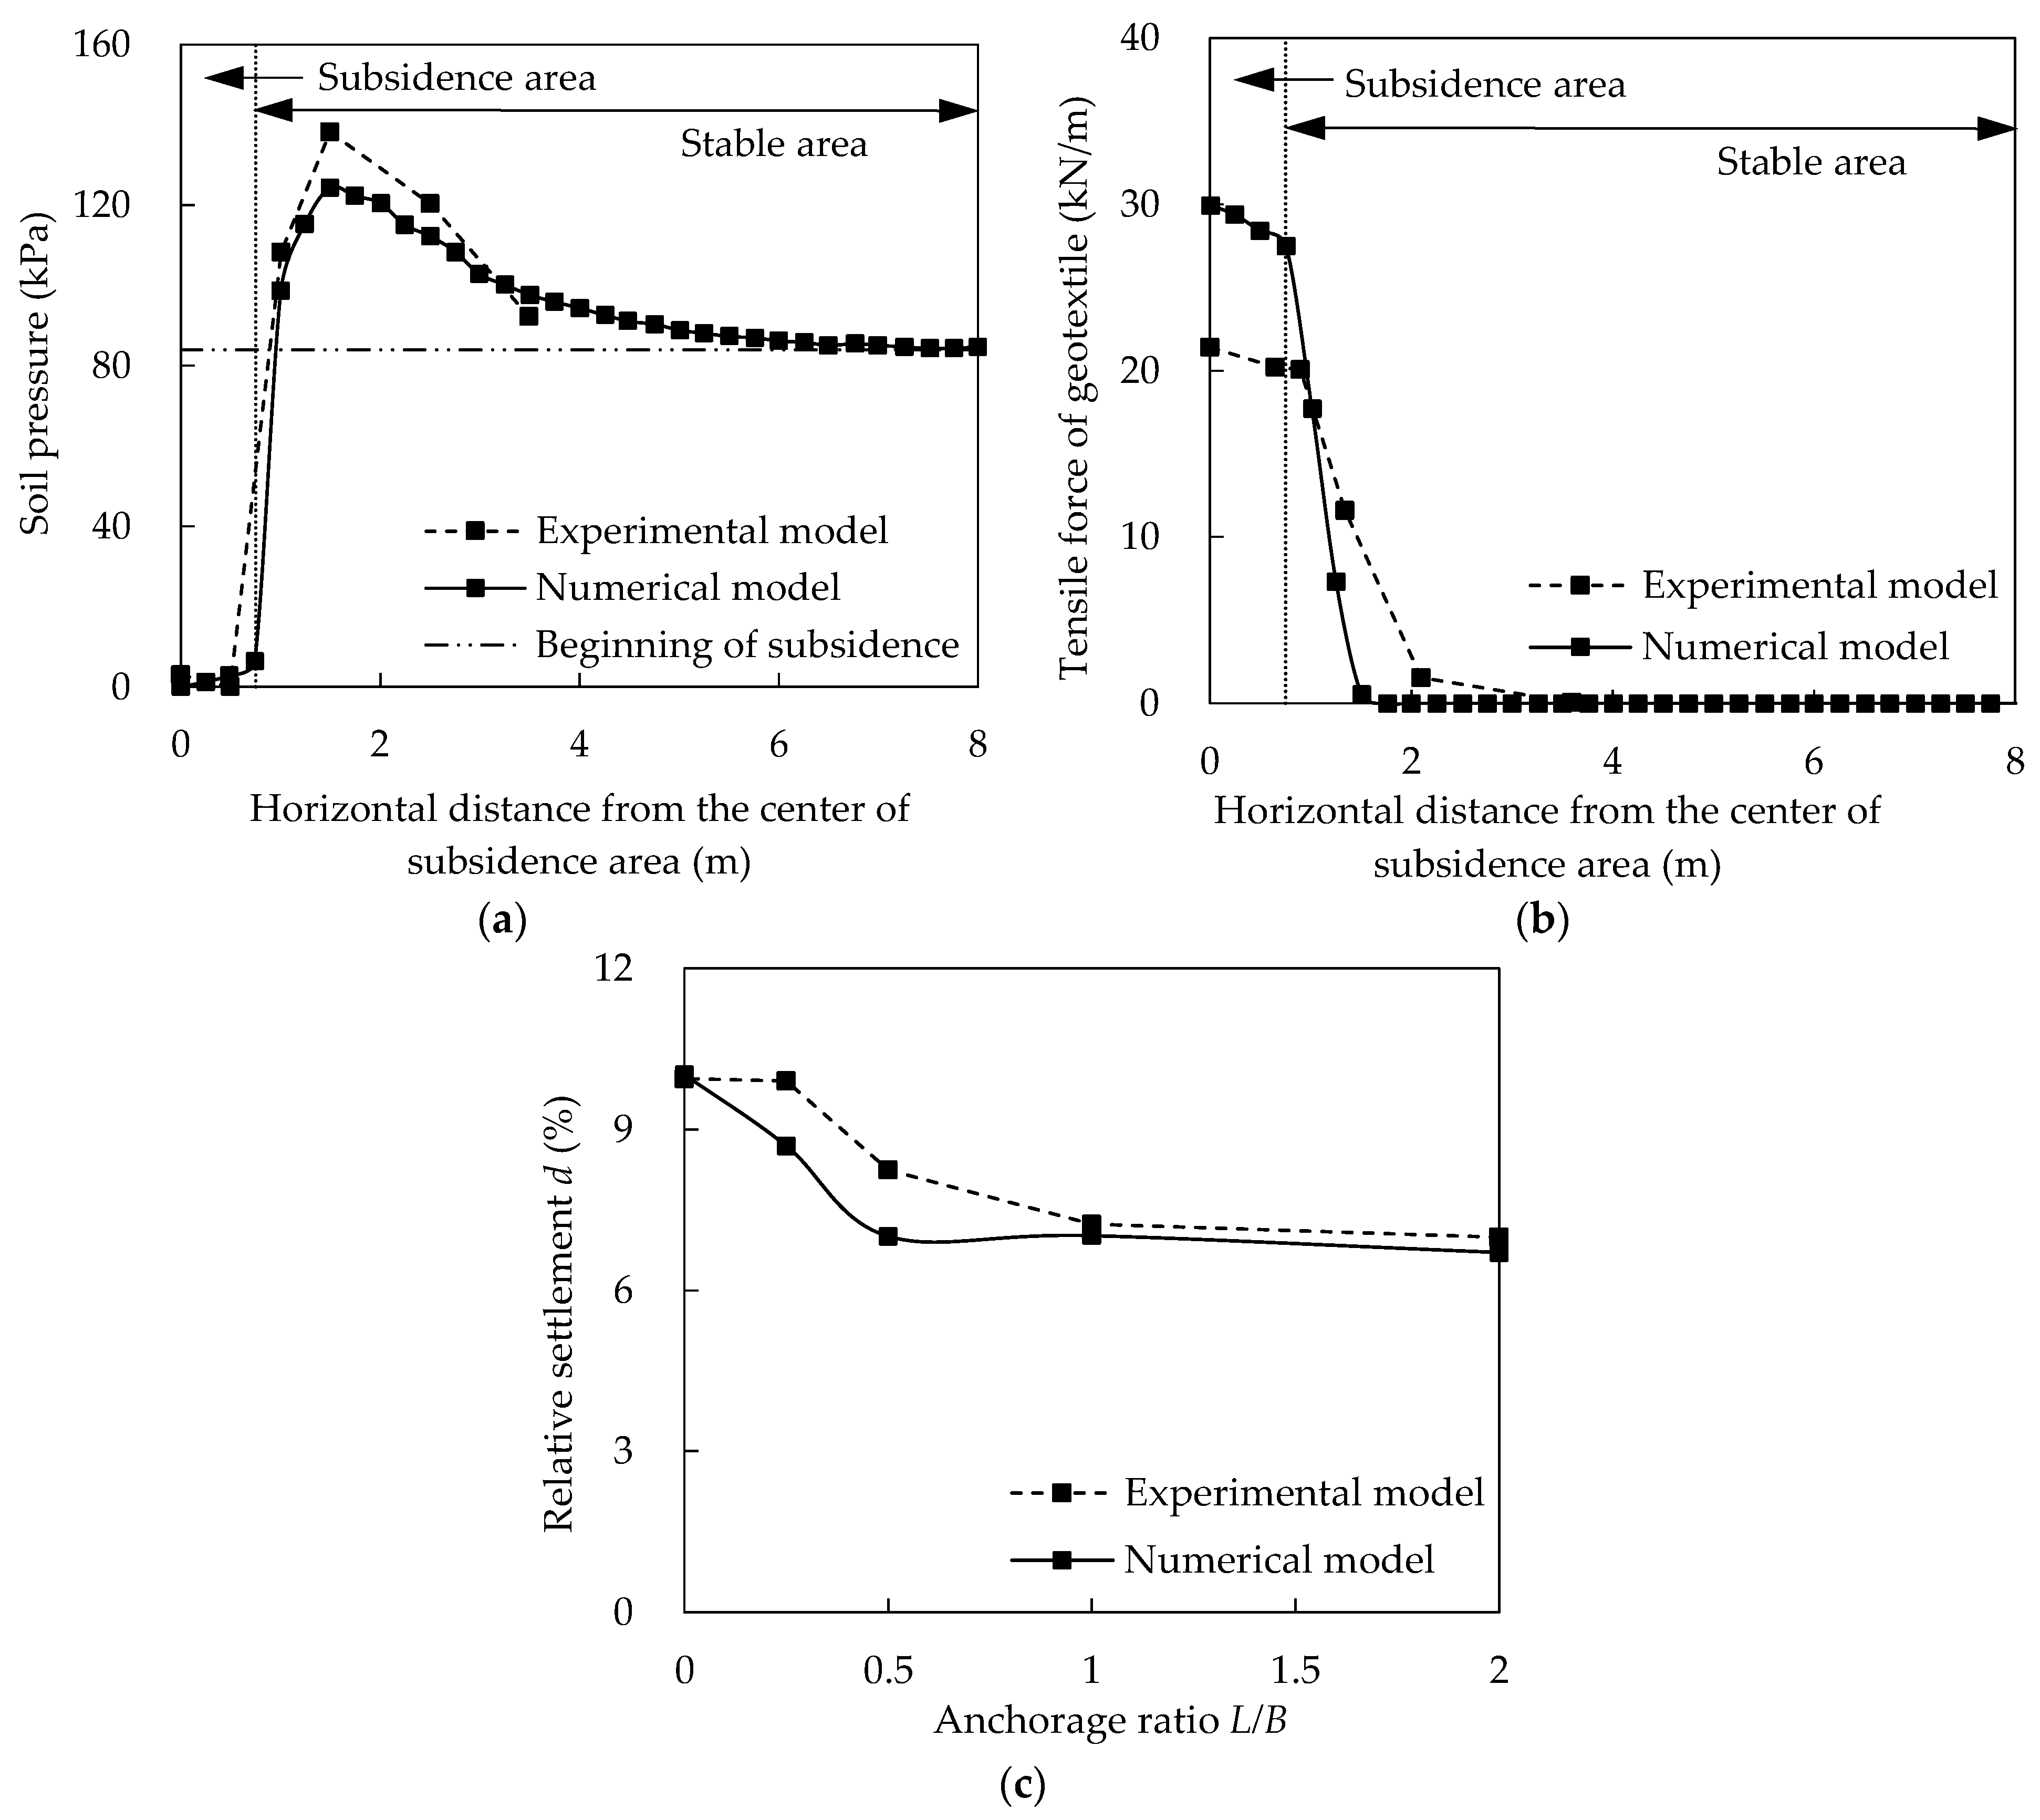
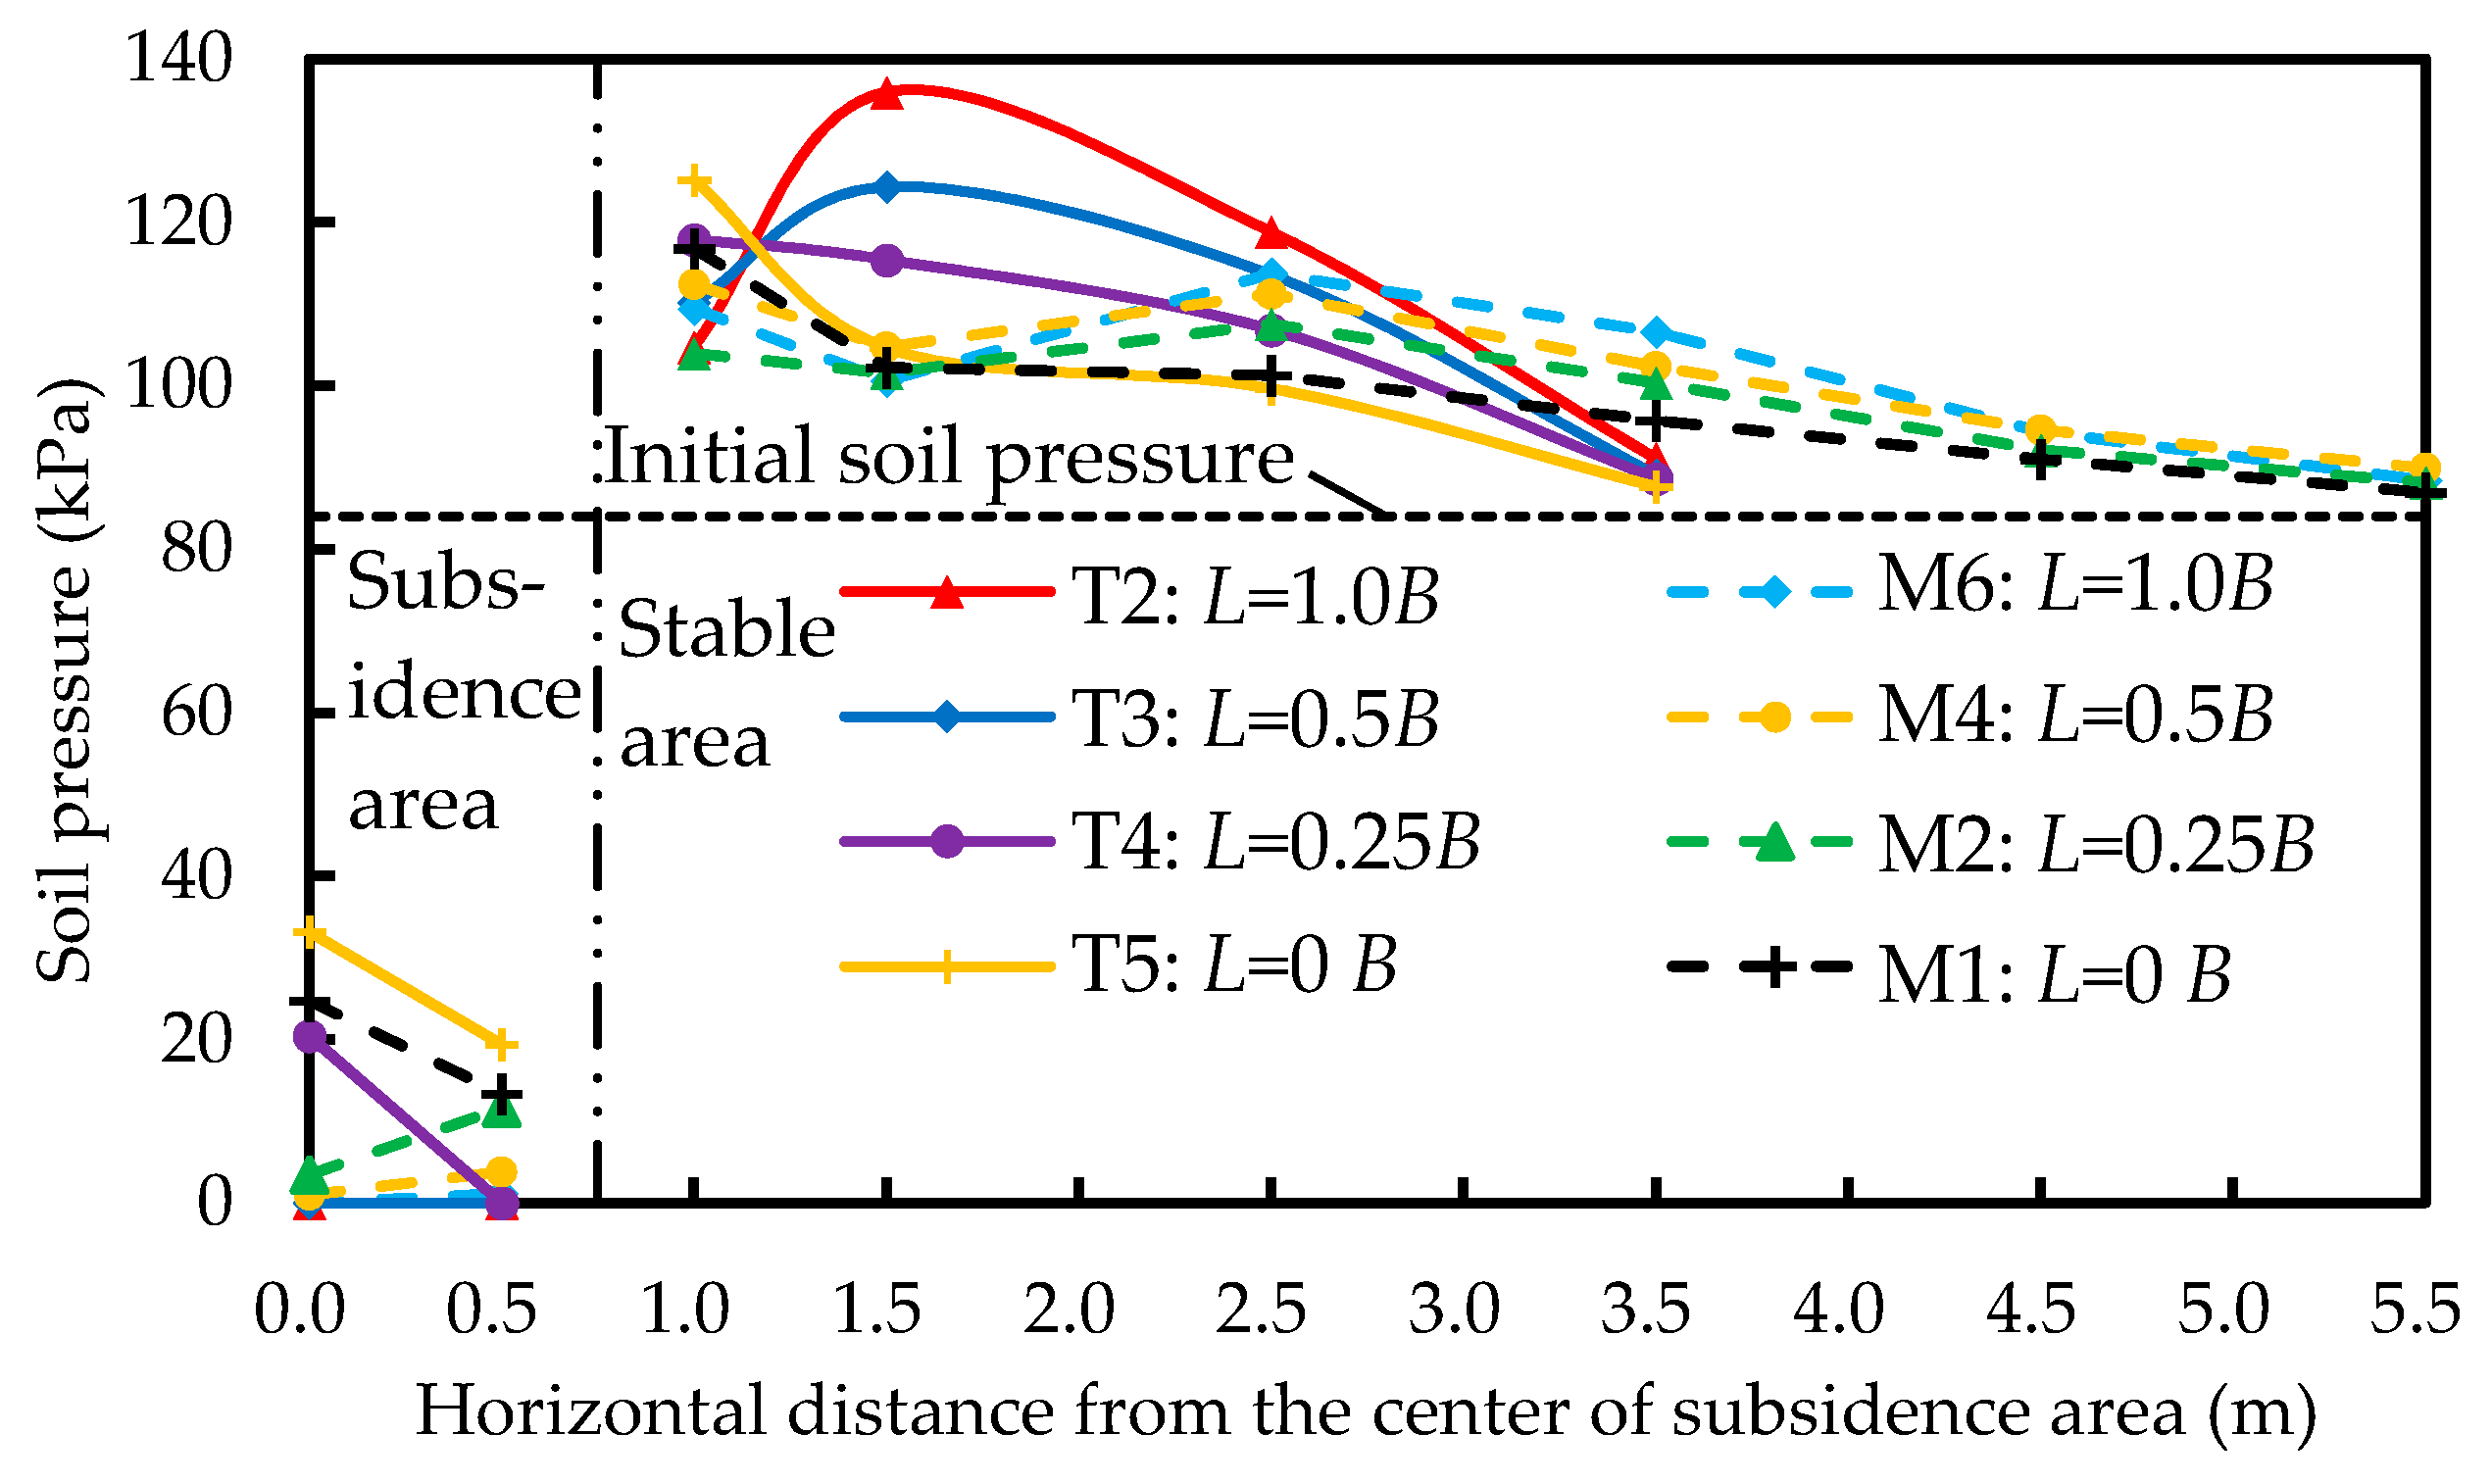
3. Validation of the Numerical Modeling

The numerical modeling was validated by scaled data based on similarity and the test data of the model test [31,32] by comparing the results of the soil pressure and the tensile force for the geotextile at different anchorage ratios L/B.
To quantify the settlement of soil beneath the geotextile as S, according to the subsidence width B, the relative settlement d was proposed in Equation (2):
d = S/B
where d is relative settlement as a percentage, S is the downward movement of the soil with respect to d in m, and B is the subsidence width in m.
Figure 4 shows the final state of the subsidence simulation for using a geotextile for the treatment of subsidence. In Figure 4a, the final state of the subsidence simulation in model test is shown, corresponding with the time that the movable bottom plate was separated from the model geotextile. The final relative settlement d for the anchorage length of the geotextile for L = 2.0B was 7% in the model test. Figure 4b shows the final state of the subsidence simulation in the numerical modeling. The subsided soil in the subsidence area beneath the geotextile separated from the geotextile when its displacement was specified as 100 mm, which was considered as the final state of the subsidence simulation. The final relative settlement d for the anchorage length of L = 2.0B was 6.7% in the numerical modeling, and the value was close to that of the model test.
Figure 5 presents a comparison between the results of the numerical modeling and model test at the final state of subsidence for the condition that L = 2.0B.
Figure 5a shows similar trends for the variation of soil pressure beneath the geotextile at L = 2.0B for the two tests. The soil pressure rapidly increased from zero at the subsidence area to the stable area and then gradually decreased in the stable area as the horizontal distance from the subsidence area increased.
Figure 5b shows a comparison of the tensile force for the geotextile at L = 2.0B between the two tests. Similar trends were observed for both the numerical test and model test. The tensile force of the geotextile in the subsidence area was greater than that in the stable area, and it decreased rapidly from subsidence area to the stable area.
Figure 5c illustrates a comparison of the relative settlement d for different anchorage ratios L/B of 0, 0.25, 0.5, 1.0, and 2.0 between the numerical tests and model tests. Similar relative settlements for the numerical simulation and model test results were observed for the condition that anchorage ratio L/B equals 0, 1.0, and 2.0. For the other two conditions, i.e., anchorage ratio L/B equal to 0.25 and 0.5, the model test had a greater relative settlement than the numerical test. Overall, the variations of the soil pressure, tensile force and the relative settlement for the numerical modeling were consistent with those of the model test.

4. Results and Discussion

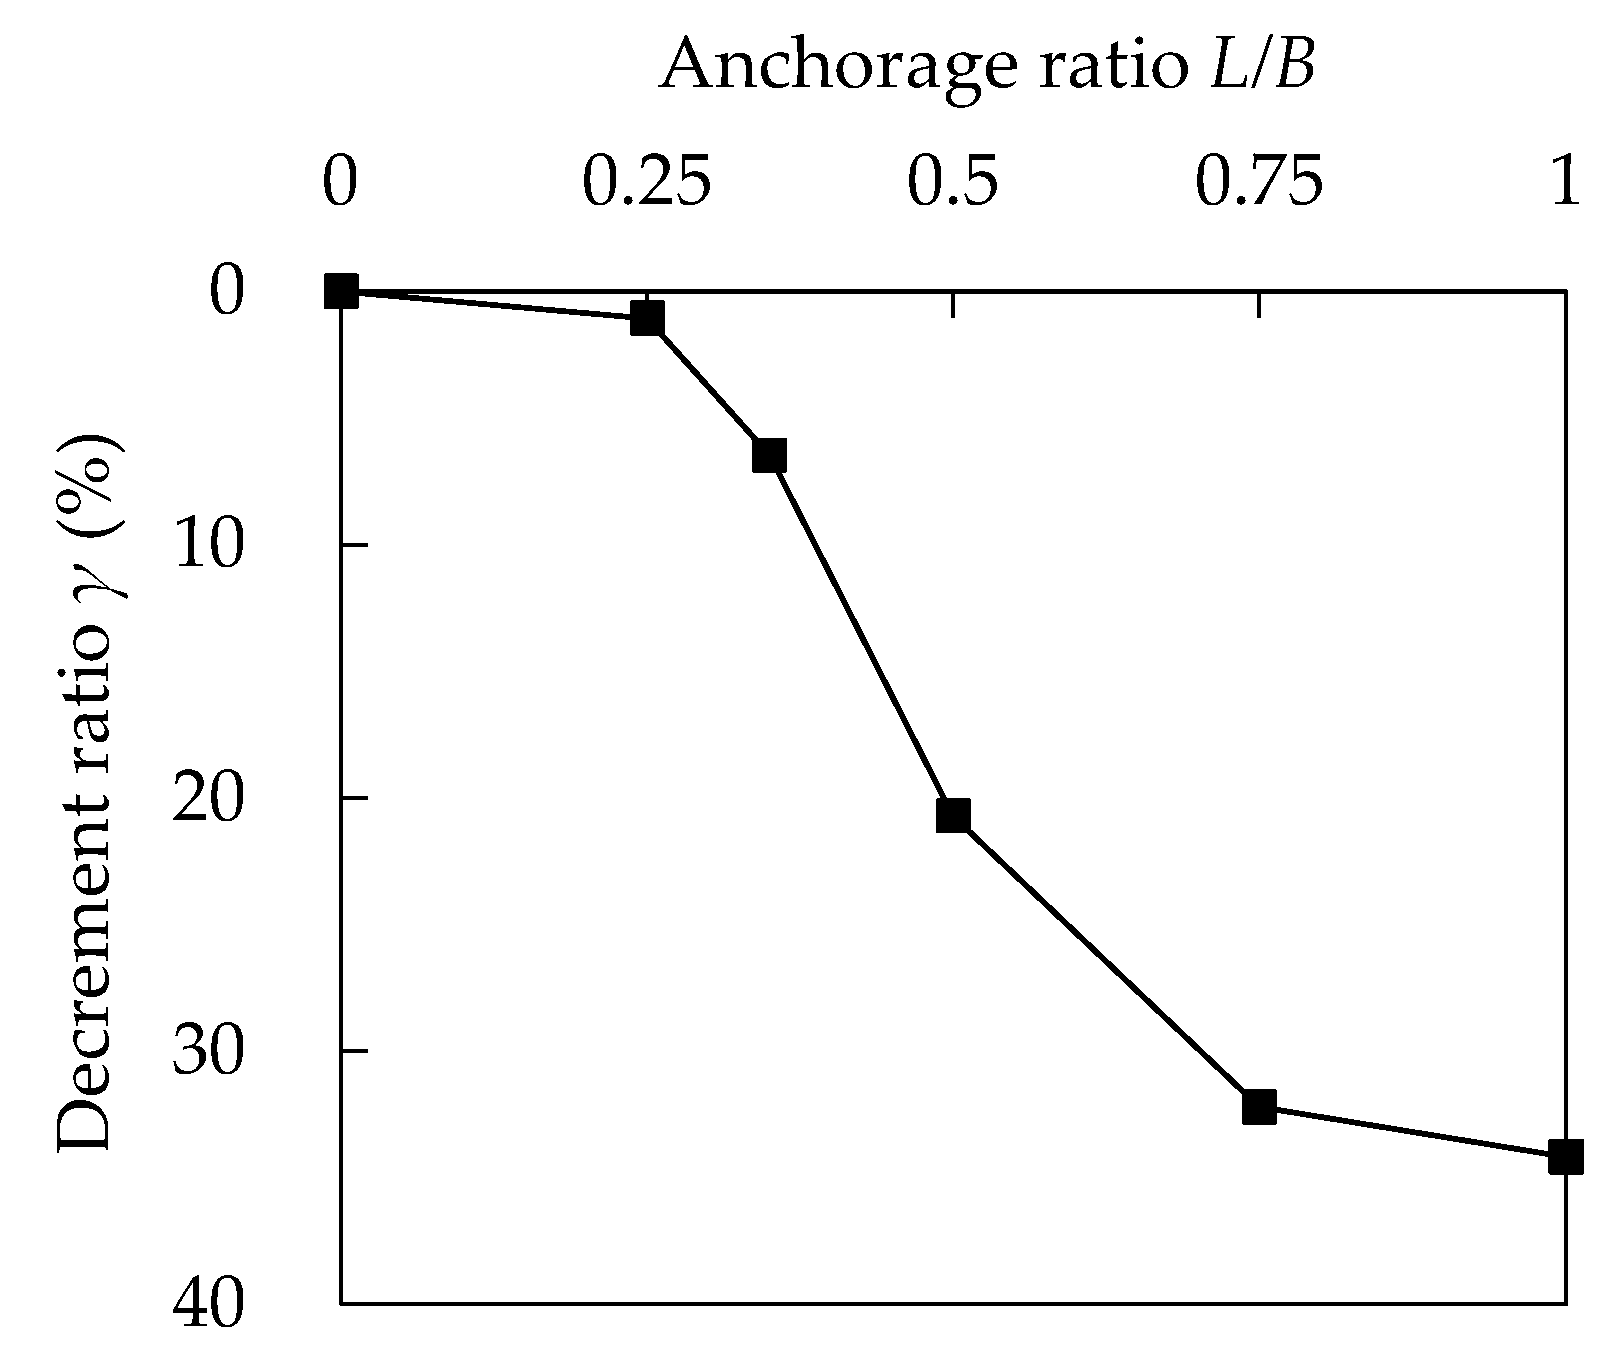
4.1. Effects of Anchorage Length of Geotextile

The anchorage length of the geosynthetic is a key factor [30]. Numerical models M1 to M6, having anchorage ratios L/B of 0, 0.25, 0.35, 0.50, 0.75, and 1.0, respectively, were used to investigate the effects of the anchorage length of the geotextile on the treatment of subsidence by presenting the soil pressure, tensile force and deformation of geotextile, and soil displacement at the final state of subsidence.

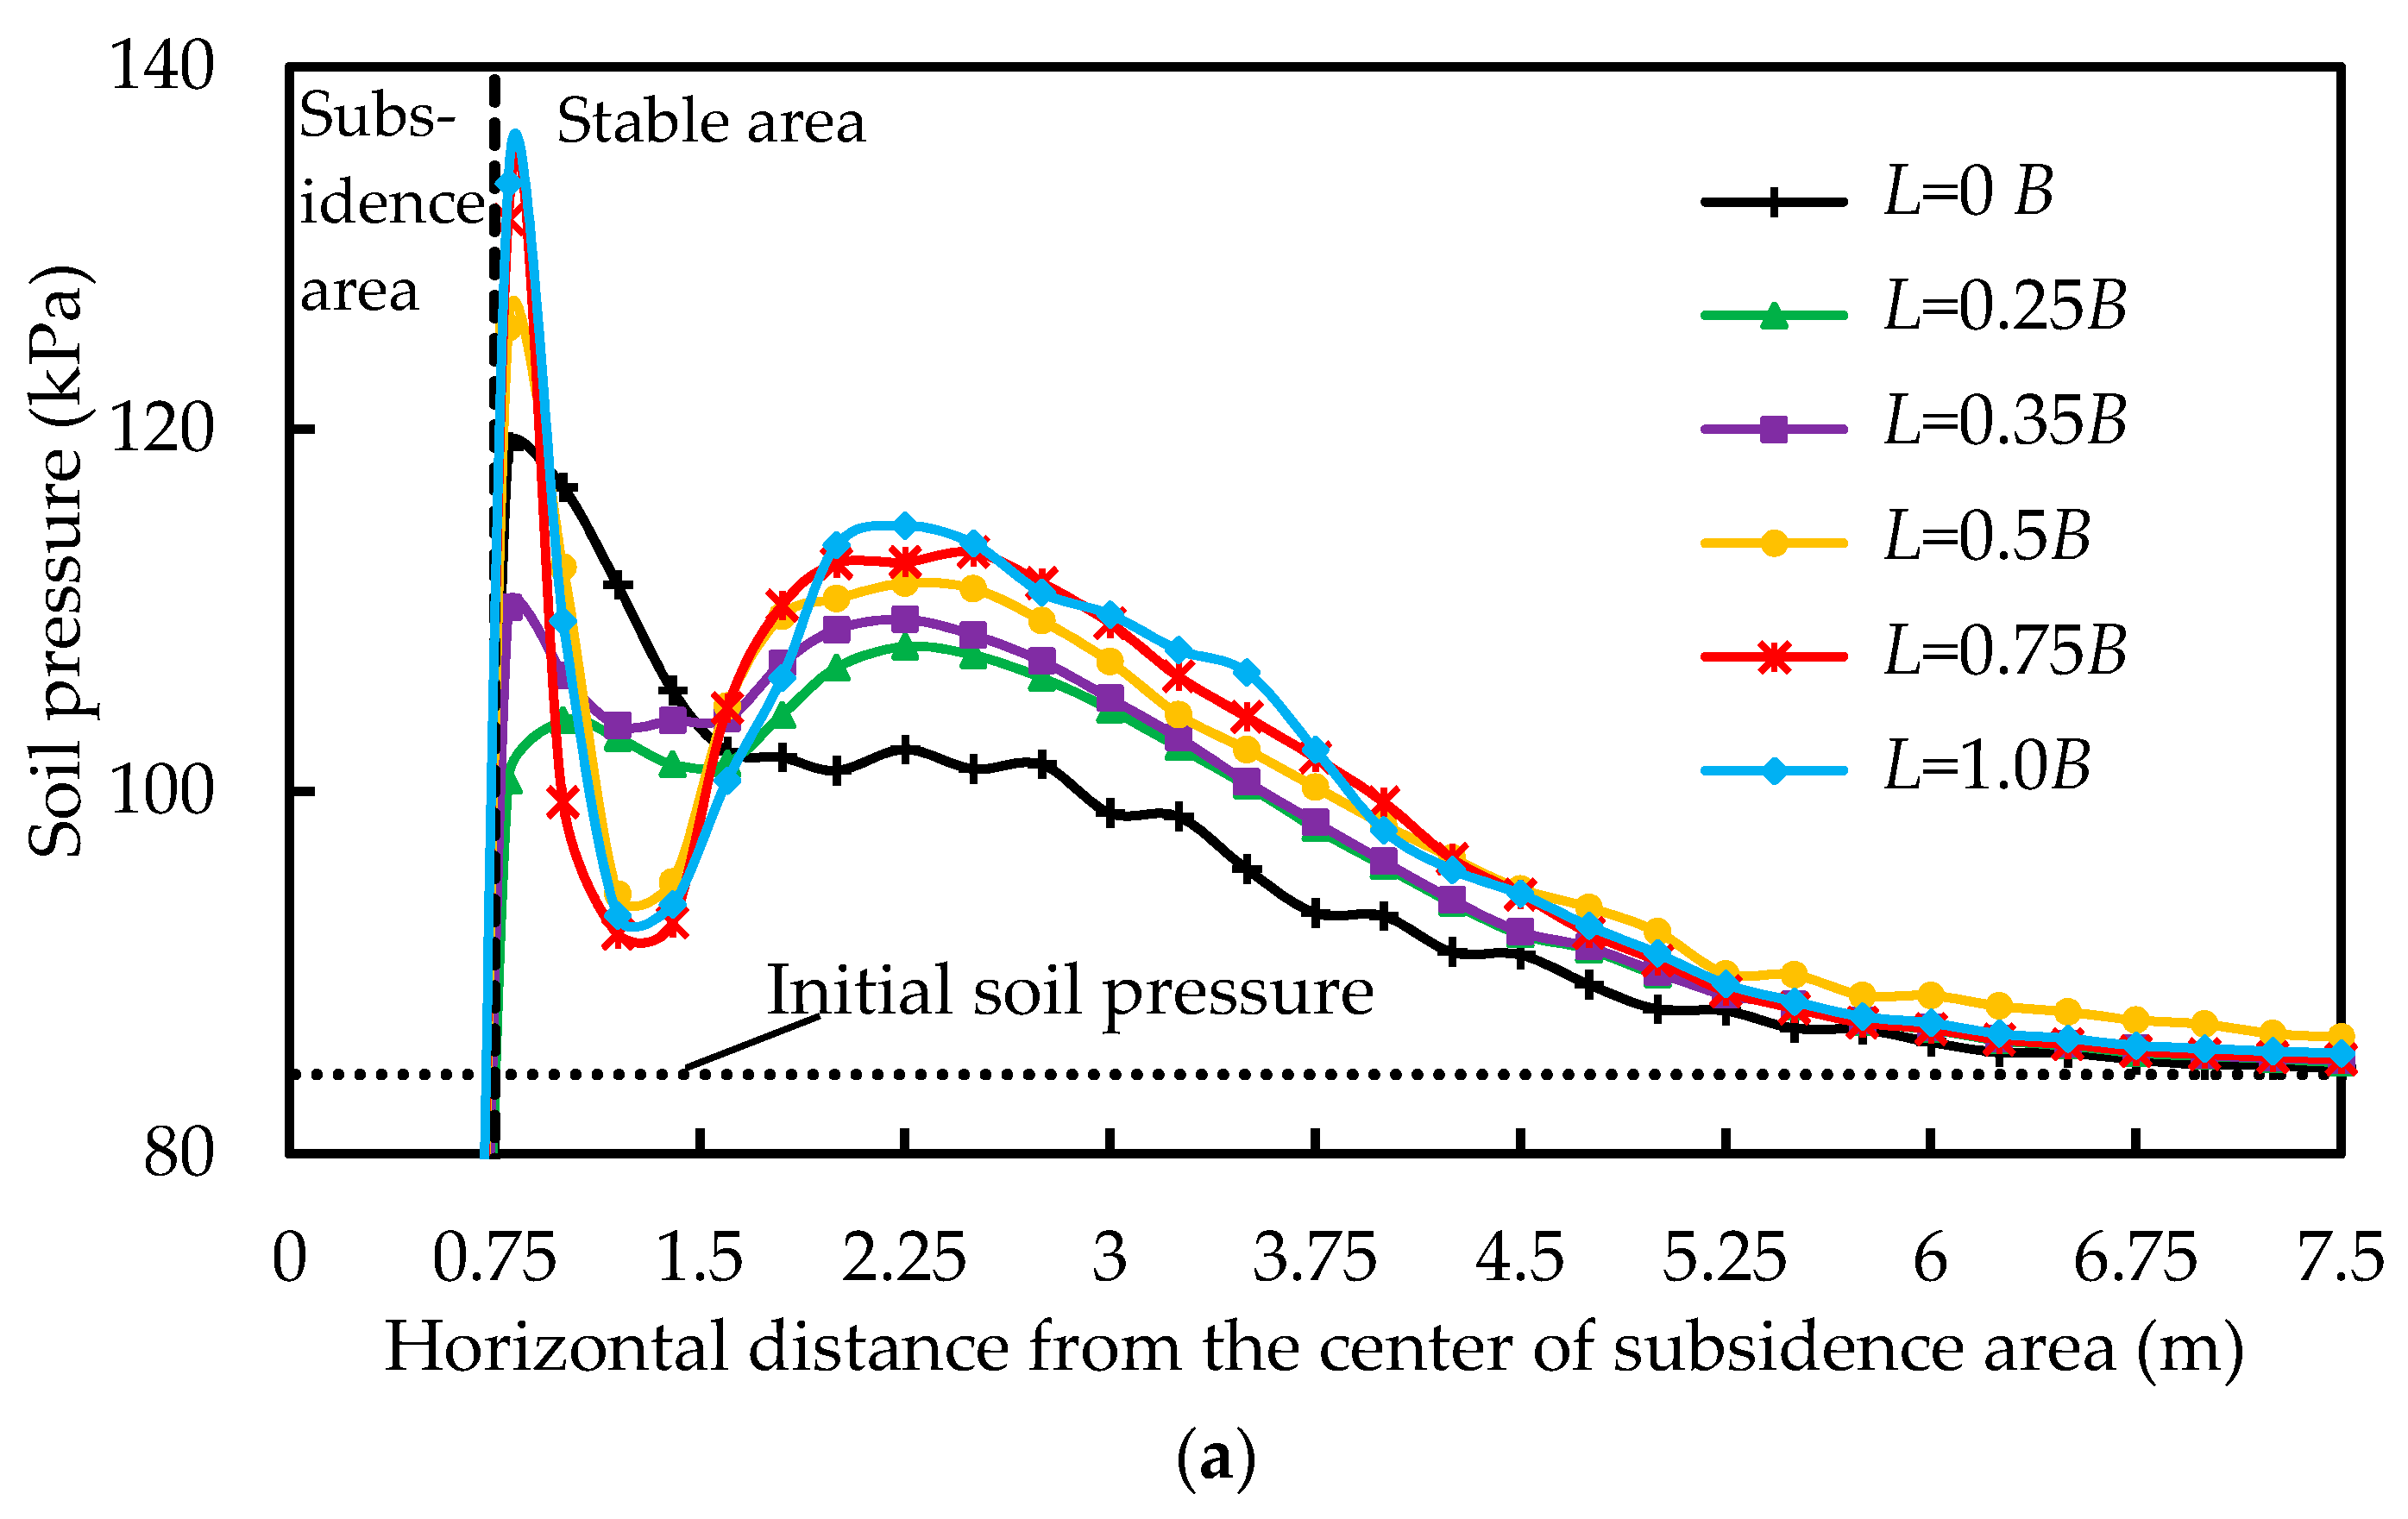
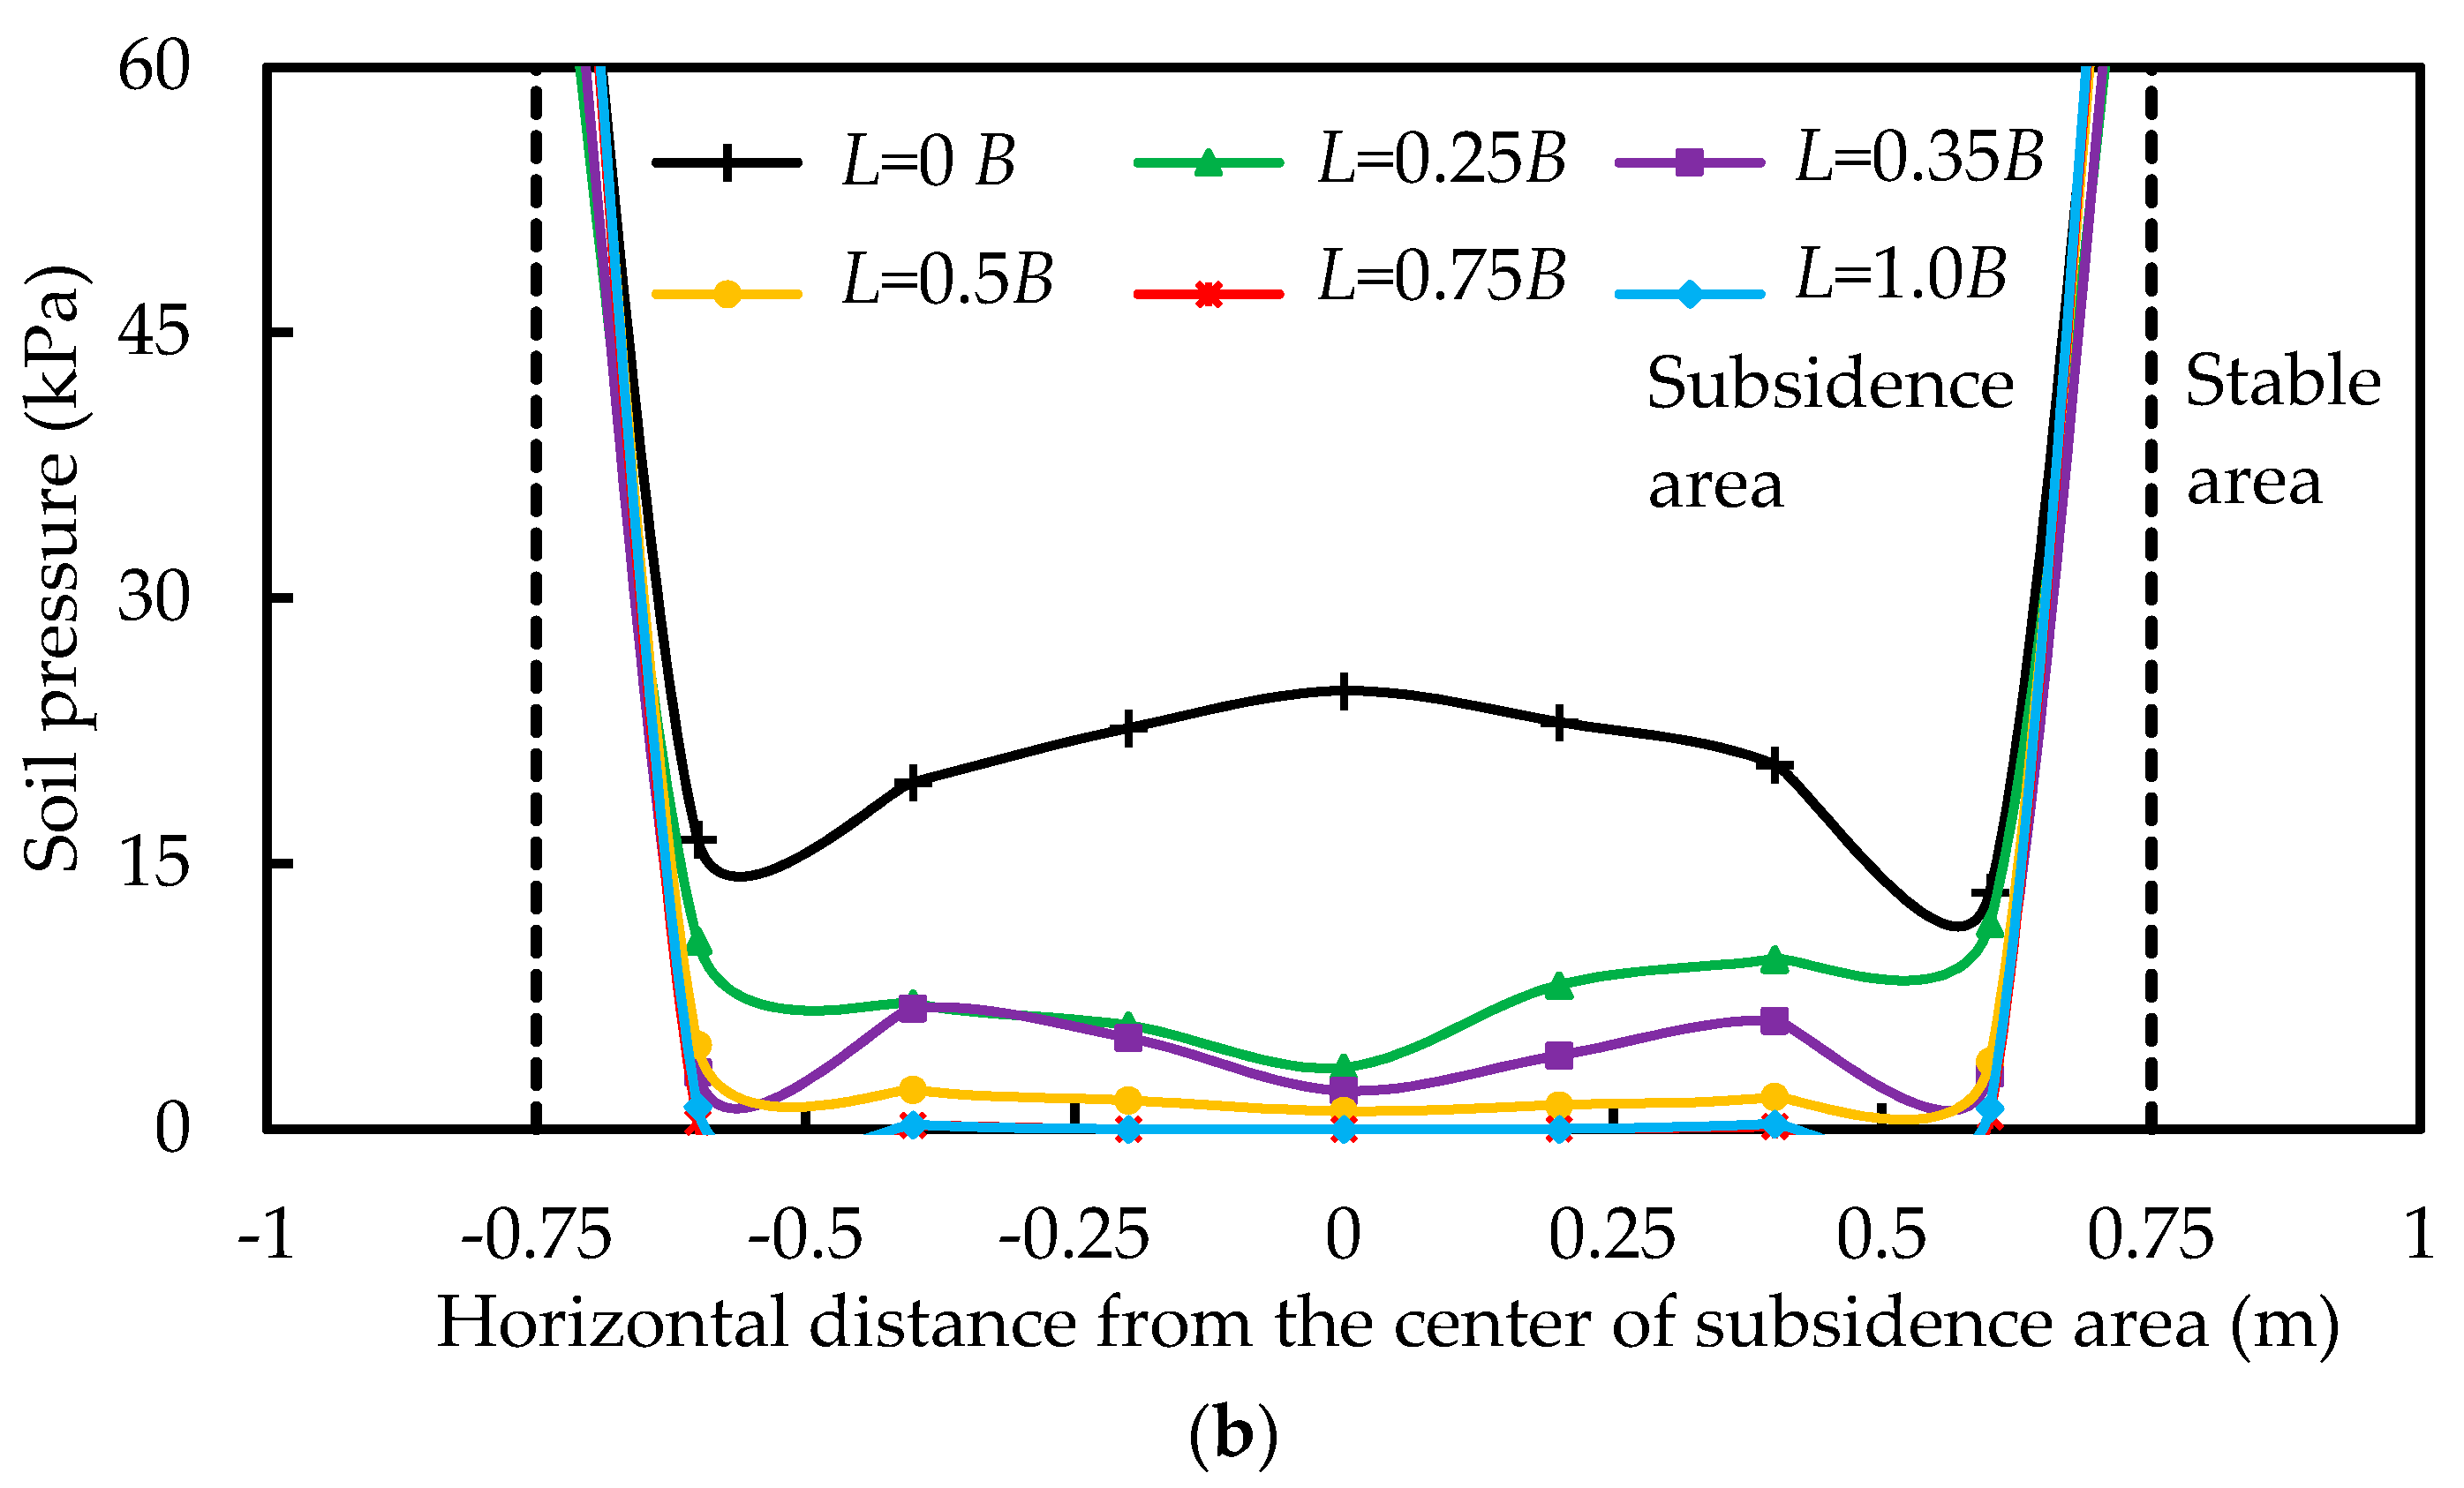
4.1.1. Soil Pressure

The soil pressure data beneath the geotextile for different anchorage ratios L/B at the final state of subsidence are shown in Figure 6.
Figure 6a shows the soil pressure beneath the geotextile in the stable area for different L/B values. Each curve has a peak value of soil pressure when the horizontal distance from the center is about 0.8 m, corresponding to the limit between the stable area and subsidence area. There is a second-peak-value at the horizontal distance from the center of 2.25 m for each curve. With the increase of the anchorage ratio, the peak soil pressure increases, meaning that greater soil pressure transfers from the subsidence area to the stable area due to the tensioned membrane effect exerted by the geotextile.
Figure 6b shows the soil pressure beneath the geotextile in the subsidence area for different anchorage ratios of L/B. With sufficient anchorage length, the trends of the curves of soil pressure with the anchorage lengths of geotextile for L = 1.0B, L = 0.75B, and L = 0.5B are similar, while, for the curve corresponding to an anchorage length of L = 0.25B, the soil pressure is similar to that of the curve without such an anchorage length, indicating that an anchorage length greater than 0.25B is required to ensure the safety and stability of the treated structure.
Figure 7 shows a comparison for the soil pressure beneath the geotextile at the final state of subsidence between model tests T2, T3, T4, and T5 conducted by Wu et al. [31] (note that the values have been scaled based on the scaling factor N = 5.0 and similarity) and the numerical modeling of M1, M2, M4 and M6. The soil pressure in subsidence area for the anchorage length of L = 0.5B and L = 1.0B is close to zero. For the anchorage length of L = 0.25B, the soil pressure in the subsidence area in the model test is in contrast to that of the numerical simulations. For the anchorage length of L = 0B, the soil pressure in subsidence area decreases as the horizontal distance from the center of subsidence area increases for both numerical simulation and model test.
In the stable area, the curves of the model test without using a geotextile have a similar tendency when comparing them to those of the numerical simulation. In general, the variation of soil pressure in both the model test and numerical modeling is similar. The friction of the interface between geotextile and soil and the size effect in the model test may contribute to the differences between the model test and numerical simulation data.

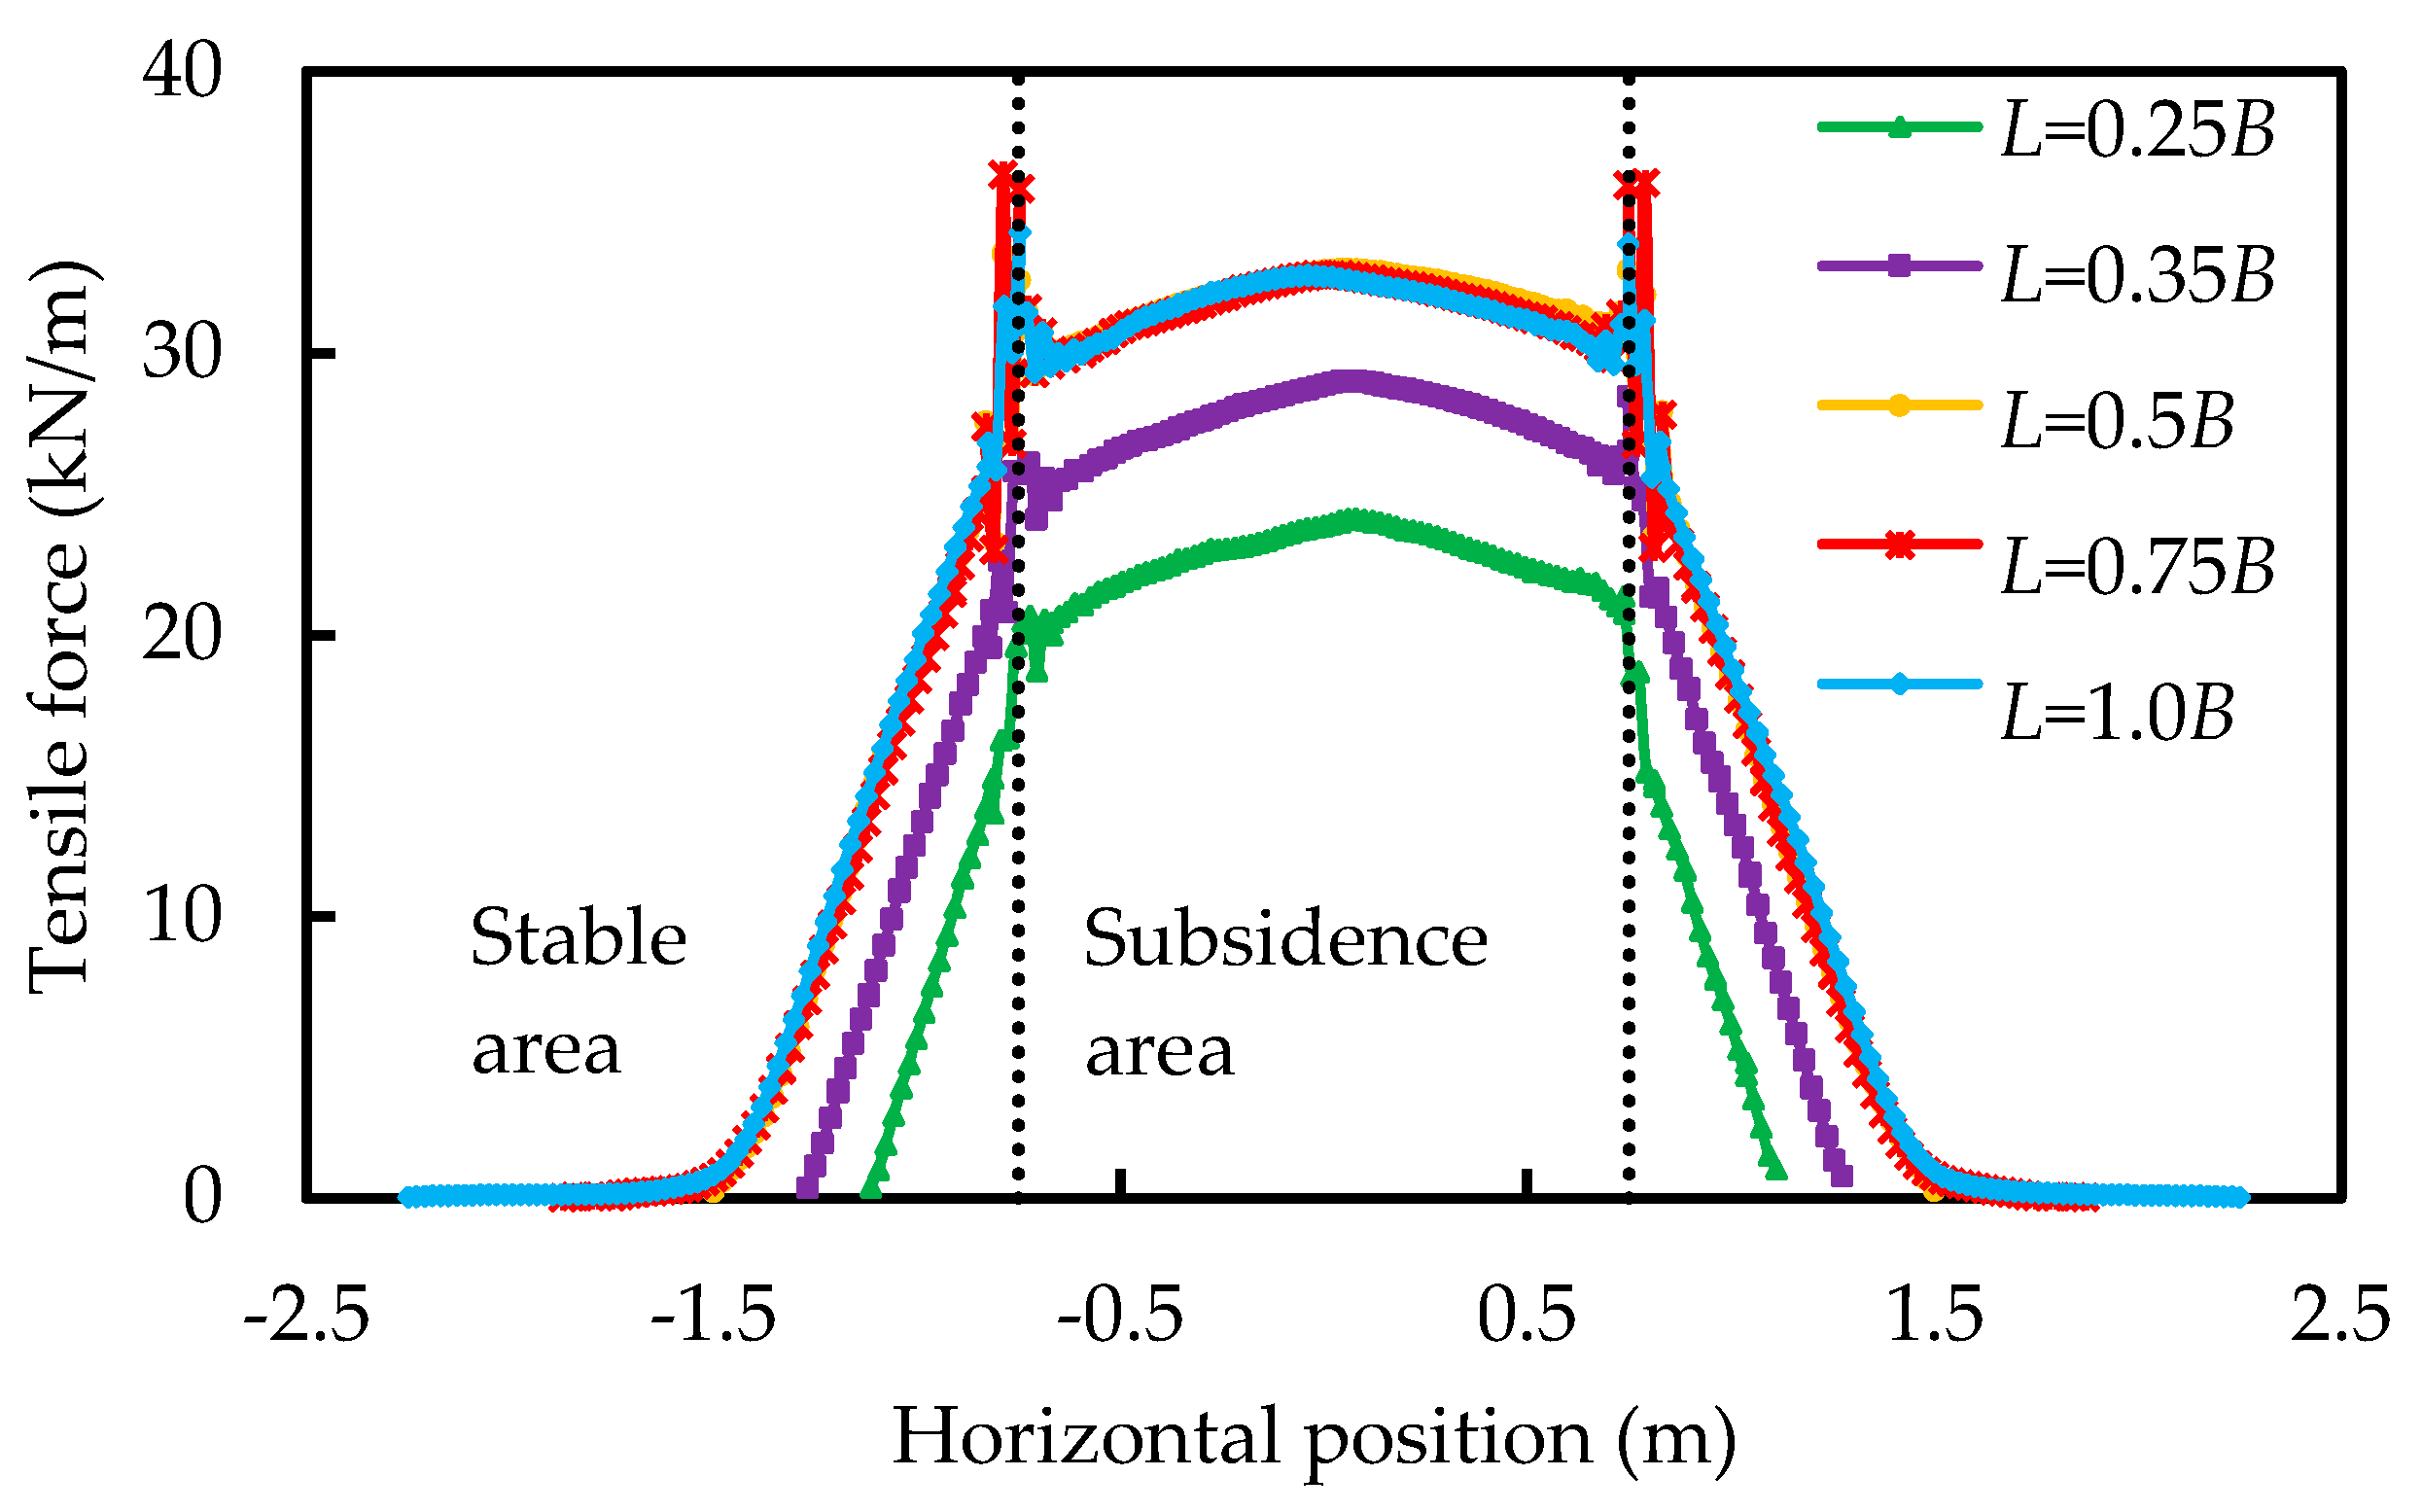
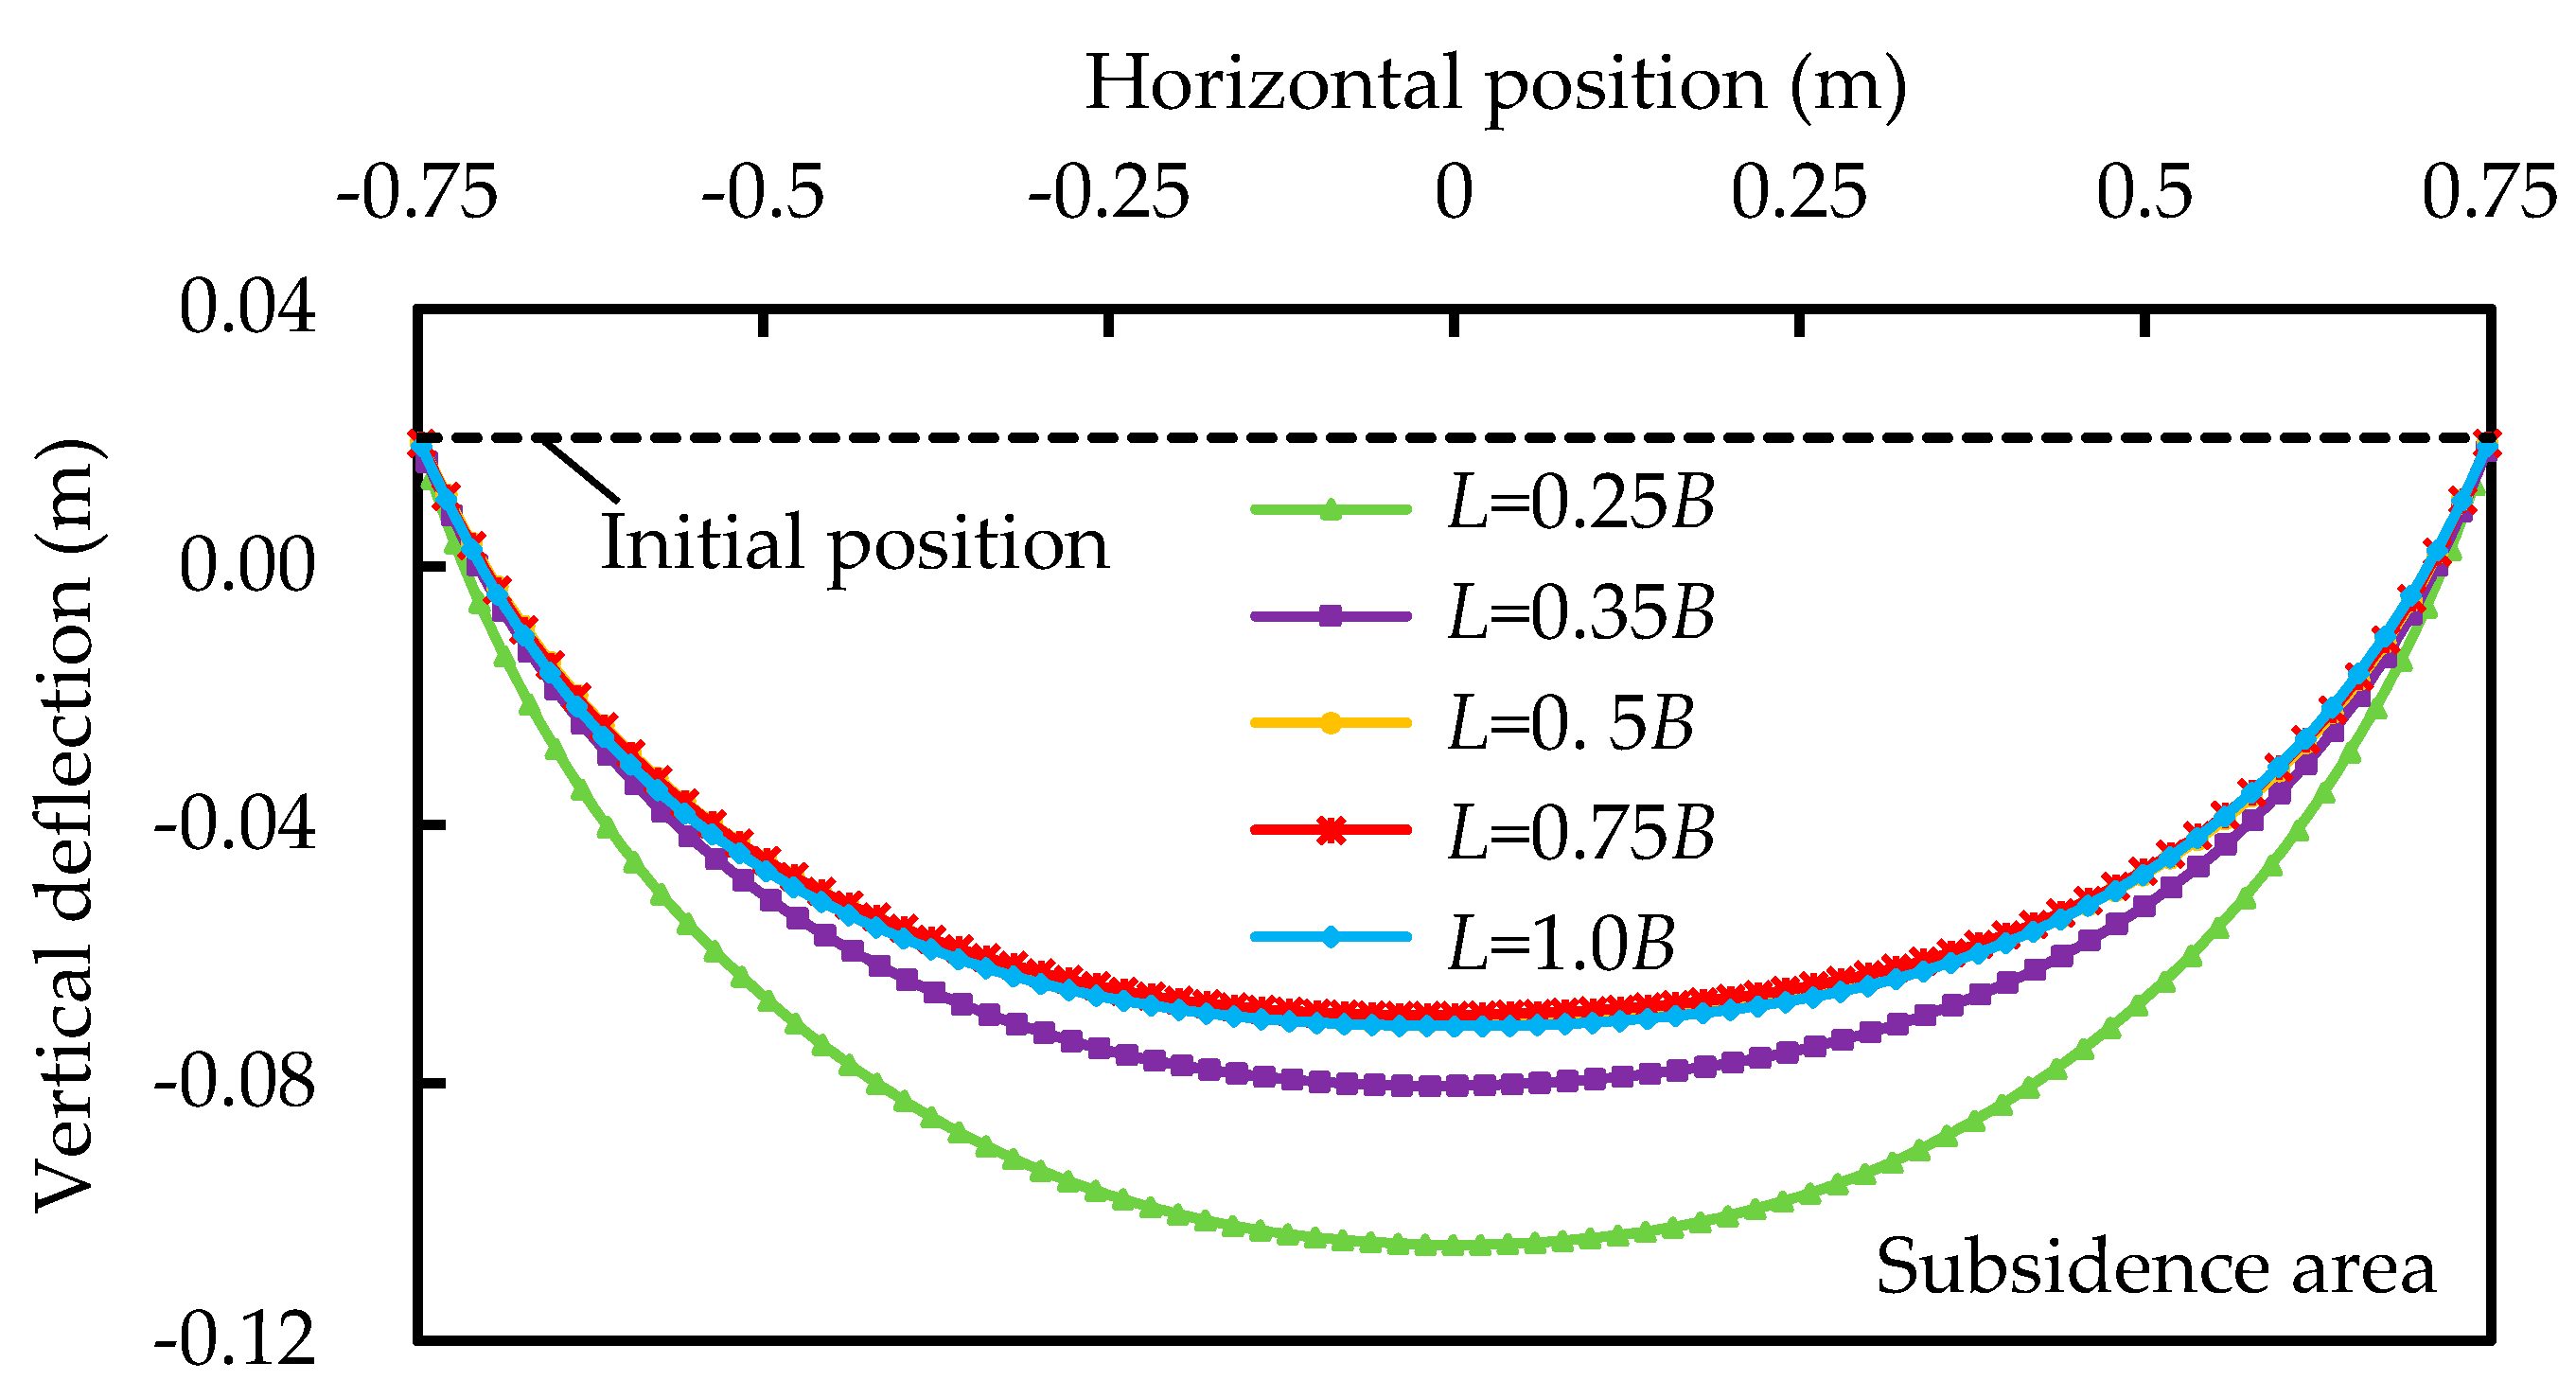
4.1.2. Tensile Force and Deformation of Geotextile

Figure 8 shows tensile force of geotextile for different anchorage ratios L/B at the final state of subsidence. In subsidence area, these curves for different anchorage ratios L/B with similar trends have greater tensile force of geotextile at the center than the two lateral sides. In stable area, the tensile force of geotextile decreases rapidly to the value of zero.
With sufficient anchorage length, the tensile forces with the anchorage length of geotextile for L = 1.0B, L = 0.75B and L = 0.5B are similar. The greatest value for them exists at the edge of the subsidence area. For the curves corresponding to the anchorage length of L = 0.25B, L = 0.35B and L = 0.5B, the tensile forces increase with the improvement of anchorage lengths. The tensile force with the anchorage length of geotextile for L = 0.25B is the smallest among these curves, indicating that the geotextile could be pulled out due to the inadequate anchorage length. Furthermore, the tensile forces with the anchorage length of geotextile for L = 1.0B and L = 0.75B are close to zero at the anchorage end of geotextile, meaning that a sufficient anchorage length, such as 1.0B and 0.75B, are suggested for ensuring the safety and stability of the treated structure.
Figure 9 shows the vertical deflection of the geotextile in subsidence area for different anchorage ratios L/B at the final state of subsidence. The trends of parabolic curves of vertical deflection of geotextile for different anchorage lengths are similar. Le et al. [15] also found that the measured shape of the geosynthetic matched well with the parabolic curves. The greatest value for deflection exists at the center of the subsidence area. For the curves corresponding to the anchorage length of L = 0.25B, L = 0.35B and L = 0.5B, the vertical deflections of geotextile decrease with the improvement of anchorage lengths. With a sufficient anchorage length, the vertical deflection of geotextile with the anchorage length of geotextile for L = 1.0B, L = 0.75B and L = 0.5B are approximate. The vertical deflection with the anchorage length of geotextile for L = 0.25B is the greatest among these curves, indicating that the insufficient anchorage length geotextile may cause the instability of the treated structure.

4.1.3. Soil Displacement

Figure 10 shows the vertical displacement contours of soil for different anchorage ratios of L/B at the final state of subsidence. The displacement legend is shown at the right side of each displacement contour.
The greatest soil displacement exists at the bottom of subsidence area for each image. With the increase of the fill height, the displacement develops towards the stable area and surface displacement occurs. A darker color is shown if the geotextile (See Figure 10a) is not used, meaning the occurrence of greater soil displacement at the bottom of subsidence area and greater settlement on the surface as compared to the conditions when using the geotextile. The application of a geotextile can control the vertical displacement of soil and effectively decrease the upward development of subsidence.
With a sufficient anchorage length, the vertical displacement contours for the vertical displacement of the soil with the anchorage length of geotextile for L = 0.5B, L = 0.75B and L = 1.0B (See Figure 10d–f) are similar, while, for anchorage lengths of L = 0.25B, L = 0.35B, and L = 0.5B (See Figure 10b–d), the soil displacement at the bottom of the subsidence area decreases with the increase of the anchorage length. It is indicated that a sufficient anchorage length of at least greater than 0.5B can better control the soil displacement due to the tensioned membrane effect of geotextile and ensure stability of the treated structure.
Figure 11 illustrates the surface settlement for different anchorage ratios L/B at the final state of subsidence. Each curve has a peak value of surface settlement at the center of the subsidence area. The surface settlement decreases as the horizontal distance from the center of the subsidence area increases. When the horizontal distance from the center is about 5.5 m, indicating the location inside the stable area, the surface settlement is close to zero. The surface settlement decreases with the increase of the anchorage ratio, meaning that increasing the anchorage length is more beneficial for the treatment of subsidence. The surface settlement results for anchorage lengths of L = 1.0B and L = 0.75B are similar, indicating a similar effect on subsidence treatment. In order to quantify the decrement on surface settlement with the increase of the anchorage length of the geotextile, decrement ratio α was proposed as per Equation (3). The α in Equation (3) represents the decrement of surface settlement under different anchorage ratios L/B (using a geotextile) as compared to L/B = 0 (without using a geotextile).
α = X x x × 100 %
where α is the decrement ratio of surface settlement under different anchorage ratios L/B (using geotextile) as compared to L/B = 0 (without using geotextile) as a percentage, X is the surface settlement under different anchorage ratios L/B (using a geotextile) in mm, and x is the surface settlement under the anchorage ratio L/B = 0 (without using a geotextile) in mm.
Figure 12 shows the decrement ratio of surface settlement under different anchorage ratios L/B as calculated by Equation (3). It shows that the decrement ratio of surface settlement increases with the improvement of the anchorage ratio of the geotextile, indicating that a greater anchorage length is more beneficial to reducing surface settlement. For example, the α values are 1.05%, 6.47%, 20.72%, 32.21%, and 34.18% for L/B values of 0.25, 0.35, 0.5, 0.75, and 1.0, respectively, representing that the surface settlement values under anchorage ratios L/B of 0.25, 0.35, 0.5, 0.75, and 1.0 were reduced by 1.05%, 6.47%, 20.72%, 32.21%, and 34.18%, respectively, compared to L/B = 0 (i.e., without using a geotextile).
According to BS 8006 [35] and Jones et al. [4], the maximum differential surface deformation (i.e., the radio of depression at surface ds to the subsidence width at surface Ds) should be limited to 1% if the subgrade is subjected to subsidence, which is one of the important indicators to evaluate the treatment effect of subsidence. The differential surface deformations ds/Ds are 0.21%, 0.22%, 0.25%, 0.30%, and 0.33% for anchorage lengths of L = 1.0B, L = 0.75B, L = 0.5B, L = 0.35B, and L = 0.25B, which are smaller than the specified value of ds/Ds of 1% in BS 8006. It is indicated that the application of a geotextile has a great effect on the treatment of subsidence.
The application of a sufficient anchorage length, i.e., L = 1.0B and L = 0.75B, results in an approximately suitable soil pressure, displacement of soil, tensile force and deformation of the geotextile at the final state of subsidence and effectively treats the subsidence.
As such, an appropriate anchorage length for a geotextile should be chosen as 0.75 times length of subsidence width B, which is approximately equal to the appropriate anchorage length of L = 1.0B obtained from model test conducted by Wu et al. [31]. Considering better safety of the treatment in terms of subgrade subsidence, it is suggested a greater anchorage length L of L = 1.0B is used.

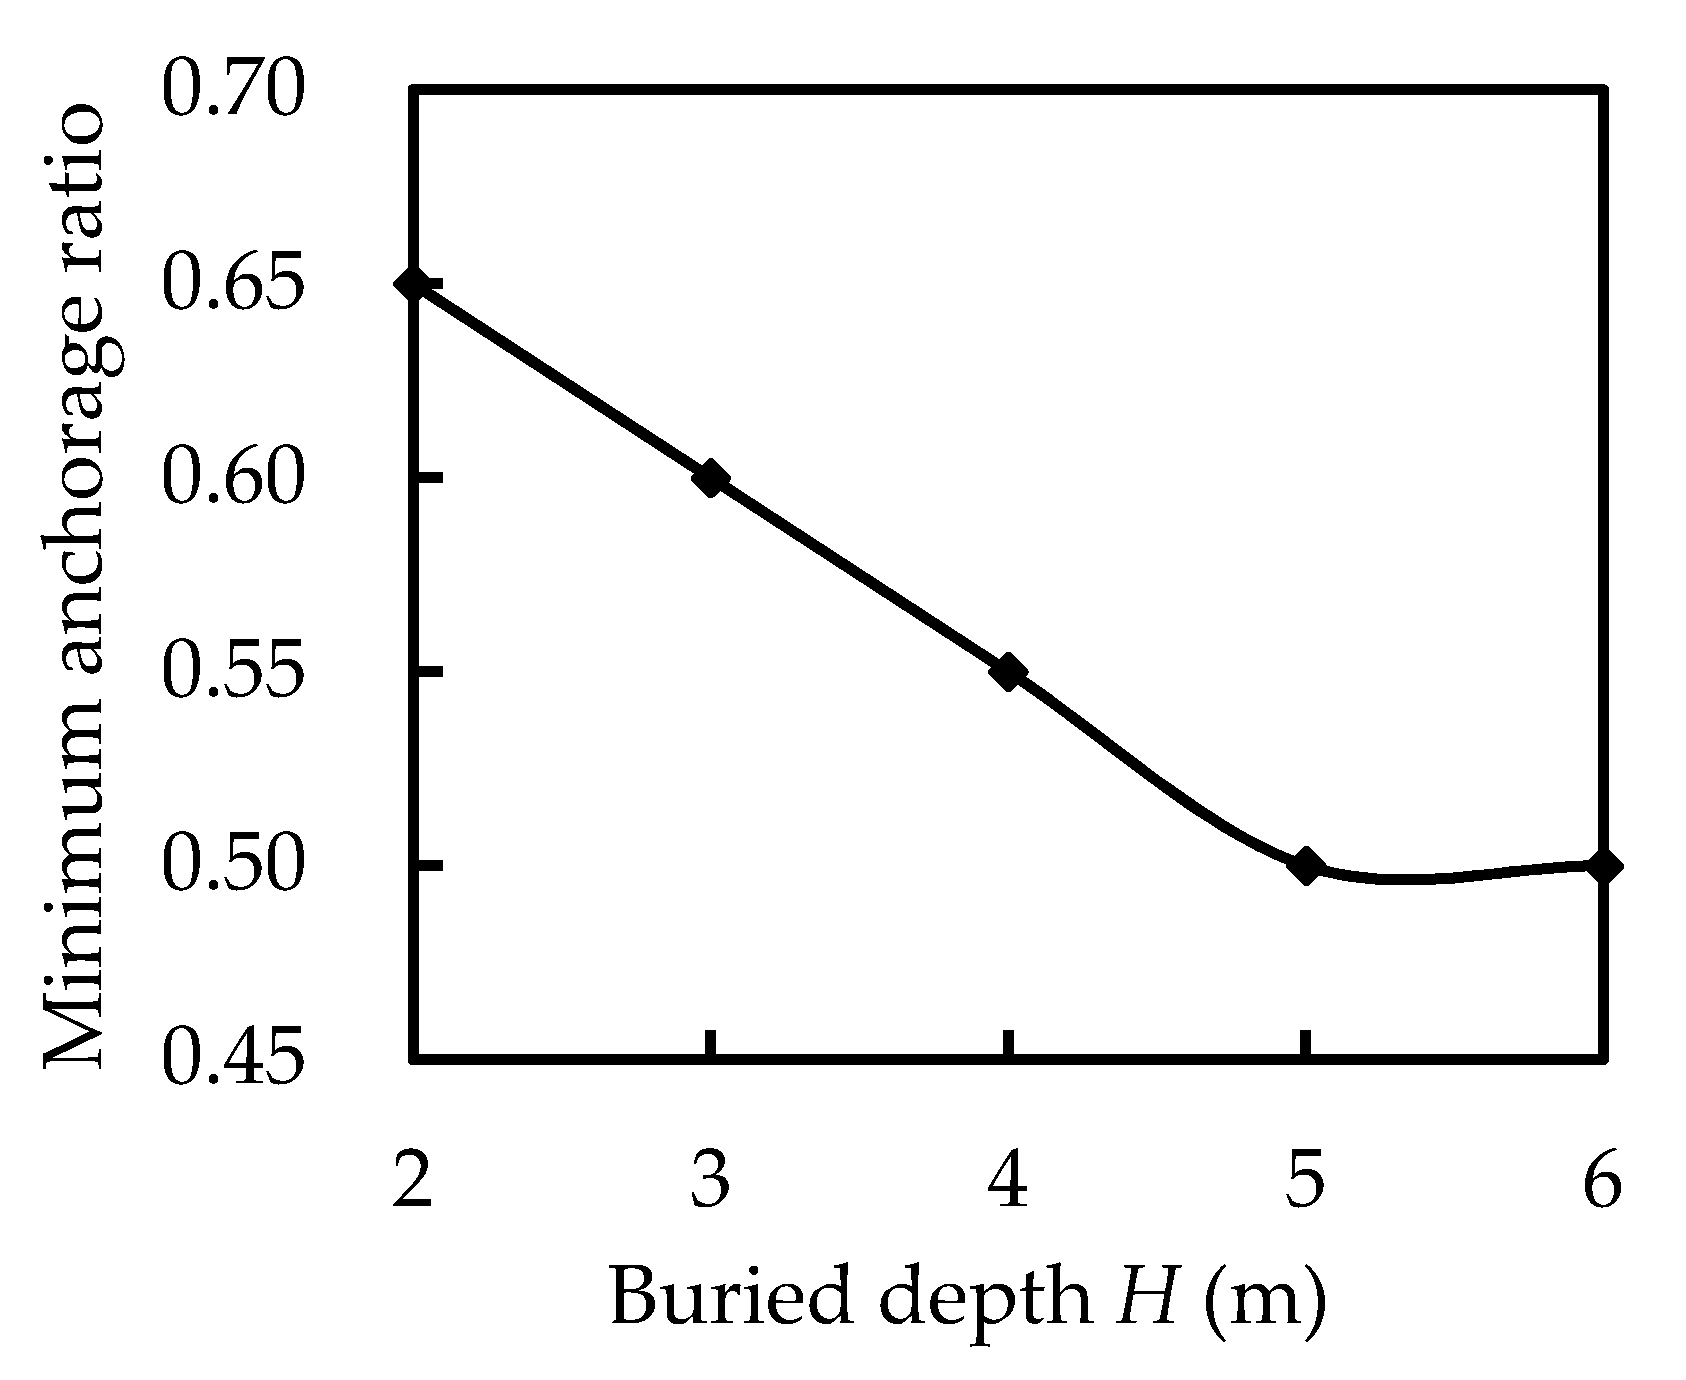
4.2. Effects of Buried Depth of Geotextile

The selection for the buried depth of the geotextile determined the workload of the soil excavation. Numerical models M7 to M11 with different buried depths H = 2 m, 3 m, 4 m, 5 m, and 6 m for the geotextile were used to investigate the effects of the buried depth of the geotextile on the treatment of subsidence. The overburden stress, tensile force, and deformation of the geotextile were analyzed, along with the soil displacement.

4.2.1. Soil Pressure

Figure 13 presents the soil pressure beneath the geotextile for different buried depths H at the final state of subsidence. The trends of the curves of the soil pressure for different buried depths of the geotextile were similar. At the center of the subsidence area, the soil pressure was approximately zero and approached the greatest value at the boundary between the subsidence area and the stable area. The soil pressure could be effectively transferred from the subsidence area to the boundary close to the stable area by the geotextile. Similar results were found by Feng et al. [29], where the load was transmitted from the subsidence area to less-deformed surrounding area due to the soil arching effect. Greater soil pressure was transferred to the stable area if the buried depth of the geotextile was increased, indicating that the buried depth of the geotextile is one of the key factors controlling the development of the subsidence.

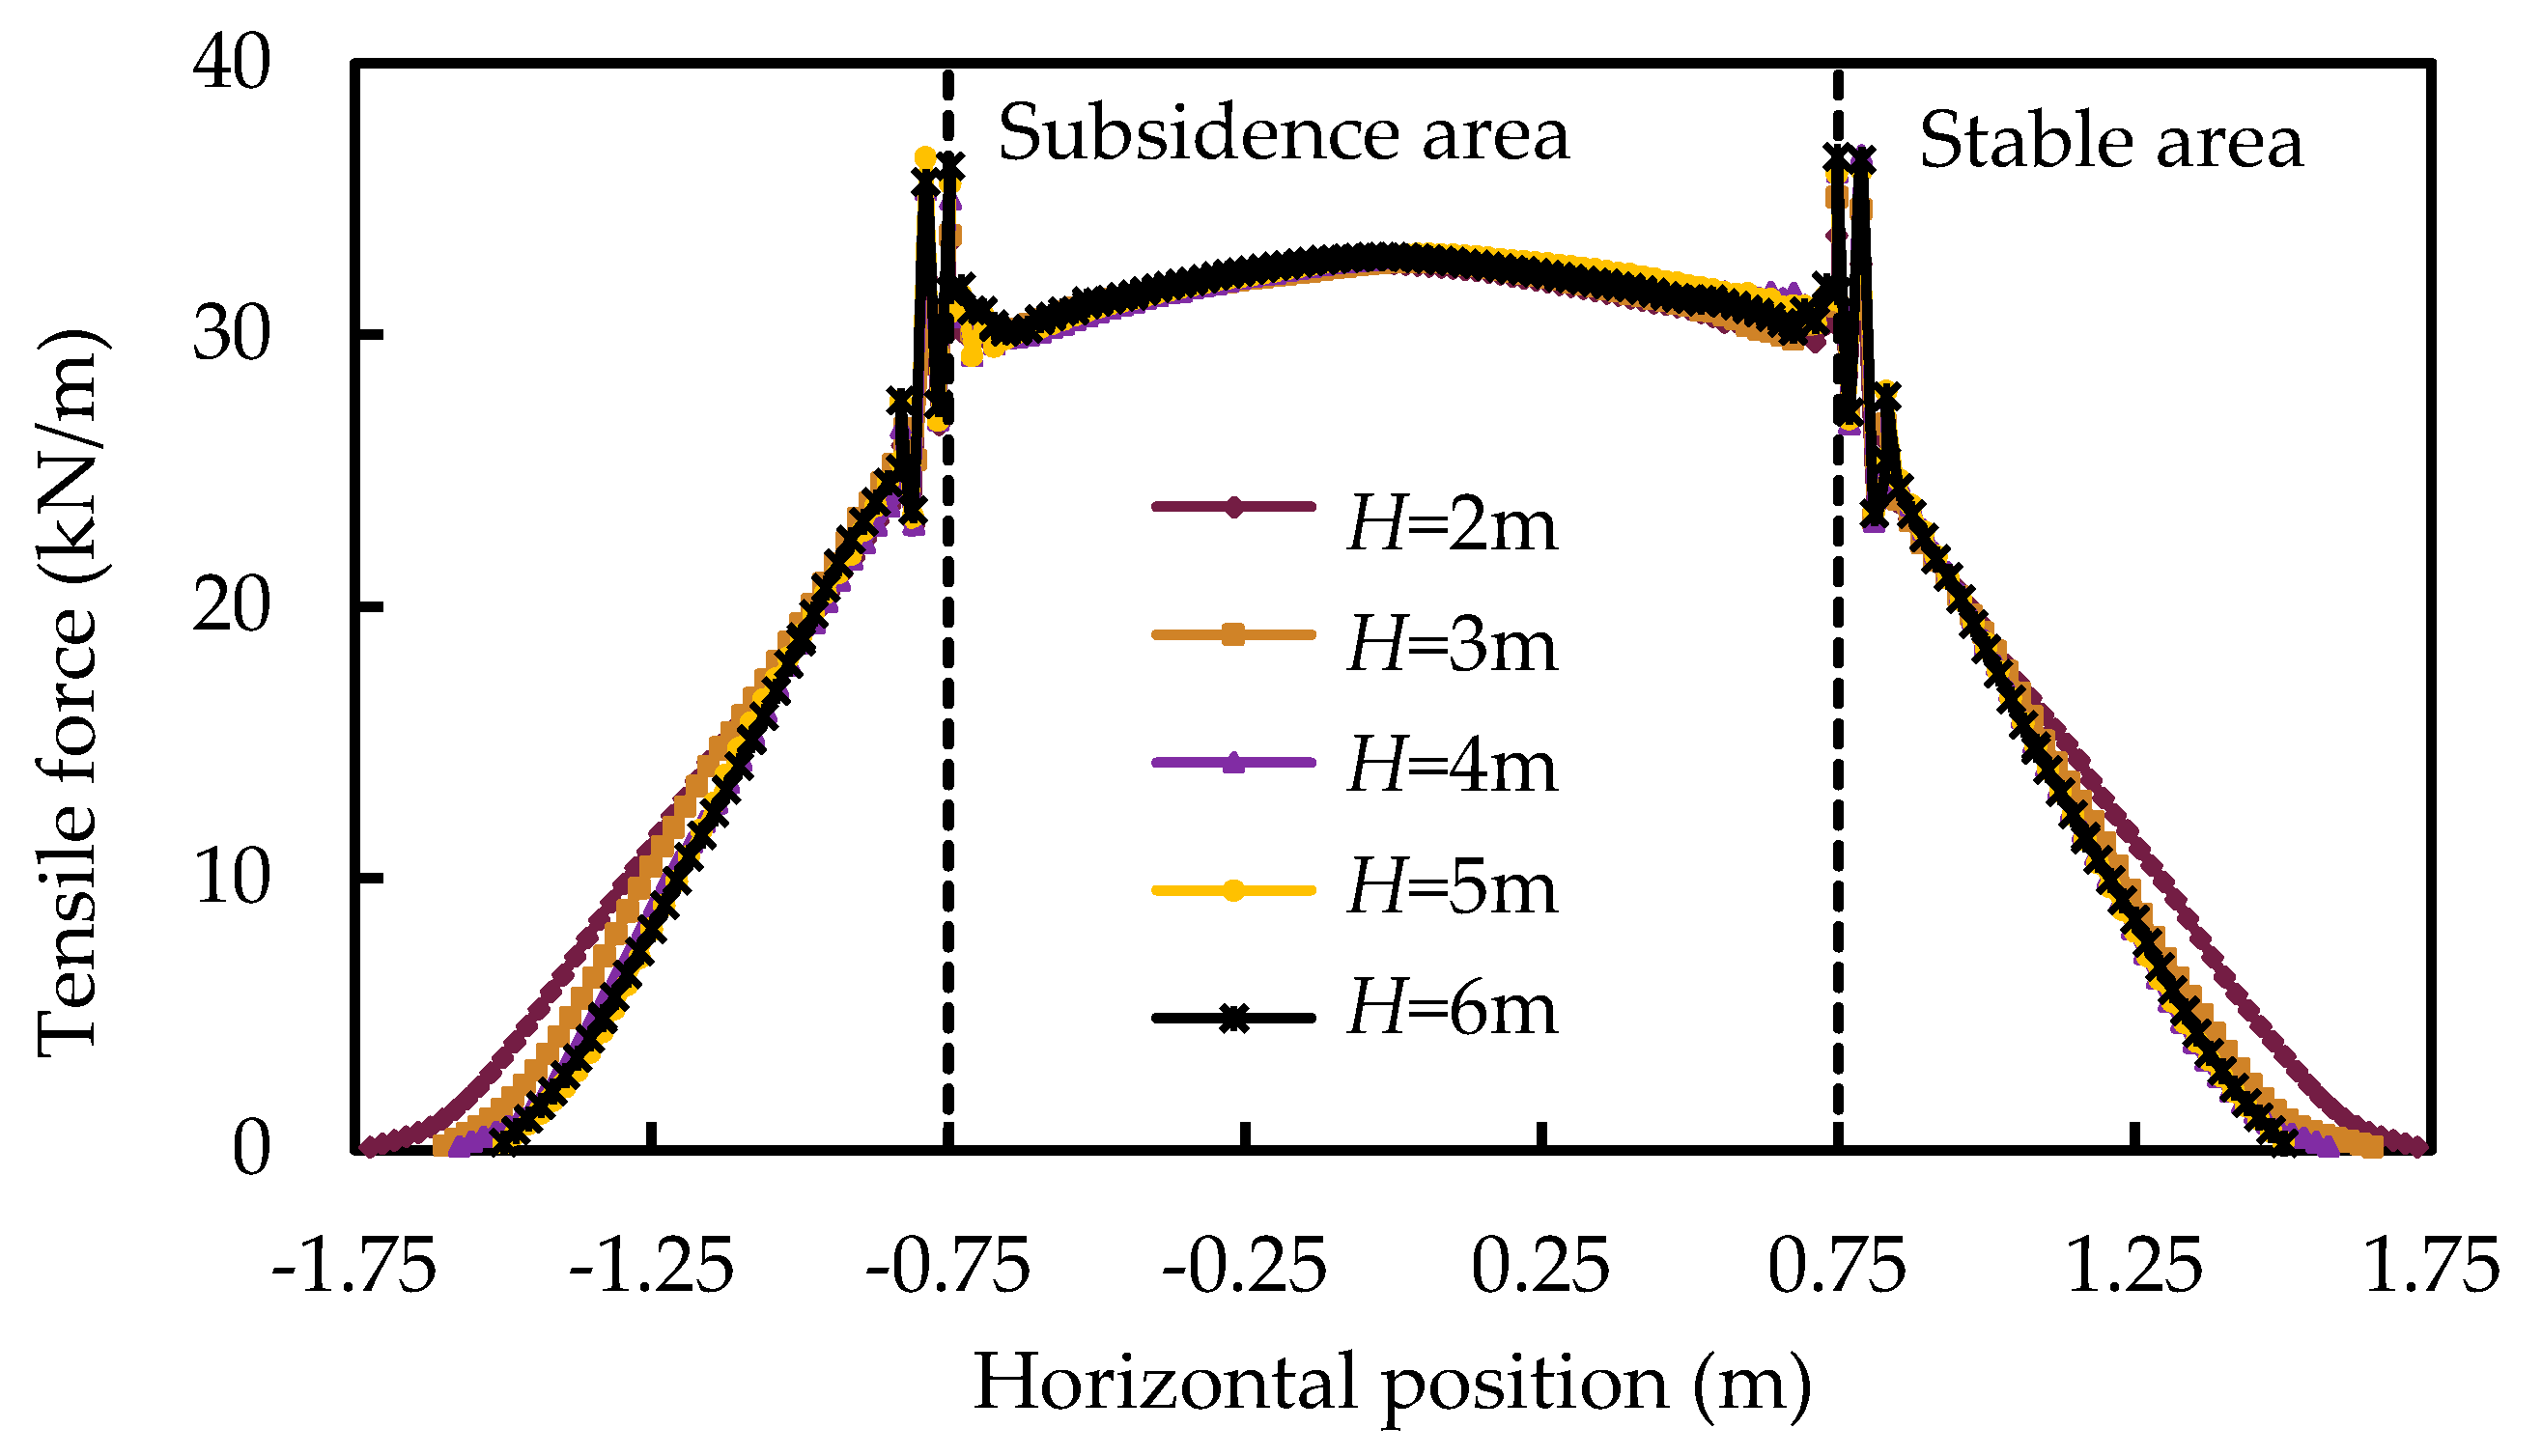
4.2.2. Tensile Force and Deformation of Geotextile

Figure 14 shows the tensile force of the geotextile for different buried depths of the geotextile H at the final state of subsidence. The tensile force of the geotextile near the center of subsidence area is greater than the two lateral sides in subsidence area for different buried depths. The greatest tensile force for the geotextile occurs at the edge of stable area and rapidly decreases within the stable area. Although the buried depths varied, the tensile force changed slightly, implying that the buried depth of the geotextile has less influence on the tensile force for the geotextile.
Figure 15 illustrates the vertical deflection of the geotextile in the subsidence area for different buried depths at the final state of subsidence. The parabolic curves of vertical deflection of geotextile for different buried depths are similar, showing that the buried depth of geotextile has less influence on the deformation of geotextile.

4.2.3. Soil Displacement

Figure 16 presents vertical displacement contours of the soil for different buried depths of the geotextile when the displacement of the subsided soil beneath the geotextile was 100 mm. The displacement legend is shown at the right side of each displacement contour.
Darker colors can be seen for the semi-elliptical displacement contours when shallow buried depth values for the geotextile (e.g., H = 2 m) (Figure 16a) are used, thus representing great soil displacement and great settlement on surface. With the increase of the buried depth of the geotextile (e.g., H = 3 m, 4 m, 5 m, and 6 m) (Figure 16b–e), greater displacement develops towards the stable area and smaller surface displacement occurs. For example, the displacement developing towards the stable area under the buried depth of geotextile of H = 6 m was greater than that of H = 4 m. The surface displacement under H = 6 m was smaller than that of H = 4 m. A deeper buried depth of the geotextile has a greater effect on the treatment of subsidence.
Figure 17 shows the surface settlement for different buried depths of geotextile H at the final state of subsidence. It decreases with the increase of buried depth of geotextile. In the subsidence area, the surface settlement was greater for buried depths of 2 m and 3 m as compared to deeper buried depths H (e.g., H = 4 m, 5 m, and 6 m). The area of deformation at the surface became larger, indicating that the surface deformation tends to be uniform with the increase of buried depth of the geotextile. To quantify the decrement on surface settlement with the increase of buried depth of geotextile, decrement ratio β was proposed as Equation (4), which represents the decrement of surface settlement under different buried depth H as compared to H = 2 m.
β = D d d × 100 % ,
where β is the decrement of surface settlement under buried depth H as compared to H = 2 m as a percentage, D is the surface settlement under buried depth H in mm, and d is the surface settlement under buried depth H = 2 m in mm.
Figure 18 shows the decrement ratio of surface settlement under buried depth H as calculated by Equation (4). It shows that the decrement ratio of surface settlement is greater with the improvement of the buried depth of the geotextile, indicating that a greater buried depth contributes to reducing surface settlement. For example, the decrement ratios β are 29.14%, 48.19%, 57.98%, and 65.91% under buried depth values of 3 m, 4 m, 5 m and 6 m, respectively, meaning that the surface settlements under the buried depth H of 3 m, 4 m, 5 m and 6 m are reduced by 29.14%, 48.19%, 57.98% and 65.91%, respectively, when compared to H = 2 m.
The differential surface deformations ds/Ds are 0.72%, 0.41%, 0.19%, 0.15% and 0.13% for the conditions of H = 2 m, 3 m, 4 m, 5 m, and 6 m, which are smaller than the specified value of ds/Ds of 1% according to BS 8006 [35]. Consequently, the application of a geotextile has a great effect on the treatment of subsidence and differential surface deformation is mitigated with the use of a deeper buried depth for the geotextile.
To determine an appropriate depth for the geotextile, the minimum anchorage length of the geotextile, ensuring the separation of the geotextile from the subsided soil beneath the geotextile, was introduced. The minimum anchorage ratio of the geotextile for buried depth H, being the ratio of anchorage length of geotextile to the subsidence width, is shown in Figure 19.
The minimum anchorage ratios of the geotextile are 0.65, 0.60, 0.55, 0.50 and 0.50, respectively, for depths of 2 m, 3 m, 4 m, 5 m, and 6 m, indicating that the buried depth of the geotextile has less influence on the construction workload of transverse excavation. Although a deeper buried depth for the geotextile achieves a better treatment effect regarding the treatment of subsidence, it requires deeper longitudinal excavation. For example, when the buried depth of the geotextile is H = 2 m or H = 5 m, the minimum anchorage lengths of geotextile are 0.65B and 0.5B (B = 1.5 m), respectively. A buried depth of 5 m has a better effect on the treatment of subsidence and would save 0.225 m of transverse excavation compared to a buried depth of 2 m, although it requires a further 3 m for longitudinal excavation.
Considering the treatment effect of subsidence and the construction workload, the buried depth of the geotextile is suggested to be chosen as H = 3 to 4 m for the treatment of subsidence.

5. Conclusions

In this paper, a geotextile has been proposed to lay above a sinkhole in the process of soil-filling after subgrade subsidence has occurred, and the stability of the newly reinforced soil structure has been determined to increase as a result. The optimization of the anchorage length and buried depth of the geotextile was explored through numerical modeling with eleven different conditions and was conducted by finite element analysis with the PLAXIS 2D software package. By comparing the numerical test results with the model test results, the soil pressure, displacement of the soil, tensile force, and the deformation of geotextile were analyzed to explore the effects of the anchorage length and buried depth on the treatment of subsidence.
The variations of the soil pressure, tensile force, and the relative settlement for the numerical modeling were consistent with those of the model test, which proves the feasibility of the numerical modeling. A sufficient anchorage length that is at least greater than 0.25B is required to ensure the safety and stability of the treated structure. With the increase of the anchorage length of the geotextile, greater soil pressure is transferred from the subsidence area to the stable area and the soil displacement is better controlled, which improves the treatment of subsidence. When the anchorage length of the geotextile is inadequate, the geotextile could be damaged as the more length is pulled out and a smaller tensile force exists during the process of subsidence. As the anchorage length of geotextile increased from 375 mm to 1500 mm, the surface settlement was effectively reduced from 1.05% to 34.18% when comparing to the situation without a geotextile. Furthermore, the buried depth of the geotextile is one of the key factors controlling the development of subsidence, while it has less influence on the tensile force and the deformation of the geotextile. The application of a geotextile has a great effect on the treatment of subsidence and differential surface deformation is mitigated with the use of a deeper buried depth for the geotextile. As the buried depth of the geotextile increased from 2 m to 6 m, the surface settlement was effectively reduced from 29.14% to 65.91% when the settlement corresponding to a buried depth of 2 m was used as the reference value.
Considering the safety and cost of treatment of subgrade subsidence using geotextiles, the treatment method considered here is suggested with an appropriate geotextile anchorage length that is the length of subsidence width and an appropriate buried depth in the range from 3 m to 4 m. The method, although focused on the treatment of subgrade subsidence due to sinkholes in karst areas, could be adapted to subsidence in other areas (e.g., former mining exploitation areas) and structures (e.g., railways). This work provides a new vision for the treatment of sinkholes using geosynthetic materials.

Author Contributions

Conceptualization and methodology, D.W. and J.W.; software and validation, Y.L. (Yuankun Li), J.W. and Y.L. (Yihuai Liang); writing—original draft preparation, C.L.; writing—review and editing, Y.Y., D.W. and C.L.; supervision, D.W., Y.Y. and Y.L. (Yuankun Li). All authors have read and agreed to the published version of the manuscript.

Funding

This research was supported by Natural Science Foundation of China Grant (No. 42067044), Natural Science Foundation of Guangxi Grant (No. 2018GXNSFAA294130) and Innovation Project of GUET Graduate Education (No. 2020YCXS123).

Institutional Review Board Statement

Not applicable.

Informed Consent Statement

Not applicable.

Data Availability Statement

Not applicable.

Conflicts of Interest

The authors declare no conflict of interest.

References

  1. Gutiérrez, F.; Benito-Calvo, A.; Carbonel, D.; Desir, G.; Sevil, J.; Guerrero, J.; Fabregat, I. Review on sinkhole monitoring and performance of remediation measures by high-precision leveling and terrestrial laser scanner in the salt karst of the Ebro Valley, Spain. Eng. Geol. 2019, 248, 283–308. [Google Scholar] [CrossRef]
  2. Galve, J.P.; Remondo, J.; Gutiérrez, F. Improving sinkhole hazard models incorporating magnitude–frequency relationships and nearest neighbor analysis. Geomorphology 2011, 134, 157–170. [Google Scholar] [CrossRef]
  3. Brinkmann, R.; Parise, M.; Dye, D. Sinkhole distribution in a rapidly developing urban environment: Hillsborough County, Tampa Bay area, Florida. Eng. Geol. 2008, 99, 169–184. [Google Scholar] [CrossRef]
  4. Jones, C.J.; Cooper, A.H. Road construction over voids caused by active gypsum dissolution, with an example from Ripon, North Yorkshire, England. Environ. Geol. 2005, 48, 384–394. [Google Scholar] [CrossRef] [Green Version]
  5. Jeong, S.W.; Yum, B.W.; Ryu, D.W.; Lee, H.J.; Jung, B. The influence of clay content on cave-ins in tank model tests and monitoring indicators of sinkhole formation. Appl. Sci. 2019, 9, 2346. [Google Scholar] [CrossRef] [Green Version]
  6. Pagano, M.; Palma, B.; Ruocco, A.; Parise, M. Discontinuity Characterization of Rock Masses through Terrestrial Laser Scanner and Unmanned Aerial Vehicle Techniques Aimed at Slope Stability Assessment. Appl. Sci. 2020, 10, 2960. [Google Scholar] [CrossRef]
  7. Poorooshasb, H.B. Subsidence evaluation of geotextile reinforced gravel mats bridging a sinkhole. Geosynth. Int. 2002, 9, 259–282. [Google Scholar] [CrossRef]
  8. Han, J.; Wang, F.; Miao, L. Numerical analysis of embankments supported by geosynthetics over drilled shafts in karst terrains. In Proceedings of the 11th Multidisciplinary Conference on Sinkholes and the Engineering and Environmental Impacts of Karst, Tallahassee, FL, USA, 22–26 September 2008; pp. 535–544. [Google Scholar]
  9. Al Heib, M.; Hassoun, M.; Emeriault, F.; Villard, P.; Farhat, A. Predicting subsidence of cohesive and granular soil layers reinforced by geosynthetic. Environ. Earth. Sci. 2021, 80, 70. [Google Scholar] [CrossRef]
  10. Won, M.S.; Langcuyan, C.P. Numerical Analyses on the Behavior of Geosynthetic-Reinforced Soil: Integral Bridge and Integrated Bridge System. Appl. Sci. 2021, 11, 8144. [Google Scholar] [CrossRef]
  11. Xu, C.; Liang, C.; Shen, P.; Chai, F. Experimental and numerical studies on the reinforcing mechanisms of geosynthetic-reinforced granular soil under a plane strain condition. Soils Found. 2020, 60, 466–477. [Google Scholar] [CrossRef]
  12. Sukmak, G.; Sukmak, P.; Horpibulsuk, S.; Hoy, M.; Arulrajah, A. Load Bearing Capacity of Cohesive-Frictional Soils Reinforced with Full-Wraparound Geotextiles: Experimental and Numerical Investigation. Appl. Sci. 2021, 11, 2973. [Google Scholar] [CrossRef]
  13. Da Silva Burke, T.S.; Elshafie, M.Z.E.B. Geosynthetic-reinforced soils above voids: Observation of soil and geosynthetic deformation mechanisms. Geotext. Geomembr. 2021, 49, 1–18. [Google Scholar] [CrossRef]
  14. Da Silva Burke, T.S.; Elshafie, M.Z.E.B. Geosynthetic-reinforced soils above voids: Observation and prediction of soil arching. Geotext. Geomembr. 2021, 49, 579–592. [Google Scholar] [CrossRef]
  15. Le, V.; Huang, J.; Bin-Shafique, S.; Papagiannakis, A.T. Model tests of subsidence of the reinforced soil over voids. In Proceedings of the Geo-Shanghai 2014 International Conference: Ground Improvement and Geosynthetics, Shanghai, China, 26–28 May 2014; pp. 312–321. [Google Scholar]
  16. Giroud, J.P.; Bonaparte, R.; Beech, J.F.; Gross, B.A. Design of soil layer-geosynthetic systems overlying voids. Geotext. Geomembr. 1990, 9, 11–50. [Google Scholar] [CrossRef]
  17. Parry, H.J. Coping with Fife’s mining industrial heritage. Munic. Eng. 1983, 110, 231–240. [Google Scholar]
  18. Tano, B.F.G.; Stoltz, G.; Coulibaly, S.S.; Bruhier, J.; Dias, D.; Olivier, F.; Touze-Foltz, N. Large-scale tests to assess the efficiency of a geosynthetic reinforcement over a cavity. Geosynth. Int. 2018, 25, 242–258. [Google Scholar] [CrossRef]
  19. Huckert, A.; Briançon, L.; Villard, P.; Garcin, P. Load transfer mechanisms in geotextile-reinforced embankments overlying voids: Experimental and analytical approaches. Geotext. Geomembr. 2016, 44, 442–456. [Google Scholar] [CrossRef]
  20. Sireesh, S.; Sitharam, T.G.; Dash, S.K. Bearing capacity of circular footing on geocell–sand mattress overlying clay bed with void. Geotext. Geomembr. 2009, 27, 89–98. [Google Scholar] [CrossRef]
  21. Tran, V.D.H.; Meguid, M.A.; Chouinard, L.E. Three-dimensional analysis of geogrid-reinforced soil using a finite-discrete element framework. Int. J. Geomech. 2015, 15, 04014066. [Google Scholar] [CrossRef]
  22. Lawson, C.R.; Yee, T.W. Serviceability limits for basal reinforced embankments spanning voids. In Proceedings of the Geo-Frontiers 2011: Advances in Geotechnical Engineering, Dallas, TX, USA, 13–16 March 2011; pp. 3276–3285. [Google Scholar]
  23. Villard, P.; Huckert, A.; Briançon, L. Load transfer mechanisms in geotextile-reinforced embankments overlying voids: Numerical approach and design. Geotext. Geomembr. 2016, 44, 381–395. [Google Scholar] [CrossRef]
  24. Lai, F.; Chen, F.; Li, D. Bearing capacity characteristics and failure modes of low geosynthetic-reinforced embankments overlying voids. Int. J. Geomech. 2018, 18, 04018085. [Google Scholar] [CrossRef]
  25. Galve, J.P.; Gutiérrez, F.; Guerrero, J.; Alonso, J.; Diego, I. Optimizing the application of geosynthetics to roads in sinkhole-prone areas on the basis of hazard models and cost-benefit analyses. Geotext. Geomembr. 2012, 34, 80–92. [Google Scholar] [CrossRef]
  26. Galve, J.P.; Gutiérrez, F.; Guerrero, J.; Alonso, J.; Diego, I. Application of risk, cost–benefit and acceptability analyses to identify the most appropriate geosynthetic solution to mitigate sinkhole damage on roads. Eng. Geol. 2012, 145, 65–77. [Google Scholar] [CrossRef]
  27. Chen, F.Q.; Lin, Y.J.; Chen, S.X. Analytical solutions for geosynthetic-reinforced cohesive subgrade spanning trench voids. Geotext. Geomembr. 2020, 48, 854–866. [Google Scholar] [CrossRef]
  28. Villard, P.; Briancon, L. Design of geosynthetic reinforcements for platforms subjected to localized sinkholes. Can. Geotech. J. 2008, 45, 196–209. [Google Scholar] [CrossRef]
  29. Feng, S.J.; Ai, S.G.; Chen, H.X.; Xie, H.J. An analytical method for predicting load acting on geosynthetic overlying voids. Geotext. Geomembr. 2017, 45, 570–579. [Google Scholar] [CrossRef]
  30. Feng, S.J.; Ai, S.G.; Chen, H.X. Membrane effect of geosynthetic reinforcement subjected to localized sinkholes. Can. Geotech. J. 2018, 55, 1334–1348. [Google Scholar] [CrossRef] [Green Version]
  31. Wu, D.; Wu, J.J.; Xu, C.; Chen, X.J.; Huang, X. Model test of geotextiles in controlling the collapse of karst roadbed. Rock Soil Mech. 2020, 41 (Suppl. S2), 1–11. (In Chinese) [Google Scholar]
  32. Wu, D.; Luo, C.; Wu, J.J. Model tests of geotextile in collapse treatment of karst subgrade. In Proceedings of the 6th International Conference on Hydraulic and Civil Engineering, Xi’an, China, 11–13 December 2020; Volume 643, p. 012058. [Google Scholar]
  33. Westine, P.S.; Dodge, F.T.; Baker, W.E. Similarity Methods in Engineering Dynamics: Theory and Practice of Scale Modeling; Elsevier: Amsterdam, The Netherlands, 2012. [Google Scholar]
  34. Wang, L.; Zhang, G.; Zhang, J.M. Centrifuge model tests of geotextile-reinforced soil embankments during an earthquake. Geotext. Geomembr. 2011, 29, 222–232. [Google Scholar] [CrossRef]
  35. British Standards Institution. British Standard 8006. Code of Practice for Strengthened/Reinforced Soils and Other Fills; BSI Standards Publication: London, UK, 2010. [Google Scholar]
Figure 1. Model size and layout of instruments (units: mm): (a) cross-section view; (b) top view.
Applsci 11 11826 g001
Figure 2. Tensile force of model geotextile.
Applsci 11 11826 g002
Figure 3. Numerical model.
Applsci 11 11826 g003
Figure 4. Final state of the subsidence simulation for using a geotextile for the treatment of subsidence: (a) model test; (b) numerical modeling.
Applsci 11 11826 g004
Figure 5. Comparison between the results of the numerical modeling and the model test at the final state of subsidence: (a) soil pressure beneath the geotextile at L = 2.0B; (b) tensile force for the geotextile at L = 2.0B; (c) relative settlement d for different anchorage ratios L/B.
Applsci 11 11826 g005
Figure 6. Soil pressure beneath the geotextile for different anchorage ratios L/B at the final state of subsidence: (a) stable area; (b) subsidence area.
Applsci 11 11826 g006aApplsci 11 11826 g006b
Figure 7. Comparison of the soil pressure beneath geotextile at the final state of subsidence between model tests and numerical modeling.
Applsci 11 11826 g007
Figure 8. Tensile force of geotextile for different anchorage ratios L/B at the final state of subsidence.
Applsci 11 11826 g008
Figure 9. Vertical deflection of geotextile in subsidence area for different buried depths H at the final state of subsidence.
Applsci 11 11826 g009
Figure 10. Vertical displacement contours of soil for different buried depths of the geotextile for different anchorage ratios L/B at the final state of subsidence: (a) L = 0B; (b) L = 0.25B; (c) L = 0.35B; (d) L = 0.5B; (e) L = 0.75B; (f) L = 1.0B.
Applsci 11 11826 g010aApplsci 11 11826 g010b
Figure 11. Surface settlement for different anchorage ratios L/B at the final state of subsidence.
Applsci 11 11826 g011
Figure 12. Decrement ratio of surface settlement under different anchorage ratios L/B.
Applsci 11 11826 g012
Figure 13. Soil pressure beneath the geotextile for different buried depths of geotextile H at the final state of subsidence.
Applsci 11 11826 g013
Figure 14. Tensile force for the geotextile at different buried depths at the final state of subsidence.
Applsci 11 11826 g014
Figure 15. Vertical deflection of the geotextile in the subsidence area for different buried depths at the final state of subsidence.
Applsci 11 11826 g015
Figure 16. Vertical displacement contours of the soil for different buried depths of the geotextile (H): (a) H = 2 m; (b) H = 3 m; (c) H = 4 m; (d) H = 5 m; (e) H = 6 m.
Applsci 11 11826 g016aApplsci 11 11826 g016b
Figure 17. Surface settlement for different buried depths of the geotextile (H) at the final state of subsidence.
Applsci 11 11826 g017
Figure 18. Decrement ratio of surface settlement against different buried depth values (H).
Applsci 11 11826 g018
Figure 19. Minimum anchorage ratio of the geotextile for different buried depths of the geotextile (H).
Applsci 11 11826 g019
Table 1. Scaling factors in the scale model test.
QuantityUnitScaling Factor (Ip:Im)
LengthmN
ForceNN2
MasskgN3
Densitykg/m31
StressPa1
Strain%1
Tensile loadN/mN
Secant stiffnessN/mN
Table 2. Model test program.
VariationTest No.Subsidence Width, B (mm)Anchorage Length of the Geotextile, L (mm)Anchorage Ratio, L/BBuried Depth of the Geotextile, H (mm)
Anchorage length of the geotextile [31]T13006002.01000
T23003001.01000
T33001500.51000
T4300750.251000
T530000N.A.
Buried depth of the geotextile [32]T13006002.01000
T63006002.0500
Table 3. Material parameters used in the numerical modeling.
MaterialModel Type Unit Weight, γ (kN/m3)Elastic Modulus, E’
(kN/m2)
Poisson’s Ratio, ν’Cohesion, c’ (kPa)Internal Friction Angle, φ’ (°)Tensile Stiffness, J (kN/m)
Subgrade fillMohr–Coulomb model1730,0000.3133-
ReinforcementElastic model-----3000
Table 4. Numerical modeling program.
VariationNumerical ModelSubsidence Width, B (mm)Anchorage Length of Geotextile, L (mm)Anchorage Ratio, L/BBuried Depth of Geotextile, H (mm)
Anchorage length of geotextileM1150000N.A.
M215003750.255000
M315005250.355000
M415007500.505000
M5150011250.755000
M6150015001.005000
Buried depth of geotextileM715008500.572000
M815008500.573000
M915008500.574000
M415008500.575000
M715008500.576000
Publisher’s Note: MDPI stays neutral with regard to jurisdictional claims in published maps and institutional affiliations.

