Featured Application
A development of the FRAM visualisation software to enable quantitative prediction of system performance.
Abstract
In analysing the performance of complex sociotechnical systems, of particular interest is the inevitable and inherent variability that these systems exhibit, but can normally tolerate, in successfully operating in the real world. Knowing how that variability propagates and impacts the total function mix then allows an understanding of emergent behaviours. This interdependence, however, is not readily apparent from normal linear business process flow diagrams. An alternative approach to exploring the operability of complex systems, that addresses these limitations, is the functional resonance analysis method (FRAM). This is a way of visualising a system’s behaviour, by defining it as an array of functions, with all the interactions and interdependencies that are needed for it to work successfully. Until now this methodology has mainly been employed as a qualitative mind map. This paper describes a new development of the FRAM visualisation software that allows the quantification of the extent and effects of this functional variability. It then sets out to demonstrate its application in a practical, familiar test case. The example chosen is the complex sociotechnical system involved in a Formula 1 pit stop. This has shown the potential of the application and provided some interesting insights into the observed performances.
1. Introduction
Operational research (OR) is a well-established approach that has proven its worth in many fields including healthcare. Monks, [1] defines it as
“The discipline of using models, either quantitative or qualitative, to aid decision making in complex systems.”
He stresses that in healthcare OR, particularly, it is “action research”—based (unlike health economics), on working collaboratively with those that actually use the system “to define, develop and find ways to sustain solutions to live implementation problems.”
But when studying complex sociotechnical systems, it is difficult to build the models needed and select a methodology that adequately covers all the critical nonlinear, non-sequential, not predetermined, interactions that typify the emergent (sometimes unexpected), behaviours observed.
Historically, such models have been developed to find the causes, or potential causes of failures of the system (accidents and incidents). Those developed more recently, recognising the complexity of systems (such as Accimaps, STAMP, etc.), are still mainly accident-focused, qualitative “pictures” of the system; developed to aid understanding, not necessarily to produce quantitatively justified solutions to implement.
For manufacturing systems there is a long tradition of statistically analysing the behaviour of such systems as black boxes, which originally, the “quality circles” [2] and more recently the LEAN Six-Sigma black belts [3] could analyse to develop quantitative implementable solutions, but again primarily focused on fixing defects and waste of time and resources (Muri, etc.) [4]. In healthcare applications, the systems tend to be more complex and fluid. Unlike the relatively ordered discipline of the manufacturing plant, the processes carried out often need to be dynamically reorganised to respond to unexpected and emergency situations.
Functional resonance methodology [5], is being increasingly employed in healthcare studies precisely because it can address these more complex situations. Recent examples range from learning the lessons from a mass casualty incident, for improving the response of a paediatric major casualty centre [6], to examining the effectiveness of the UK’s response to the COVID-19 pandemic [7,8]. There are now also two extensive literature reviews of the use of the FRAM approach [9,10], which give an excellent overview of the extent and effectiveness of the methodology. Of more immediate interest is its application in analysing how work is actually—on the ground—done, (WAD), rather than how it is scripted by written procedures (work as imagined—WAI), by studying videoed simulations of trauma teams (Mackinnon [6]); and its utilisation in minimising hospital-acquired COVID-19 infection in emergency departments [11]. In these studies, it is hoped that processes involved may be further optimised, both in terms of timing and use of scarce resources. What is needed to achieve this, is to incorporate into the FRAM methodology, a facility for integrating these more quantitative “operational research” capabilities. Additionally, attractive for OR applications, is that FRAM is quintessentially an “action research” approach. All that is lacking from an OR perspective is a means of quantifying the insights from the applications. Recent developments in the FRAM methodology can now offer this opportunity; and this paper sets out to demonstrate an application using a very familiar (to most), case study as a test of its validity.
The method was developed by Hollnagel [5], as an aid to understanding the intricacies and critical interactions and interdependencies in complex sociotechnical systems. Compared to current approaches to attempting to “model” complex sociotechnical systems, FRAM potentially can give a much more sophisticated view of how more subtle and unexpected behaviours could emerge from an ability to additionally identify more nonlinear interactions across the whole system. Central to the methodology is a focus on how the variability always present in real world applications can be included and traced through to its often-emergent, unexpected consequences. Mapping out the implications of this natural variability in conditions and how that variability maps on to other functions helps to work out why and how both observed and unscripted behaviours emerge.
More recent developments in the methodology have included facilities to visualise and model these intricate interactions (the FRAM model visualiser FMV) [12]. Further work has enabled a strict “spellchecking” of their logic, completeness, and validity (the FRAM model interpreter, FMI) [13] Other developments in the software tools available, have attempted a more formal inclusion and prediction of these variability effects, first with a MonteCarlo approach (myFRAM [14]), and then using Fuzzy logic. (Fuzzy FRAM [15]). Now the latest version of the original FRAM model visualiser (FMV) software, has a facility for adding and utilising metadata associated with the individual functions and also to stipulate (code) exactly how these metadata are transmitted to affect other functions’ metadata, quantitatively. Since this work was done, we have become aware of a more recently published paper [16] on another external software application (DynaFRAM), which takes FMV models and traces how variabilities propagate temporally and quantitatively.
This ability to be able quantitatively, to predict emergent variabilities in systems, now allows a more systematic approach to understanding and influencing its extent and effects on system performance. This has long been the goal of much industrial attention (quality, LEAN, Six Sigma, etc. [2], and is also of great interest in improving performance in highly intensive and hazardous situations, such as healthcare [17]. This has implications for safety as well as economic costs and benefits.
2. The Functional Resonance Analysis Method
The FRAM approach is now well-documented, and there is a growing body of literature on its applications [9]. Recent developments in the methodology referred to above now offer the ability to assign specific properties to individual functions (metadata) and to track how they affect all the other functions in the system.
This ability to trace the quantitative effects of upstream functions on downstream functions is a typical OR, or LEAN interest, and the equations of Little and Kingman have been specifically developed for predetermined linear sequences of functions. What FRAM offers is now a way of applying these “Factory Physics” equations [18] in a more complex interactive system of functions.
If we think of a function as a task or a process employed in manufacturing, we can see that the same attributes are of interest in both cases.
- Exactly what does that function, or part of the system or process, actually do?(Note that this is not the same question as ‘What piece of equipment or human operator does it?’).
- What does it need to start the process (inputs)?
- What does it deliver when it’s working successfully (outputs)?
- What other “aspects” are important, such as preconditions, resources, controls, or timings/sequences in the system?
- What is the effect on the function and system if everything is not absolutely correct (too little, too much, too early, or too late.)?
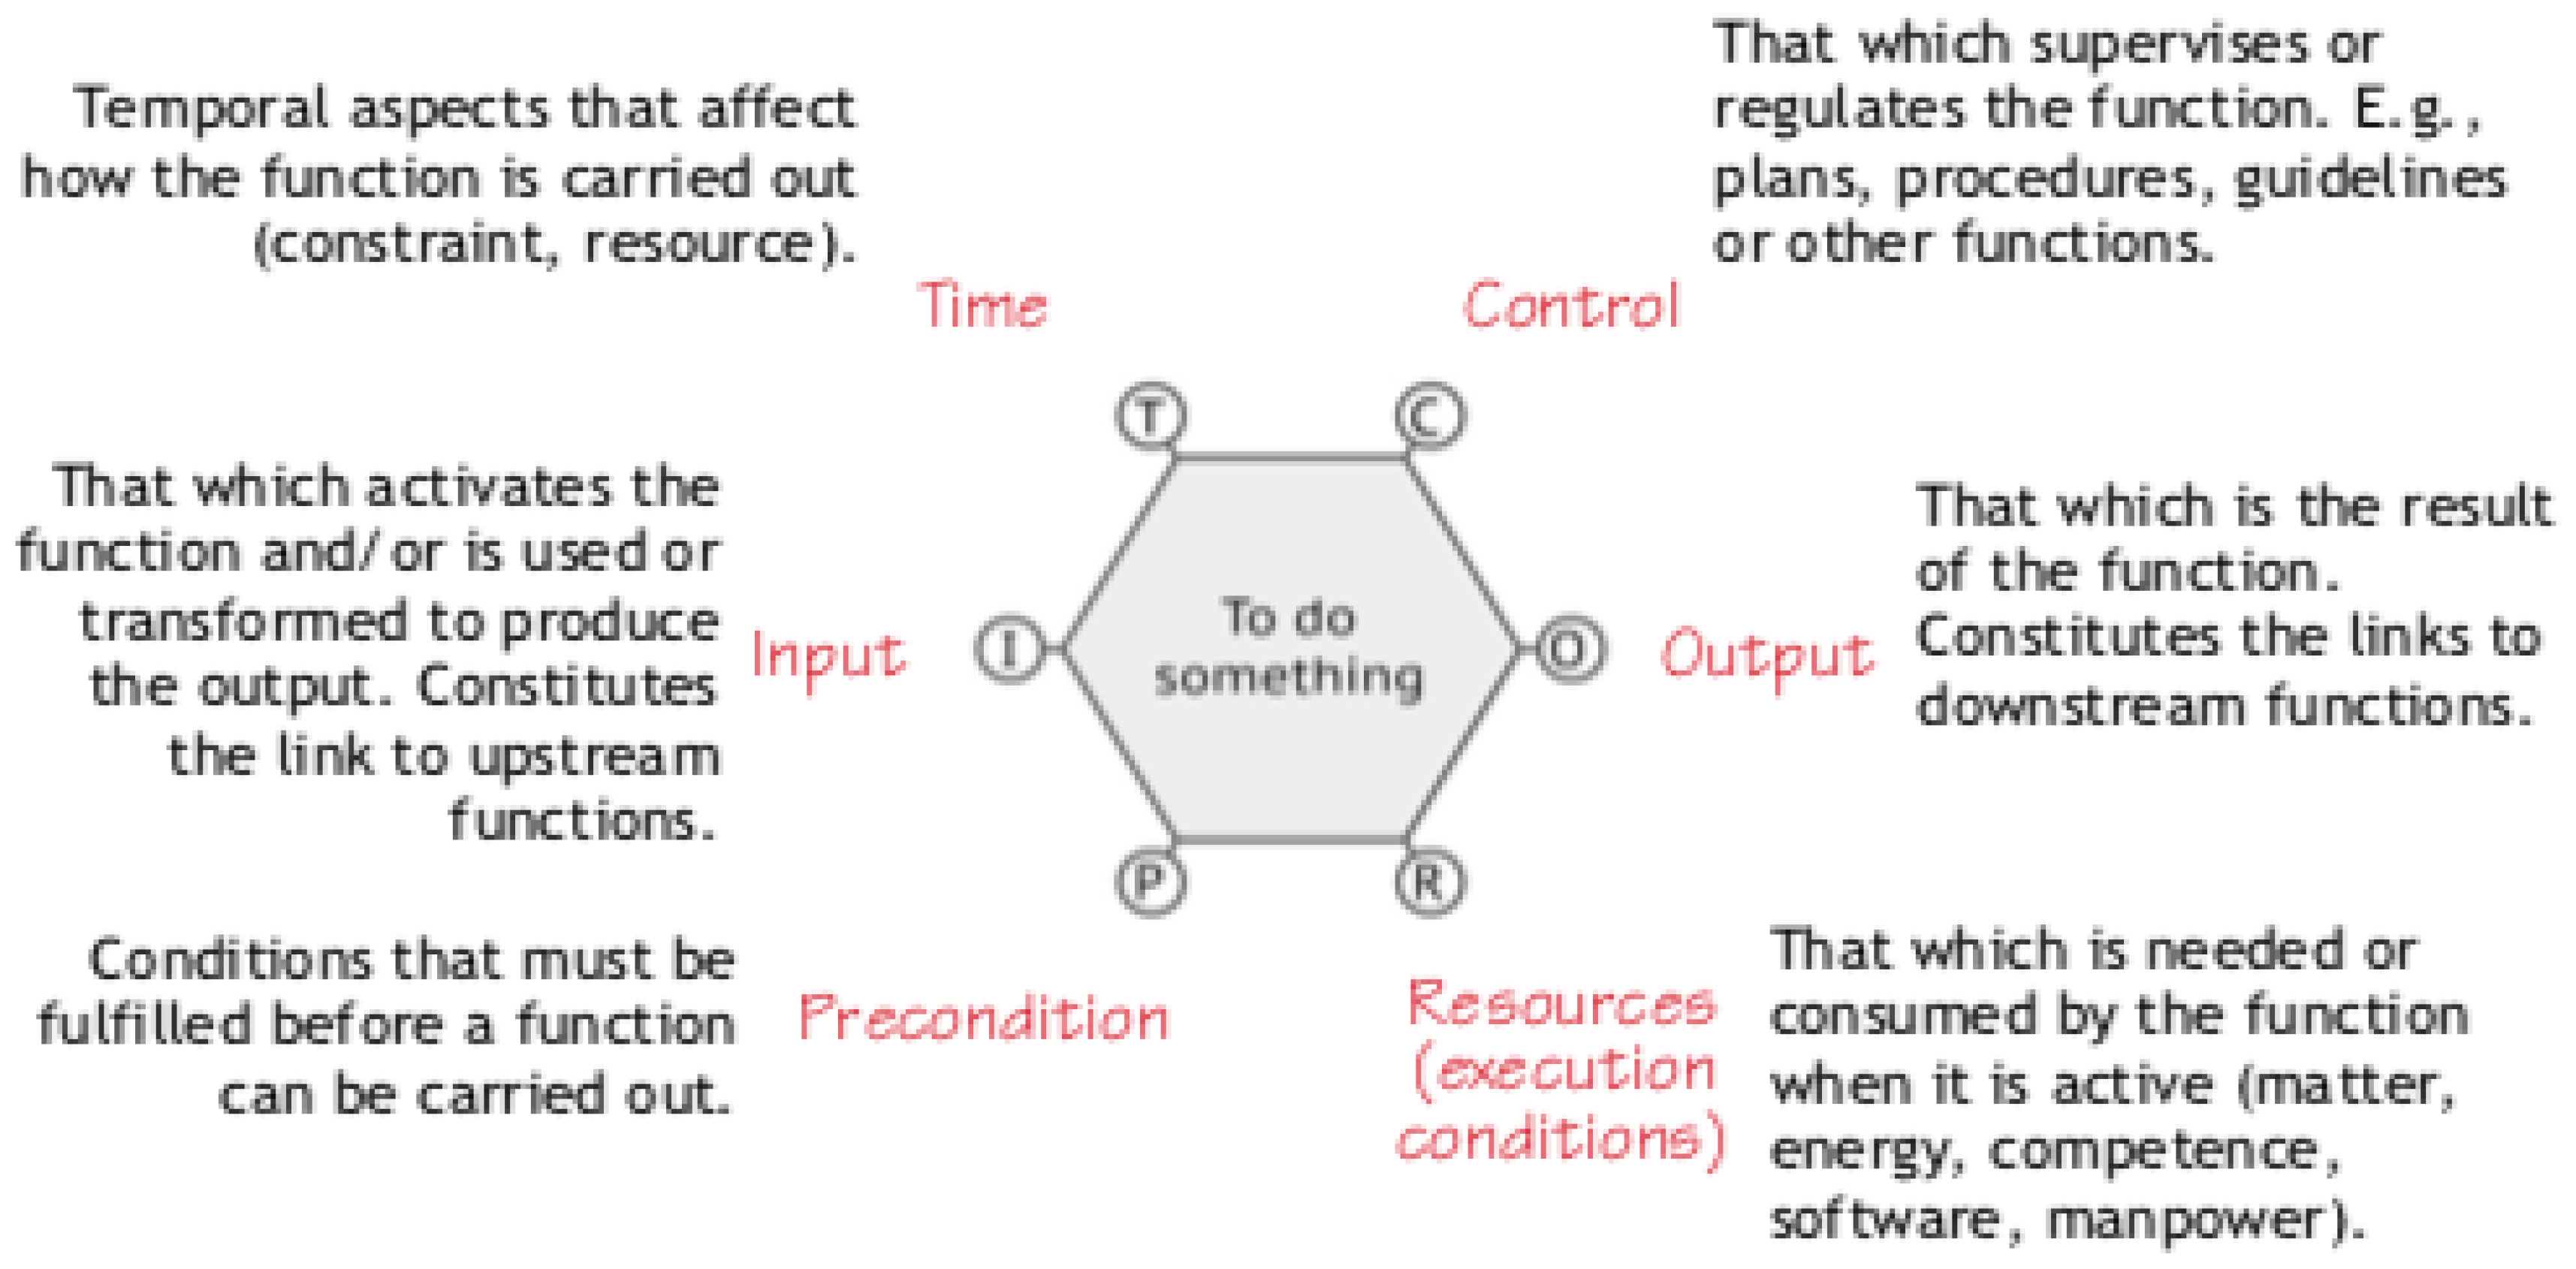
In FRAM analyses, this function is normally represented as a hexagon, as in the classic diagram, Figure 1 below.
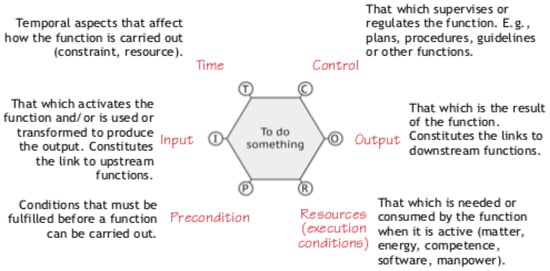
Figure 1.
The different aspects of a FRAM function—after Hollnagel.
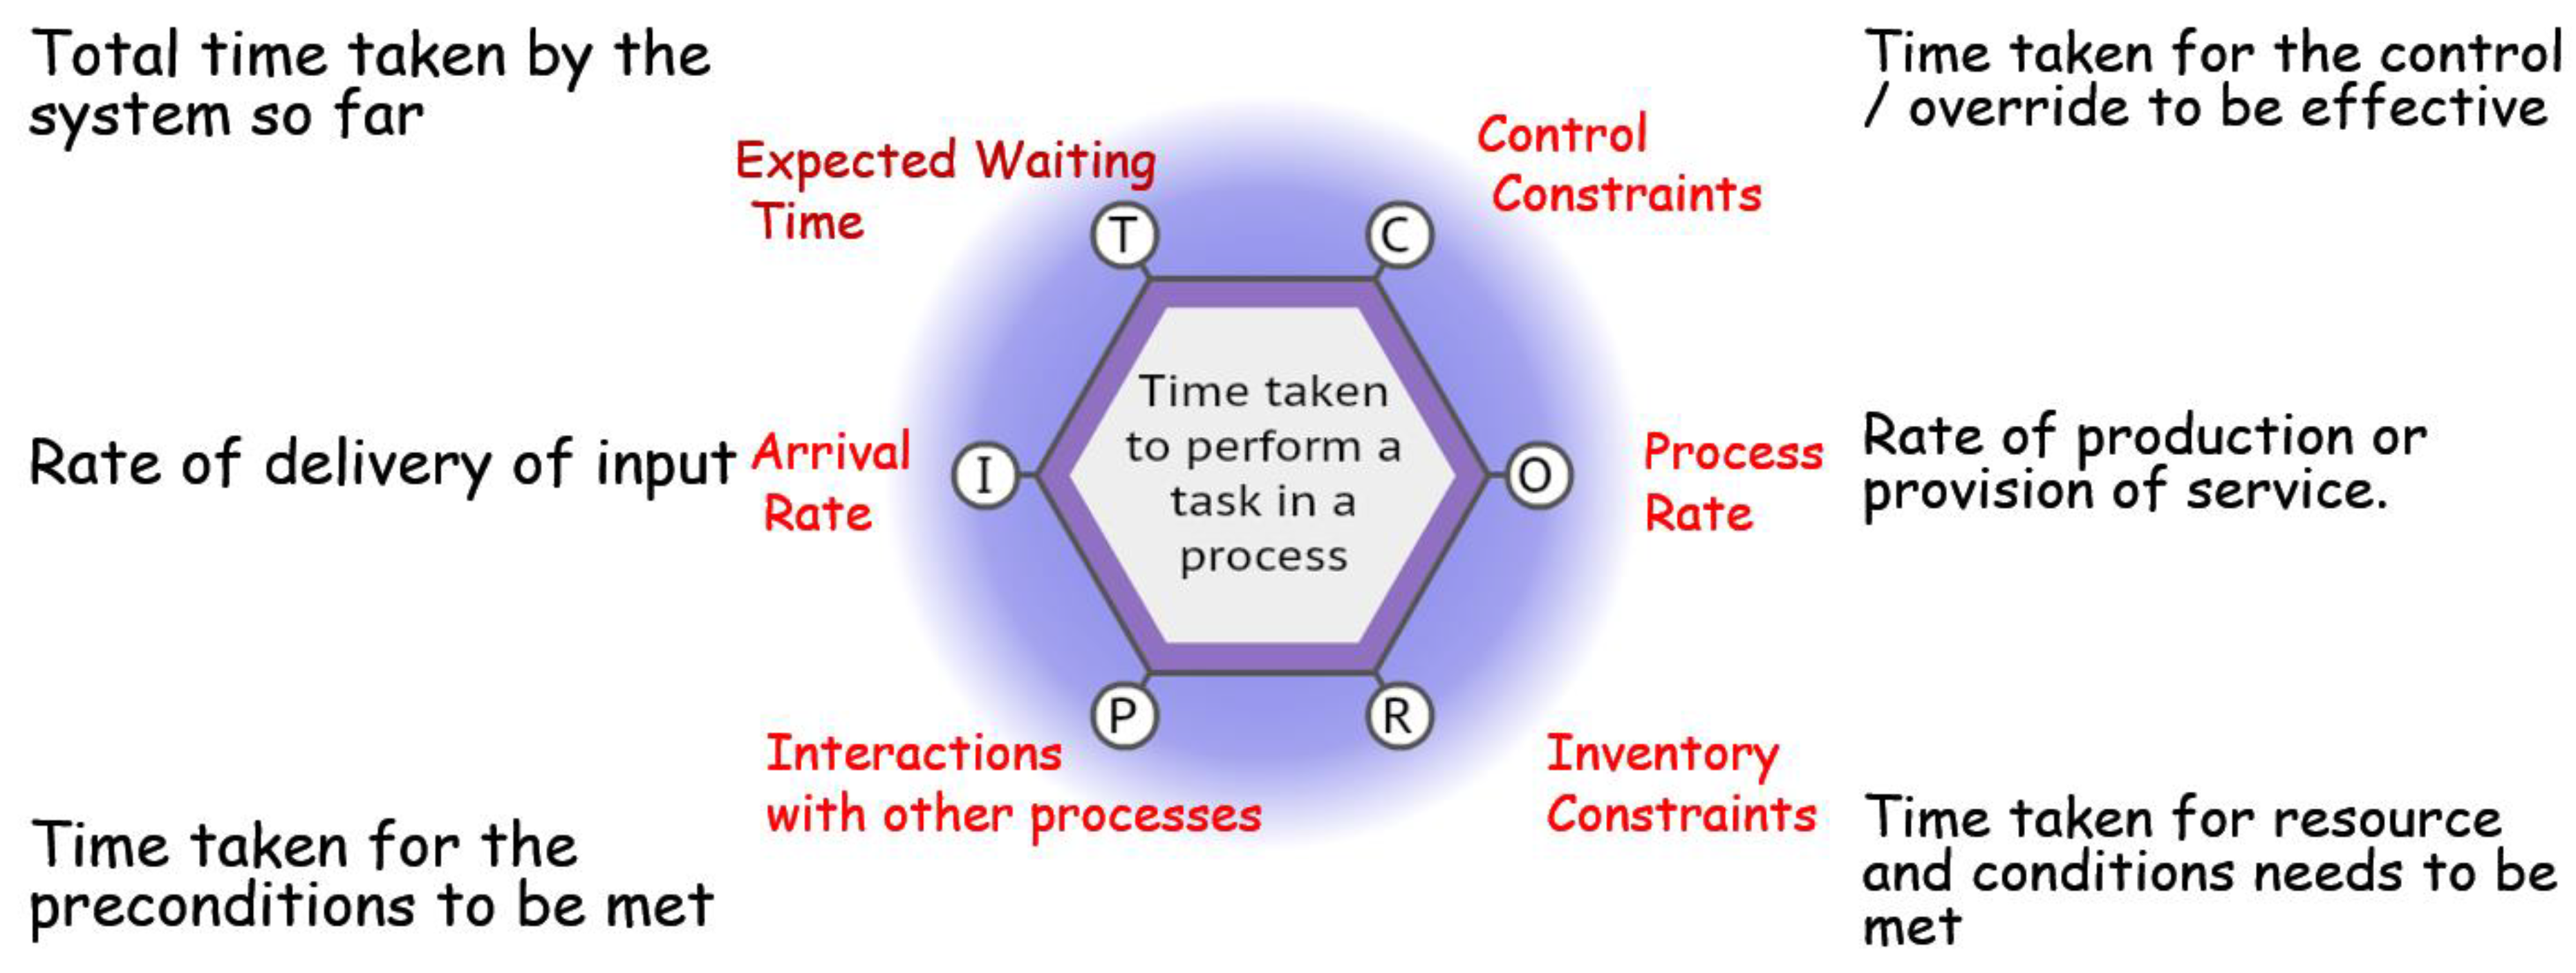
But until now there has not been a way of answering those other important questions that OR needs as data (Figure 2).

Figure 2.
The additional temporal aspects of interest for a typical FRAM function.
- How long does the function need to produce the output (time taken, process rate, cycle time, etc.)?
- What effect does the supply of inputs, resources, etc., have on the operation of the function, its output performance?
- How does that affect the system?
- What is the total time taken for the system to deliver its intended result?
These questions can now be answered by introducing the ability to calculate the time taken for these FRAM functions to interact, using the metadata processing facility. This feature allows the quantification of critical timings affecting the total behaviour of the system. This enables us to calculate, for each of the functions in turn, the following temporal aspects.
Each of these can be obtained by assigning to each function a set of key variables and a way of calculating their “values”—numerical or literal, in the form of an equation linking the relevant interaction aspects with the way the function functions.
For example, it allows us to specify a function execution time—
Here, the key would be labelled “processingtime”, or “cycle time”, or even “processrate”).
And the value—output rate, or cycle time—would be specified for that function, calculated from values from other functions, or perhaps its value read directly from a value in another aspect link.
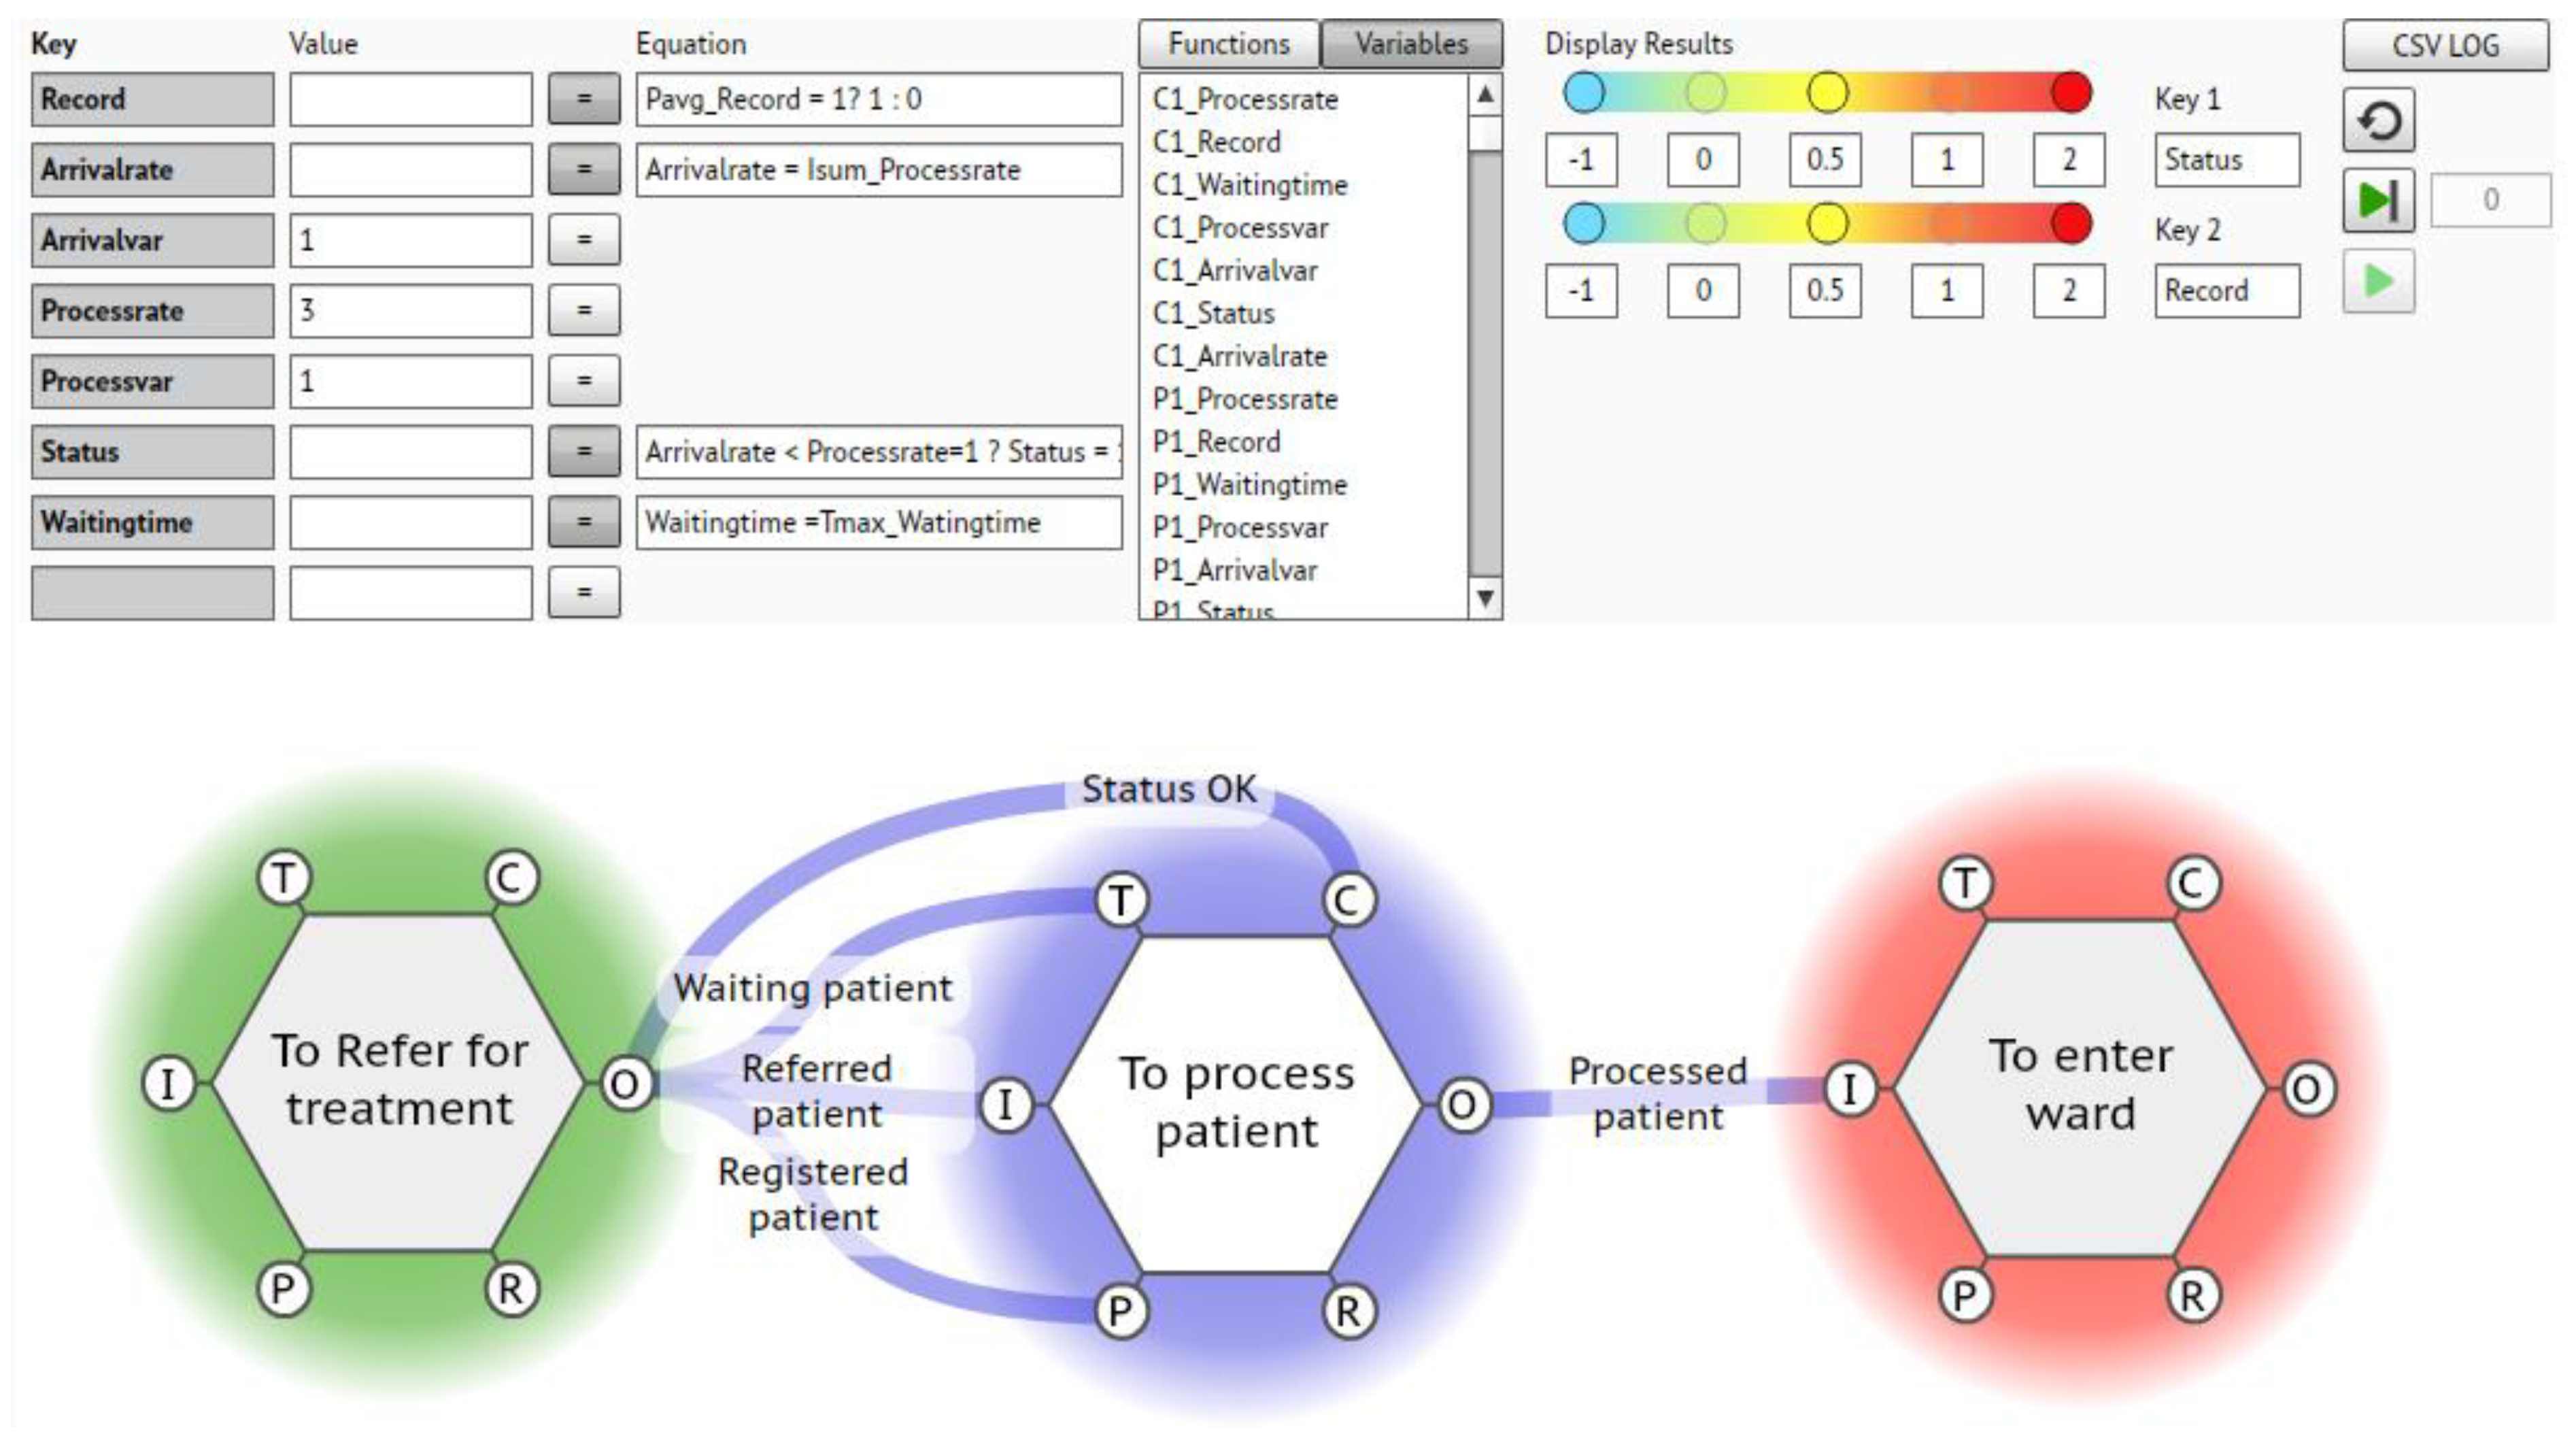
The key, its value, or the equation needed to calculate it can be entered into the metadata dialogue box in the FMV (Figure 3).
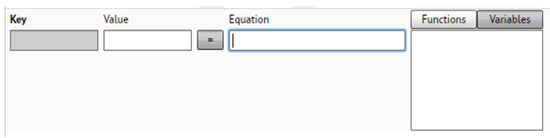
Figure 3.
The metadata input boxes in the FMV user interface.
We can illustrate this by considering what these metadata should be for a proposed application of the methodology if this test case is convincing. This extended FRAM OR approach is proposed for use by an interdisciplinary group of researchers called the Wales Ergonomics and Safer Patients Alliance (WESPA). One of their key activities has been to support the Emergency Department (ED), at Cardiff and Vale University Health Board, to create system models using the functional resonance analysis method.
For example, then, in the intended the ED attendance application, we can assign a triage time of, for example, 15 min, which means we can process a maximum of 4 patients per hour. So, this “value” can be assigned as a key in the triage function metadata.
Also, we can add another key—the process rate variability—and use its stored value to show the effects of variability on this and other interactions, which could come into play with, for example, too short, or too long waits for treatment.
This time taken to successfully deliver the output of this triage function can thus delay the execution of any other downstream function with which it interacts. With two functions interacting, differential processing rates mean that the overall processing rate is thus determined by the slowest function, but the time taken is the sum of the processing times.
These features can now be built into the FRAM model of the behaviour of the system by adding the requisite key-value pairs. A possible range of key-value metadata pairs that we can create and populate to describe the potential behaviour of a typical function could be as shown in Figure 4.
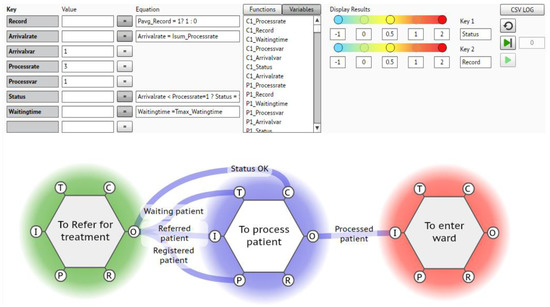
Figure 4.
Showing the metadata for a simple ED FRAM.
In this example we have chosen the key-value pairs as follows (Table 1).

Table 1.
Possible metadata pairs for the scenario above.
But before embarking on a full implementation of this approach, it was felt necessary to demonstrate and validate its utilisation, as any such study of a real emergency department in a real hospital, treating real people, requires enough confidence in the methodology to justify the inevitable disruption and resource diversion. So, it was decided to look at an example suitable for a desktop trial application.
3. Results
The requirement was for a complex sociotechnical system, which had sufficient readily- and publicly available information on the details and timings involved in ensuring successful operation in a high-stress situation. We felt that the processes involved in a Formula 1 pit stop presented such a test case. A marketing desire for publicity, the competition between the different teams involved, and the interest in the public pronouncements of the regulators and stewards “holding the ring” has ensured that there is sufficient information readily available to attempt/ensure a valid test. The example reference source chosen [19], is given n below.
F1 Pit Stop in Two Seconds: An In-Depth Analysis—YouTube.
3.1. What Are We Modelling?
This is quintessentially a high-speed, high-intensity, high-stress environment, where mistakes cost time and money. Furthermore, there is ample information to discern the procedures involved (work as imagined). For example, we need to know:
- -
- What tasks are involved?
- -
- What functions are needed to perform those tasks?
- -
- Are there critical needs that the process must complete successfully?
- -
- Do we have the timings, sequencing, resources, preconditions, mandatory controls, external constraints, operational limitations, etc., needed to enable the system to perform as designed?
From the source above, and guides that are available in the literature, a basic overview was obtained. It basically consists of a sequence of logical steps. We can see there are at least 23 people involved, performing the following functions.
- The racing driver, whose role is to deliver the car into the designated pit box and stop precisely on his prescribed “marks” (the driver).
- Two mechanics are assigned to lift the front and rear of the car using special jacks (the jack men).
- There are two mechanics standing with spare jacks in case of a malfunction with the prime jacks (the backup jack men).
- Two mechanics steady the car body on either side of the driver (the stabilisers).
- Two (one either side) mechanics inspect and clean the front wing, perhaps replacing it if necessary (front wing men).
- Similarly, two mechanics service the rear spoiler (rear wing men).
- Four separate teams (one for each wheel) of three mechanics operating in parallel, to change the tyres (the tyre-change teams). This subunit consists of one mechanic loosening and tightening the wheel nuts (air gun man), one removing the old tyre, and one putting on the new one).
- A mechanic stationed to monitor the pit lane to ensure enough space to release the car (the lookout).
- Finally, a mechanic whose job is to check that everything has been completed safely, including waiting for safe space, before releasing the car with a green traffic light (the pit boss).
3.2. How Do These Functions Combine to Define the System?
The aim here is to build a FRAM model of the system involved in the process/activity. So, the functions identified are set out in an interacting, interdependent picture, as a “cloud” visualisation, normally achieved using the software tool, the FRAM model visualiser, (FMV), so that we can identify and specify:
- -
- The critical “FRAM aspects”, or execution conditions for each function (Figure 5), needed to allow the function to operate and fulfil its task.
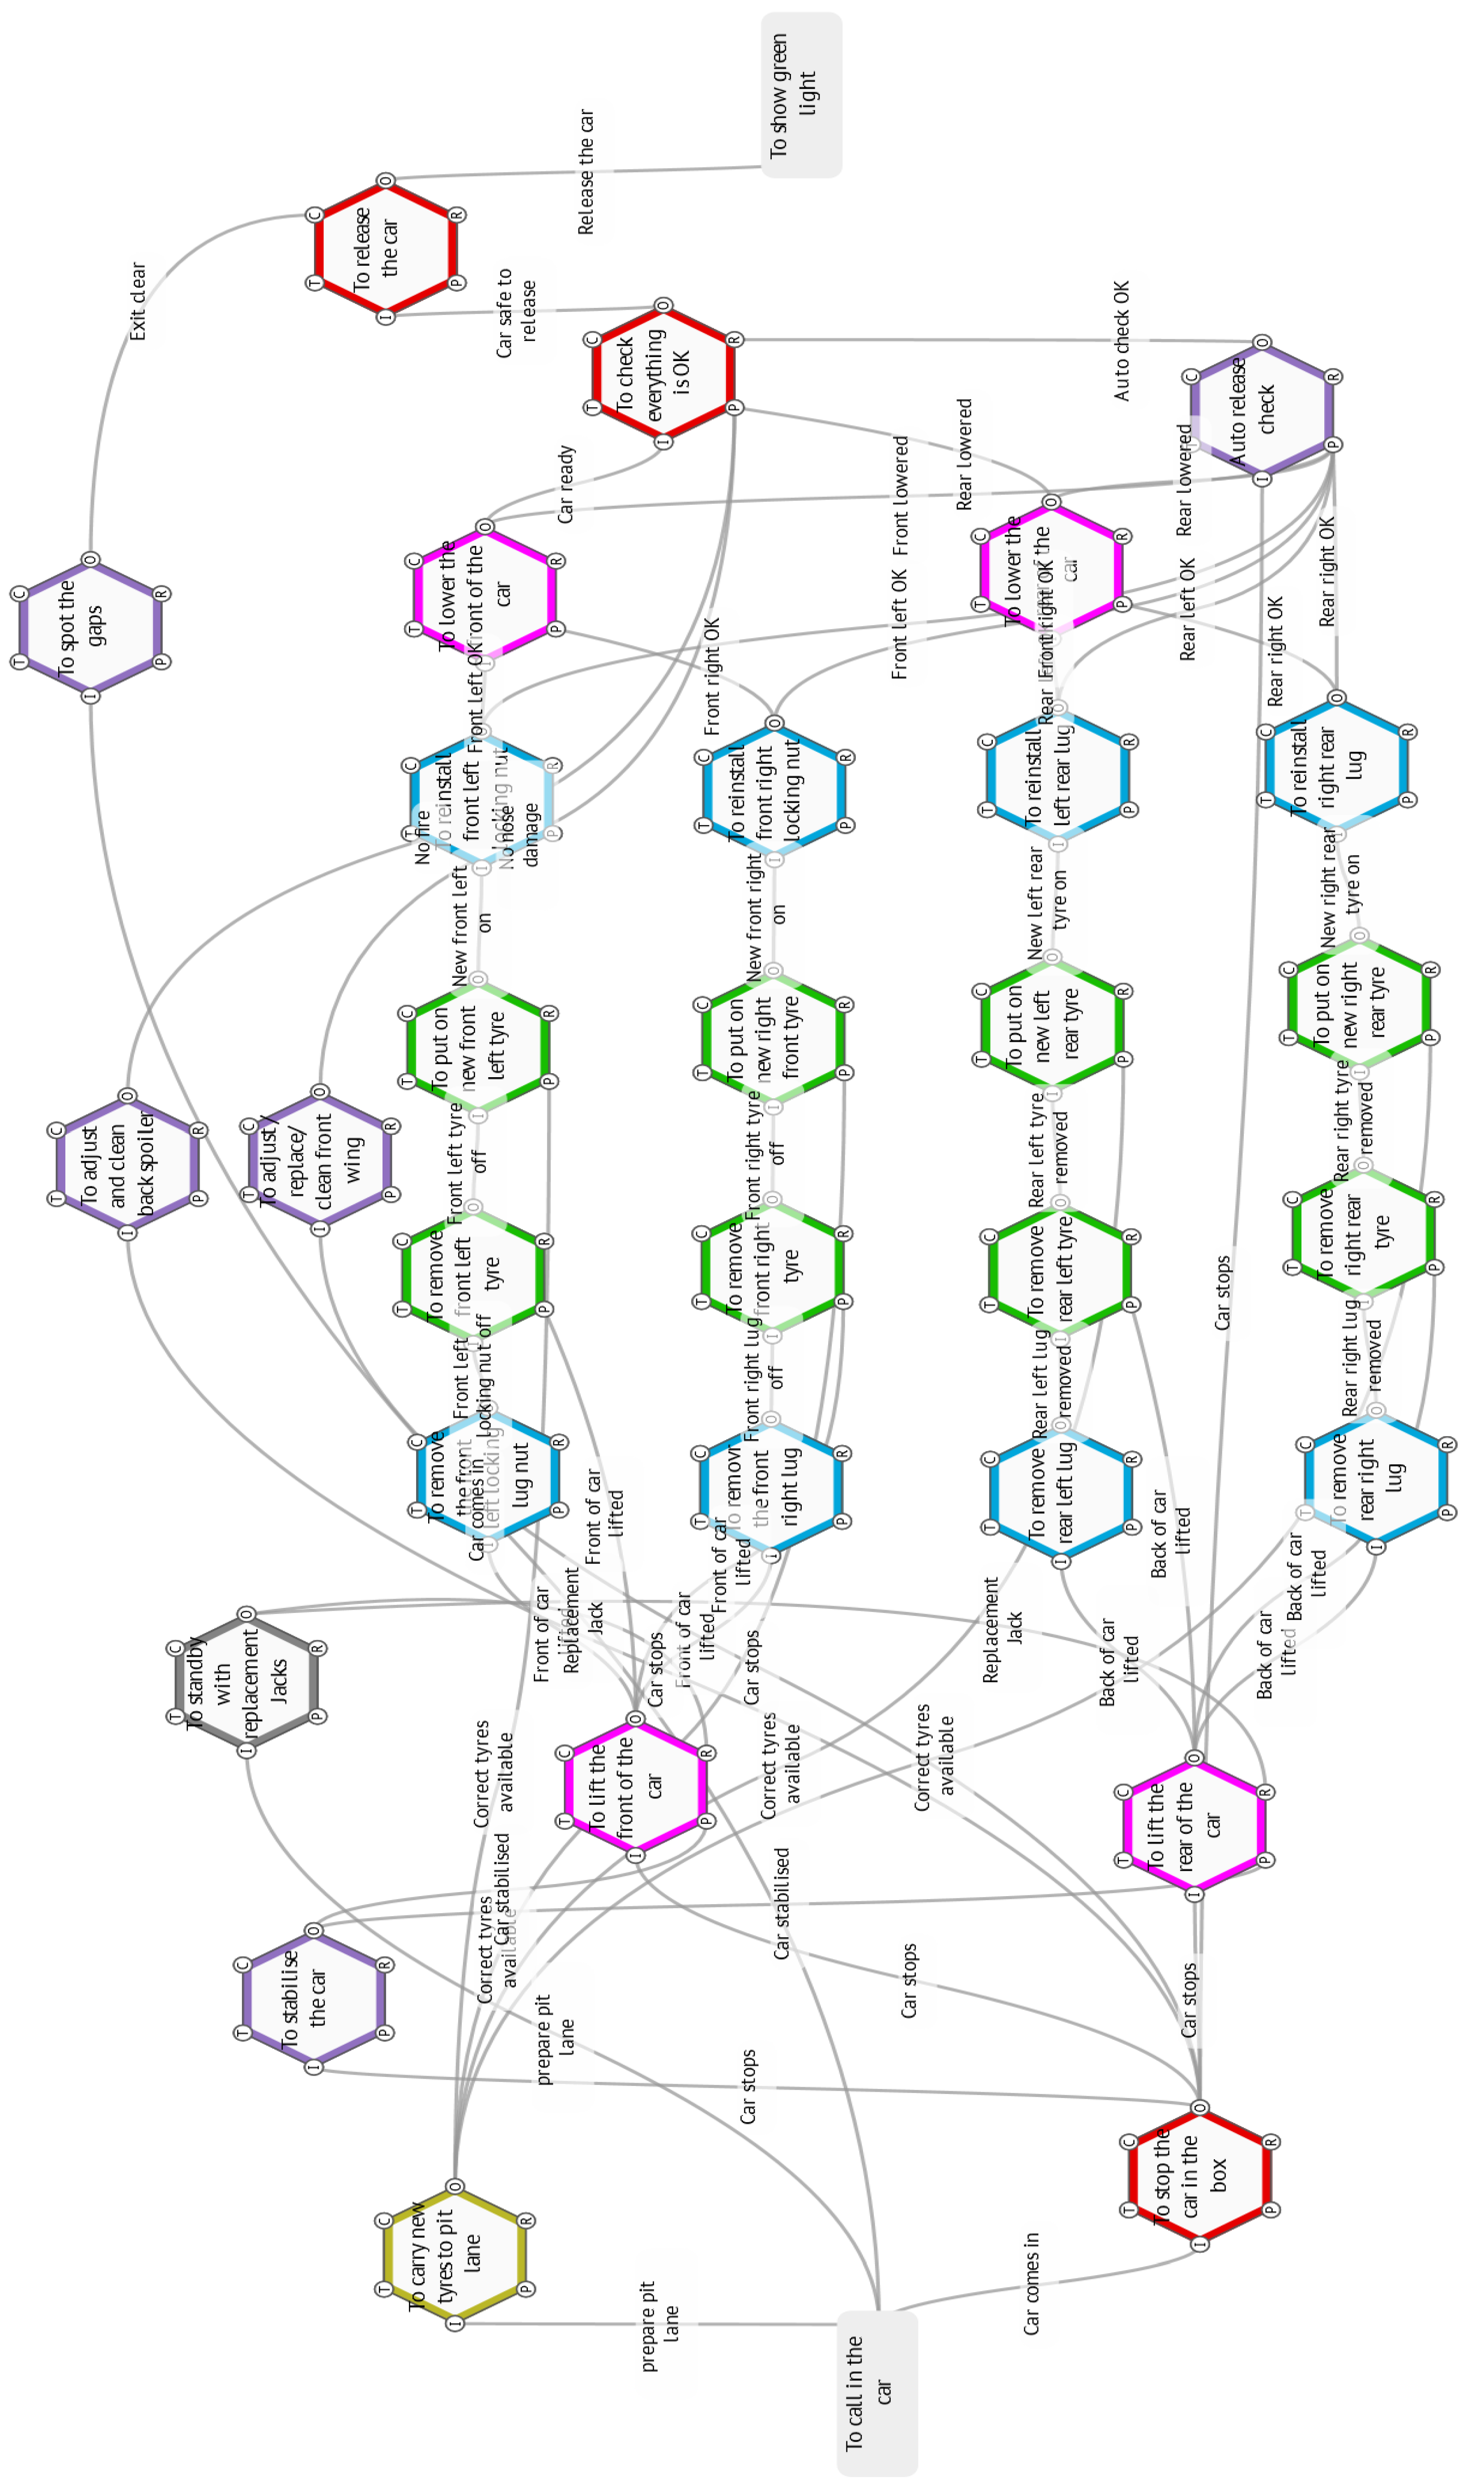
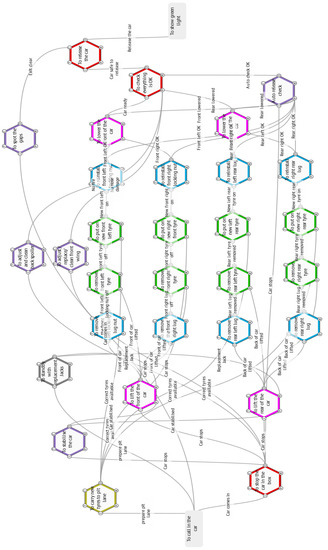 Figure 5. The ‘work as imagined’ FRAM model.These “Aspects” will thus consist of an input(s) needed to trigger the function, plus any other requirements, such as preconditions, resources, control states or signals and any timing constraints.
 - -
- These interacting links between the functions can only arise as outputs of other functions and as such, they will build up as the analyst steps through all the functions in the system.
- -
- Functions with outputs only, are, by definition, background functions, which set the boundaries of the system. They are also the sink or drain (exit) functions, which only have an input. All the rest are therefore foreground functions.
- -
- Background functions can also be used as placeholders for later extensions, as FRAM models can be developed more widely, or merged with other activities.
- -
- Similarly, foreground functions can be expanded like Russian dolls (functions within functions), to probe finer details. This is also facilitated in the FMV software.
- -
- In a sequence of tasks in a particular instantiation of the model, (a specific instance or “snapshot” of the system’s operations), those functions which have to deliver before others can begin, are called upstream functions.
- -
- Then subsequent functions are obviously downstream functions.
- -
- In any particular instantiation of the model, outputs from downstream functions cannot link to aspects of upstream functions. For example, they cannot initiate upstream functions if they themselves have not been initiated.
- -
- Similarly closed loops are not allowed, where a function’s outputs are linked back as aspects of the same function.
In contrast, aspects not linked to specific outputs of other functions are known as “orphans”, which need resolving before a model can be validated.
3.3. The Work as Imagined FRAM Model below Was Assembled Based on the above Assumptions
Normally this “as imagined” system model is checked in two ways:
- -
- Peer Review—Most FRAM analysts will, at this stage, look for confirmation of the model’s accuracy and check the visualisation as a run through session with the teams involved. In this case the model was checked against the videos available in the literature.
- -
- Formal Validation—Having agreed that the system model now accurately reflects the process “as done”, the FRAM model can now be checked and adjusted for consistency and completeness, using another software facility, the FRAM model interpreter, (FMI). This was completed successfully.
The resulting FRAM instantiation of the pit stop in action is shown below in Figure 5.
3.4. The Keys Chosen for the Test Case
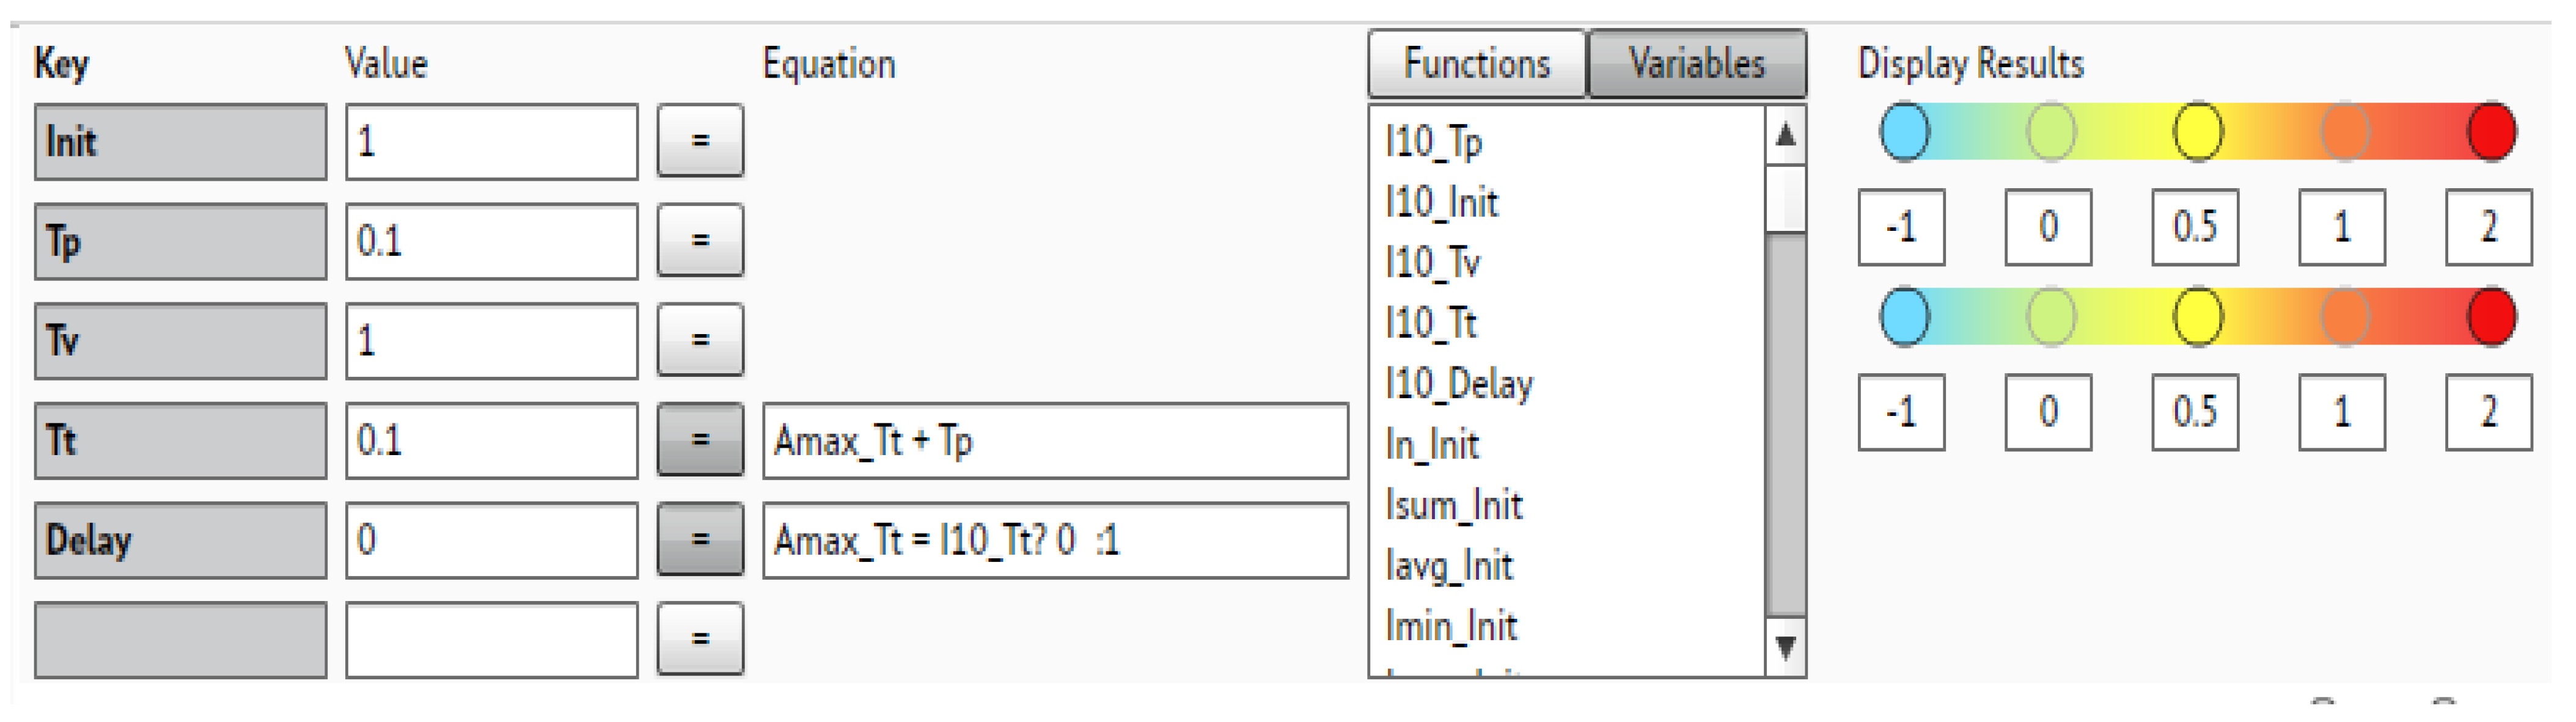
With a validated model, it is now possible to choose and populate the keys and values needed to provide a simulation of the process. The keys are detailed below in Table 2 and shown in Figure 6 below.
Table 2.
Key–value pairs for the ‘work as imagined’ FRAM.
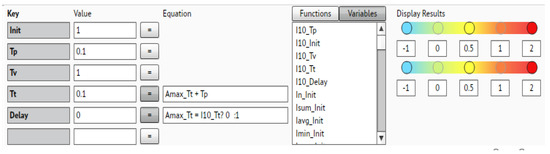
Figure 6.
The metadata keys and values.
3.5. Insights from the Model
The spine of the process is a very smooth, well-rehearsed, coordinated and choreographed, essentially linear series of sequential actions by the four tyre-changing teams, which operates almost autonomously; and only requires a car and fresh tyres to be available.
The additional and critical functions that enable and develop the outcomes of the tyre teams are in the initial car reception phase and the final car release phases of the operation.
Here it is crucial that the car stops exactly in position and that it is promptly and reliably elevated to enable the tyres to be removed. This criticality has been recognised by the provision of two extra mechanics to ensure the car’s stabilization, and two extra jack men to provide resilience for an essential function. Similarly, at the rear of the car, the time taken to lower the car and move the jacks out of the way shows up as a potentially crucial delay to release.
But it is clear that the last two mechanics (the “gap spotter” and the “release” controller) have the most demanding functions (with multiple aspects), which are the final and are probably crucial to determining the overall time taken. Arrivals of other cars are completely outside of the control of the pit crews so that this variable is essentially random and needs to be accepted as a delay. The release process requires knowledge, indications, and signals that all the previous functions have been successfully achieved and that there is a clear gap available before the function can execute. Just in terms of conscious processing, this decision probably takes the most time to execute correctly and safely. The consequences of getting it wrong add to the pressure on the decision maker. Putting a set of notional values into the model yields a value of the time taken of around 2–3 s, which fits observed performances.
3.6. The Work as Done FRAM Model
The Williams video was then examined in detail and the actual timings for completing the various functions were obtained. These are given in Table 3.
Table 3.
F1 pit stop—Indicative timings of key functions needed.
It is noticeable that in the video the overall time taken is less than predicted by our ‘work as imagined’ FRAM sequence of instantiations. So, the video was examined in more detail to try and establish how exactly the teams carried out their different functions. What adaptations were made to be able to complete the tasks more quickly?
The first thing that becomes apparent when the videos [19] are examined closely is that although the officially timed start of the process is from when the car has stopped at its marks, the pit crews anticipate the stop, and the air guns are engaging, the wheel nuts and the jacks are moving into position before the car stops.
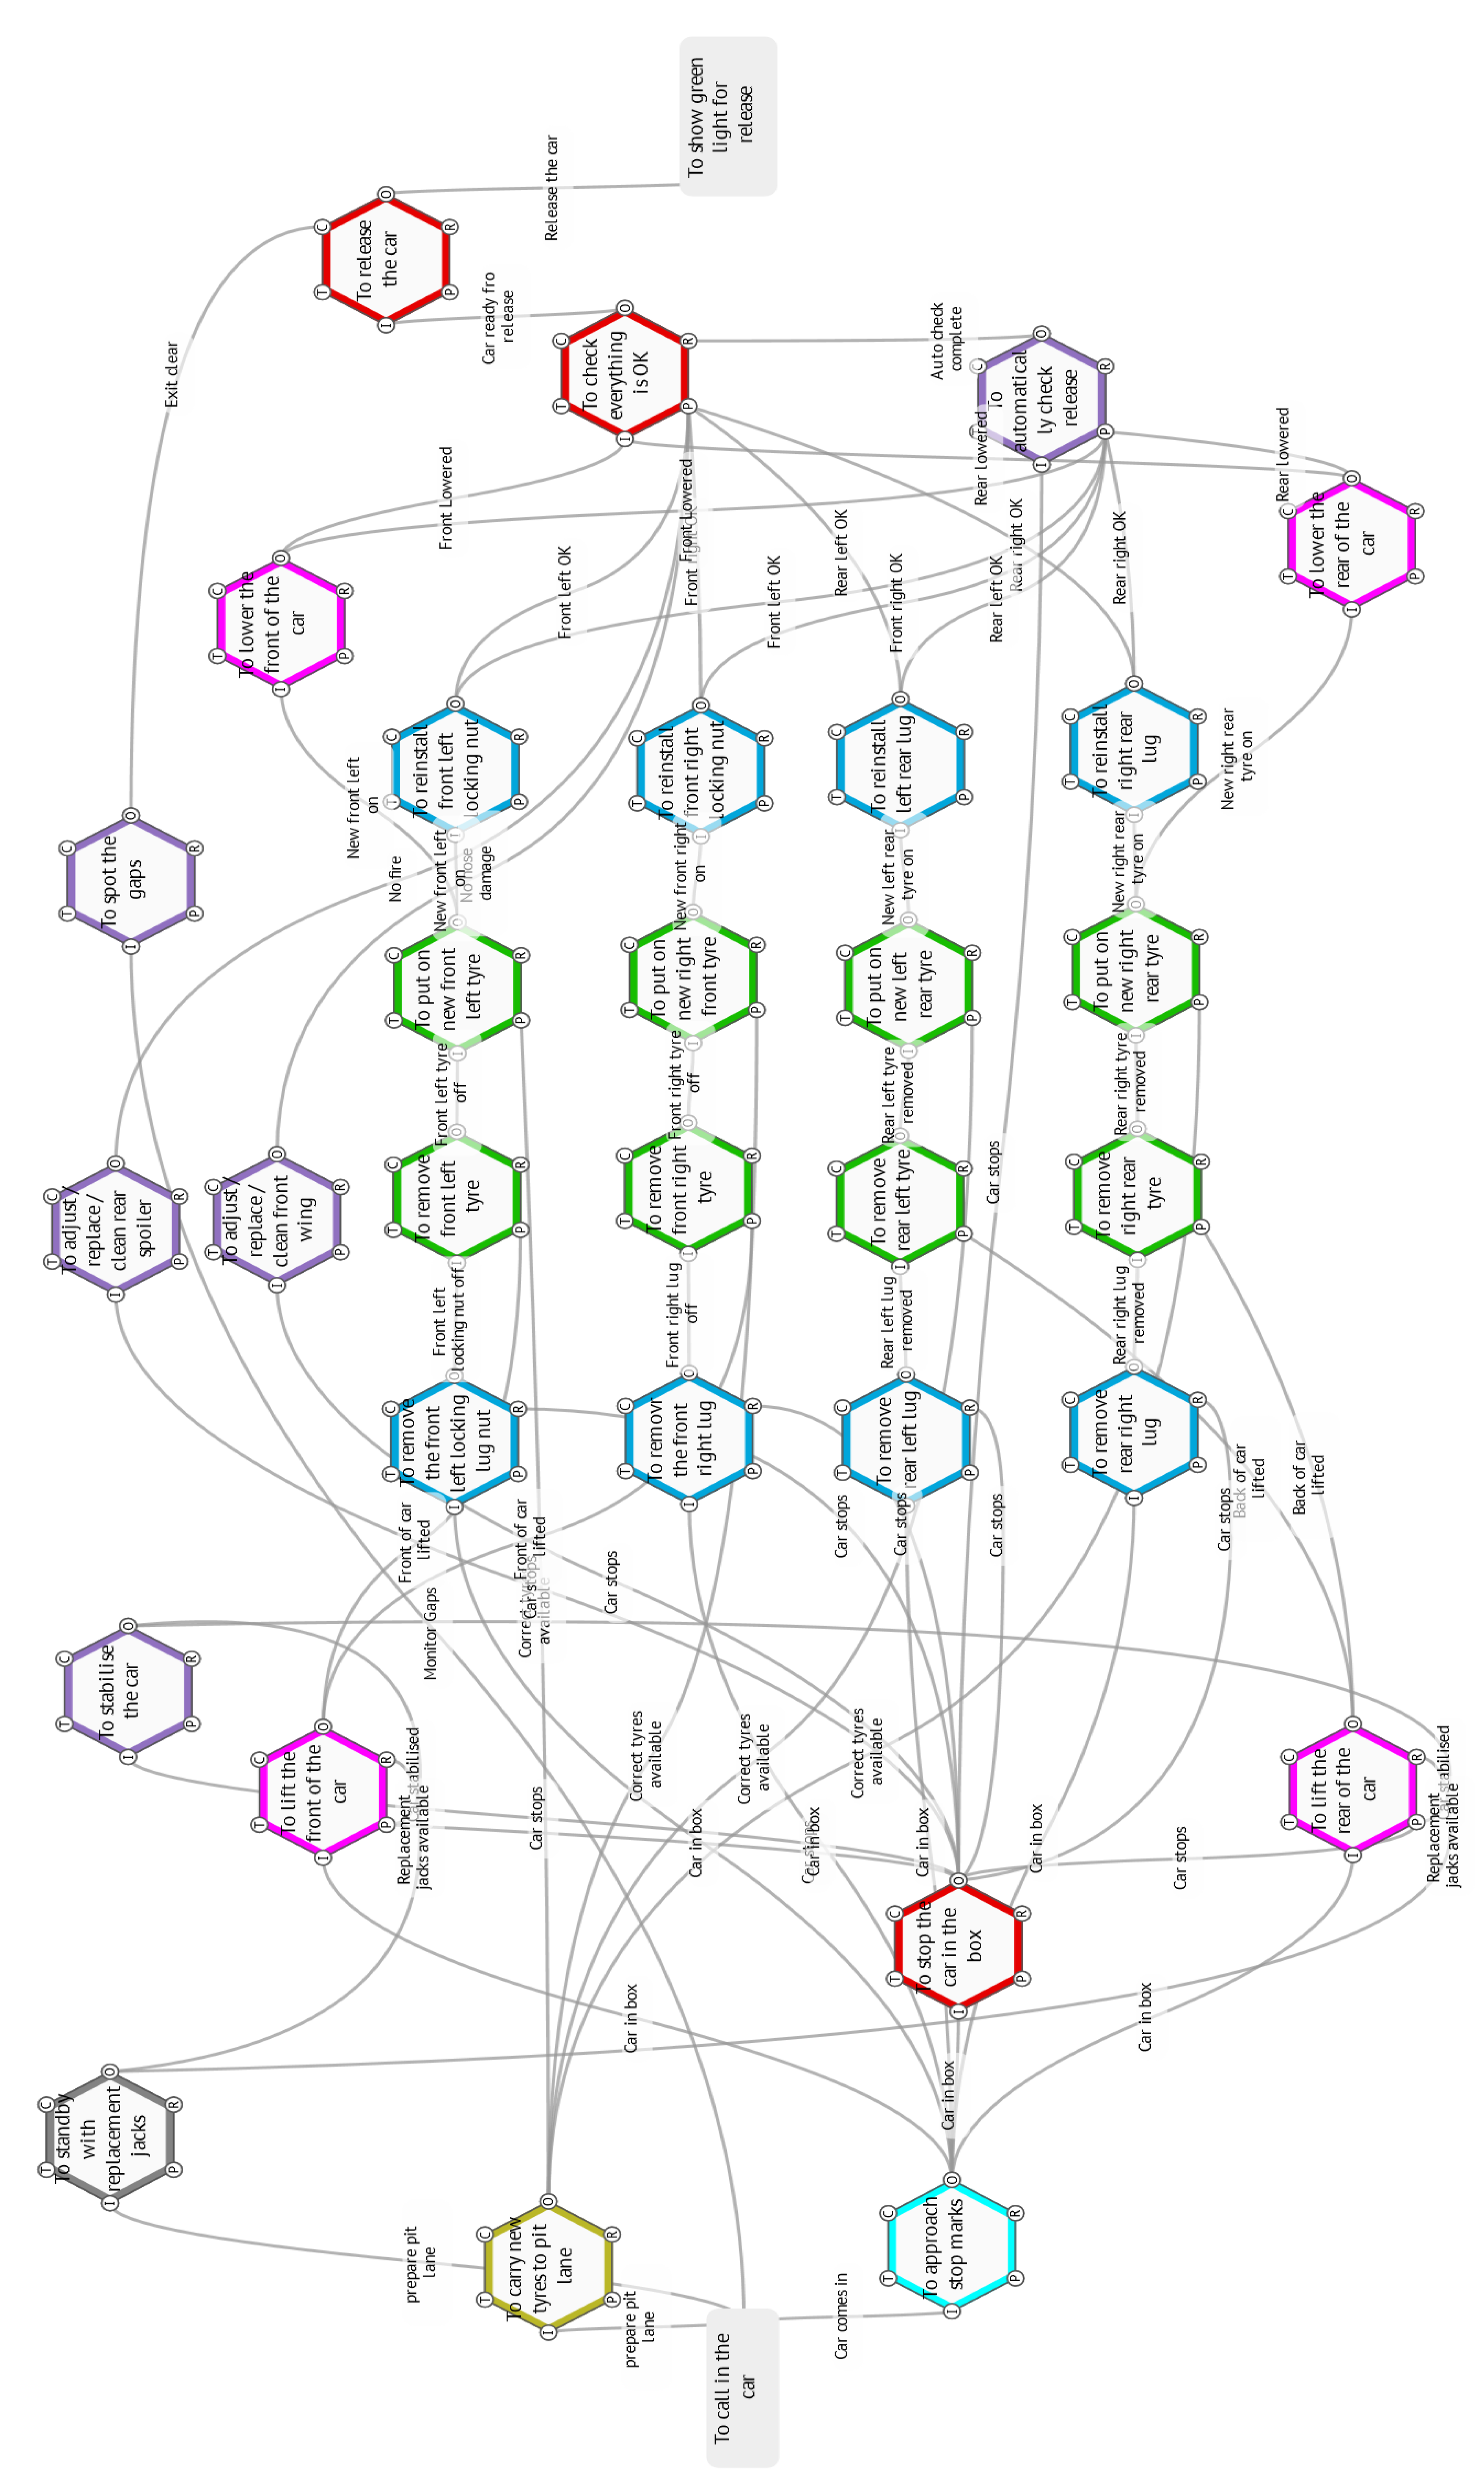
This means that none of these functions are rate-determining in adding to the time but are effectively reducing the time by anticipating the start. In the WAD instantiation, below (Figure 7) we have thus added an additional function for the car to enter the box and be active before the “official” start time. Similarly, at the rear of the car, the jacks are removed as soon as the tyres are on and the release seems to happen simultaneously with the wheel-nut-tightening completion, another corner-cutting adaptation reflected in the changing the aspect links.
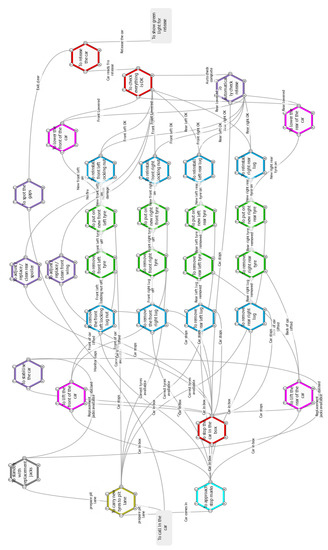
Figure 7.
The ‘work as done’ FRAM model.
There does not seem to be a noticeable delay in the release of the car, after the nut is tightened, which means again, that the release function is anticipating the clearance checks. Again, this has a significant effect in further reducing the overall time taken. In Table 4 below, the results of running the two FRAM models as imagined and as done, and rough timings taken from the Williams pit stop video are set out.
Table 4.
Comparison of predicted and actual timings for the pit stop.
When the Williams pit stop video is analysed more rigorously, we observe the third column timings. This is remarkably close to the WAD 231 timings, which further supports our interpretation of the actual work as done. As it is a very competitive environment and seconds saved in pit stops can mean gaining or losing advantage, there is continuing pressure to find ways of further reducing these times.
One such initiative is rumoured to be the progressive automation of some of these critical functions like the release function, either for more speed, but more likely to be for more reliability/safety.
3.7. Safety Concerns
This is now a classic case of Rasmussen drift, where the operational safety boundaries are gradually tested and extended, to gain competitive and efficiency advantages. Unfortunately, as these boundaries can never be precisely predicted in real environments, this often results in unfortunate but totally foreseeable (in hindsight) unsafe excursions, accidents, and casualties.
In Formula 1, Ferrari were fined 50,000 euros by race officials for an unsafe release at the Bahrain Grand Prix in 2018, which resulted in an injury to the front jack man who was not able to get out of the way in time. From the FRAM model, this was the result of pressuring the release mechanic to cut his decision time to such an extent that it was a reflex, rather than a conscious confirmation of a safe state for release.
4. Discussion
This paper has set out to examine the feasibility and validity of extending the functional resonance analysis method for complex sociotechnical systems, by adding features to make it suitable for use in operational research.
It has shown that, in principle, the interaction of the functions can be quantified using a combination of formal validation of the models by the application of production rules to formalise the model as a series of emergent activations of the functions and the capability to assign and update systemwide metadata for each function.
The study then set out to demonstrate this by examining a well-characterised and familiar complex sociotechnical system with sufficient publicly available process data to model—a Formula 1 pit stop.
Although the study was carried out only to a level of detail necessary to show the potential of the approach, it nevertheless provides some very interesting and relevant insights into the process.
The analysis predicted ‘as imagined’ times of 2–3 s, whereas the ‘as done’ version could achieve a substantially better time of around 2 s.
Actual recorded times are all around this 2 s standard, with the record currently standing at 1.88 s.
This seems to be very hard to achieve by rigidly implementing the process as laid down by regulations (as imagined!). This is reflected in recent moves by the regulators to tighten up the rules.
After the injury incident at the Ferrari pit stop in which a Ferrari mechanic suffered a broken leg when Kimi Raikkonen was released too early from a pit stop in Bahrain in 2018, the FIA issued a technical directive that has just come into force for the Hungarian Grand Prix on 1 August:
“It mandates a minimum 0.15 s delay between the wheel nuts being confirmed as tight and the mechanic operating the jack dropping the car, and 0.2 s from the jack going down to the driver receiving the signal to leave the pits.”
There is already a backup system of sensors and signals to indicate completion or otherwise of the critical functions (nut tightening, car raising and lowering). The outputs from these could be, (and may already be), fed to an additional auto-check function whose effect would be the same as the gap spotter, to control the release function. Presumably the extra delays could be introduced automatically.
This would then force the release process to be more like the work as imagined (presumably by the FIA). That is, the jack must wait for the nut-tightening—a mandatory delay of 0.15 s and then the release man must impose a further 0.2 s before he can consider releasing (if the gap is there).
How is that arrived at, going to work, be monitored, or enforced?
The paper suggests that a FRAM model could help.
5. Conclusions
The community of practice involved in coordinating the application of the FRAM approach and supporting the now-wide range of projects [20] has been developing new facilities in response to user demands. One of these new developments has been to provide the ability to add, store, and manipulate metadata sets for each function and an ability to calculate and propagate this metadata as an emergent output of the function sets. This current work has set out to test the validity of applying this facility in healthcare applications. It is specifically interested in proving, or otherwise, its applicability in quantifying the effects of actual behavioral variations and adaptations observed in real world situations.
To test its applicability, the study looked for an example of a professional team operating under high-speed, high-stress conditions, outside of the healthcare settings, to ensure an unbiased assessment of its usefulness. The complex sociotechnical system chosen was that of a team changing tyres in a Formula 1 pit stop.
The results were encouraging in the way the facility produced credible results, which allowed the prediction and comparison of observed versus intended performance times and insights into what was actually happening during the process.
Limitations—It must be pointed out that this study was only intended as a test case to demonstrate possibilities. Applying it to real and arguably more intensive and demanding healthcare and emergency response situations, will require more care in the choice of data and processing algorithms to produce and justify realistic recommendations that could have real consequences.
Nevertheless, the paper has demonstrated the feasibility and benefits of extending quantitatively, the analytical capability of the FRAM approach in this way. We believe this justifies its use as a new and valid weapon in the OR armoury. We believe it is now sufficiently validated to proceed to apply it to the ED study that WESPA is undertaking in Cardiff.
Author Contributions
Conceptualisation, D.S. and R.H.; methodology, D.S.; software, R.H.; validation, M.K. and B.A.; formal analysis, D.S.; writing—original draft preparation, D.S.; writing—review and editing, B.A.; visualisation, R.H. All authors have read and agreed to the published version of the manuscript.
Funding
This research received no external funding.
Institutional Review Board Statement
Not applicable.
Informed Consent Statement
Not applicable.
Data Availability Statement
There are many videos available on Youtube, a typical source that is referenced and used in this study is given below [4].
Conflicts of Interest
The authors declare no conflict of interest.
References
- Monks, T. Operational Research as Implementation Science: Definitions, Challenges and Research Priorites. Implement. Sci. 2016, 11, 81. [Google Scholar] [CrossRef] [PubMed] [Green Version]
- Scherkenbach, W. The Deming Route to Quality and Productivity: Road Maps and Roadblocks; Cee Press: Washington, DC, USA, 1986. [Google Scholar]
- McCarthy, R. Lean Six Sigma: A Practical Guide for Getting Started with Lean Six Sigma along with How It Can Be Integrated with Agile and Scrum; Primasta: Asten, The Netherlands, 2020. [Google Scholar]
- Bicheno, J. Towards Reducing Queues: Muri, Mura, Muda. In Proceedings of the European Lean Educator Conference, Braga, Portugal, 13–16 November 2018. [Google Scholar]
- Hollnagel, E. The Functional Resonance Analysis Method: Modelling Complex Socio-Technical Systems; CRC Press: Boca Raton, FL, USA, 2012. [Google Scholar]
- Mackinnon, R.S. Adaptations to practice and resilience in a paediatric major trauma centre during a mass casualty incident. BJA Br. J. Anaesth. 2021. [Google Scholar] [CrossRef]
- Slater, D. A Systems Analysis of the UK COVID 19 Pandemic Response: Part 2-Work as imagined vs. Work as done. Saf. Sci. 2022, 146, 105526. [Google Scholar] [CrossRef] [PubMed]
- Slater, D.H.-S. A Systems Analysis of the COVID-19 Pandemic Response in the United Kingdom–Part 1-The overall Context. Saf. Sci. 2022, 146, 105525. [Google Scholar] [CrossRef] [PubMed]
- Patriarca, R.E. Framing the FRAM: A literature review on the functional resonance analysis method. Saf. Sci. 2020, 129, 104827. [Google Scholar] [CrossRef]
- Salehi, V.V. Modeling complex socio-technical systems using the FRAM: A literature review. Hum. Factors Ergon. Manuf. Serv. Ind. 2021, 31, 118–142.11. [Google Scholar] [CrossRef]
- Anderson, N.C. Applying the Functional Resonance Analysis Method (FRAM) to Minimize Hospital-acquired COVID-19 Infection in the Emergency Department. Submitt. Ann. Emerg. Med. 2021. Available online: https://www.leansixsigmapartners.nl/welke-training-voor-u?utm_source=adwords&utm_term=%2Bsix%20%2Bsigma%20%2Blean&utm_campaign=&utm_medium=ppc&hsa_mt=b&hsa_ad=210371081472&hsa_net=adwords&hsa_src=g&hsa_kw=%2Bsix%20%2Bsigma%20%2Blean&hsa_tgt=kwd-305602673958&hsa_cam=821596943&hsa_acc=8661523581&hsa_ver=3&hsa_grp=42623316656&gclid=EAIaIQobChMIiLHlitni9AIVDayWCh1bZAJUEAAYASAAEgJTvvD_BwE (accessed on 1 December 2021).
- Hill, R.H. The FRAM Model Visualiser-the Pro Version. 2021. Available online: https://www.researchgate.net/publication/353086492_The_FRAM_Model_Visualiser_-The_Pro_Version:Researchgate (accessed on 1 December 2021).
- Hollnagel, E. The FRAM Model Interpreter. 2020. Available online: www.safetysynthesis.com (accessed on 1 December 2021).
- Patriarca, R. myFRAM: An Open Tool Support for the Functional Resonance Analysis Method. In Proceedings of the 2nd International Conference on System Reliability and Safety (ICSRS), Milan, Italy, 20–22 December 2017. [Google Scholar]
- Hirose, T. Treating Variability Formally in Fram. 2020. Available online: www.https://researchgate.net/publication/342639227_TREATING_VARIABILITY_FORMALLY_IN_FRAM:Researchgate (accessed on 1 December 2021).
- Salehi, V.S. A dynamic version of the FRAM for capturing variability in complex operations. MethodsX 2021, 8, 101333. [Google Scholar] [CrossRef] [PubMed]
- Coats, T.J. Mathematical Modelling of Patient Flow through an Accident and Emergency Department. BMJ 2001, 18, 190–192. [Google Scholar] [CrossRef] [PubMed] [Green Version]
- Pound, E.J. Factory Physics for Managers; McGraw Hill: New York, NY, USA, 2014. [Google Scholar]
- Driver 61. F1 Pit Stop in 2-Seconds: An In-Depth Analysis. 2021. Available online: https://www.youtube.com/watch?app=desktop&v=tFwcq5lf0wU (accessed on 1 December 2021).
- FRAMily, T. New Sandbox Research Facility. 2021. Available online: www.functionalresonance.com (accessed on 1 December 2021).

Publisher’s Note: MDPI stays neutral with regard to jurisdictional claims in published maps and institutional affiliations. |
© 2021 by the authors. Licensee MDPI, Basel, Switzerland. This article is an open access article distributed under the terms and conditions of the Creative Commons Attribution (CC BY) license (https://creativecommons.org/licenses/by/4.0/).