Article

Features of Acoustic Emission in Tensile Testing of Dissimilar Welded Joints of Pearlitic and Austenitic Steels

1
Moscow Power Engineering Institute, 14, Krasnokazarmennaya Str., 111250 Moscow, Russia
2
LLC “Interunis-IT”, 20b, Entuziastov sh., 111024 Moscow, Russia
*
Author to whom correspondence should be addressed.
Appl. Sci. 2021, 11(24), 11892; https://doi.org/10.3390/app112411892
Submission received: 11 November 2021 / Revised: 1 December 2021 / Accepted: 6 December 2021 / Published: 14 December 2021

Abstract

:
This paper presents a study of acoustic emission (AE) during the deformation of dissimilar welded joints of austenitic steel to pearlitic steel. One of the specific problems in these welded joints is the presence of decarburized and carbide diffusion interlayers, which intensively increase in width during long-term high-temperature operation. The presence of wide interlayers negatively affects the mechanical properties of welded joints. Moreover, welded defects are difficult to diagnose in welded joints containing interlayers: due to the high structural heterogeneity, interlayers create structural noises that can hinder the detection of defects such as cracks, pores, or a lack of penetration. The AE method may become a complex decision for diagnosing dissimilar welded joints due to applicability to the testing of heterogenic materials with a complex microstructure. Specimens cut from dissimilar welded joints of austenitic steel to pearlitic steel were tested by tension to rupture, with parallel AE data registration. According to the research results, the characteristic features of the AE were revealed for specimens containing defects in the form of lack of penetration as well as for specimens with diffusion interlayers. The results obtained show that the AE method can be used to test both typical welding defects and diffusion interlayers in welded joints of steels of different structural classes.

1. Introduction

Dissimilar welded joints of austenitic to pearlitic steel are widely used in the manufacturing of elements for power equipment and pipelines at thermal power plants and nuclear power plants, in steam and gas turbines, and in pipelines at chemical and petrochemical plants. The use of such structures allows one to reduce significantly the cost of products, reduce their weight and sizes, and increase the reliability and durability of critical equipment.
The production of dissimilar welded joints by fusion welding has a specific feature—when two or more materials are mixed in a liquid state in the weld pool, it leads inevitably to the presence of zones with highly gradient chemical composition in the welded joint. These zones are usually located near the fusion lines, and their width is determined by the welding method, as well as by the complex of physical processes at the interface between the solid and liquid phases [1].
In particular, in welded joints of dissimilar steels on different sides of the fusion line, decarburized interlayers and interlayers with increased carbide content may be observed [2,3]. Decarburized and carbide interlayers are typical for dissimilar welded joints of low-alloy pearlitic steels to chromium-nickel austenitic steels [4,5,6]. For such welded joints having an austenitic structure in the weld seam, interlayers are formed on the fusion line of the pearlitic steel and the weld seam (a decarburized interlayer on the pearlitic steel side and a carbide interlayer on the weld side (see the scheme in Figure 1)).
If such dissimilar welded joints are operated for a long time at high temperatures, the diffusion processes will proceed intensively, and as a result the interlayers will increase in size. The presence of such interlayers negatively affects the mechanical properties of the welded joint [7]. The decarburized interlayer, the size of which can reach several millimeters, has a ferritic structure and has lower strength characteristics, namely ultimate strength and yield strength. The presence of a hard but brittle carbide layer increases the risk of sudden fracture of the welded joint.
This problem is especially relevant for dissimilar welded joints of power equipment at nuclear power plants. A large number of sudden destruction of combined steel joints during operation has led to the fact that in the regulatory document for the metal of power equipment (PNAE G-7-009-89L Instructions and standards in nuclear power engineering. Equipment and pipelines of atomic power systems. Welding and hardfacing. Main instructions), restrictions on the operation temperature and time for such joints were prescribed to prevent the growth of diffusion interlayers.
The suddenness of such welded joints destructions caused by the difficulty of diffusion interlayers detection. To identify interlayers in dissimilar welded joints, non-destructive testing methods can be effective, which allow to investigate the weld joint structure throughout the entire thickness of the product; these are radiographic and ultrasonic testing methods. However, radiographic testing is sensitive to the defect orientation and does not provide the required sensitivity to identify the interlayer [8].
The most widespread method of non-destructive testing of dissimilar welded joints is ultrasonic testing. In a number of papers the effective use of ultrasonic testing of dissimilar welded joints in power engineering equipment is shown [9,10,11], but it is noted that inspection of dissimilar welded joints, as a rule, is carried out due to the complication of the inspection procedure and the development of specialized methods that take into account the design features of each welded joint [12,13,14]. Moreover, when using nondestructive testing methods, diffusion interlayers create structural noises that interfere detection of defects such as cracks, pores, or lack of penetration, which makes dissimilar welded joints a difficult object for diagnostics.
This article discusses the possibility of using the acoustic emission (AE) method for diagnostics of dissimilar welded joints. For heterogeneous objects with a complex structure, the AE method is more promising in comparison with traditional methods of non-destructive testing. Since the AE method does not imply a probing effect on the test object, the heterogeneity of the structure of a complex object does not interfere with defects detection [15,16].
Due to its sensitivity to microstructure parameters, the AE method of application makes it possible to detect violations of the structural composition in the material [17,18,19]. In a number of experimental research studies [20,21,22,23,24,25], it was found that the AE method can be effectively applied to detect defects in welded joints, as well as to identify and locate them.
The use of the AE method for diagnostics of dissimilar welded joints is insufficiently studied nowadays. Few studies are devoted to the application of AE directly in the process of welding dissimilar welded joints [26,27,28]. However, little experience has been successful. In [29], the authors monitored the development of a crack in a dissimilar welded joint between low-alloy pearlitic to austenitic steels. The study was carried out under laboratory conditions for a pre-hydrogenated sample. The AE method showed high sensitivity since it was possible to detect a crack with an opening of no more than 50 μm.
The dissimilar welded joints of austenitic steel 12Kh18N10T to pearlitic steel 09G2S are the subject of research in this paper. The defect-free specimens of dissimilar welded joints as well as specimens with defects and specimens with diffusion interlayers were tested using the AE method. The AE signature specific for different states of dissimilar welded joints were obtained in this study.

2. Materials and Methods

Dissimilar welded joints of 09G2S (low-alloyed pearlitic steel) to 12Kh18N10T (chrome-nickel austenitic steel), obtained using argon-arc welding with a filler wire, have been investigated. Chemical compositions of steels are presented in Table 1.
To obtain the joints, pairs of plates with dimensions of 250 mm × 300 mm × 3 mm each were welded to each other. A total of three pairs of plates were welded. Argon-arc welding was carried out using a Sabaros SW146 filler wire with a diameter of 1.2 mm. The chemical composition of the wire is shown in Table 1 [30,31].
Welding of the plates pair No.1 was carried out in compliance with the correct arc welding technology at the recommended welding parameters. As a result, a defect-free welded joint with full penetration was obtained (Figure 2a). The weld metal structure was austenitic. The plates pair No.2 was welded deliberately at low welding current to obtain defects of the “lack of penetration” type in the welded joint. A welded joint with lack of penetration is shown in Figure 2b.
Welding of the plates pair No.3 was carried out in the same way as for the plates pair No.1, in compliance with the correct technology of arc welding on the recommended parameters of the welding mode. After welding, the joint was subjected to subsequent heat treatment in Nabertherm P180 furnace according to the mode (heating to 650 °C + holding for 5 h + cooling in calm air). This heat treatment simulates the long-term operation of these welded joints at high temperatures.
Due to carbide-forming elements (chromium and manganese) in the SW146 wire, diffusion interlayers were formed during additional high-temperature heat treatment. Intense diffusion processes took place on the fusion line “weld seam—09G2S steel”. The structure of the heat-treated welded joint (plates pair No.3) is shown in Figure 2c.
Due to diffusion of carbon from 09G2S steel into the weld seam, a decarburized ferritic layer is formed in the 09G2S steel near the fusion line. The thickness of this interlayer was 500–700 µm (Figure 2d). In addition, in the weld seam near the fusion line, a carbide interlayer was formed due to the interaction of carbon diffused into the weld with carbide-forming elements in the weld metal. The thickness of the carbide interlayer is 10–70 µm, and 30 µm on average (see Figure 2d).
Thus, three types of welded joints were prepared for research: a defect-free joint (plates pair No.1), a joint with lack of penetration (plates pair No.2), and a joint with diffusion interlayers (plates pair No.3).
From the obtained welded joints, specimens for static tension test were prepared. Tensile tests were carried out on an Instron 5982 testing machine with a strain rate of 2 mm/min. Tensile tests were also carried out on flat specimens made of parent metals—09G2S steel and 12Kh18N10T steel (specimens without welded joints).
AE signals were recorded during the tests using the A-Line 32D industrial system. The measuring path consisted of resonant sensors GT200 (Global test LLC, Sarov, Russia) which have resonance frequency 180 kHz and preliminary amplifiers of the electrical signal PAEF-014. The study of the waveform and spectra of the AE signals was carried out using broadband sensors SE 1000 (Acoustic Technology Group, Score Atlanta Inc., Chicago, IL, USA). The amplitude discrimination threshold was set to 40 dB when using GT200 sensors and 32 dB when using SE 1000 sensors. A digital filter with a bandwidth of 100–400 kHz was used to suppress the noise of the testing machine during data collection.
To study the staging of the deformation process of each zone of the sample during tensile testing, the method of digital image correlation (DIC) was used. One sample from each group of samples was tested using DIC. Before the test, a random pattern on one of the samples’ flat surface in the area of weld joint by white and black spray paint was applied. A sample was installed in testing machine, illuminated by 150 W white-light halogen light source LS (Dedolight DLH4-300) and observed by the machine vision system (LaVision StrainMaster, LaVision Inc., Ypsilanti, MI, USA). This system consists of two identical monochrome CCD cameras CAM1 and CAM2 (Basler piA2400-17gm) with resolution of 2456 × 2058 pixels 2/3” image sensors size, synchronization unit LaVision PTU for simultaneous image acquisition, and a personal computer with DaVis 8.4 software (LaVision Inc., Ypsilanti, MI, USA) for data acquisition, storage and processing. Both cameras are equipped with zoom lenses (Canon EF-S 12–200 mm f/3.5–5.6 IS). Each experiment included 10-min acquisition of 2300 × 1300 pixels, 12-bit images of about 100 mm × 20 mm sample’s area at 1 fps and joint processing of these images using DIC. A displacement distribution was registered during the test and then the measured displacement distribution was used to calculate to maps of strain.

3. Results and Discussion

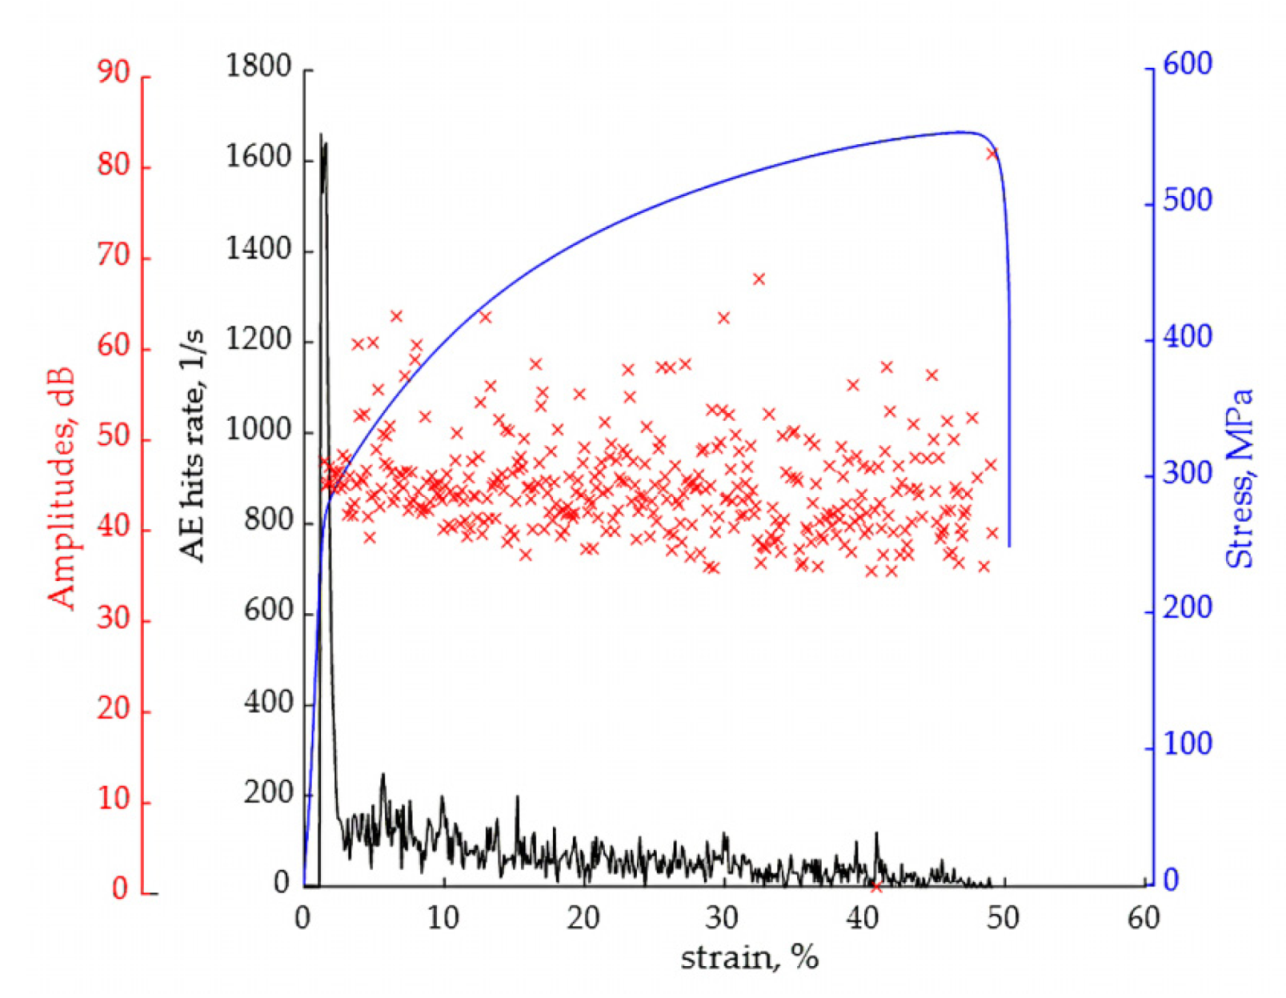
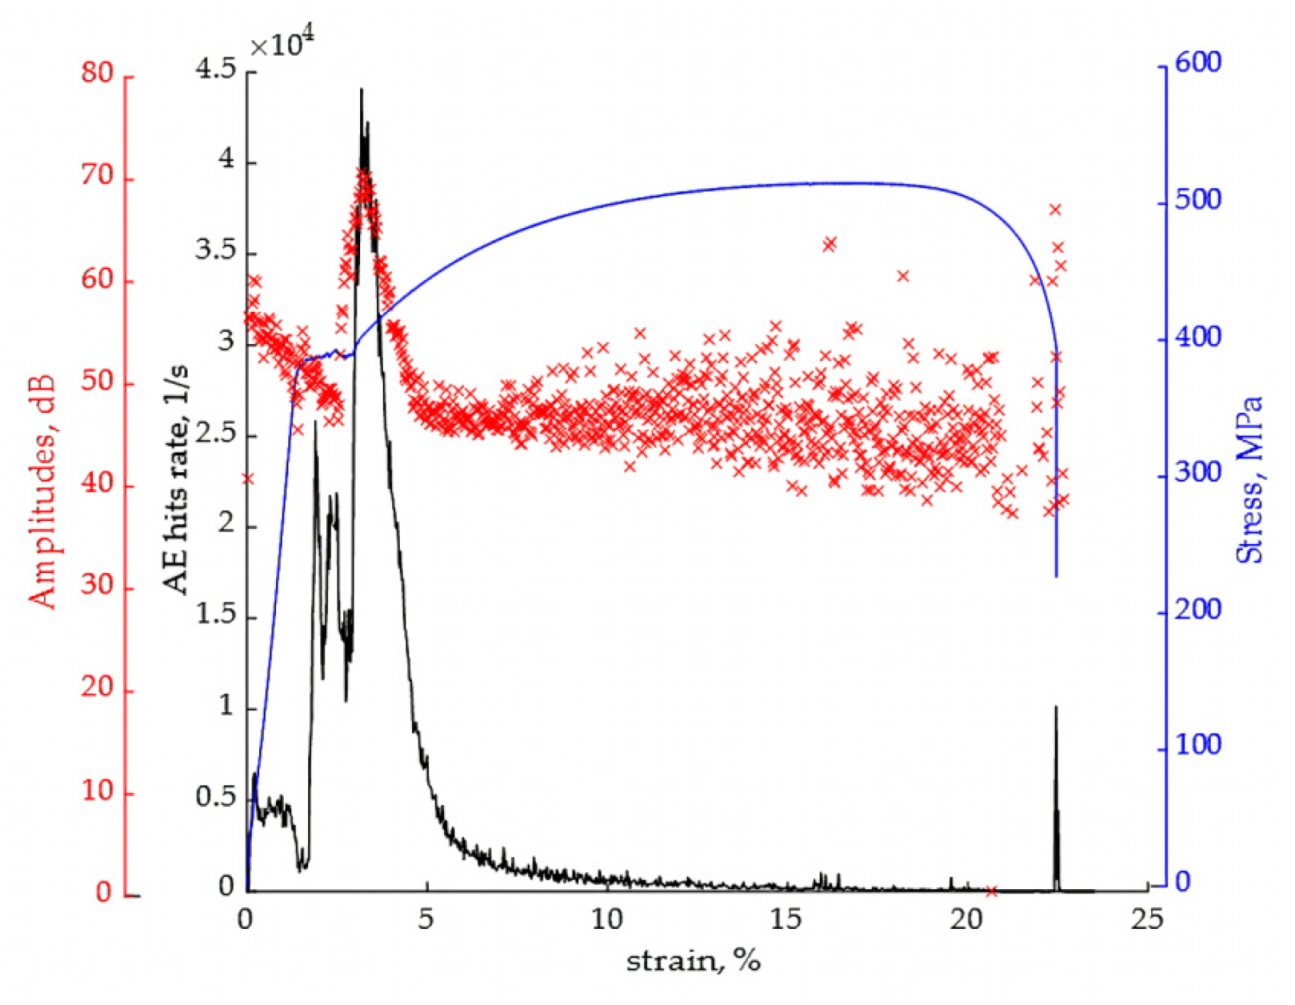
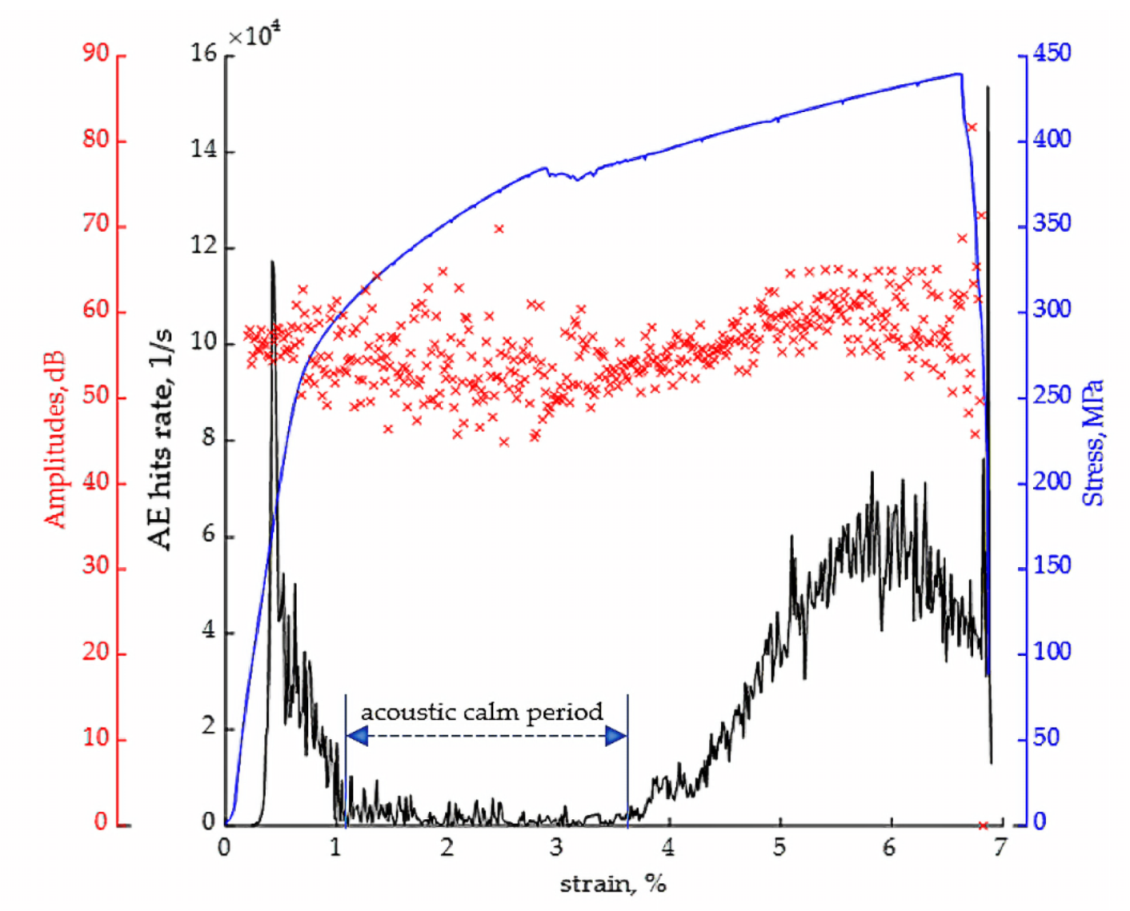
3.1. AE under Tension of the Specimens from 09G2S Steel and Specimens from 12Kh18N10T Steel

For a better understanding of AE generation regularities during the deformation of dissimilar welded joints, at the initial stage of research, specimens of the parent metals (09G2S and 12Kh18N10T steels) were tested by tension. Figure 3 shows the AE data such as AE hits rate and the amplitudes of AE hits, recorded under static tension of 12Kh18N10T austenitic steel specimens. The nature of AE data recorded during loading of the 12Kh18N10T steel specimens is consistent with the tension diagram. An increase in activity begins near the stage of elastic deformation, at a stress of about 0.5 σ y , where σ y is a yield point. The maximum AE hits rate is observed at the moment of reaching the yield point of the material, and in the stage of strain hardening, the AE hits rate decreases monotonically. The amplitudes of the AE hits change stochastically and, as a rule, do not exceed 60 dB.
The AE data recorded during the tension of specimens made of 09G2S pearlitic steel are more complex, presumably explained by a more complex deformation mechanism associated with the presence of a yield plateau (Figure 4). At the beginning of loading with elastic deformation of the sample, an insignificant AE hits rate is observed, which is probably associated with relaxation of residual stresses. Then, the AE hits rate increases stepwise in two stages: the first burst of AE hits rate corresponds to the beginning of the yield area of 09G2S steel; the second, a more pronounced one, is observed in the yield strength region. Each of the deformation stages corresponds to the particular values of AE hits amplitudes: in the section of elastic deformation, the AE hits amplitudes do not exceed 60 dB; within the yield plateau, the characteristic values of the amplitudes increase to 65 dB, the maximum amplitudes of the AE hits (over 70 dB) are observed in the region of the yield strength of 09G2S steel.

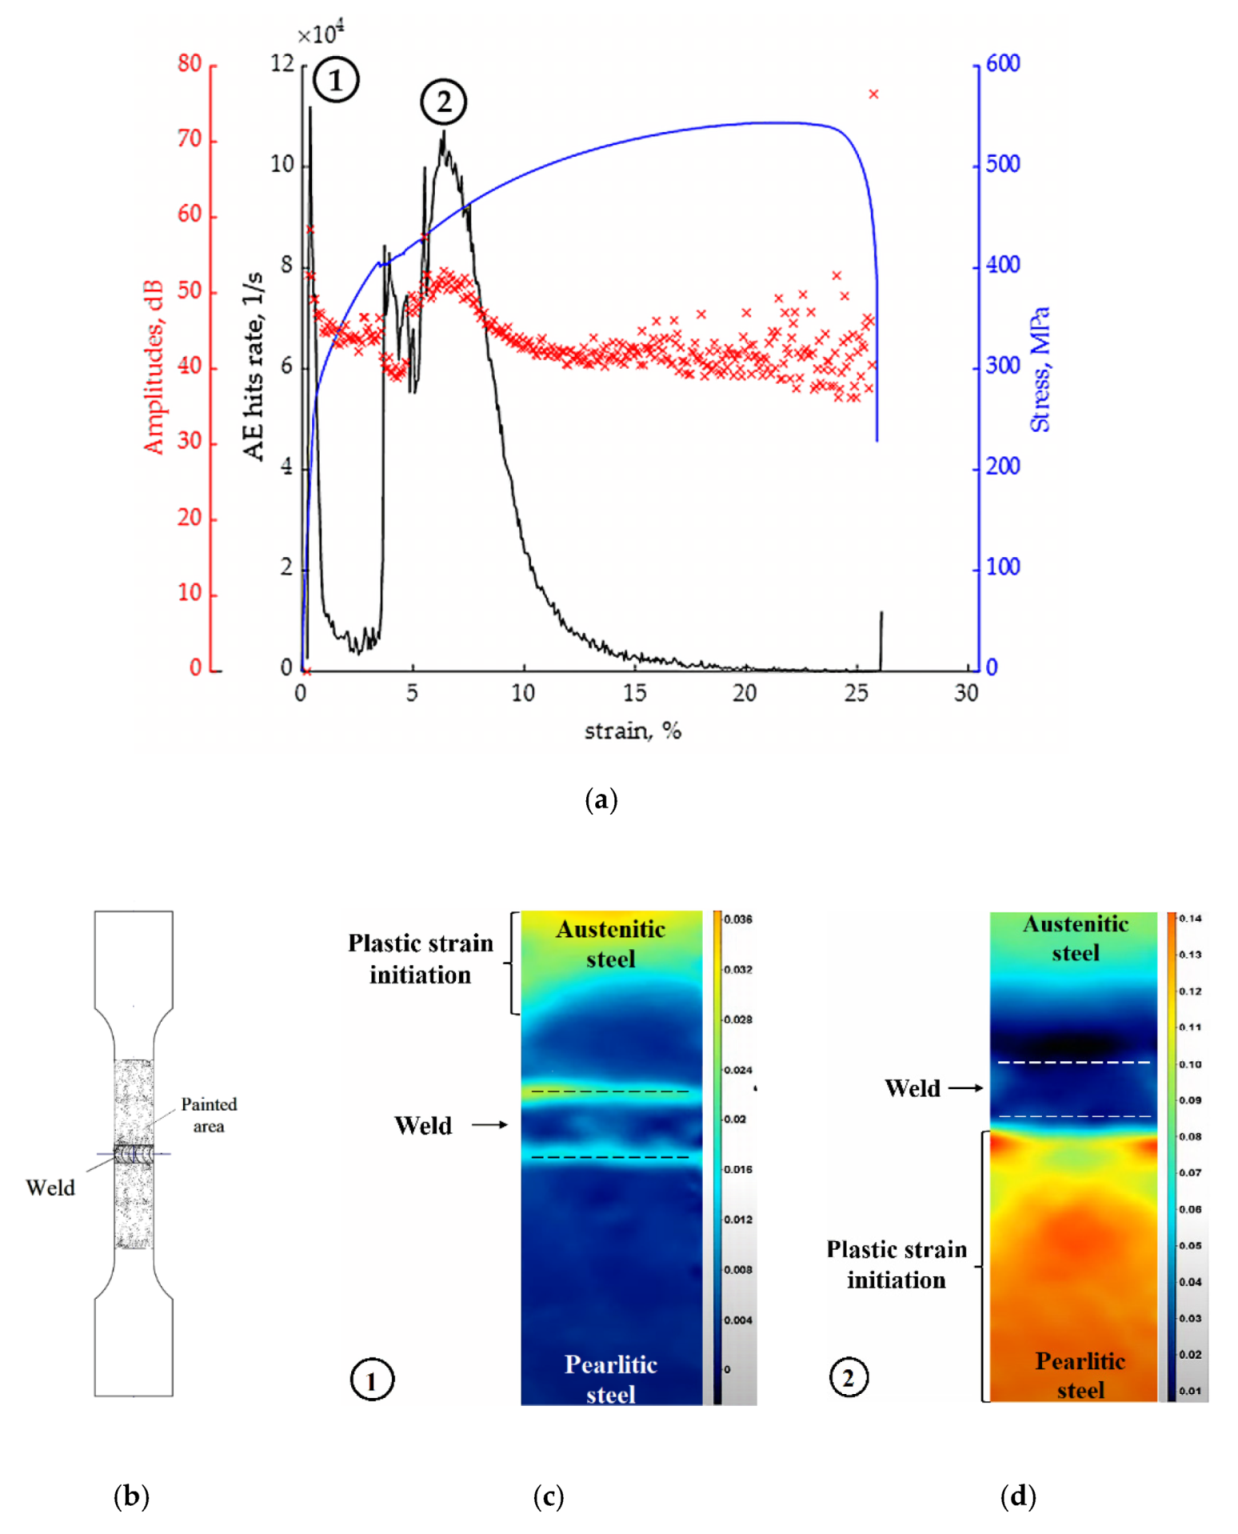
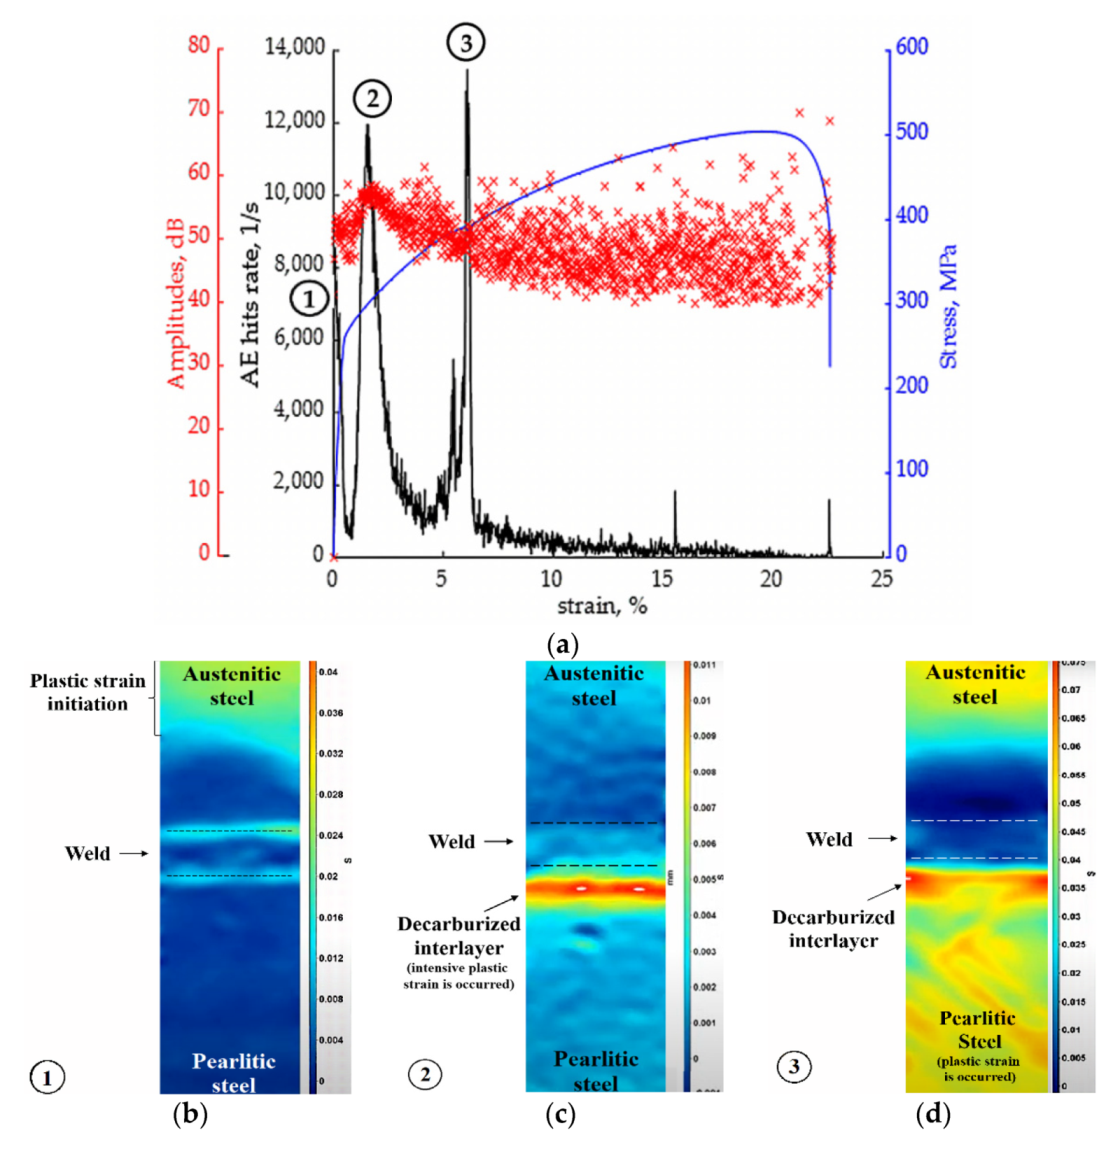
3.2. Investigation of AE under Tension of Specimens with Dissimilar Welded Joints

Figure 5 shows the data obtained under static tension of a defect-free specimen with a dissimilar welded joint. The dependence AE hits rate versus strain (Figure 5a) has two pronounced maxima corresponding to the stress of about 200 MPa and about 400 MPa. The results of the study of strains distribution on the specimen surface by the DIC method make it possible to clarify the presence of AE data peak at certain stages of the test. Figure 5b shows a diagram of a specimen with an indication of the study area with applied paint. The presence of the first AE peak (item 1 in Figure 5a) at stresses of about 200 MPa corresponds to the onset of plastic deformation of austenitic steel and (Figure 5c). With a further increase in stress to a level of about 400 MPa, the yield point of pearlitic steel is reached, as a result of which its plastic deformation occurs (Figure 5d), and a second peak is observed on the AE data pattern (item 2 in Figure 5a). After it, plastic deformation occurs in all zones of the welded joint, and this process is accompanied by a decrease in AE hits rate.
In the interval when the yield point of 12Kh18N10T austenitic steel has already been passed, and the yield point of 09G2S pearlitic steel has not yet been reached, an acoustic calm is observed, the AE hits rate significantly decreases. The period of acoustic calm is indicated in Figure 6.
Specimens of combined welded joints with lack of penetration were tested by tension with the reinforcement bead removed. The destruction of the specimens occurred along the welded joint at a stress of 400–500 MPa. Figure 6 shows typical AE data obtained under testing of a specimen with a lack of penetration. The AE data observed during the destruction of samples with defects are generally similar to the data obtained for defect-free samples. According to the AE hits rate, two local maxima are observed, the first of which corresponds to the initiation of plastic deformation of 12Kh18N10T steel, and the second corresponds to the destruction of a defective welded joint.
To identify early predictors of fracture, the AE data were compared for defect-free and defective specimens during the period of acoustic calm before the final AE hits rate increased. The distribution function of time intervals between the adjacent hits reliably for defect-free specimen corresponds to the exponential distribution according to Pearson’s goodness-of-fit criterion with χ2(12) = 9.2, p = 0.06 (Figure 7a). The character of the distribution of time intervals between adjacent AE hits, for a defective specimen, turned out to be different from exponential (χ2(14) = 52.6 p < 0.001), due to an increase in the number of AE hits with a minimal time interval, which insignificantly affects the level of AE hits rate, but leads to disproportionality of the columns in the frequency histogram (Figure 7b).
The AE data, which are recorded when testing specimens of dissimilar welded joints with diffusion interlayers (Figure 8), have some peculiarities compared to the data described earlier.
As in the case of a defect-free specimen, the presence of two AE maxima (items 1 and 3 in Figure 8a) is associated with the onset of plastic deformation of the materials being welded, which is confirmed by the stress distribution shown in Figure 8b,d. Structural features associated with the presence of interlayers are manifested by the appearance of additional maximum of AE hits rate not associated with plastic deformation of the parent metals (item 2 in Figure 8a). The stress value, at which the appearance of an additional maximum is observed, approximately corresponds to 300 MPa (the ultimate tensile stress of the ferrite phase). The results of strain distributions confirm the intense deformation of a decarburized interlayer (see Figure 8c). Therefore, it can be assumed that the additional maximum of the AE hits rate is an indicator of a decarburized diffusion interlayer.
A sign of a brittle carbide interlayer can be a change in the parameters of the distribution of the AE hits amplitudes. Figure 9 shows the distributions of the AE hits amplitudes for a defect-free specimen made from a plate that has not undergone heat treatment (Figure 9a) and a specimen with a confirmed presence of diffusion interlayers (Figure 9b).
The distributions were plotted over the interval corresponding to the strain-hardening section of the tension diagram, where the parameters of the AE hits change, predominantly stationarily. In the presence of diffusion interlayers, the distribution has a pronounced tail of high-amplitude values reaching 75–80 dB.
The variation of amplitude values also significantly increases; for a defect-free specimen of a dissimilar welded joint, the standard deviation of the amplitudes distribution is about 28 dB, and for a specimen containing diffusion interlayers, the standard deviation value increases to 42 dB, probably due to the fact that, against the background of the main process (deformation of the specimen with a dissimilar welded joint), an additional process of the destruction of a brittle carbide interlayer takes place.

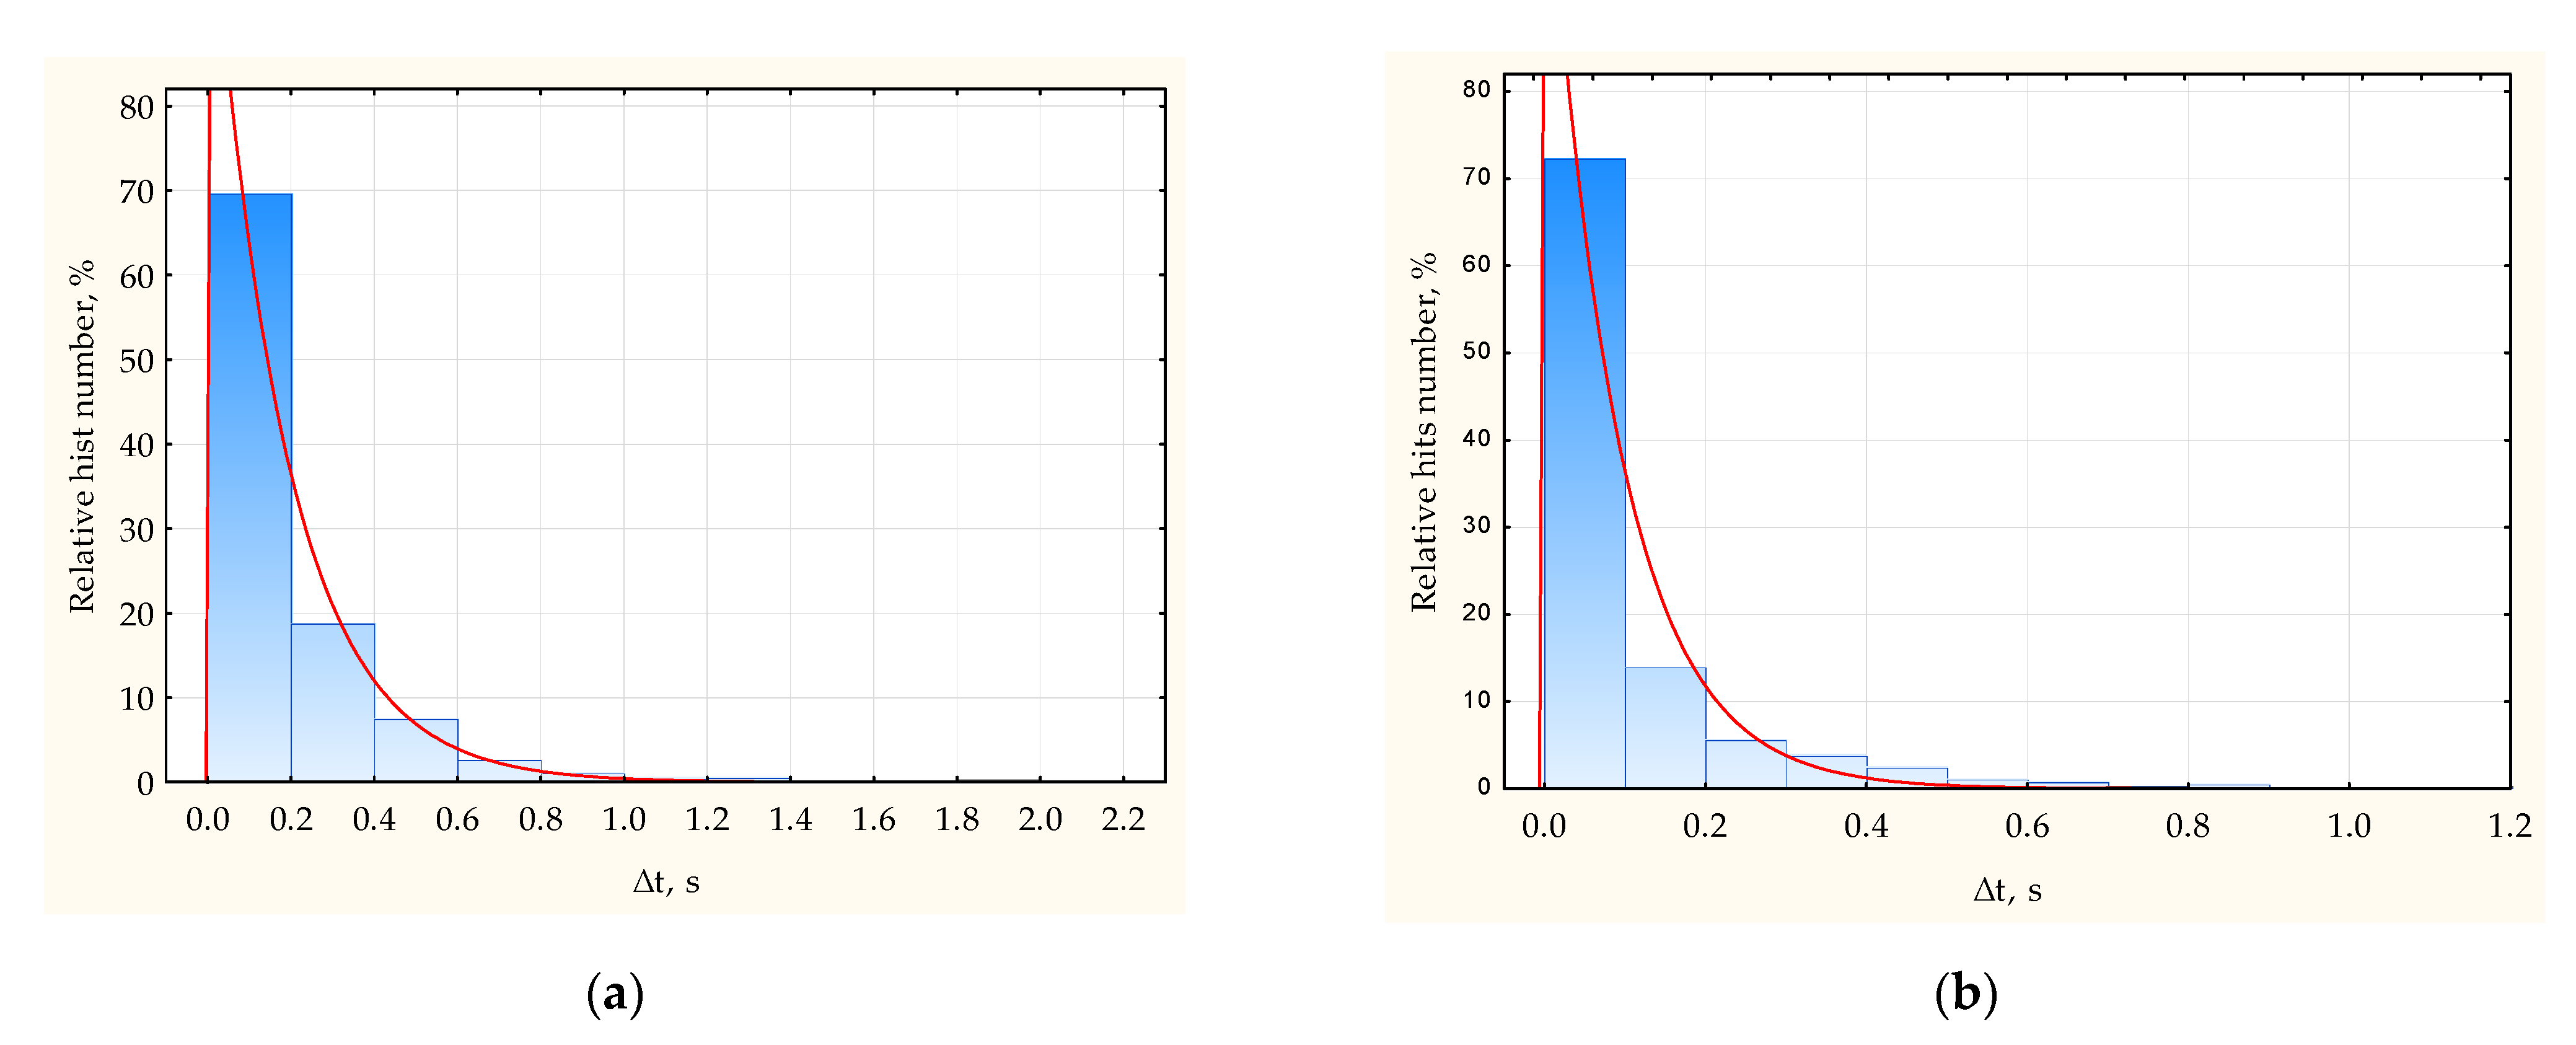
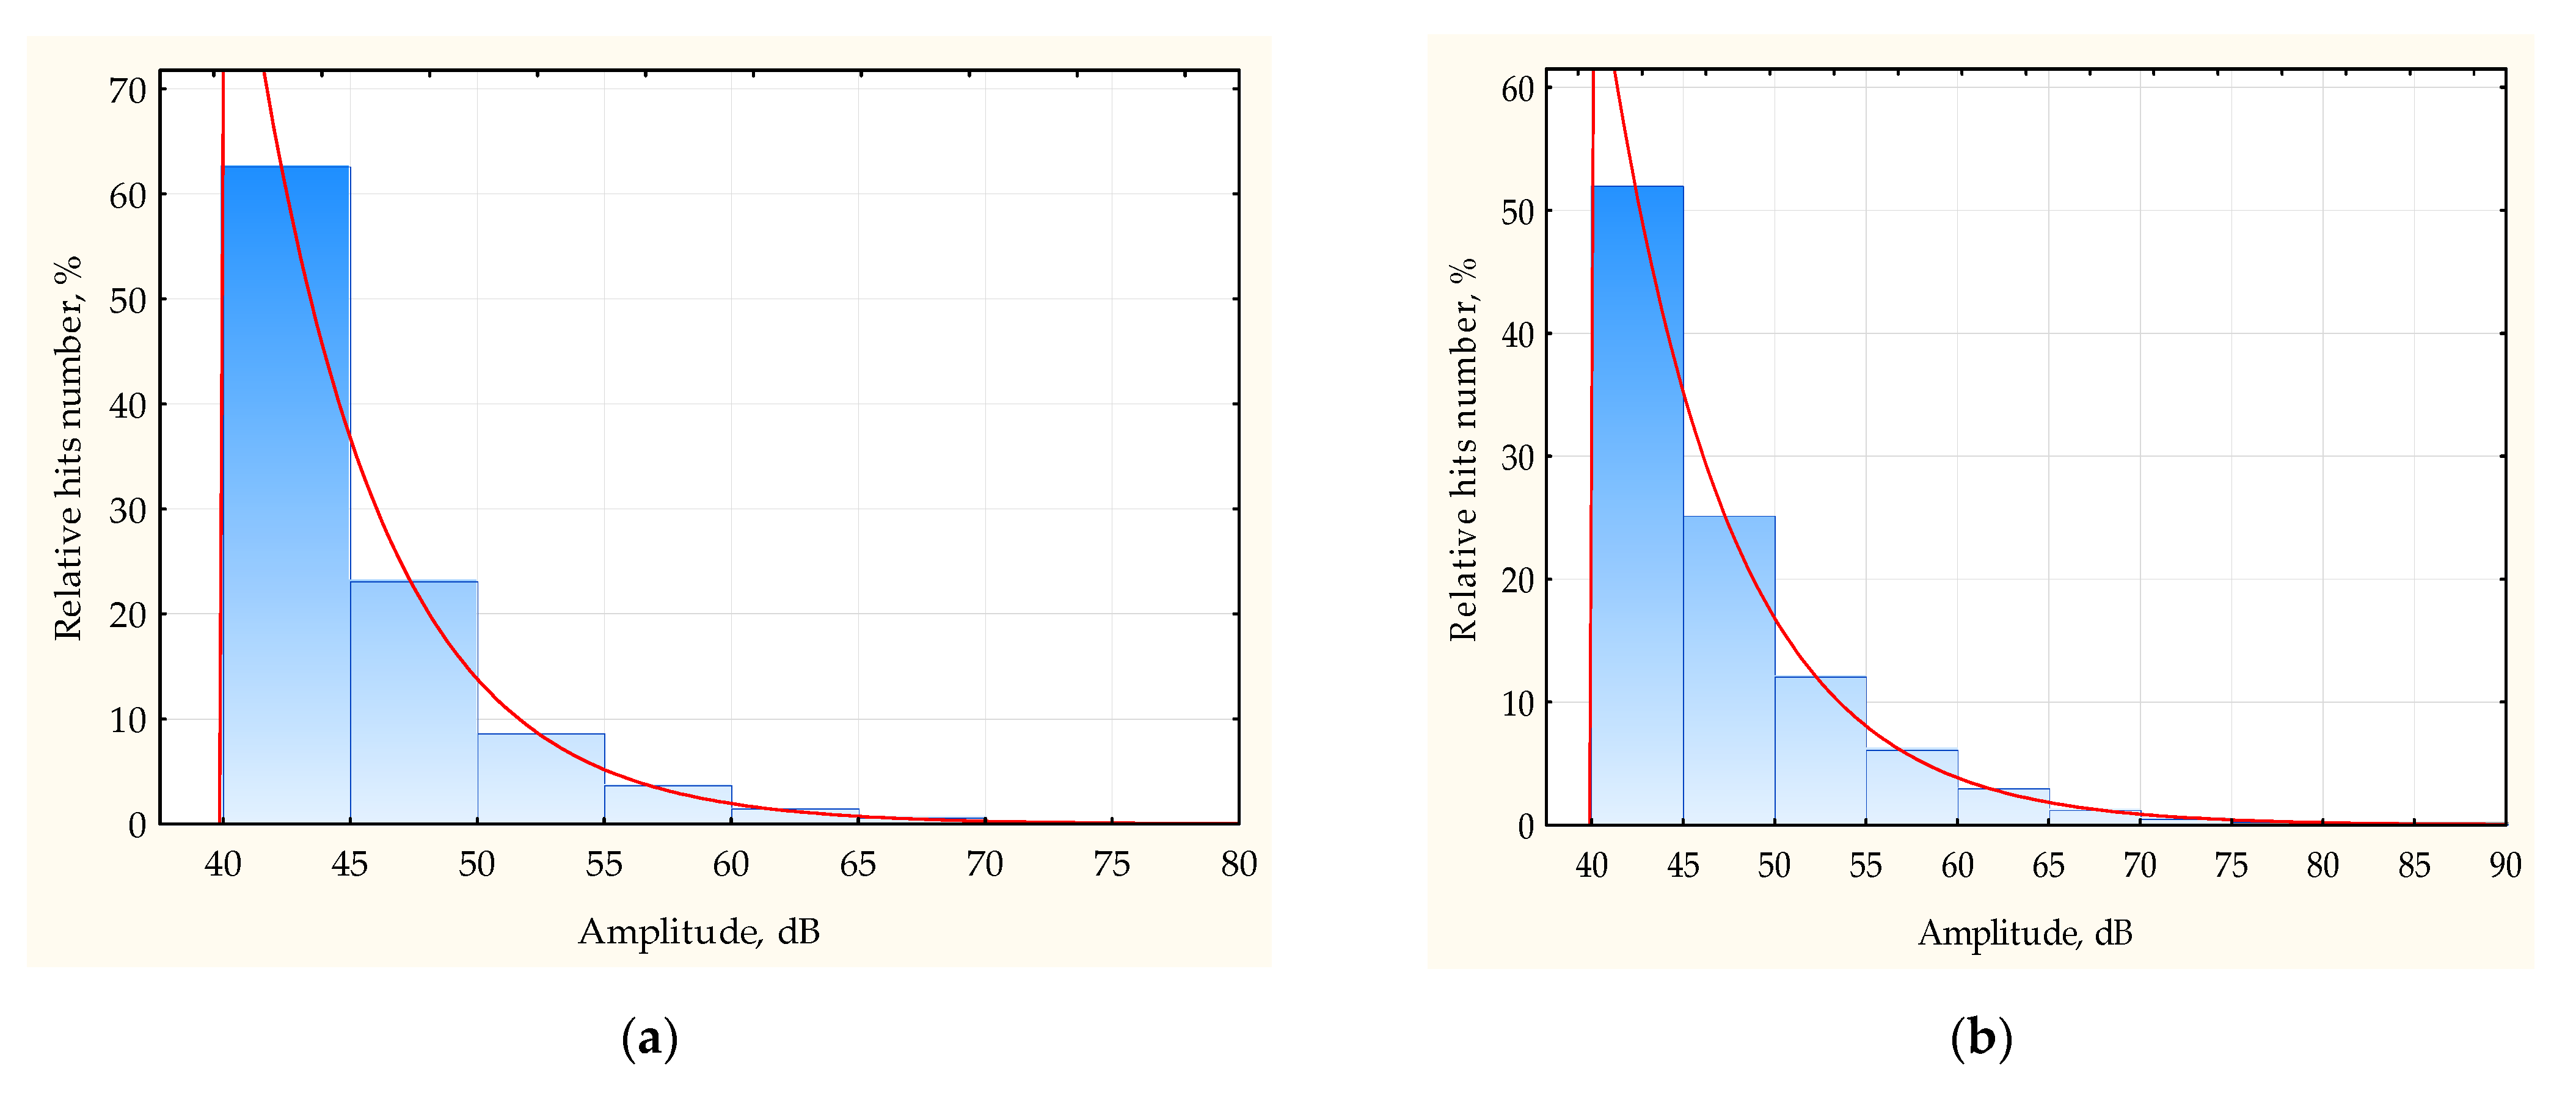
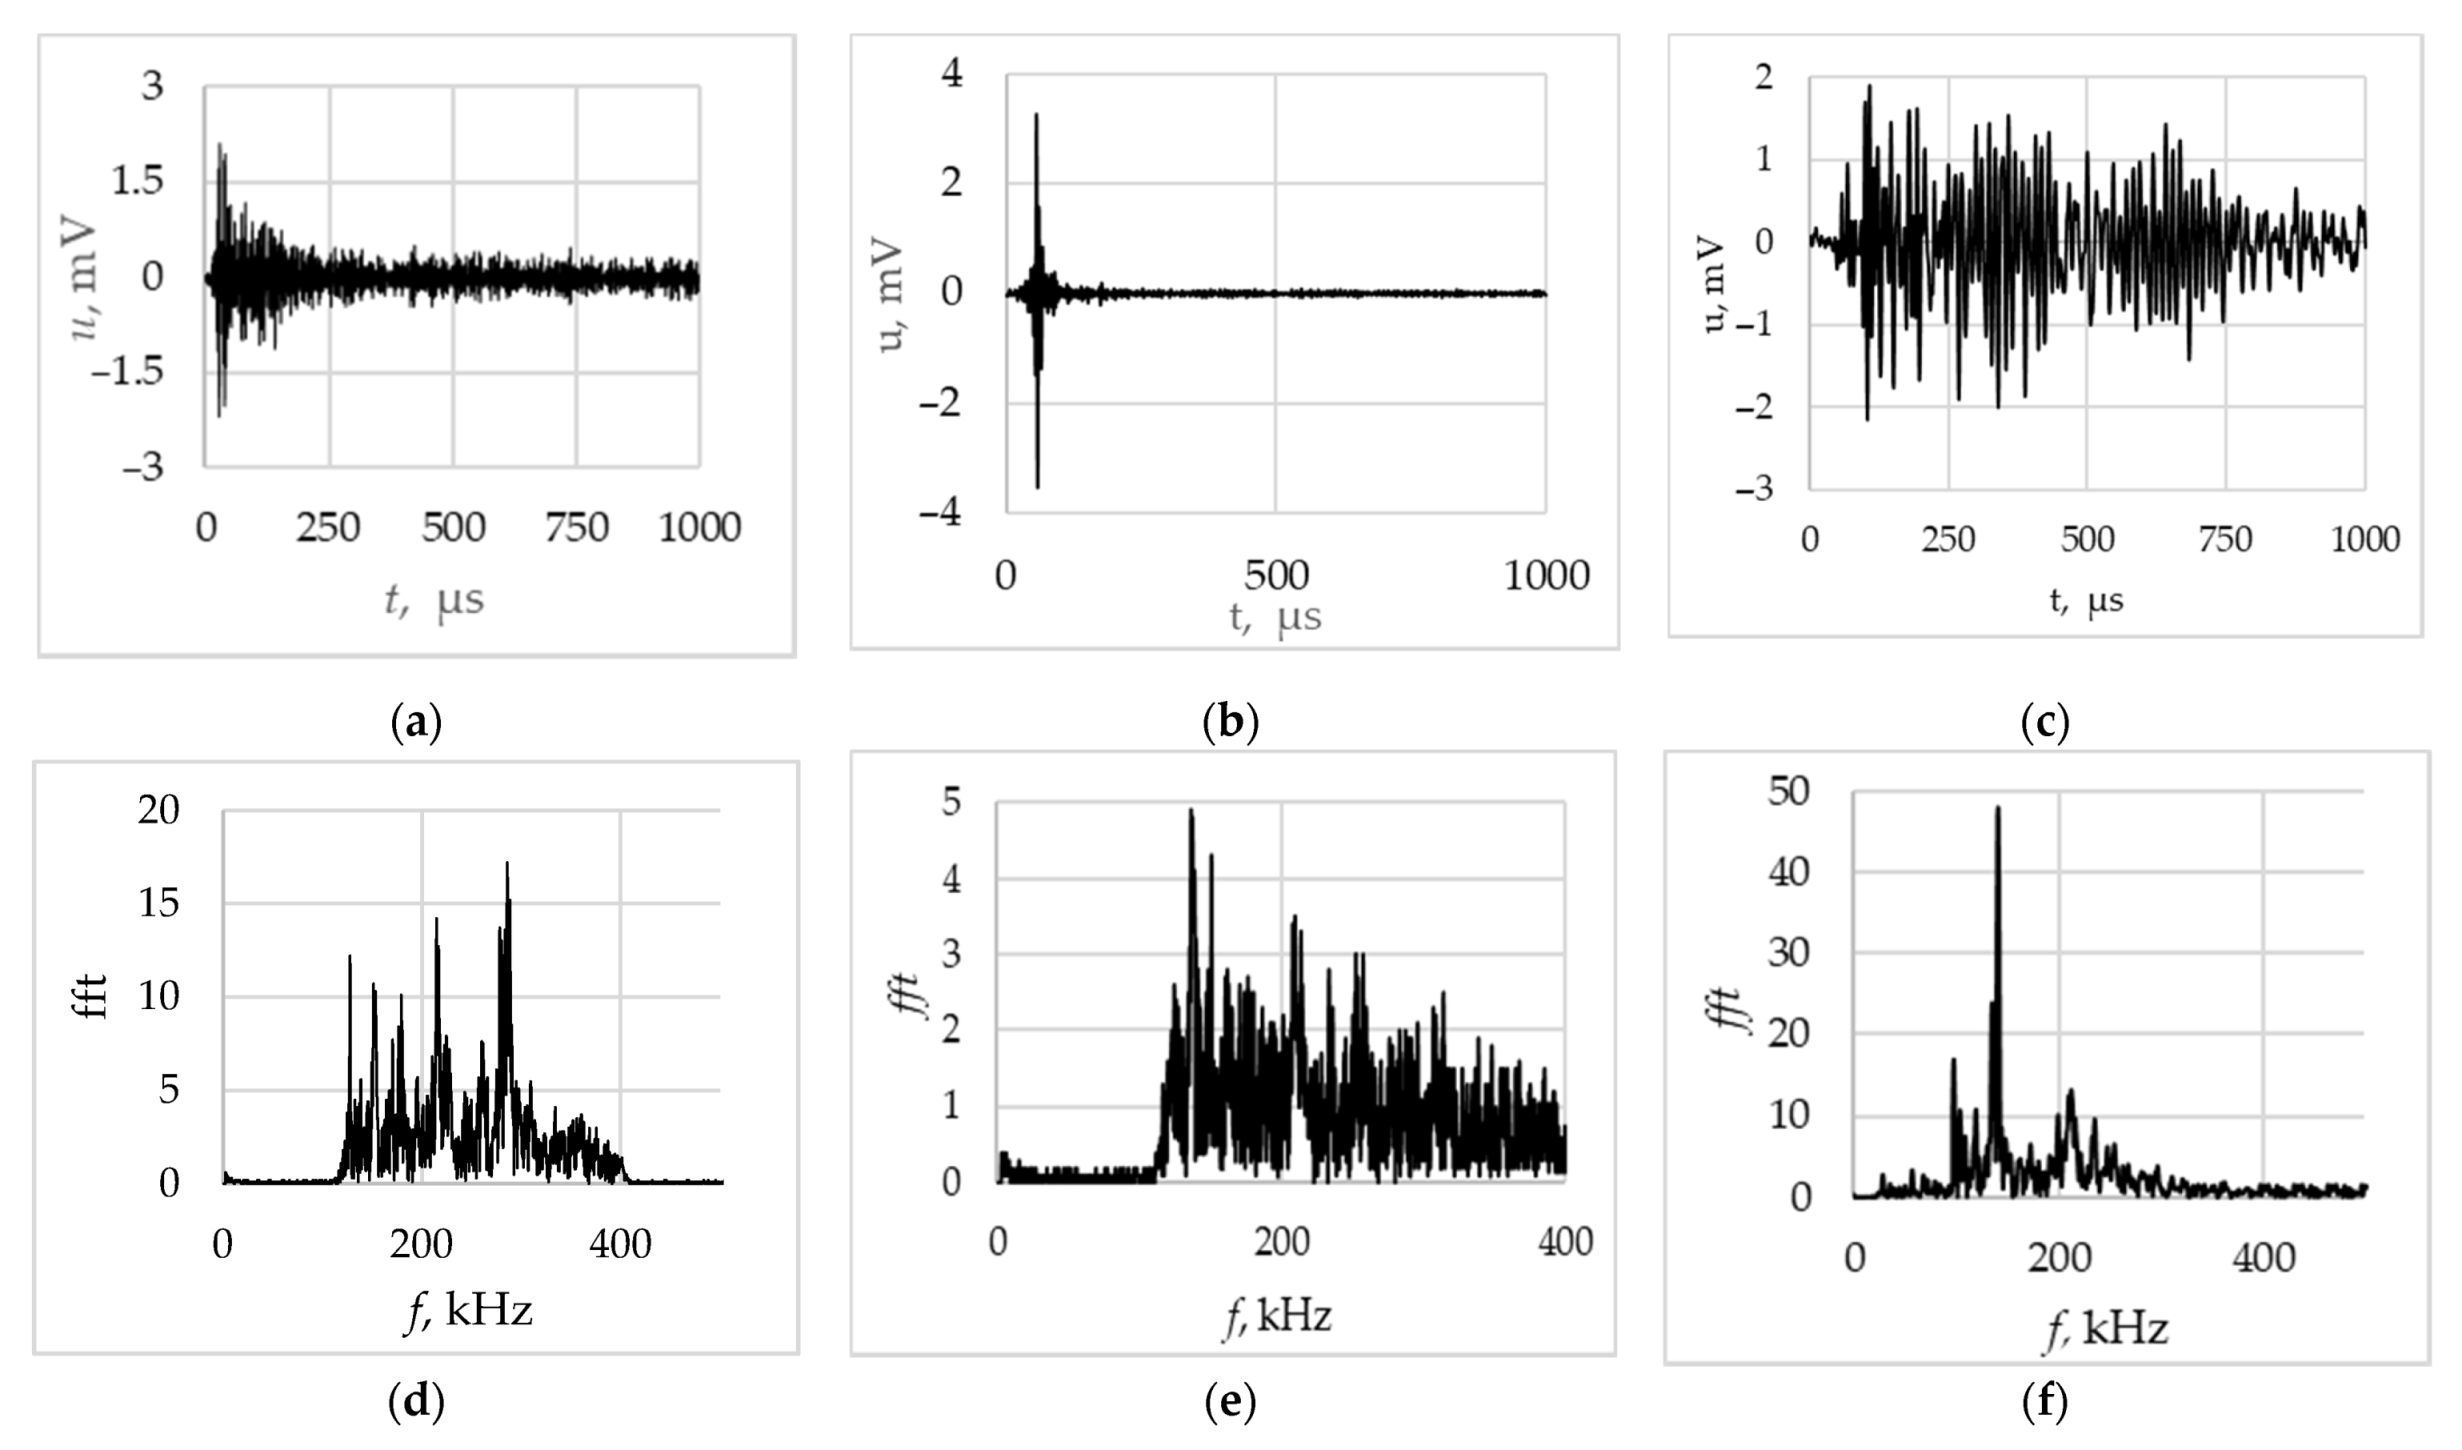
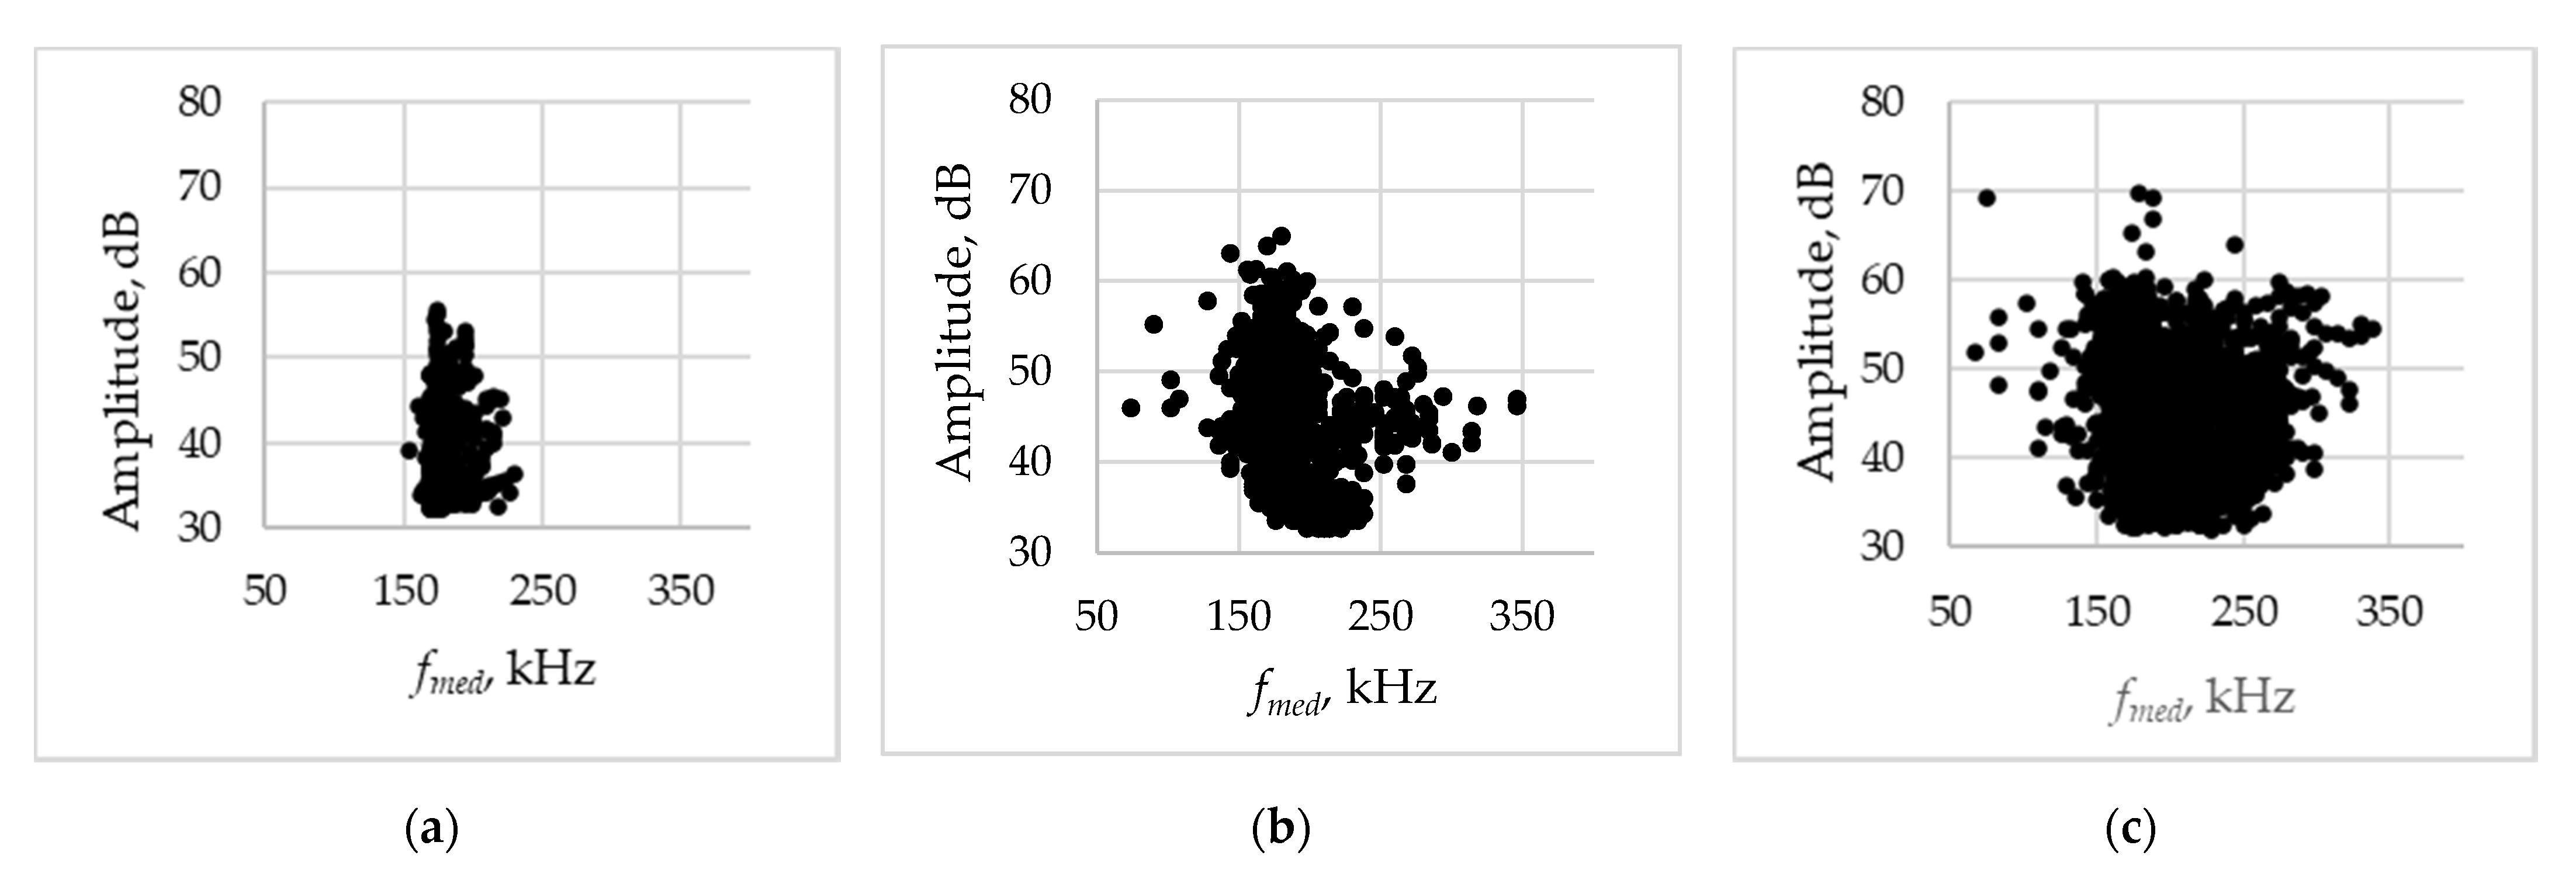
3.3. Investigation of AE Signals Waveform and Spectrum

Fracture predictors are more clearly identified based on the AE signal waveform. Figure 10 shows the waveforms and spectra of AE signals observed during the period of acoustic calm, typical for defect-free specimens (Figure 10a,d), for the specimens with diffusion interlayers (Figure 10b,e) and for specimens with lack of penetration (Figure 10c,f). AE signal waveforms were obtained with the clustering algorithm by which AE signal waveforms were grouped in the cluster in accordance with a correlation coefficient; each cluster joins the signals with a correlation coefficient r > 0.7. For each of three data samples corresponding to defect-free specimens, a specimen with diffusion interlayers, and a specimen with a lack of penetration, one representative cluster was formed.
For defect-free specimens, the size of the cluster formed with the correlated AE signals is in the order of 8–10% of the total signals number. It consists of short-duration signals with a relatively wide spectrum with a several resonances peaks. For samples with a lack of penetration, the proportion of correlated signals is much higher (more than 40%) and the typical signal waveform has the following features: a longer duration compared to the signals shown in Figure 10a, as well as a narrow-band spectrum corresponding to 120–150 kHz (Figure 10f). For specimens with diffusion interlayers, the proportion of correlated signals is more than 60%, a typical waveform has a high repeatability and represents a short impulse with a duration of about 10–20 μs (Figure 10b) and a wide spectrum corresponding to the bandwidth of the measuring channel (Figure 10e), since the waveform and spectra of the AE signals are characterized by some variability. For a more complete analysis of the AE data during the period of acoustic calm, the scatter plot between the amplitude of AE signals and the median frequency of the spectrum was considered (Figure 11). The amplitude characterizes the energy of AE source and the median frequency is an informative parameter characterizes the changes in a frequency spectrum of the AE signal.
The scatterplot corresponding to defect-free specimen is characterized by minimum variance in amplitudes and frequencies (Figure 11a). The presence of diffusion interlayers causes the scatterplot to expend slightly on an amplitude and more significantly on a frequency (Figure 11b). For a specimen with a lack of penetration, the scatterplot had a maximum deviation (Figure 11c), and the ranges of amplitudes increased insignificantly compared to non-defective case. The wide range of median frequency from 70 to 340 kHz indicates the presence of several AE sources corresponding to deformation processes and destruction in the welded joint area.

4. Discussion

The AE signature obtained for the specimens of the parent metals (09G2S and 12Kh18N10T steels) are consistent with the fundamental works [32] and [33] and do not contradict the general theory, according to which the AE upon deformation is proportional to the rate of the dislocation density increase. Therefore, the onset of plastic deformation corresponds to an intense accumulation of dislocations, and an increase in AE hits rate. At the stage of strain strengthening, when the dislocation density approaches the critical level, the AE hits rate decreases.
AE data obtained by tensile defect-free dissimilar welded joints form a repeatable signature consisting of two peaks of AE hits rate corresponding to the onset of plastic deformation of each of the parent metals and two periods of acoustic calm corresponding to their strain hardening (Figure 5a). In general, this AE signature is a combination of a data obtained during deformation of the steels being welded. The effect of acoustic calm during the deformation hardening explained in detail in [34].
The character of AE data during the tension of defect welded joint specimens is also repeatable. For the specimens with a lack of penetration, AE hits rate have a two local maxima, the first of which corresponds to the initiation of plastic deformation of 12Kh18N10T steel, and the second corresponds to the destruction of a defective welded joint (Figure 6). For the specimens of welded joints with the presence of a diffusion layer, the AE hits rate has an additional maximum at a stress value corresponding to the ultimate strength of the ferrite phase (Figure 8a). Therefore, it can be assumed that an additional maximum of the AE hits rate is an indicator of a decarburized diffusion layer. This fact is also confirmed by the results of local deformation using the digital image correlation method; simultaneously with the maximum of the AE activity, a local maximum of deformation is observed in the region of the decarburized diffusion layer (Figure 8c,d).
For early detection and identification of damage to a dissimilar welded joint, it is advisable to consider the period of acoustic calm, when the change in the AE data for defect-free specimens is almost stationary. For defect-free samples, this period is characterized by a scattered distributed accumulation of damage, while the distribution of time intervals between adjacent hits corresponds to an exponential law (Figure 9a). In the presence of a lack of penetration or diffusion layers, the exponential law of distribution of time intervals is violated, which is confirmed by the Pearson’s goodness-of-fit test (Figure 9b). The distribution function of time intervals is used as an indicator of the destruction process by a few authors [35]. The correspondence of the function of time intervals to the exponential distribution in [36], as well as in this paper, is a sign of scattered accumulation.
A more obvious indicator of the presence of a defect is the appearance of correlated AE signals during the period of acoustic calm. For welded joints with lack of penetration, the appearance of correlated signals with a long duration and a narrow-band spectrum is characteristic; in the presence of diffusion interlayers, most AE signals recorded during the period of acoustic calm are correlated short signals with burst form and broadband spectrum (Figure 10). The presented result agrees with [37], in which it was shown that the appearance of a defect is accompanied by a shift of the AE signal spectrum towards low frequencies compared to the spectra of signals corresponding to the plastic-deformation process.
A more obvious diagnostic result can be obtained using the scatterplot between the amplitudes and median frequencies of the AE signals (Figure 11). In this representation the measure of the points scatter on the plot characterizes the defectiveness of a dissimilar welded joint. Defect-free welded joint characterizes with a minimal scatter of amplitudes and frequencies, while defects presence leads to the appearance of additional AE sources and variation of AE parameters increase due to variability of deformation and destruction mechanisms.

5. Conclusions

Within the framework of this study the efficiency of using AE method for assessing the state of dissimilar welded joints of pearlitic and austenitic steels is shown.
The use of the AE method during a tension of dissimilar welded joints specimens allows detecting and recognizing not only macroscopic defects, such as cracks and lack of penetration, but also diffusion interlayers (which are related to microstructure defects).
In connection with the above, it can be concluded that the method of acoustic emission has a significant advantage in diagnostics of dissimilar welded joints in comparison with other methods of non-destructive testing.

Author Contributions

Conceptualization, V.B. (Vera Barat) and A.M.; methodology, V.B. (Vera Barat) and A.M.; software, M.K.; validation, V.B. (Vladimir Bardakov) and D.Z.; formal analysis, M.K.; investigation, V.B. (Vera Barat) and A.M.; resources, S.E.; data curation, M.K. and D.Z.; writing—original draft preparation, V.B. (Vera Barat); writing—review and editing, V.B. (Vladimir Bardakov); visualization, S.E.; supervision, S.E.; project administration, S.E. and A.M.; funding acquisition, V.B. (Vera Barat). All authors have read and agreed to the published version of the manuscript.

Funding

The research was carried out within the framework of the project “Diagnostics of dissimilar welded joints of pearlitic and austenitic steels by the acoustic emission” with the support of a grant from NRU “MPEI” for the implementation of scientific research programs “Energy”, “Electronics, Radio Engineering and IT”, and “Industry 4.0, Technologies for Industry and Robotics” in 2020–2022 (project No. 20/22-0000028/44).

Institutional Review Board Statement

Not applicable.

Informed Consent Statement

Not applicable.

Conflicts of Interest

The authors declare no conflict of interest.

References

  1. Manning, J.R. Diffusion Kinetics for Atoms in Crystals; Van Nostrand: Toronto, ON, Canada, 1968; p. 257. [Google Scholar]
  2. Rathod, D.W.; Pandey, S.; Singh, P.K.; Prasad, R. Experimental analysis of dissimilar metal weld joint: Ferritic to austenitic stainless steel. Mater. Sci. Eng. A 2015, 639, 259–268. [Google Scholar] [CrossRef]
  3. Khodakov, V.D.; Khodakov, D.V. Structure and mechanism of formation of dissimilar welded joints in nuclear power plant made of austenitic and pearlitic steels. Weld. Int. 2016, 30, 935–940. [Google Scholar] [CrossRef]
  4. Saini, M.; Arora, N.; Pandey, C.; Mehdi, H. Mechanical properties of bimetallic weld joint between SA 516 grade 65 carbon steel and SS 304 L for steam generator application. Int. J. Res. Eng. Technol. 2014, 3, 39–42. [Google Scholar]
  5. Dinesh, W.; Rathod, P.K.; Pandey, S.; Aravindan, S. Effect of buffer-layered buttering on microstructure and mechanical properties of dissimilar metal weld joints for nuclear plant application. Mater. Sci. Eng. A 2016, 666, 100–113. [Google Scholar] [CrossRef]
  6. Wang, W.K.; Liu, Y.; Zhang, Q.B.; Zhang, L.J.; Zhang, J.X. Microstructure and local mechanical properties of a dissimilar metal welded joint with buttering layer in steam turbine rotor. Mater. Sci. Eng. A 2019, 747, 244–254. [Google Scholar] [CrossRef]
  7. Goncharov, A.L.; Marchenkov, A.Y.; Terentyev, E.V.; Zhmurko, I.E.; Sliva, A.P. Study of structural non-homogeneity impact on mechanical properties of dissimilar weld joints of carbon steel 20 and corrosion-resistant austenitic 12Kh18N10T steel. Mater. Sci. Eng. 2019, 681, 012016. [Google Scholar] [CrossRef]
  8. ISO 17637:2016. Non-Destructive Testing of Welds—Visual Testing of Fusion-Welded Joints. Available online: https://www.iso.org/standard/67259.html (accessed on 11 November 2021).
  9. Moore, P.O. Radiographic Testing in Nondestructive Testing Handbook, 3rd ed.; American Society for NDT: Columbus, OH, USA, 2005; Volume 4. [Google Scholar]
  10. Bulavinov, A.; Kroning, M.; Walte, F.; Lui, J.; Reddy, K. Ultrasonic Inspection of Austenitic and Dissimilar Welds. In Proceedings of the IV Conferencia Panamericana de END, Buenos Aires, Argentina, 22–26 October 2007; p. 13. [Google Scholar]
  11. Eisazadeh, H.; Bunn, J.; Coules, H.E.; Achuthan, A.; Goldak, J.; Aidun, D.K. A Residual stress study in similar and dissimilar welds. Weld. Res. J. 2016, 95, 111–119. [Google Scholar]
  12. Han, T.; Schubert, F.; Hillmalnn, S.; Meyendorf, N. Phased Array Ultrasonic Testing of Dissimilar Metal Welds using Geometric Based Referencing Delay Law Technique. In Proceedings of the 7th International Workshop NDT in Progress: NDT of Lightweight Materials, Dresden, Germany, 7–8 November 2013; Volume 9439, p. 943904. [Google Scholar] [CrossRef]
  13. Bazulin, E.G. Allowing for Inhomogeneous Anisotropy of a Welded Joint when Reconstructing Reflector Images from Echo Signals Received by an Ultrasonic Antenna Array. Rus. J. Nondestr. Test. 2017, 53, 9–22. [Google Scholar] [CrossRef]
  14. Hwang, Y.; Park, J.; Kim, H.-J.; Song, S.-J.; Cho, Y.-S.; Kang, S.-S. Performance Comparison of Ultrasonic Focusing Techniques for Phased Array Ultrasonic Inspection of Dissimilar Metal Welds. Int. J. Precis. Eng. Manuf. 2019, 20, 525–534. [Google Scholar] [CrossRef]
  15. Juengert, A.; Dugan, S.; Homann, T.; Mitzscherling, S.; Prager, J.; Pudovikov, S.; Schwender, T. Advanced Ultrasonic Techniques for Nondestructive Testing of Austenitic and Dissimilar Welds in Nuclear Facilities. AIP Conf. Proc. 2018, 1949, 110002. [Google Scholar] [CrossRef]
  16. Sagaidak, A.I.; Elizarov, S.V. Acoustic emission parameters correlated with fracture and deformation processes of concrete members. Constr. Build. Mater. 2007, 21, 477–482. [Google Scholar] [CrossRef]
  17. Linderov, M.; Vinogradov, A.; Segel, C.; Weidner, A.; Biermann, H. Deformation mechanisms in austenitic TRIP/TWIP steels at room and elevated temperature investigated by acoustic emission and scanning electron microscopy. Mater. Sci. Eng. A 2014, 597, 183–193. [Google Scholar] [CrossRef]
  18. Muránsky, O.; Barnett, M.R.; Carr, D.G.; Vogel, S.C.; Oliver, E.C. Investigation of deformation twinning in a fine-grained and coarse-grained ZM20 Mg alloy: Combined in situ neutron diffraction and acoustic emission. Acta Mater. 2010, 58, 1503–1517. [Google Scholar] [CrossRef]
  19. Fukaura, K.; Yokoyama, Y.; Yokoi, D.; Tsujii, N.; Ono, K. Fatigue of cold-work tool steels: Effect of heat treatment and carbide morphology on fatigue crack formation, life, and fracture surface observations. Metall. Mater. Trans. A 2004, 35, 1289–1300. [Google Scholar] [CrossRef]
  20. Inamura, T.; Nagano, S.; Shimojo, M.; Takashima, K.; Higo, Y. Detection of pre-martensitic transformation phenomena in austenitic stainless steels using as acoustic emission technique. J. Acoust. Emiss. 2001, 19, 85–90. [Google Scholar]
  21. Wuriti, G.S.; Chaattopadhyaya, S.; Krolczyk, G. Comparison of Acoustic Emission Data Acquired During Tensile Deformation of Maraging Steel M250 Welded Specimens. Arch. Acoust. 2020, 45, 221–231. [Google Scholar]
  22. Chang, H. Acoustic Emission Study of Fatigue Crack Propagation of Weld Joint for X52 Pipeline Steel. Mater. Sci. Forum 2019, 960, 38–44. [Google Scholar] [CrossRef]
  23. Rastegaev, I.; Danyuk, A.; Afanas’yev, M.; Merson, D.; Berto, F.; Vinogradov, A. Acoustic Emission Assessment of Impending Fracture in a Cyclically Loading Structural Steel. Metals 2016, 6, 266. [Google Scholar] [CrossRef] [Green Version]
  24. Shamsudin, M.F.; Mares, C.; Johnston, C.; Lage, Y.; Edwards, G.; Gan, T.-H. Application of Bayesian estimation to structural health monitoring of fatigue cracks in welded steel pipe. Mech. Syst. Signal Process. 2019, 121, 112–123. [Google Scholar] [CrossRef]
  25. Chai, M.; Qin, M.; Zheng, Y.; Hou, X.; Zhang, Z.; Cheng, G.; Duan, Q. Acoustic Emission Detection during Welding Residual Stresses Release in 2.25Cr1Mo0.25V Steel Welds. Mater. Today Proc. 2018, 5, 13759–13766. [Google Scholar] [CrossRef]
  26. Kong, Y.S.; Cheepu, M.; Lee, J.-K. Evaluation of the Mechanical Properties of Inconel 718 to SCM 440 Dissimilar Friction Welding through Real-Time Monitoring of the Acoustic Emission System. Proc. Inst. Mech. Eng. Part L J. Mater. Des. Appl. 2021, 235, 1181–1190. [Google Scholar] [CrossRef]
  27. Venkatakrishna, A.; Lakshminarayanan, A.K.; Radhika, K.; Rajasekaran, R. Characterizing the Tensile Deformation Behavior of Friction Stir Welded Dissimilar Joints using Acoustic Emission Technique. In Trends in Manufacturing and Engineering Management; Springer: Singapore, 2021. [Google Scholar] [CrossRef]
  28. Paventhan, R.; Lakshminarayanan, P.R.; Balasubramanian, V. Fatigue behavior of friction welded medium carbon steel and austenitic stainless steel dissimilar joints. Mater. Des. 2011, 32, 1888–1894. [Google Scholar] [CrossRef]
  29. Chen, G.; Luo, H.; Yang, H.; Han, Z.; Lin, Z.; Zhang, Z.; Su, Y. Effects of the welding inclusion and notch on the fracture behaviors of low-alloy steel. J. Mater. Res. Technol. 2019, 8, 447–456. [Google Scholar] [CrossRef]
  30. Russian State Standard GOST 19281-89 Rolled Steel with Increased Strength General Specifications; Standartinform: Moscow, Russia, 1989.
  31. Russian State Standard GOST 5582-75 Stainless and Heat-Resisting Sheet Specifications; Standartinform: Moscow, Russia, 1975.
  32. Ennaceur, C.; Beaugrand, V. Acoustic Emission Monitoring of Crack Growth in Dissimilar Joints for Corrosion Resistant Applications. In Proceedings of the 28th European Conference on Acoustic Emission Testing, Krakow, Poland, 17–19 September 2008; pp. 64–69. [Google Scholar]
  33. Vinogradov, A.Y.; Merson, D.L. The Nature of Acoustic Emission during Deformation Processes in Metallic Materials. Low Temp. Phys. 2018, 44, 930–937. [Google Scholar] [CrossRef]
  34. Kumar, J.; Sarmah, R.; Ananthakrishna, G. General Framework for Acoustic Emission during Plastic Deformation. Phys. Rev. B Condens. Matter Mater. Phys. 2015, 92, 14. [Google Scholar] [CrossRef] [Green Version]
  35. Builo, S.I. Diagnostics of the Predestruction State Based on Amplitude and Time Invariants of the Flow of Acoustic-Emission Acts. Russ. J. Nondestruct. Test. 2004, 40, 561–564. [Google Scholar] [CrossRef]
  36. Kumar, J.; Ananthakrishna, G. Modeling the Complexity of Acoustic Emission during Intermittent Plastic Deformation: Power Laws and Multifractal Spectra. Phys. Rev. E 2019, 97, 2018. [Google Scholar] [CrossRef] [Green Version]
  37. Vinogradov, A.; Yasnikov, I.S.; Merson, D.L. Phenomenological Approach Towards Modelling the Acoustic Emission due to Plastic Deformation in Metals. Scr. Mater. 2019, 170, 172–176. [Google Scholar] [CrossRef]
Figure 1. Scheme of a welded joint of pearlitic and austenitic steels.
Applsci 11 11892 g001
Figure 2. Transverse metallographic sections of dissimilar welded joints of steel 09G2S and 12Kh18N10T: plates pair No.1, without defects (a); plates pair No.2, with lack of penetration (b); plates pair No.3, after heat treatment, with diffusion interlayers (c,d).
Applsci 11 11892 g002
Figure 3. AE data recorded under tension of specimens made of 12Kh18N10T austenitic steel.
Applsci 11 11892 g003
Figure 4. AE data recorded under tension of specimens made of 09G2S low-alloyed pearlitic steel.
Applsci 11 11892 g004
Figure 5. Results of dissimilar defect-free welded joint test: AE data recorded under tension (a), sample with a painted area (b), and strain distributions over the painted area on different stages of test (c,d).
Applsci 11 11892 g005
Figure 6. AE data recorded under tension of a specimen of a dissimilar welded joint with a lack of penetration.
Applsci 11 11892 g006
Figure 7. Distribution of time intervals between the adjacent AE hits. (a) For defect-free dissimilar weld specimen, and (b) for dissimilar weld specimen with lack of penetration.
Applsci 11 11892 g007
Figure 8. Results of dissimilar welded joint with diffusion interlayers test: AE data recorded under tension (a) and strain distributions over the painted area on different stages of test (bd).
Applsci 11 11892 g008
Figure 9. Distribution of AE hits amplitudes for defect-free dissimilar weld specimen (a), and for a specimen with a confirmed presence of diffusion interlayers (b).
Applsci 11 11892 g009
Figure 10. Typical AE signal waveforms and spectrums for defect-free weld joint (a,d), for weld joint with diffusion interlayers (b,e) for weld joint with lack of penetration (c,f).
Applsci 11 11892 g010
Figure 11. Scatter plot between the amplitude of AE signals and the median frequencies (a) for defect-free weld joint, (b) for weld joint with diffusion interlayers, (c) for weld joint with lack of penetration.
Applsci 11 11892 g011
Table 1. Chemical composition of welded steels and filler wire, wt.%.
CSiMnNiSPCrCuTiFe
12Kh18N10T steel≤0.12≤0.8≤29–11≤0.02≤0.03517–19≤0.30.4–1~67
09G2S steel≤0.120.5–0.81.3–1.7≤0.3≤0.04≤0.035≤0.3≤0.3-Balance
Sabaros SW146 wire0.100.808.58.5--18.5--Balance
Publisher’s Note: MDPI stays neutral with regard to jurisdictional claims in published maps and institutional affiliations.

