Abstract
In this paper, we propose a method to evaluate Highway Driving Assist (HDA) systems using the theoretical formula and dual cameras, which eliminates the need of experts or expensive equipment and reduces the time, effort, and cost required in such tests. A theoretical evaluation formula that can be calculated was proposed and used. The optimal position of the dual cameras, image and focal length correction, and lane detection methods proposed in previous studies were used, and a theoretical equation for calculating the distance from the front wheel of the vehicle to the driving lane was proposed. For the actual vehicle testing, HDA safety evaluation scenarios proposed in previous studies were used. According to the test results, the maximum errors were within 10%. It was determined that the representative cause of the maximum error occurred in the dual camera installed in the test vehicle. Problems such as road surface vibration, shaking due to air resistance, changes in ambient brightness, and the process of focusing the video occurred during driving. In the future, it is judged that it will be necessary to verify the complex transportation environment during morning and evening rush hour, and it is believed that tests will be needed in bad weather such as snow and rain.
1. Introduction
Recently, interest in autonomous vehicles has been increasing worldwide. An autonomous vehicle refers to a vehicle that operates on its own without a driver’s manipulation [1,2,3,4,5,6]. The classification of autonomous driving technology is divided into six stages, from level 0 to level 5, from J3016 published by the Society of Automotive Engineers International (SAE International) [7]. Advanced Driver Assistance System (ADAS) technology, currently in commercial use, refers to level 1 to 2 technology defined in SAE J 3016. Examples of ADAS include Adaptive Cruise Control (ACC), Autonomous Emergency Braking (AEB), Lane Keeping Assist System (LKAS), Active Blind Spot Detection (ABSD), Highway Driving Assist (HDA), etc.
Among them, HDA recognizes lanes and lead vehicles while driving on highways to support inter-vehicle distance maintenance and lane maintenance functions, and, recently, lane change functions have been added [8]. This function adjusts the speed by itself by recognizing the speed limit on the highway, the presence or absence of the lead vehicles, and the speed by linking the GPS of the vehicle’s navigation. Additionally, unlike the steering assistance function of LKAS, it is a system that controls steering so that it can travel to the center of the lane. Due to the influence of HDA technology, driver fatigue is minimized. And HDA is evaluated as a useful system for preventing accidents as a base system for autonomous vehicles.
Looking at the research trends of ADAS, Bae et al. [8] devised scenarios to evaluate the safety and functioning of HDA systems, performed simulations using the PRESCAN simulator, and verified the simulation results with real vehicle tests. Bae et al. [9] conducted research on the evaluation method of the HDA system using a monocular camera. Kim et al. [10] proposed test evaluation scenarios and theoretical evaluation criteria for the test evaluation method of ACC vehicles. Kim et al. [11] conducted research on the ACC test evaluation methods that meets the domestic (S. Korea) road environmental standards. Bae et al. [12] proposed a theoretical equation for calculating the distance from the front wheel to the lane using a monocular camera, and verified the validity of the theoretical equation through actual vehicle tests. Hwang et al. [13] proposed the LKAS system by adopting the desired reference path generation algorithm and optimal control technique. Lee et al. [14] proposed comprehensive synthesis and analysis methods to find the performance limits and the impact of parameter changes on the lane keeping system’s performance.
Looking at the research trends of cameras, Bae et al. [15] conducted a study calculating the distance between vehicles in front of them using a monocular camera. Lee et al. [16] conducted a study on the optimal installation position of a dual camera and the measurement of the distance from the lead vehicle. Kalaki et al. [17] proposed novel methods using computer vision technologies. The experimental results showed that the proposed algorithms can correctly identify lanes with high accuracy in real time, and are robust to noise and shadows. Jiangwei et al. [18] detected a lead vehicle using a monocular camera, and Satzoda et al. [19] proposed a vehicle-detection algorithm using camera calibration. Shu et al. [20] proposed a method for finding and tracking road lanes for vision-guided autonomous vehicle navigation. The new lane detection method was tested on real road images and achieved robust and reliable results. Koo [21] proposed a single camera-based front collision warning system using deep learning and OBD2, and verified its performance through a collision experiment. Zhao et al. [22] presented a novel object detection and identification method that fuses the complementary information obtained by two types of sensors. Yamaguti et al. [23] proposed a measurement method of the distance to the target vehicle using two images, and calculated the distance using the ratio between the sizes of the objects projected on the two images. Song [24] used only camera sensors to predict the path of surrounding vehicles and showed high accuracy with deep learning technology, while Heo [25] proposed a method to measure the distance and speed of a moving object by extracting the difference image from a stereo vision system. Abduladhem et al. [26] proposed a method to estimate the distance from the preceding vehicle using Hough Transform and Kalman filter in a monocular camera.
However, studies on test evaluation methods of ADAS in a real road environment and test evaluation methods using cameras and theoretical formula are insufficient. In this paper, to verify the evaluation method of the HDA function using theoretical formula and dual cameras, a formula capable of calculating the distance to the lead vehicle was proposed. The HDA scenario and dual camera installation location proposed in the preceding study were used. In addition, the HDA scenario-based test is conducted on the actual highway. This time, the HDA evaluation method using the theoretical formula and the dual camera is verified by comparing and analyzing the calculation of the theoretical formula, the result using the dual camera, and the result using the measuring instrument.
2. Theoretical Background
2.1. Proposal of Theoretical Formulas That Can Calculate Distance
To control the velocity and distance of the vehicle, acceleration of the lead vehicle is required. Acceleration is obtained through optimal control theory using vehicle speed and distance information measured using a radar sensor. The target relative distance, which is related to distance information, is as shown in Formula (1)
where is relative distance, is initial relative distance, is time gap, and is velocity.
The equation of the time difference between the subject vehicle and the lead vehicle is shown in Formula (2) below.
where is the time gap between the subject vehicle and the lead vehicle, the constants are the coefficients for interpolation.
in Formula (2) requires a speed difference between the subject vehicle and the lead vehicle to evaluate the speed or distance of the subject vehicle, so must be . Accordingly, Formula (2) can be expressed as Formula (3).
As and play the same role, the proposed theoretical evaluation equation is shown in Formula (4).
2.2. Selecting the Optimal Installation Location for Dual Camera
In previous studies [16], for vehicle testing, a theoretical formula for measuring the distance to an object in front using a dual camera was proposed. Moreover, a study was conducted to select the optimal location of the dual camera.
Variables for selecting the optimal position of the dual camera are height, spacing, and angle. The reason why the camera installation height is selected as a variable is that the lower the height the wider the area of the ground captured in the video. The reason why the camera installation interval is selected as a variable is that it affects distance measurement according to the installation interval of two cameras. The reason why the camera’s photographing angle is selected as a variable is that a camera having a small vertical angle of view cannot photograph a short-range ground. Table 1 is the result of summarizing the test results for selecting the optimal mounting position of the dual camera. The average error rate and the maximum error rate, according to the combination of each variable, are shown.

Table 1.
The results for selecting the optimal location for dual cameras.
The value of the variable considers the specifications of the camera and vehicle. The variables of the camera height are 30 cm, 40 cm, and 50 cm. The reason why the minimum value is selected as 30 cm is that the bumper height of a typical sedan is higher than 30 cm, so the camera cannot be physically mounted at a position lower than 30 cm. The reason for selecting the maximum value of 50 cm is that if the mounting height is greater than 50 cm, the ground within 1 m cannot be photographed due to the vertical angle of view of the camera used in the test. The variables of the camera baseline are 10 cm, 20 cm, and 30 cm. The reason why the minimum value is selected as 10 cm is that the distance between the left and right camera lenses cannot be smaller than 10 cm because of the size of the camera used in the test. In addition, 20 cm and 30 cm were additionally set to confirm the tendency for the value of the mounting interval. The variables of the camera angle are 3°, 7°, and 12°. This considers the position of the preceding vehicle and the ground captured in the image. For example, the reason why the minimum value is set to 3° is that the ground within 1 m cannot be photographed when the value is less than 3° due to the mounting height and the vertical angle of view of the camera. In addition, the reason why the maximum value is set to 12° is that when the mounting angle is greater than 12°, the area occupied by the ground in the image increases, and the horizon is located at the top of the image, making it difficult to photograph a preceding vehicle located at a distance of 10 m or more.
As an experiment of each variable, when the camera installation height was 40 cm, the camera installation interval was 30 cm, and the camera shooting angle was 12 degrees, the best results were derived, so this was selected as the optimal location. The reason why the camera installation height was selected as 40 cm was that when the height increased from 30 cm to 40 cm, the error rate decreased, and when the height increased from 40 cm to 50 cm, the error rate increased. The reason why the camera installation interval was selected as 30 cm was that the error rate tended to decrease as the interval increased. The reason why the camera photographing was selected at an angle of 12 degrees was that the error rate was likely to decrease while the value increased.
2.3. Calculate the Lane Distance Using Dual Cameras
2.3.1. Variables of Camera Image
To define the variables, it is assumed that the width of the image (), height of the image (), and focal length of the camera () used for lane detection are constant and that the specifications of the vehicle and camera used are known.
The vanishing point and center point required for the calculation can be obtained using the lane detected through the lane detection algorithm. Figure 1 shows the detected right and left lanes extended above the image, with which the coordinates of the vanishing point A (x1, y1) and the coordinates of the center point B (x2, y2) can be obtained.
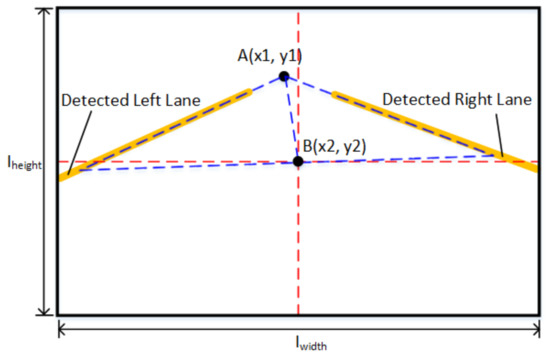
Figure 1.
Vanishing point image obtained from detected lanes.
In the preceding study [16], the lane detection equation in the image was proposed through Curve Fitting. Using this equation, the positions of the x-coordinate pixel and the y-coordinate pixel of the lane in the image may be obtained. C (x3, y3) and D (x4, y4) may be obtained through the pixel position of the lane. At this time, the origin is in the upper left corner of the image. Figure 2 shows C, D and origin point.
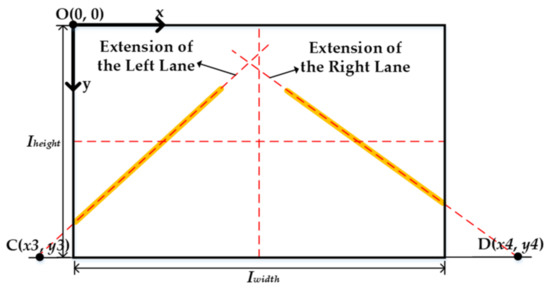
Figure 2.
Extension line image obtained from detected lanes.
2.3.2. Geometrical Variables of the Vehicle
The installation position of the dual camera was set as a front bumper because it was necessary to photograph the ground within 1 m. Accordingly, Figure 3 shows the geometric composition of the dual cameras installed in the vehicle when viewed from the side. Given the installation angle (), installation height (), and vertical field of view () of the dual cameras, the shortest distance from the ground () that can be detected in the image can be obtained.
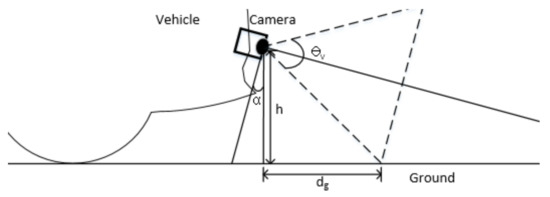
Figure 3.
Shortest distance to the ground that can be detected in the image.
Figure 4 shows the geometric composition between the vehicle and lane when the vehicle is being driven on the road. Variables relevant to vehicle and camera specifications include the length from the front of the vehicle to the center of the front wheel (), the overall width of the vehicle (), the baseline of the dual cameras (), and the horizontal field of view (). Variables relevant to the camera image include the width of the lane (), distance from the optical axis of the camera to the left lane (), and heading angle of the vehicle (). Based on the relationship of the proposed variables, an equation for calculating the distance from the left front wheel of the vehicle to the left lane () is derived. According to , the distance from the right front wheel of the vehicle to the right lane () is derived by the overall width of the vehicle and the width of the road. () is the distance from the optical axis of the camera to the right camera.
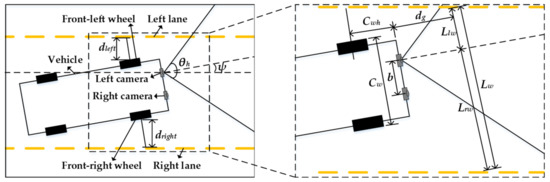
Figure 4.
Geometric composition of the vehicle on the road.
The detected lane extends in a straight line to set the intersection point as the vanishing point and the center of the image as the center point.
2.3.3. Proposal for Theoretical Formula
With the variables defined in Figure 1, the heading angle can be derived as shown in Formula (5).
With the variables defined in Figure 2, the distance from the front-left wheel to the left lane can be derived as shown in Formula (6).
With the variables defined in Figure 3, the shortest distance from the ground that can be detected in the image can be derived as shown in Formula (7).
With the variables defined in Figure 4, the distance from the left front wheel of the vehicle to the left lane can be derived as in Formulas (8)–(10).
2.4. Design Standards for Highways
Currently, highways in Korea (S. Korea) stipulate minimum standards under the “Rules about Road Structure & Facility Standards” of the Road Act [27].
Table 2, Table 3, Table 4, Table 5 and Table 6 below show the minimum regulations. The design basis vehicles are semi-trailers, according to the classification of road functions. Design basis vehicles serve as the basis for road and structural design. The design basis vehicle on the highway is a semi-trailer.
Table 2.
Type of design standard car.
Table 3.
Design speed by function of roads.
Table 4.
Minimum width of the lane by the design speed.
Table 5.
Minimum curve radius by the design speed.
Table 6.
Maximum longitudinal slope by the design speed.
Table 2 is the specifications for the category of design basis vehicles. The semi-trailer is longer than automobiles and has a larger minimum radius of rotation.
Table 3 shows the design speed according to the classification of road functions. In the case of highways, the design speed is 120 km/h based on the flat land of the local area. Considering the local situation, it is possible to set the speed by subtracting 20 km/h from the design speed according to the environment.
Table 4 summarizes the contents of the highway among the minimum width of the lane according to the design speed of the road. The minimum width of the highway lane is 3.50 m.
Table 5 shows the minimum plane curve radius according to the design speed of the road. The design speed of a typical highway is 120 km/h, and the larger the superelevation, the smaller the plane curve radius.
A superelevation refers to a cross-fall slope installed by a car to resist centrifugal force in a plane curve.
Table 6 shows the longitudinal slope according to the design speed of the road, and for highways, it is up to 5%. The longitudinal slope is installed in the direction of the progress of the road and refers to the ratio of change in height to the length of the centerline.
3. Actual Vehicle Test
To verify our method, we conducted a real vehicle test under scenarios presented in a related previous study [8] using the test conditions listed in Table 7. The initial speed of the subject vehicle is 90 km/h, and that of the lead vehicle is 70 km/h.
Table 7.
HDA scenario condition.
3.1. Test Vehicle
To proceed with the real road-based actual vehicle test, Genesis G90 of H** company for the subject vehicle and SONATA of H** company for the lead vehicle were selected. The subject vehicles used are shown in Figure 5.
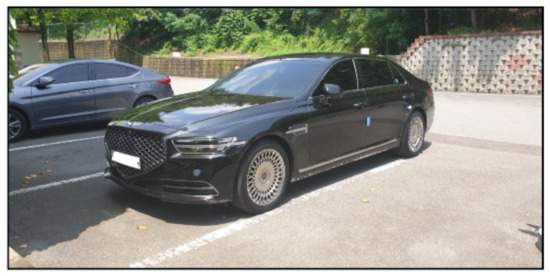
Figure 5.
Test vehicle (GENESIS G90).
The reason for selecting the target vehicle as company H’s Genesis G90 is that it is equipped with sensors such as cameras, radars, and ultrasonic waves, enabling ADAS technologies such as ACC, LKAS, AEB, and HDA systems to be implemented. Moreover, the ADAS function was evaluated as excellent.
3.2. Test Equipment
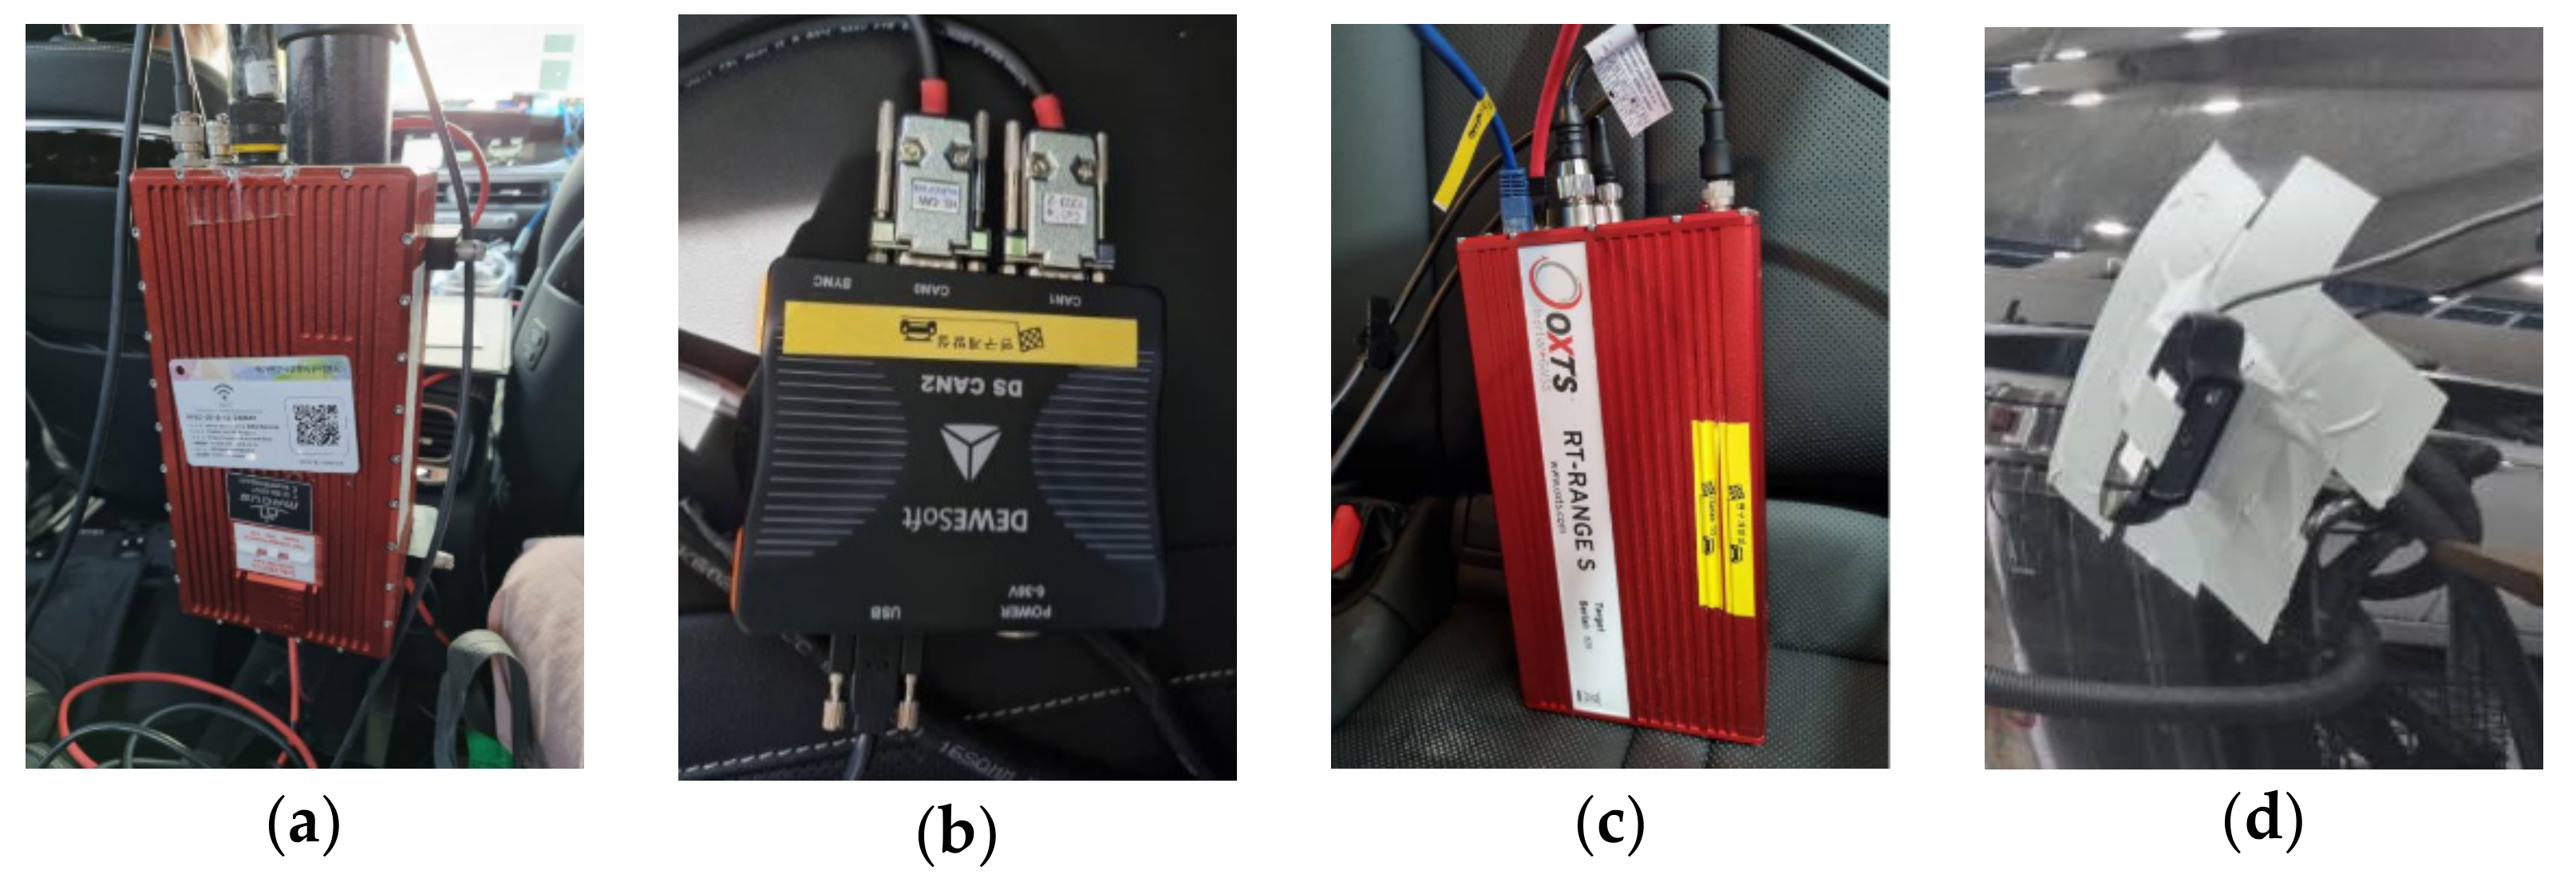
The devices used for the recording measurements during the real vehicle test included the RT3002 inertial navigation system, RT-range ADAS sensor, data acquisition device (DAQ), and a camera.
The devices mounted on the test vehicle are shown in Figure 6, and their specifications are listed in Table 8. The RT3002 system measures the vehicle’s dynamic characteristics based on differential GPS data, and the RT-range sensor measures the distance to the lead vehicle. DAQ collects the data measured from RT3002 and RT-range, and the camera measures the distance from the front tires to a lane.

Figure 6.
Test measuring instrument. (a) RT-3002, (b) DAQ, (c) RT-range, (d) Camera.
Table 8.
Specifications of measuring instruments.
For this study, it was necessary to configure a dual camera. The dual camera was configured through two webcams from Company L**, and Figure 7 is the appearance of a dual camera mounted on a vehicle. The screen photographed by each webcam synchronized overlapping locations and used them as dual cameras.
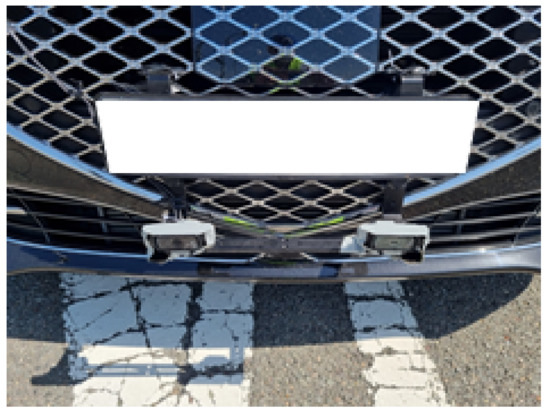
Figure 7.
Dual camera.
3.3. Test Location and Road Conditions
The vehicle test was conducted along the Dongdaegu TG-Gyeongsan TG section of the Gyeongbu Expressway of the Republic of Korea. Figure 8 shows the HDA test path and displays the section corresponding to each scenario, and Table 9 lists the road conditions.
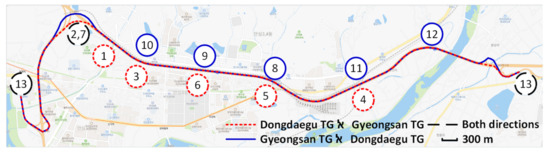
Figure 8.
Test real road.
Table 9.
Road conditions during real vehicle test.
4. Test Results and Analysis
4.1. Results of the Actual Vehicle Test Using Measuring Instruments
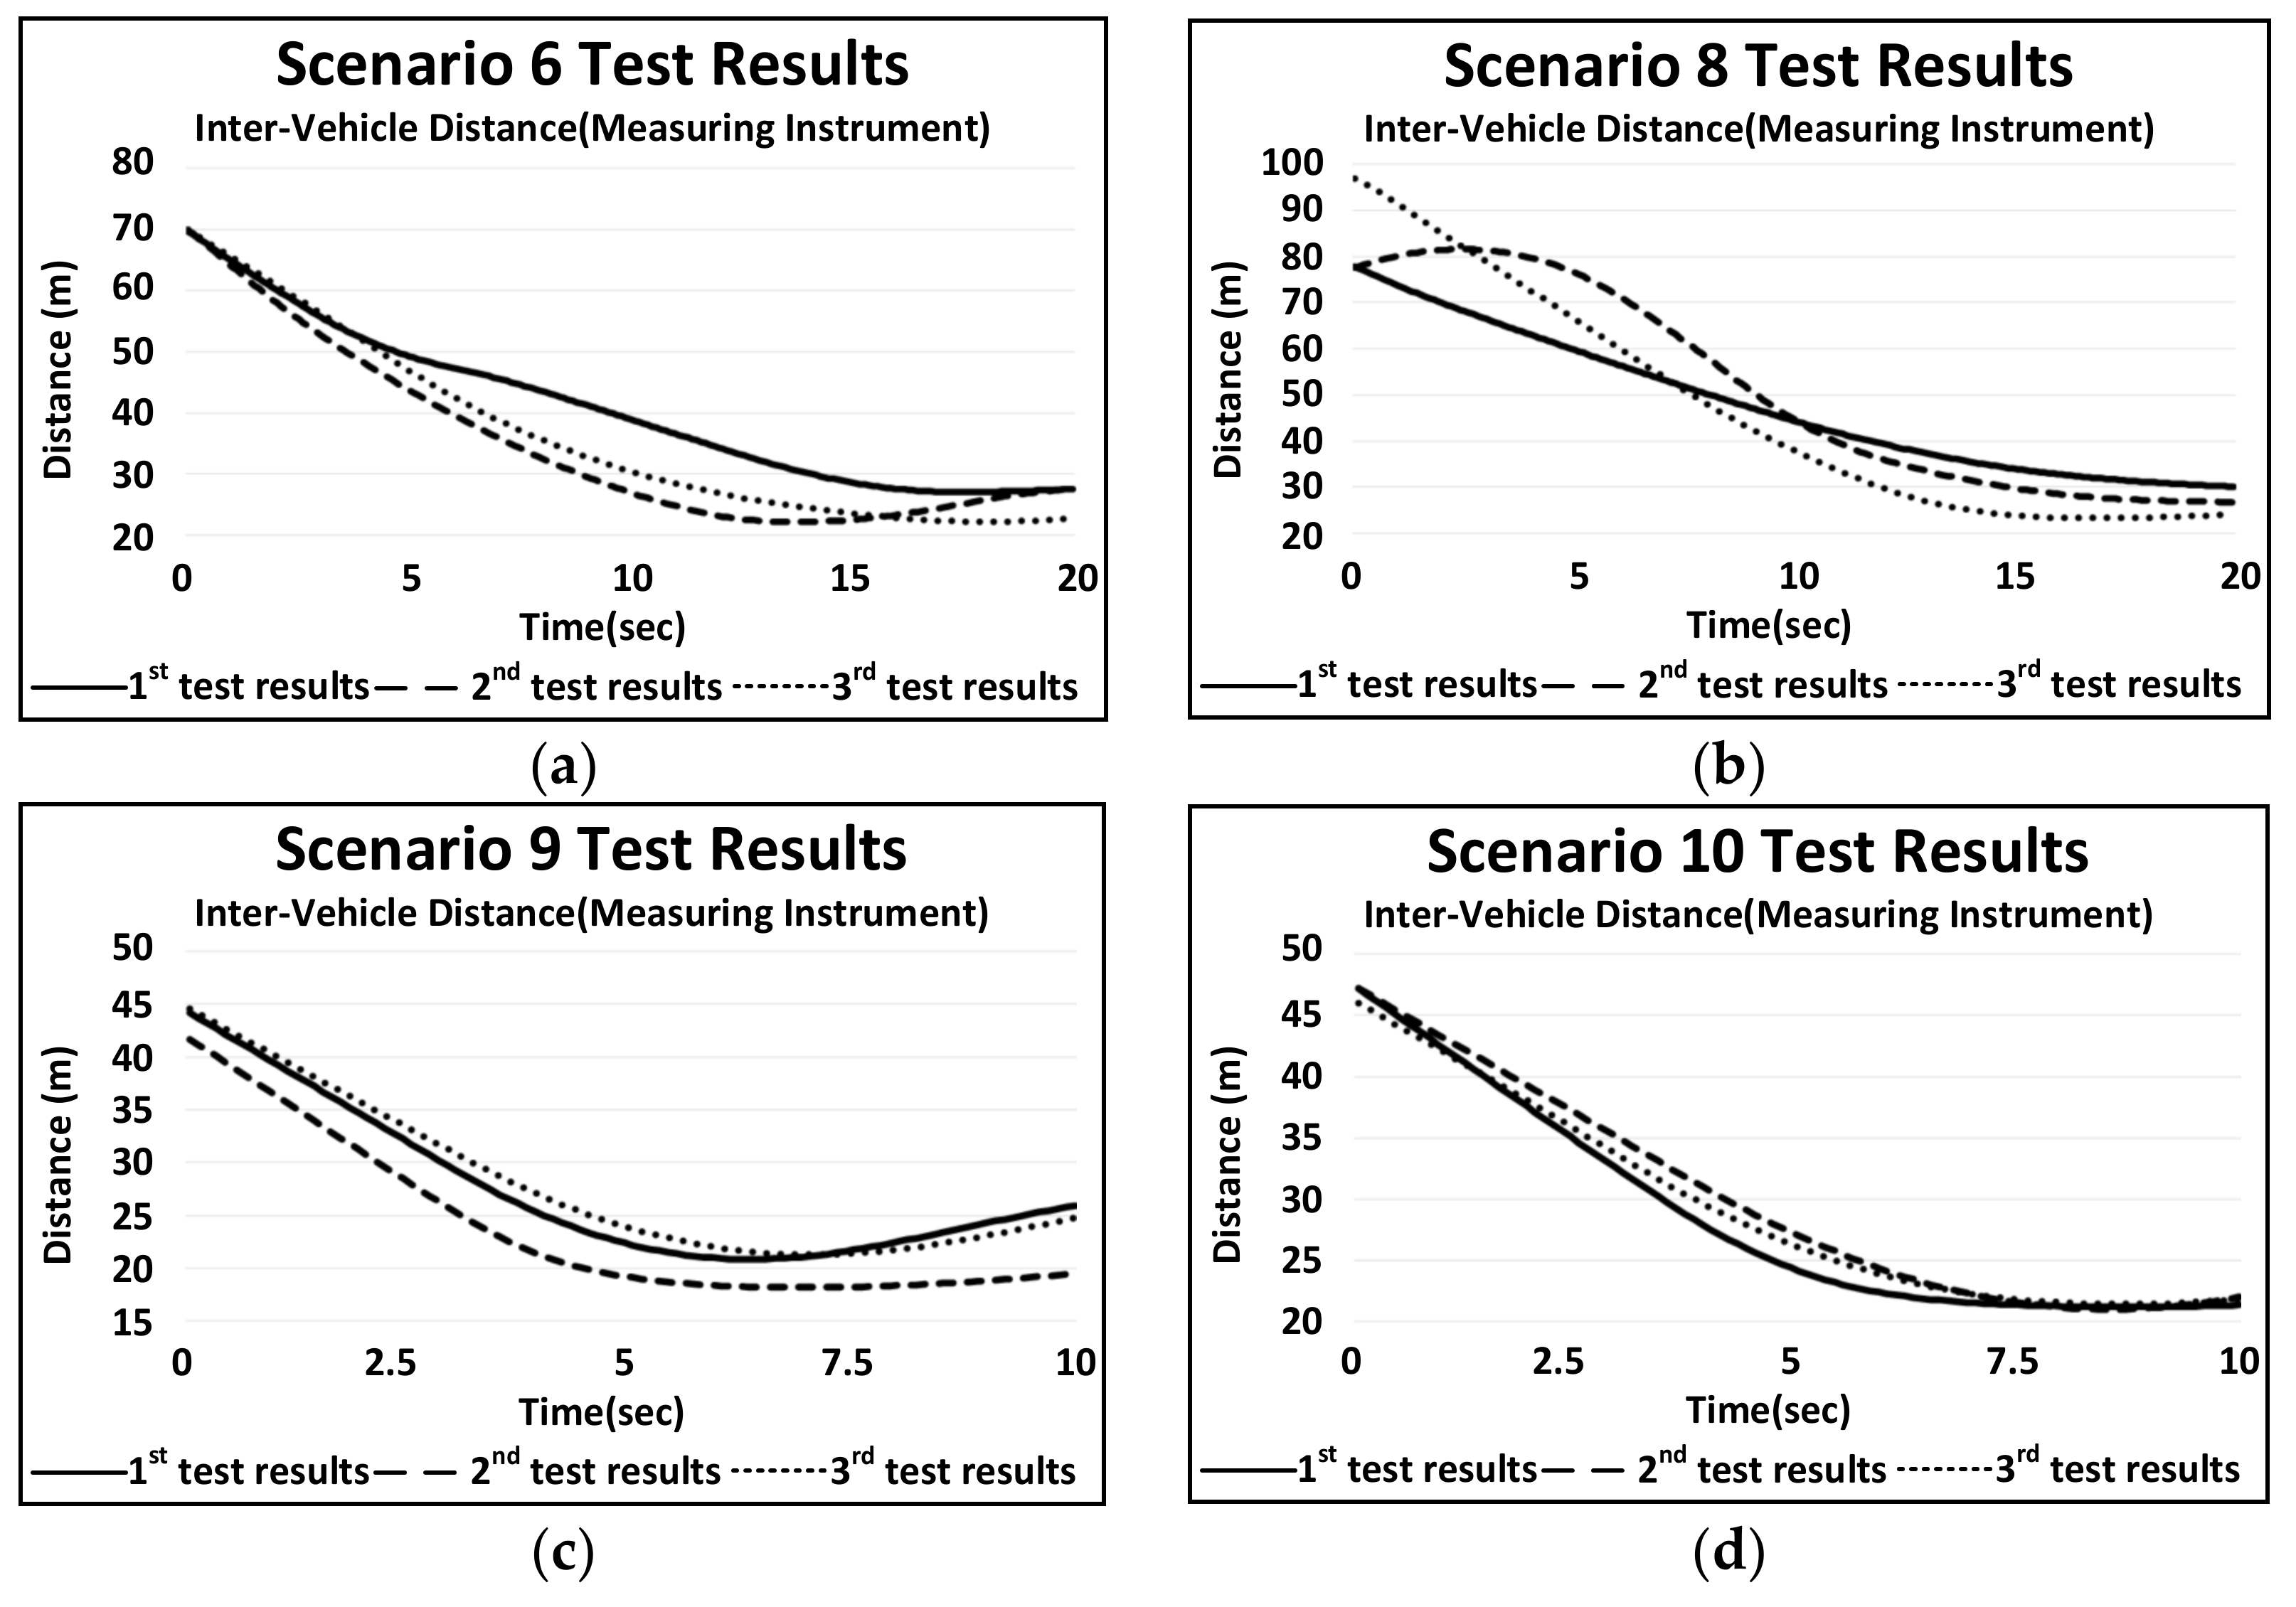
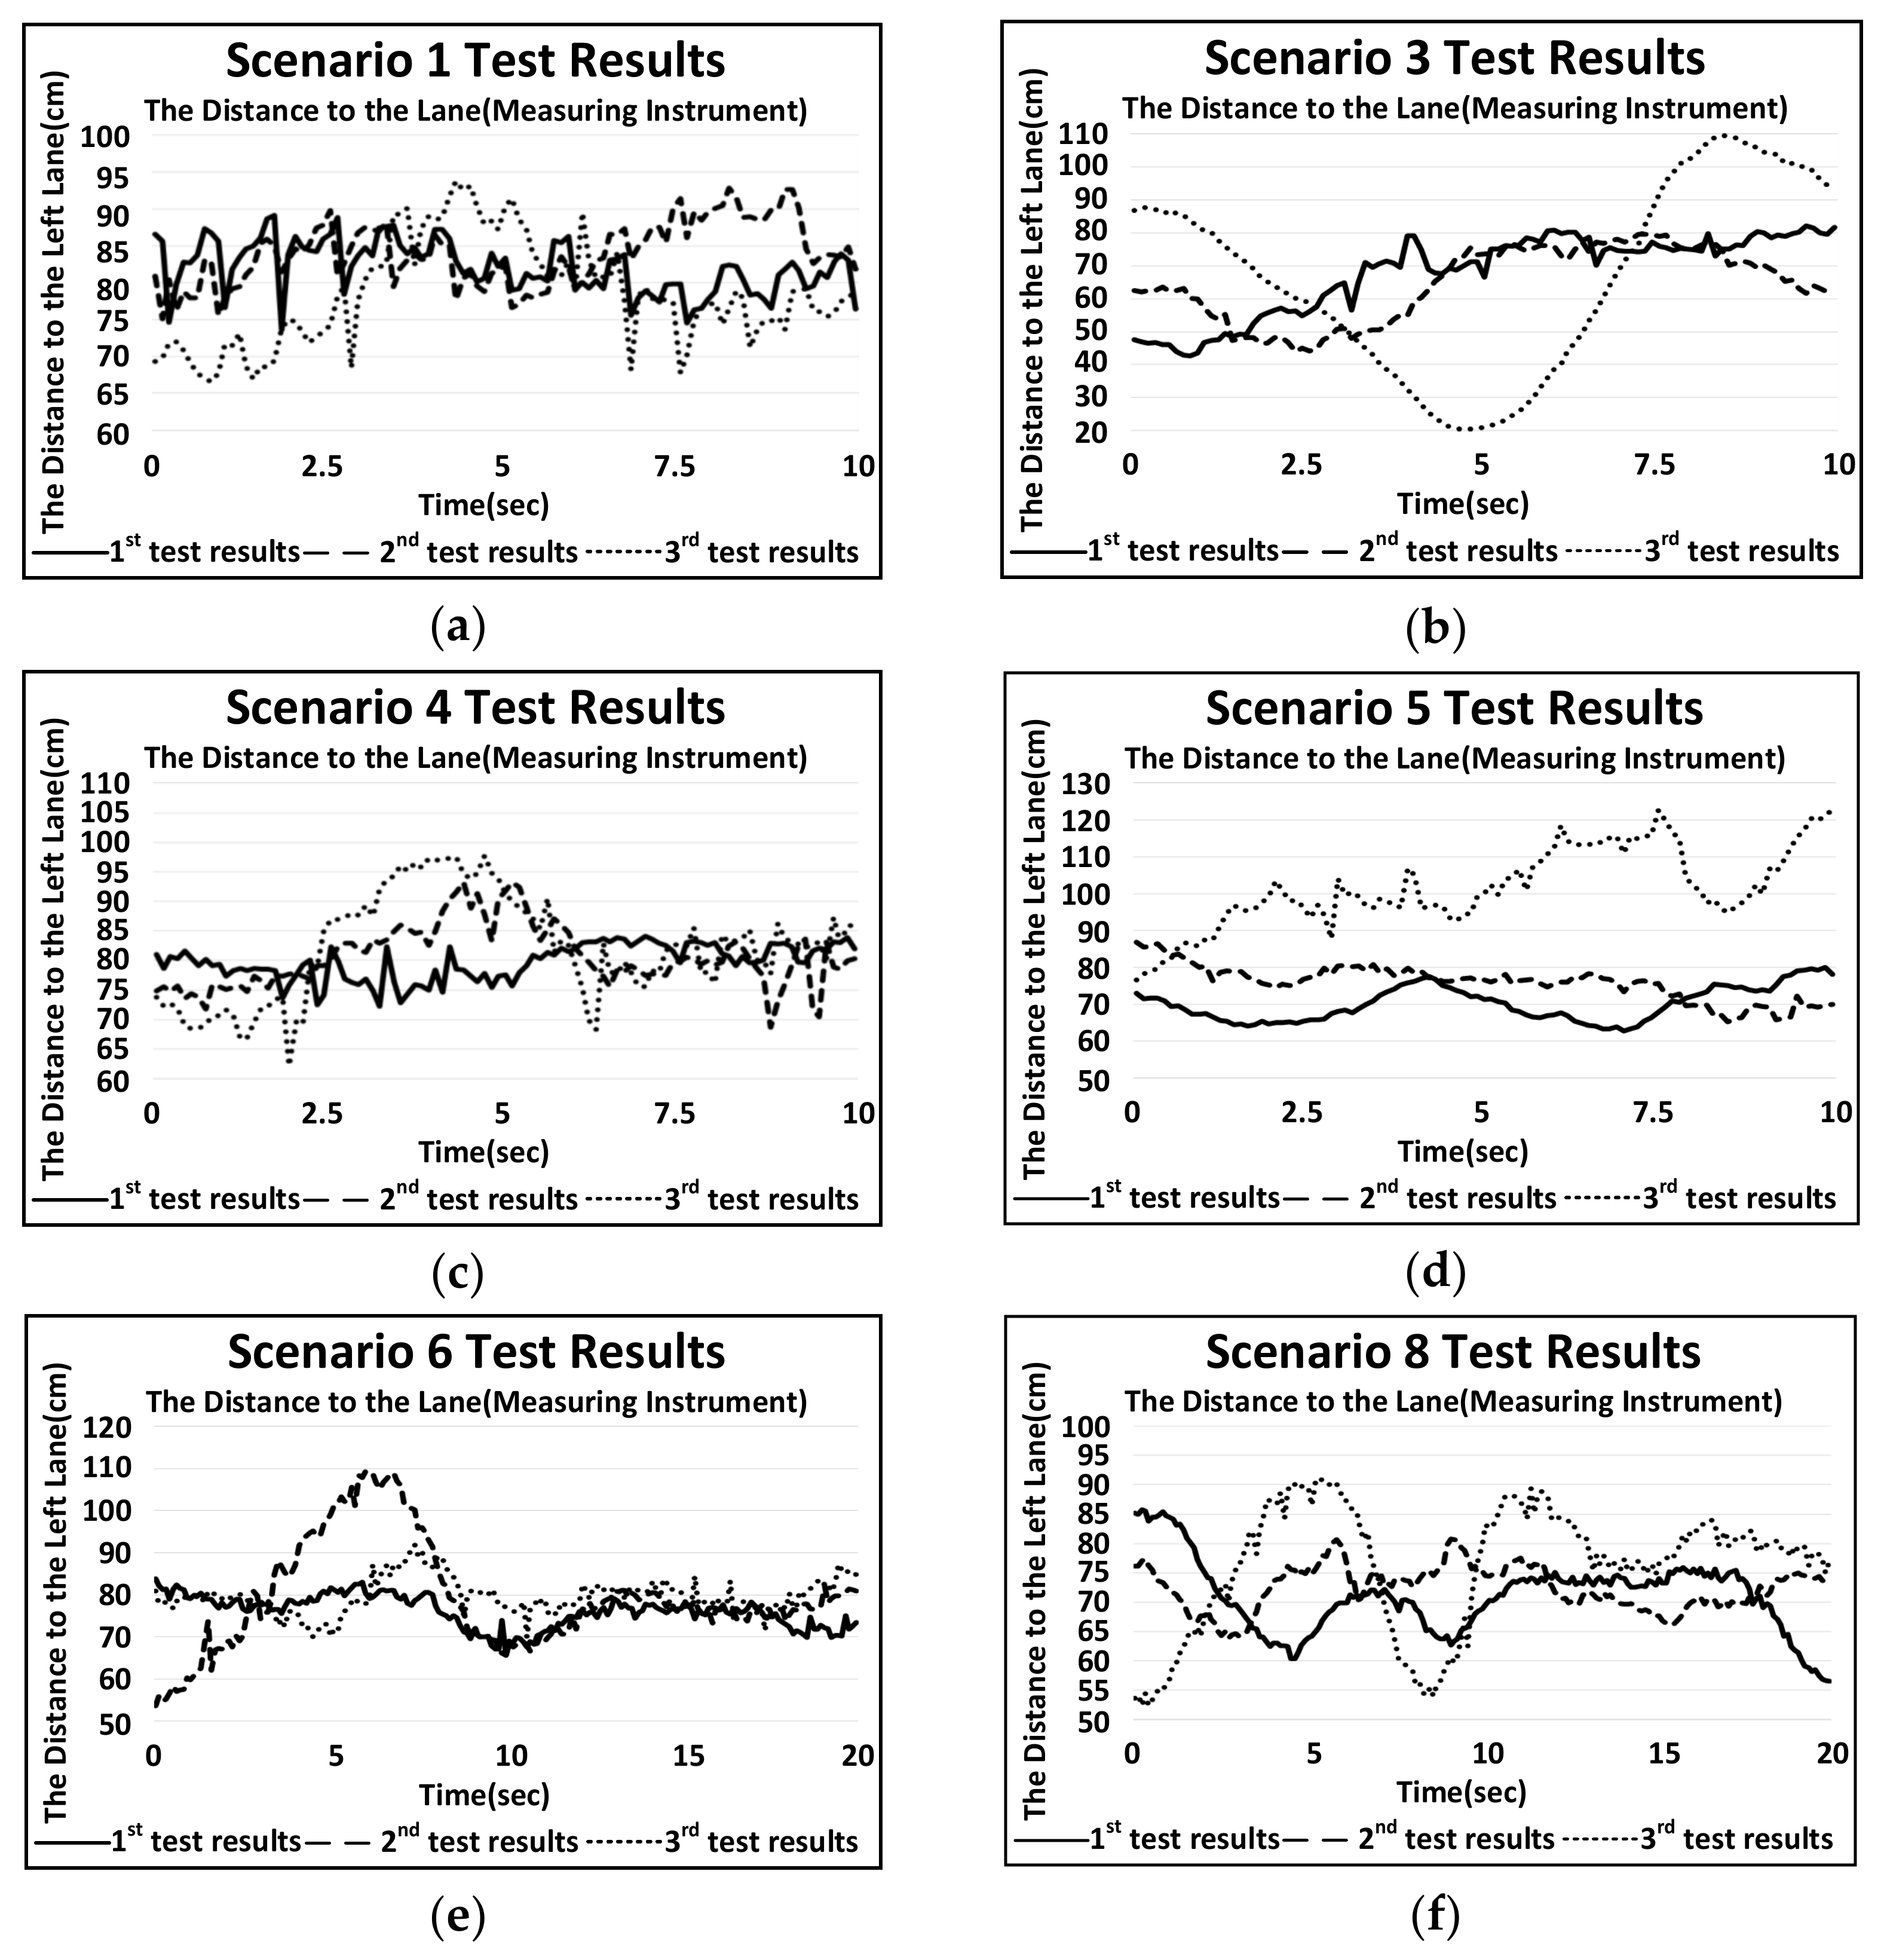
Figure 9 is the result of the relative distance selected from the section between Dongdaegu and the Gyeongsan tollgate along the Gyeongbu Expressway, and Figure 10 is the result of the distance to the lane. The relative distance and the distance to the lane showed the result of repeated tests three times for each scenario, and each result expressed only scenarios corresponding to successive scenarios.


Figure 9.
Test result (measuring instrument, vehicle-to-vehicle relative distance). (a) Scenario 6, (b) Scenario 8, (c) Scenario 9, (d) Scenario 10, (e) Scenario 11, (f) Scenario 12.

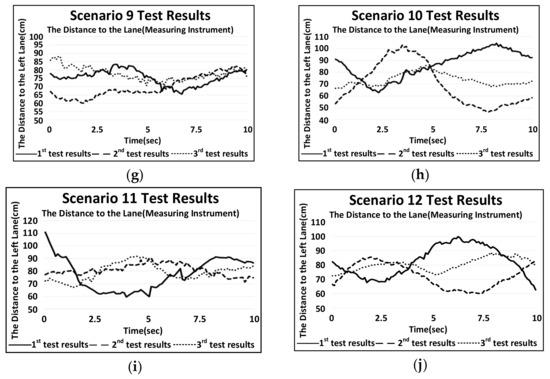
Figure 10.
Test result (measuring instrument, left lane distance). (a) Scenario 1, (b) Scenario 3, (c) Scenario 4, (d) Scenario 5, (e) Scenario 6, (f) Scenario 8, (g) Scenario 9, (h) Scenario 10, (i) Scenario 11, (j) Scenario 12.
Scenarios 2, 7, and 13 failed to conduct the test according to the non-implementation of functions according to HDA level 1 and the behavior of nearby vehicles.
4.2. Results of the Actual Vehicle Test Using Theoretical Formulas
Figure 11 is the result of the calculation based on the results measured through the measuring instruments. In the section corresponding to each scenario, the calculation was performed using the proposed relative distance formula to the lead vehicle.
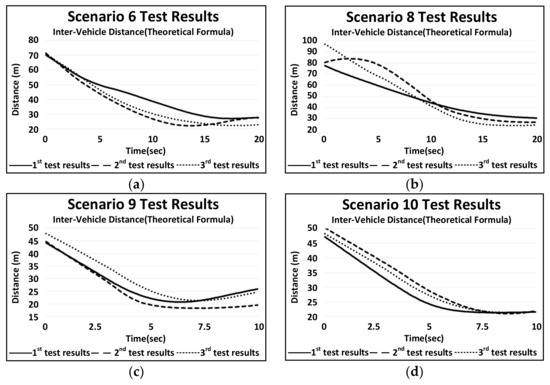
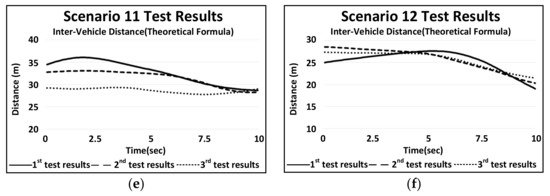
Figure 11.
Test result (theoretical formula, vehicle-to-vehicle relative distance). (a) Scenario 6, (b) Scenario 8, (c) Scenario 9, (d) Scenario 10, (e) Scenario 11, (f) Scenario 12.
4.3. Results of the Actual Vehicle Test Using Dual Cameras
To acquire an image corresponding to each scenario, a dual camera was mounted on a test vehicle, and a real road test was conducted. Figure 12 is a graph of the distance to the lane calculated by taking an image of the section corresponding to each scenario with a dual camera.
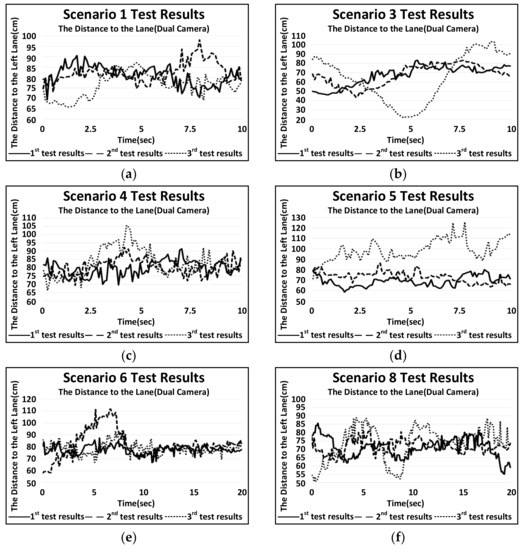
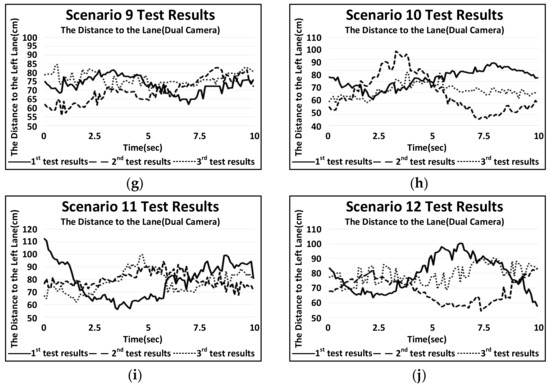
Figure 12.
Test result (dual camera, left lane distance). (a) Scenario 1, (b) Scenario 3, (c) Scenario 4, (d) Scenario 5, (e) Scenario 6, (f) Scenario 8, (g) Scenario 9, (h) Scenario 10, (i) Scenario 11, (j) Scenario 12.
4.4. Comparative Analysis of the Results of the Actual Vehicle Test
4.4.1. Comparative Analysis of Inter-Vehicle Distance Results
Table 10 shows the results of the relative distance of the same actual vehicle test for each scenario of HDA. The error rate by comparing the results of the theoretical formula with the results of the measuring instrument was calculated and organized.
Table 10.
Error rate comparison(relative distance, min, max, average).
As a result of analysis by scenario, most of the maximum errors were within 10%, and the average error rate was within 5%. In the second and third test cases of scenario 7, the maximum error rate between 10% and 12% occurred momentarily. As for the cause of the error, since the measuring instrument is fixed to the subject vehicle, it was determined that an error occurs due to the instantaneous vibration in the groove of the road surface for preventing speeding.
4.4.2. Comparative Analysis of the Results of the Distance to the Lane
Table 11 shows the results of the distance to the lane of the same actual vehicle test for each scenario of HDA. The error rate by comparing the results of the dual camera with the results of the measuring instrument was calculated and organized.
Table 11.
Error rate comparison (lane distance, min, max, average).
As a result of the analysis by scenario, the maximum errors were within 10%, and the average error rate was within 6%. It was determined that the representative cause of the maximum error occurred in the dual camera installed in the test vehicle. Problems such as road surface vibration, shaking due to air resistance, changes in ambient brightness, and the process of focusing the video occurred during driving. Accordingly, it was determined that the result of calculating the distance from the image of the part where the problem occurred to the preceding vehicle was incorrectly calculated.
5. Conclusions
In this paper, to verify the evaluation method of the HDA function using the theoretical formula and dual cameras, a formula capable of calculating the distance to the lead vehicle was proposed. The HDA scenario and dual camera installation location proposed in the preceding study were used. In addition, the HDA scenario-based test was conducted on the actual highway. Thus, the results of inter-vehicle distance using the theoretical formula and the results of the inter-vehicle distance using measuring instruments were compared and analyzed, and the results of the distance from the lane using dual cameras and the results of the distance from the lane using measuring instruments were compared and analyzed. The conclusions were drawn accordingly, and the conclusions are summarized as follows.
- (1)
- The formula proposed a new theoretical formula applicable to the safety evaluation of HDA. The proposed formula is a longitudinal theoretical formula capable of calculating the inter-vehicle distance, and a lateral theoretical formula capable of calculating the distance to the lane using a dual camera; the formula from previous studies was cited.
- (2)
- The actual vehicle test was conducted on the Dongdaegu TG–Gyeongsan TG section on the Gyeongbu Expressway of the Republic of Korea. To secure the objectivity of the test results, repeated tests were conducted three times with the same number of people, and same equipment and location (site). GENESIS G90 of company H** was used for the subject vehicle.
- (3)
- The HDA test and evaluation scenarios were selected according to the characteristics of each section of the highway and the results were analyzed. The analysis compared and evaluated the proposed longitudinal theoretical formula, the cited lateral theoretical formula, and the measured values of the measurement equipment by the actual vehicle test conducted on the highway.
- (4)
- The test results of the scenario were compared. As a result of the analysis of the lead vehicle and the relative distance by scenario, most of the maximum errors were within 10%, and the average error rate was within 5%. In the second and third test cases of scenario 7, the maximum error rate between 10% and 12% occurred momentarily. As a result of the analysis of the distance from the lane by scenario, the maximum errors were within 10%, and the average error rate was within 6%.
- (5)
- Compared with the precision measuring instrument through actual difference testing, the proposed theoretical formula showed that the longitudinal error rate was at least 0.005% and the maximum was 9.798%, and the lateral error rate was at least 0.007% and the maximum was 9.997%. Using the proposed theoretical formula, safety trends can be identified before development when studying an HDA system and reliability can be predicted in an environment where the actual test of the system is impossible.
Currently, HDA applied to mass-produced vehicles is implemented based on sensors such as radar and cameras. Due to expensive sensors such as radars and riders, there is a disadvantage of the high cost burden. However, based on the above results, it was judged that the proposed theoretical formula and dual camera alone could derive the results of the HDA test. In the development stage of ADAS such as HDA, it is judged that only theoretical formula and dual cameras might reduce the cost burden due to the derivation of test results.
In the future, it is necessary to evaluate the safety in bad weather conditions and night conditions.
Author Contributions
Conceptualization: S.-B.L., methodology: S.-B.L., actual test: B.-J.K. and S.-B.L., data analysis: B.-J.K. and S.-B.L., investigation: B.-J.K., writing-original draft preparation: B.-J.K. and S.-B.L., writing-review and editing: B.-J.K. and S.-B.L. All authors have read and agreed to the published version of the manuscript.
Funding
This work was supported by the Technology Innovation Program (10079967, Technical development of demonstration for evaluation of autonomous vehicle system) funded by the Ministry of Trade, Industry & Energy (MOTIE, Korea).
Institutional Review Board Statement
Not applicable.
Informed Consent Statement
Not applicable.
Data Availability Statement
All data is included in the article.
Acknowledgments
This work was supported by the Technology Innovation Program (10079967, Technical development of demonstration for evaluation of autonomous vehicle system) funded by the Ministry of Trade, Industry & Energy (MOTIE, Korea).
Conflicts of Interest
The authors declare no conflict of interest.
References
- Marsden, G.; McDonald, M.; Brackstone, M. Towards an understanding of adaptive cruise control. Transp. Res. Part C Emerg. Technol. 2001, 9, 33–51. [Google Scholar] [CrossRef]
- Kim, S.; Tomizuka, M.; Cheng, K. Smooth motion control of the adaptive cruise control system by a virtual lead vehicle. Int. J. Automot. Technol. 2012, 13, 77–85. [Google Scholar] [CrossRef]
- Kim, N.; Lee, J.; Soh, M.; Kwon, J.; Hong, T.; Park, K. Improvement of Longitudinal Safety System’s Performance on Near Cut-In Situation by Using the V2V. Korean Soc. Automot. Eng. 2013, 747–755. [Google Scholar]
- Moon, C.; Lee, Y.; Jeong, C.; Choi, S. Investigation of objective parameters for acceptance evaluation of automatic lane change system. Int. J. Automot. Technol. 2018, 19, 179–190. [Google Scholar] [CrossRef]
- Ulbrich, S.; Maurer, M. Towards Tactical Lane Change Behavior Planning for Automated Vehicles. In Proceedings of the 2015 IEEE 18th International Conference on Intelligent Transportation Systems, Gran Canaria, Spain, 15–18 September 2015; pp. 989–995. [Google Scholar] [CrossRef] [Green Version]
- Butakov, V.; Ioannou, P. Personalized Driver/Vehicle Lane Change Models for ADAS. IEEE Trans. Veh. Technol. 2015, 64, 4422–4431. [Google Scholar] [CrossRef]
- SAE International, SAE J3016: Levels of Driving Automation. Available online: https://www.sae.org/news/2019/01/sae-updates-j3016-automated-driving-graphic (accessed on 1 October 2021).
- Bae, G.H.; Kim, B.J.; Lee, S.B. A study on evaluation method of the HDA test in domestic road environment. J. Auto-Veh. Saf. Assoc. 2019, 11, 39–49. [Google Scholar]
- Bae, G.H.; Lee, S.B. A Study on the Evaluation Method of Highway Driving Assist System Using Monocular Camera. Appl. Sci. 2020, 10, 6443. [Google Scholar] [CrossRef]
- Kim, B.J.; Lee, S.B. A Study on Evaluation Method of the Adaptive Cruise Control. J. Drive Control 2017, 14, 8–17. [Google Scholar]
- Kim, B.J.; Lee, S.B. A Study on Evaluation Method of ACC Test Considering Domestic Road Environment. J. Korean Auto-Veh. Saf. Assoc. 2017, 9, 38–47. [Google Scholar]
- Bae, G.H.; Lee, S.B. A Study on the Test Evaluation Method of LKAS Using a Monocular Camera. J. Auto-Veh. Saf. Assoc. 2020, 12, 34–42. [Google Scholar] [CrossRef]
- Hwang, J.; Huh, K.; Na, H.; Jung, H.; Kang, H.; Yoon, P. Evaluation of Lane Keeping Assistance Controllers in HIL Simulations. In Proceedings of the 17th IFAC World Congress, Seoul, Korea, 6–11 July 2008. [Google Scholar] [CrossRef] [Green Version]
- Lee, K.; Li, S.E.; Kum, D. Synthesis of Robust Lane Keeping Systems: Impact of Controller and Design Parameters on System Performance. IEEE Trans. Intell. Transp. Syst. 2019, 20, 3129–3141. [Google Scholar] [CrossRef]
- Bae, G.H.; Lee, S.B. A Study on Calculation Method of Distance with Forward Vehicle Using Single-Camera. Proc. Symp. Korean Inst. Commun. Inf. Sci. 2019, 256–257. [Google Scholar]
- Lee, S.H.; Kim, B.J.; Lee, S.B. Study on Image Correction and Optimization of Mounting Positions of Dual Cameras for Vehicle Test. Energies 2021, 14, 2857. [Google Scholar] [CrossRef]
- Kalaki, A.S.; Safabakhsh, R. Current and adjacent lanes detection for an autonomous vehicle to facilitate obstacle avoidance using a monocular camera. In Proceedings of the 2014 Iranian Conference on Intelligent Systems (ICIS), Bam, Iran, 4–6 February 2014. [Google Scholar]
- Jiangwei, C.; Lisheng, J.; Lie, G.; Rongben, W. Study on method of detecting preceding vehicle based on monocular camera. In Proceedings of the 2004 IEEE Intelligent Vehicles Symposium, Parma, Italy, 14–17 June 2004. [Google Scholar]
- Ravi, K.S.; Eshed, O.B.; Jinhee, L.; Hohyon, S.; Mohan, M.T. On-road vehicle detection with monocular camera for embedded realization: Robust algorithms and evaluations. In Proceedings of the 2014 International SoC Design Conference (ISOCC), Jeju, Korea, 3–6 November 2014. [Google Scholar]
- Shu, Y.; Tan, Z. Vision based lane detection in autonomous vehicle. In Proceedings of the Fifth World Congress on Intelligent Control and Automation, Hangzhou, China, 15–19 June 2004. [Google Scholar]
- Koo, S.M. Forward Collision Warning (FCW) System with Single Camera using Deep Learning and OBD-2. Master’s Thesis, Dankook University, Seoul, Korea, 2018. [Google Scholar]
- Zhao, X.; Sun, P.; Xu, Z.; Min, H.; Yu, H.K. Fusion of 3D LIDAR and Camera Data for Object Detection in Autonomous Vehicle Applications. IEEE Sens. J. 2020, 20, 4901–4913. [Google Scholar] [CrossRef] [Green Version]
- Yamaguti, N.; OE, S.; Terada, K. A method of distance measurement by using monocular camera. In Proceedings of the 36th SICE Annual Conference. International Session Papers, Tokushima, Japan, 29–31 July 1997. [Google Scholar]
- Song, Y.H. Real-time Vehicle Path Prediction based on Deep Learning Using Monocular Camera. Master’s Thesis, Hanyang University, Seoul, Korea, 2020. [Google Scholar]
- Heo, S.M. Distance and Speed Measurements of Moving Object Using Difference Image in Stereo Vision System. Master’s Thesis, Kwangwoon University, Seoul, Korea, 2002. [Google Scholar]
- Abduladhem, A.A.; Hussein, A.H. Distance estimation and vehicle position detection based on monocular camera. In Proceedings of the 2016 AI-Sadeq International Conference on Multidisciplinary in IT and Communication Science and Applications, Baghdad, Iraq, 9–10 May 2016. [Google Scholar]
- Korea Legislation Research Institute all rights Reserved, Road Act. Article 47 (Rules on Structure and Facilities Standards of Roads). Available online: http://www.law.go.kr/lsInfoP.do?lsiSeq=215507&efYd=20200306#0000 (accessed on 1 October 2021).


Publisher’s Note: MDPI stays neutral with regard to jurisdictional claims in published maps and institutional affiliations. |
© 2021 by the authors. Licensee MDPI, Basel, Switzerland. This article is an open access article distributed under the terms and conditions of the Creative Commons Attribution (CC BY) license (https://creativecommons.org/licenses/by/4.0/).