1. Introduction
Diabetic retinopathy (DR) is a disease that affects the blood vessels present in the retina, which is damaged due to multiple alterations by a set of metabolic disorders [
1]. The blood vessels present damage in their capillaries due to the loss of pericytes, which are contractile cells that wrap capillary endothelial cells in the body’s venules. Excess glucose molecules cause this damage in the blood, which clump together in the vessels disrupting circulation, a process known as ischemia. These blood vessels’ deterioration produces microaneurysms, which is a saccular enlargement of the venous end of a retinal capillary by the lack of blood circulation. This process leads the vessels to lose their impermeability properties, resulting in leaks, such as hemorrhages or lipid sweating [
2].
From ischemia, two major problems occur in the retina [
3]. The first problem is Vascular Endothelial Growth Factor (VEGF) cytokine protein production, which generates new blood vessels from existing ones, known as neovessels. The problem with this protein lies in the growth of the retina’s surface and vitreous humor’s surface. Since there is no blood circulation, these areas will only grow until they burst, producing bleeding in the vitreous cavity or pulling the retina apart. That tissue expansion results only in the patient’s blindness. The second problem is plasma leakage. Due to lipid sweating, a fat accumulation begins to occur, altering the macula and leading to vision loss.
Diabetic retinopathy can be classified from the earliest to the most advanced stages once examined the retina’s fundus condition. The disease presents two main categories: Non-Proliferative Diabetic Retinopathy (NPDR) and Proliferative Diabetic Retinopathy (PDR) [
4]. Moreover, NPDR presents three subcategories as slight, medium, and severe. The damage of this first category is limited and does not go beyond the retina’s inner limiting membrane. DR is proliferative when the ischemia damages result in blood vessels growing beyond the retina. PDR contains early, high-risk, and advanced sublevels. DR is developed when a patient has diabetes for at least 10 years without diagnosis and unaware of it. In this regard, the DR can be prevented if it is detected early enough by health check-ups and systematic treatment of diabetes [
5].
Digital retina fundus images were used with computer vision technique [
6,
7] to automatically detect DR in different stages, and more recently, by using deep learning image processing method [
8]. Deep learning (DL) is a proven methodology that automatically extracts features from images processed by a layer stack of a convolutional neural network [
9]. These features can determine what is present in the image, and therefore it is useful for classification purposes. DL models showed a higher capability in recognizing objects than the human eye [
10]. However, this methodology still requires considerable data and computational resources to optimize the model’s parameters.
In this work, we proposed a DL model to classify retina fundus images and detect the presence of DR in its different stages. The model was optimized using transfer-learning from DenseNet121 [
11] to differentiate between a healthy eyeball and a proliferated one. Our proposal was tested over two datasets using a cross-testing method checking the complexity to acquire features from each. The model achieved better validation and testing results trained over APTOS dataset with an accuracy of 81% and 59% for each phase in predicting diabetic retinopathy presence in fundus oculi images.
2. Related Works
The earliest digital retina fundus images were classified using hand-engineering extracted features with empirical obtained parameters. One of these works was presented by Cree et al. [
12]. The authors have proven that computer vision techniques were suitable to automatically detect microaneurysm. Their experiments relied on simplistic morphological and thresholding techniques using eight features among pixel area and total pixel intensity, measured on each candidate. The proposed method achieved results comparable to those obtained by clinicians, proving that automated microaneurysm detection can be used for diagnostic purposes.
In more recent works, the methods were evolved to detect not only microaneurysm in the fundus images, but also the stage of diabetic retinopathy. Yun et al. [
7] proposed a method to classify the retina fundus images as normal, moderate, severe, and proliferative DR. The input images were preprocessed using morphological operations with disc and diamond structuring elements. After that, six features were obtained considering the perimeter and area of the pixels in the RGB channels. For classification, a single-layer feed-forward neural network with 8 units in the hidden layer was used. As input, 6 units were used for each feature value mentioned above and 4 units as output, one for each severity of DR. Nayak et al. [
6] proposed a method implementing an image preprocessing with adaptive histogram equalization to be further processed by morphological operations and texture analysis to extract features about blood vessels. A multilayer perceptron processed the extracted features. The architecture consisted of 4 inputs considering the blood vessel area and perimeter, the exudate area, and texture. Inputs were processed by 2 hidden layers with 8 units each before the exit with 2 units to classify the for the normal retina represented by ‘01’, the nonproliferative DR represented by ‘10’, and the proliferative DR represented by ‘11’. Rosas et al. [
13] proposed the recognition of a microaneurysm, using computer vision techniques to preprocess the image. Firstly, the nonuniform illumination was reduced, and the grayscale intensities were normalized to obtain two features. The first features used principal component analysis to discriminate the round-shaped candidates’ region, and the second one used radon features to count the number set of discrete angle values. Those features were then passed to a hierarchical system of classifiers composed of two perceptron units to learn the threshold required to determine if there is a microaneurysm or not in the region.
Hand-crafted extracted features require specialized knowledge and empirical results to achieve accurate microaneurysm detection in digital images. In this regard, recent image processing advances were automated the feature acquisition stage from raw images to useful information using convolutional neural networks [
14,
15]. Many classification tasks use deep learning methods with a large stack of convolutional layers to acquire features from the network’s input. One first approach was presented by Gargeya et al. [
16], where the authors automate the DR screening. The validation results obtained an AUC of 0.95 in the Messidor dataset using a 5-fold cross-validation technique. Another work proposed by Dutta et al. [
17], presented a multilayer perceptron outperforming a convolutional neural network with 83.6%, using extracted statistical features such as average, median, standard deviation, maximum, and minimum. A computer-aided DR diagnosis system was proposed by Mansour [
18] processing the image with background subtraction to further be processed by the AlexNet model and obtain features. These features are then processed by a super vector machine (SVM) algorithm using a 10-fold cross-validation technique. The results showed that the use of feature reduction before SVM processing improves the results reaching a 97.93% of validation accuracy. Qummar et al. [
19] proposed an ensemble approach of 5 deep learning models, which performed well with unbalanced data, achieving 70% of validation accuracy. One recent approach was presented by Gadekallu et al. [
8], who presented a deep learning model optimized by intelligent computing and the use of PCA, achieving an accuracy of 96%. Another work by Majumder et al. [
20] proposed a real-time algorithm to be used in smartphones with an accuracy of 87.4%, focusing on a lightweight and efficient model.
From the before mentioned approaches was encountered the difficulty in differentiating the recognition between 4 DR stages. This challenge becomes visible after some works compare their proposals as binary classification between a healthy and unhealthy eye. Additionally, the lack of test datasets to prove the specificity of the model prepared by qualified personnel, as proposed in [
21].
2.1. Deep Learning
Deep learning (DL) [
9] enables computational models composed of multiple processing layers to learn data representations in multiple abstraction levels. These methods dramatically improved state-of-the-art speech recognition, pattern recognition, object detection, and many other domains [
22,
23]. DL uncovers intricate pattern structure in large datasets using the backpropagation algorithm to indicate how a model should update its internal parameters to compute each layer’s representation from the previous layer’s representation. One challenge using DL models is the huge amount of data required to optimize the model. Different approaches address this issue through transfer-learning [
24,
25], avoiding the need for huge datasets. Transfer-learning [
26] allows the optimization of previously settled model parameters over a new data distribution domain. This previous knowledge reduces the training time required to update the model’s parameters in a related task under a new dataset domain. It is common for a model trained under a highly complex features dataset such as ImageNet [
27] to be used for transfer-learning, given the most variated optimized kernels. This methodology also improves the model’s accuracy in many other kind of tasks.
2.2. Diabetic Retinopathy
Depending on the stage of diabetic retinopathy, it can be classified into different classes, from the earliest to the most advanced. This classification depends on the condition of the retina in its fundus oculi evaluation, divided into two main categories, Nonproliferative Diabetic Retinopathy (NPDR) and Proliferative Diabetic Retinopathy (PDR) [
15].
NPDR is subdivided into slight, medium, and severe, and the changes it produces are limited to the retina and do not go beyond the inner retinal limiting membrane. PDR can be subdivided into early, high-risk, and advanced, with ophthalmoscopic alterations produced by ischemia, result in blood vessels neoformation, which proliferate beyond the retina. For this work, PDR is used as a single class containing the early, high-risk, and advanced subtypes.
No DR: patient without retinal alterations due to diabetes.
Slight NPDR: in this case, microaneurysms, exudates, cotton-wool spots, and retinal hemorrhages are considered.
Medium NPDR: the fundus oculi present hemorrhages, severe microaneurysms, or venous rosaries in some retina quadrants.
Severe NPDR: two of three criteria from the medium NPDR exist in the fundus oculi.
Proliferative DR: proliferative retinal neovessels appear in the retina’s image.
3. Fundus Oculi Proposed Classification
A methodology capable of processing retinal fundus images for early detection of diabetic retinopathy and its degree, if present, is proposed. For this purpose, a deep learning model with transfer learning is used to analyze different images that are previously prepared, obtaining an inference of how likely is the existence of diabetic retinopathy among 5 different classes defined as No NPDR, Slight NPDR, Medium NPDR, Severe NDPR, and Proliferative DR.
3.1. CNN Architecture
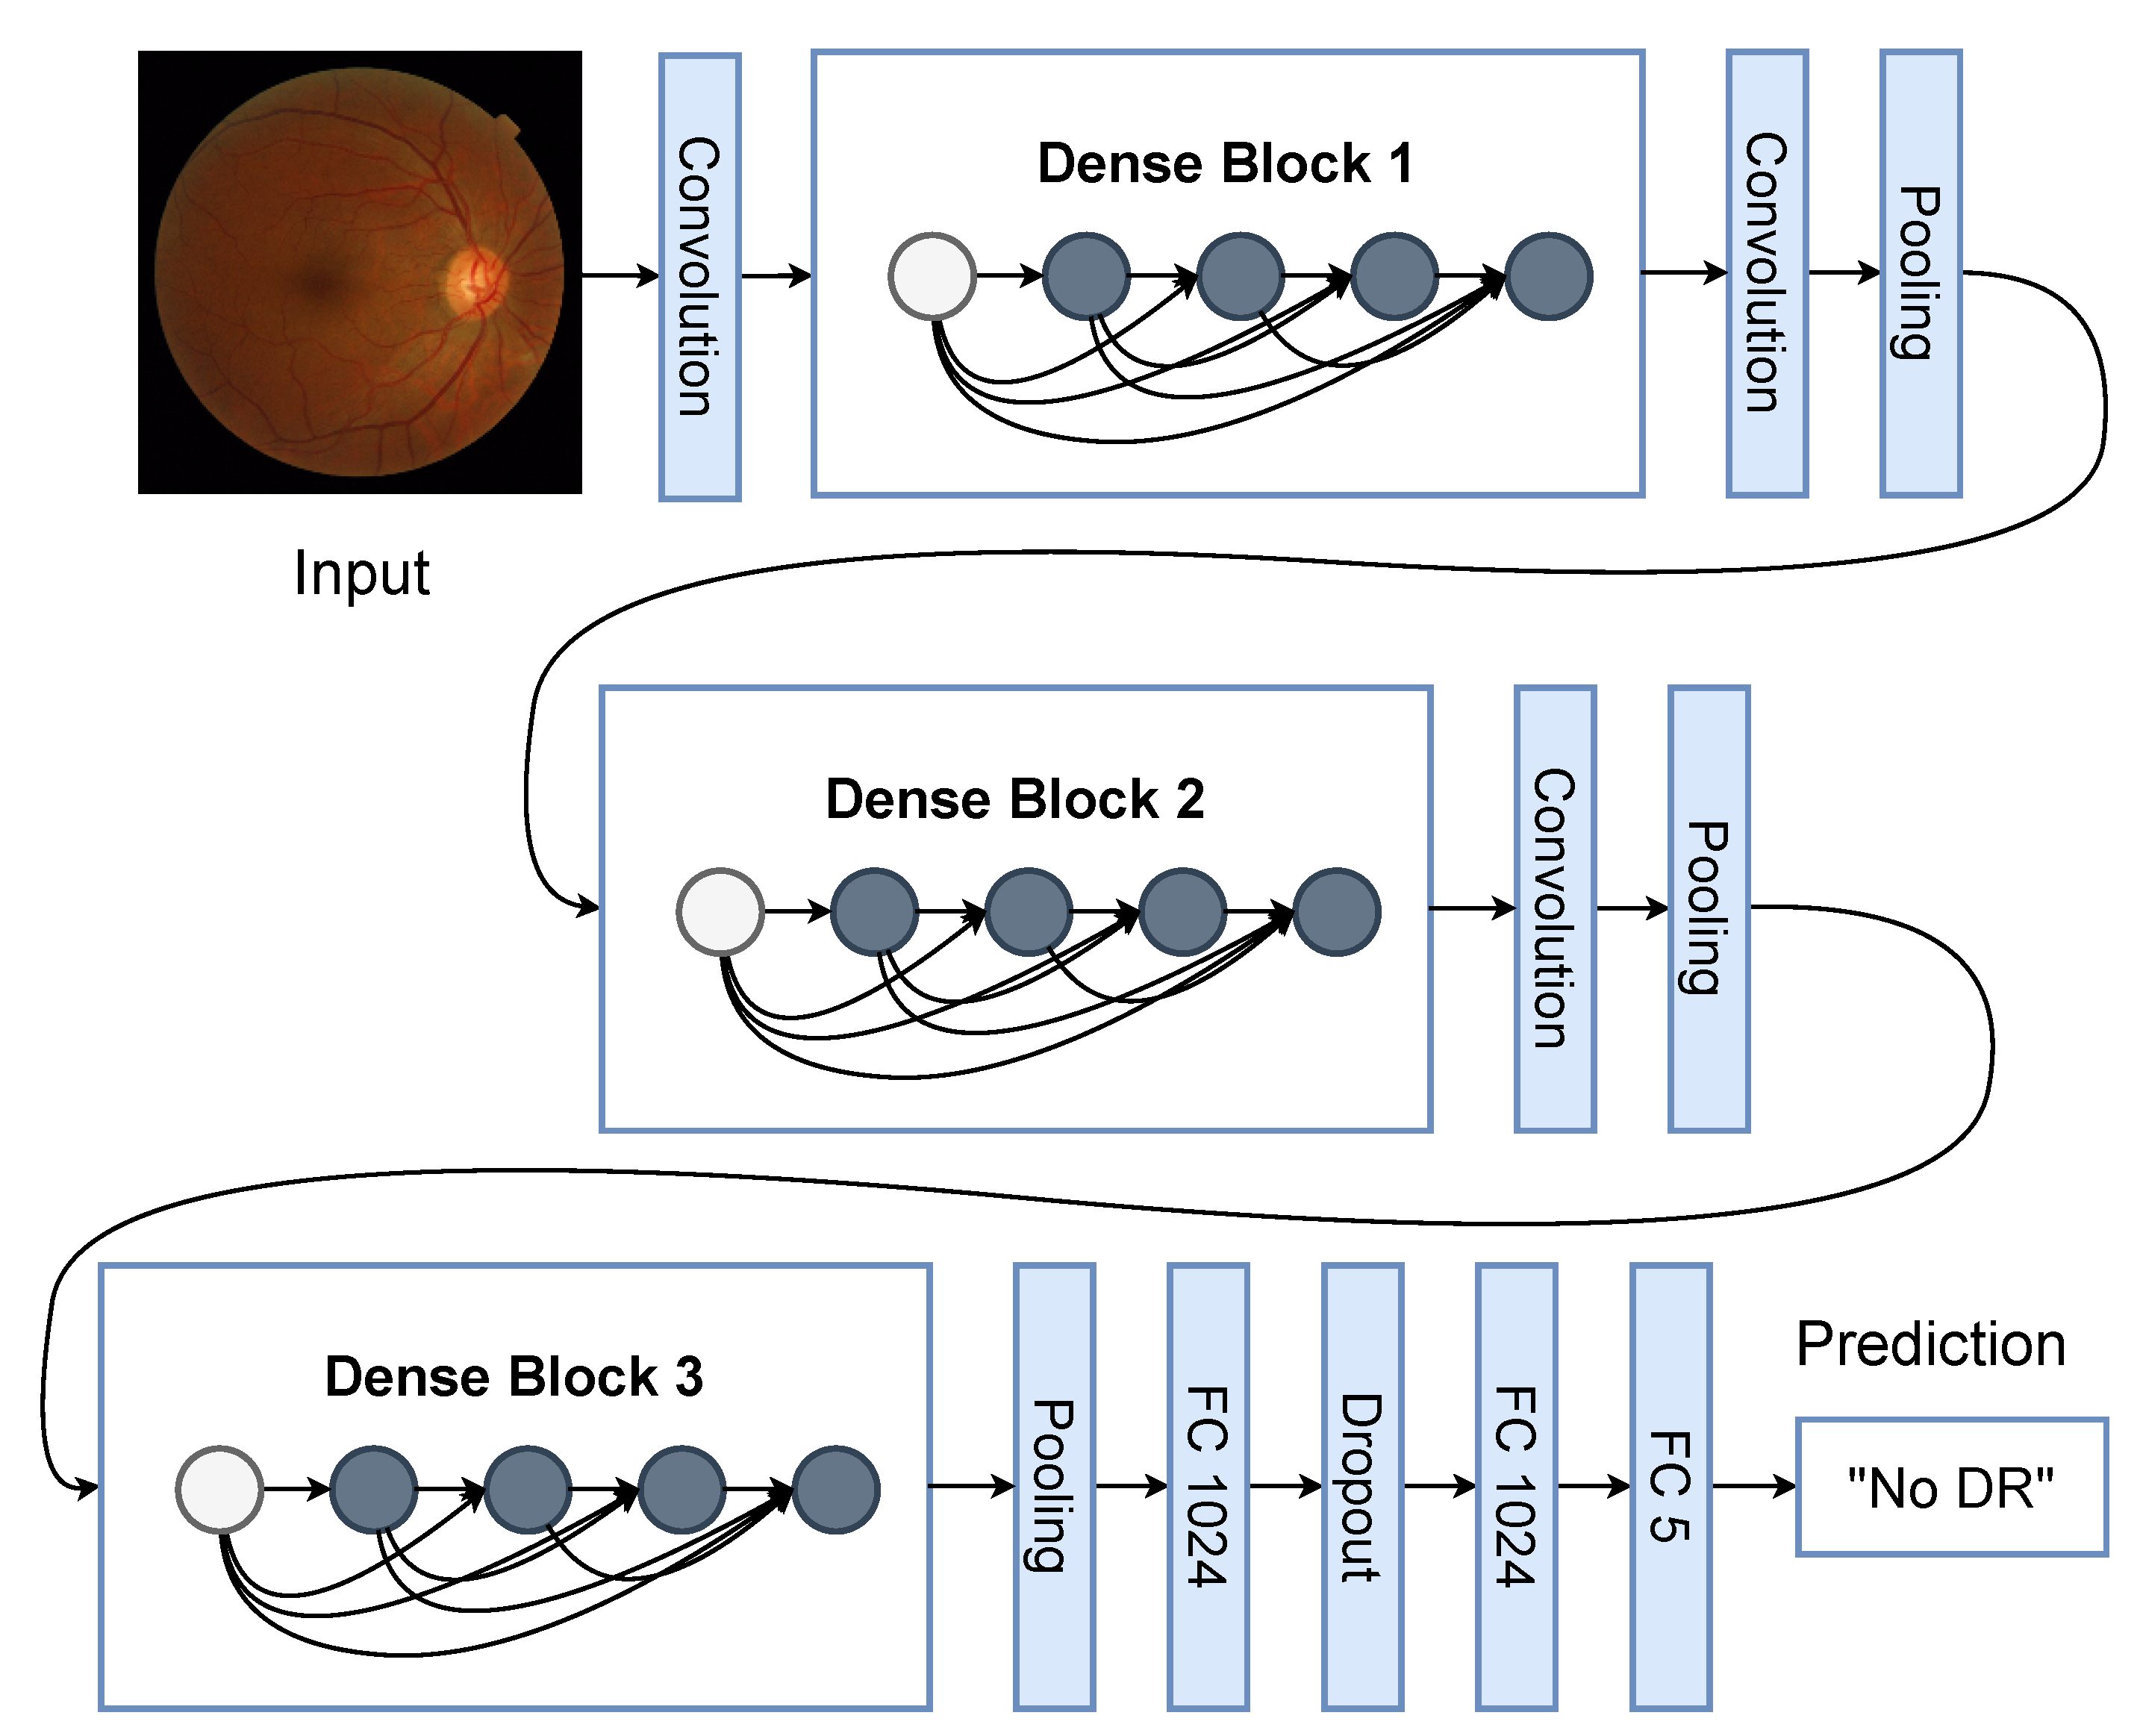
The proposed model is based on the DenseNet121 architecture [
11] that receives an RGB image of 224 × 224 pixels. The weights were previously trained with the ImageNet dataset and used to obtain sufficient features to optimize the weights of the fully connected layer as output. The convolutional layers are also known as the feature extraction stage and the last layer as the classification stage. The model output presents a softmax activation to designate probabilities to each class. A special feature of DenseNet, is that each output of a convolutional layer is concatenated to the subsequent layers of the same block as shown in
Figure 1.
When the convolutional layers process the image, the features obtained are passed to the classification stage. Two fully connected layers are part of the classifier. Its first layer consists of 1024 units with a ReLU activation, followed by a dropout layer with a probability of 50% and another layer with 1024 units and ReLU activation. The last layer present 5 units with a softmax activation.
3.2. Retina Images Dataset
For this work, two datasets were used as a cross-testing approach to check the model’s ability to acquire complex features for the different classes mentioned in
Section 2.2 and the advantages of each dataset. The first dataset is APTOS, publicly available in the Kaggle platform (
https://www.kaggle.com/c/aptos2019-blindness-detection/data, accessed on 12 Novovember 2020), containing 3662 labeled images for training and 1928 unlabeled images for testing purposes. The second dataset is available by registering on the site that manages the Messidor dataset (
https://www.adcis.net/en/third-party/messidor2/, accessed on 12 February 2021), containing 1744 unlabeled images for training.
The Messidor dataset [
28] comprises 872 DR examination images of two macula-centered eye fundus images from both left and right eyes. The ground truth information for the images was from a third-party source. All the images present the same format of the fundus oculi; in the center of a wide image, the eyes are presented with a black background. The APTOS dataset was published as a competition under the same platform, with fundus oculi images taken under different conditions and sizes. For this case, the dataset authors provide the ground truth data only for the training subset, hence, we do not use the testing subset. Both datasets are high-resolution images and with an unbalanced number of images for each of the 5 classes. More details about classes distribution are in
Table 1. As preprocessing, all the images in both datasets were cropped square from the center, leaving just the most important part of the image, the retina’s fundus. Additionally, they were resized to 224 × 224 pixels, defined to fit the pretrained DenseNet model’s input, including the preprocessing method as proposed in their original work [
11].
4. Experimental Results
The training of our proposal was optimized using the Adam algorithm with a learning rate of with the categorical cross-entropy loss function. In addition, all the model parameters were updated during 50 epochs using the early stop method to prevent overfitting. Both datasets were used for training, validation, and testing purpose implemented as cross-testing. Hence, if the APTOS dataset is used to optimize the model, 80% is used for training and 20% for validation, leaving the Messidor dataset for testing. Equivalently, if Messidor is used to optimize the model, the same proportion is used for training and validation, leaving the APTOS dataset for testing.
To compare the results between each dataset used for training, the accuracy, precision, recall, f1-score, the receiver operating characteristic (ROC) curve, and the area under the ROC curve are used.
Table 2 and
Table 3 present the metrics for validation and testing results, respectively. In both Tables, DS means dataset, and in
Table 3 only, the APTOSMess and MessAPTOS are the testing metrics for the Messidor dataset with the model trained over APTOS and vice versa, respectively.
The model presents a higher accuracy trained with the APTOS dataset than Messidor in the validation subset with 81% and 64%, respectively. Considering the cross-testing, the model trained over APTOS reached a 59% accuracy recognizing the classes in the Messidor dataset, being better than the training over Messidor with 33% of testing accuracy in the APTOS dataset. Observing the metrics during validation, the model learns a better precision, recall, and F1-score from the APTOS than Messidor datasets for all the classes. However, the Severe NPDR class presented better results from Messidor, and the PDR label classification was not learned from the Messidor dataset.
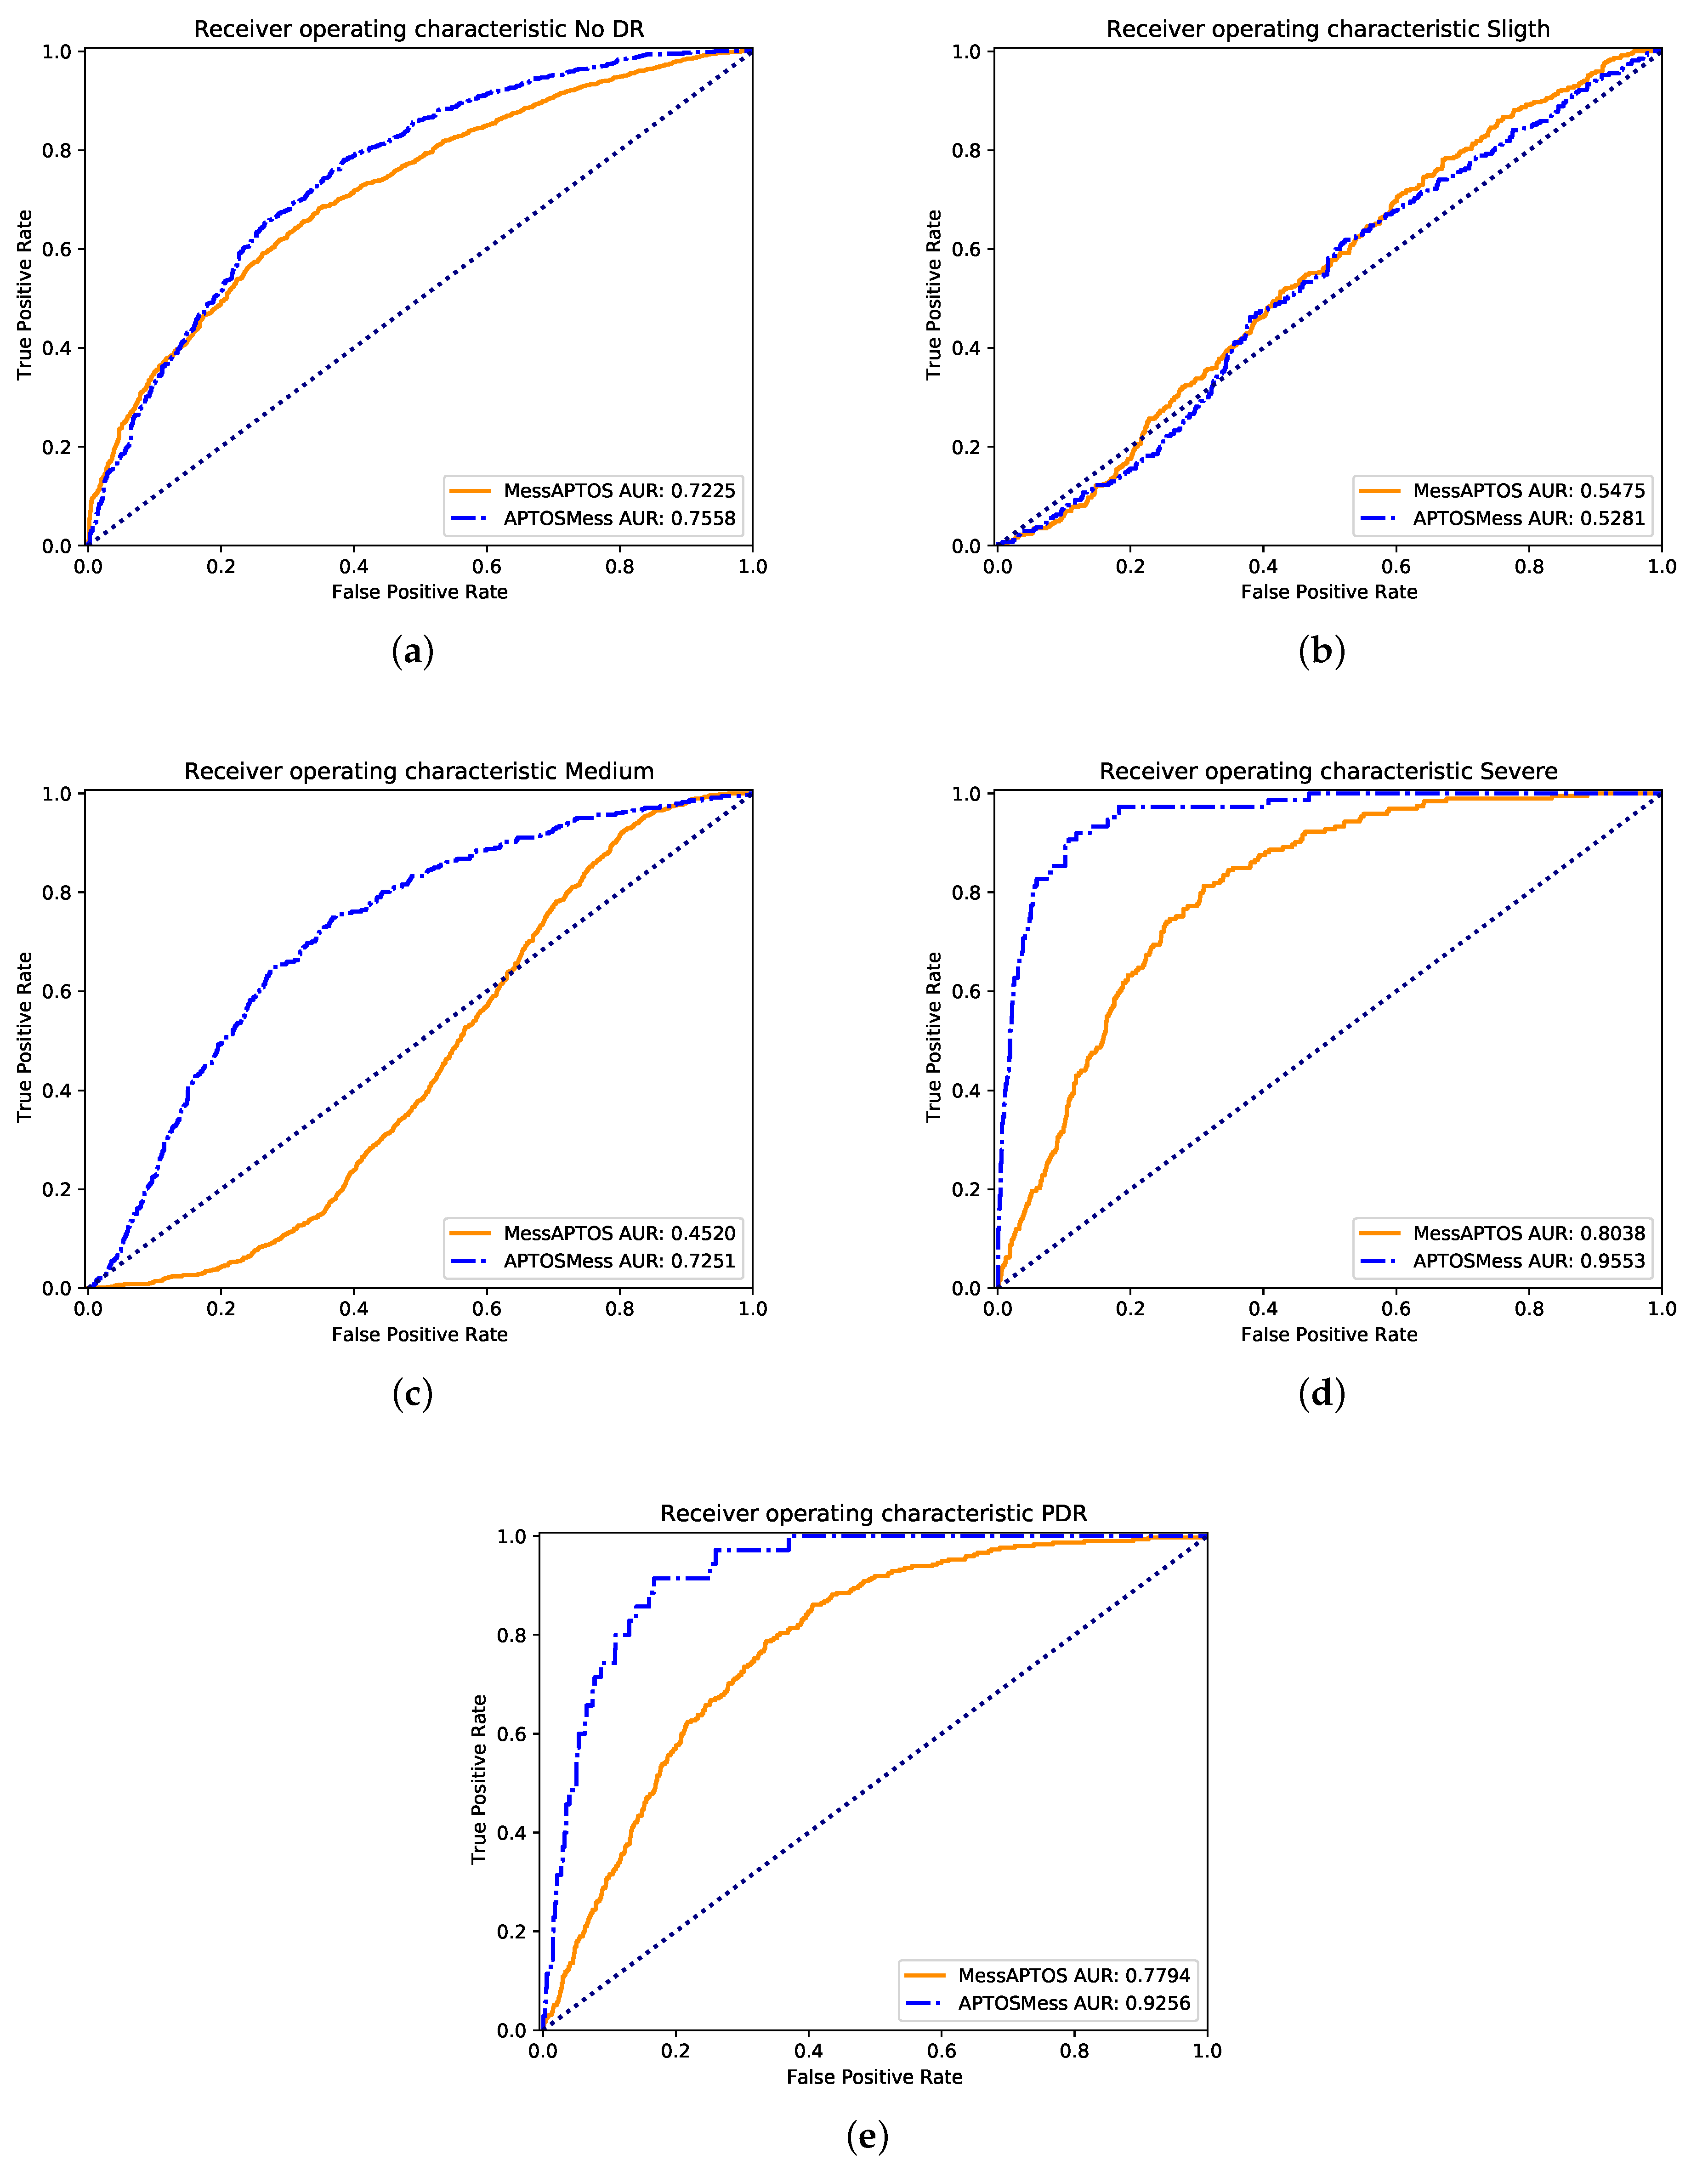
In terms of testing results, the obtained metrics show that the model reaches a better precision trained over Messidor. Nevertheless, a better recall and F1-score is obtained for the model trained over APTOS. From the
Figure 2 with the ROC curves, it can be appreciated that the model trained over APTOS learned more useful features for most of the classes than the trained over the Messidor dataset. The most difficult class was the Slight NPDR because the area under the ROC curve was almost the same for both datasets.
A special issue in this classification task is the lack of a standardized benchmark dataset, establishing baseline results that must be used as a reference for new proposals. The Messidor dataset was previously used and presents a challenging data distribution, making it suitable as a benchmark dataset. In counterpart, the APTOS dataset presents a more variate data distribution suitable to optimize the model’s parameters. Considering the images from
Figure 3 and the values in
Table 3, the standardized images from the Messidor dataset expose better features for each different 4 DR-related outputs. However, the data distribution from Messidor is not enough to generalize in different image representations.
Discussion
A baseline comparison was obtained using the work presented by Gadekallu et al. [
8], where the model proposed presents a single output for a healthy or DR-affected eye. We mixed the 4 DR-related outputs into one unit to perform a suitable comparison with the baseline. The validation results were presented as a base metrics comparison because the authors do not specify the test dataset used to obtain the metrics in the previously mentioned work. In this regard was assumed that the presented values correspond to the validation subset, which comprises 20% of the first Messidor dataset version. Nevertheless, the models can not be compared directly due to data differences and lack of information about the label selected of the detailed metrics. The testing accuracy achieved by the model was 61% on both datasets, and the benchmark metrics are presented in
Table 4, AM and MA are the testing metrics for the Messidor dataset with the model trained over APTOS and vice versa, respectively. The APTOS dataset presents a good precision performance for the unhealthy or DR-affected eye and good performance in recall and F1-score for the healthy label. However, the model trained over Messidor better recognizes features in a certain grade of DR in fundus oculi images.
5. Conclusions
In this work, we presented a model to detect diabetic retinopathy at early stages as an auxiliary diagnostic tool. The Messidor and APTOS dataset helped to check the model’s feature acquisition for different stages of DR directly from examination images. Our proposal achieved a good performance under both unbalanced datasets with 81% and 64% for APTOS and Messidor datasets, respectively. A fair comparison of this work with previous methods is still missing given the lack of a standardized test dataset and methodology to propose a new solution to classify DR subclasses. A standardized dataset becomes necessary given two main reasons. The first one is related to the datasets sources and the institution which manages and ensures label integrity. The second one is related to the data used to get the validation metrics because each work presents a different validation data split; hence, the tested data between one model and another is not the same. Additionally, many data competitions have no public test labels, making it difficult to compute the test metrics. Nevertheless, we demonstrated that the APTOS dataset presents a more variate distribution of images to optimize the model acquiring better features to classify DR subclasses.
In future works, we propose to create a benchmark dataset to follow as a baseline comparison. Additionally, check different preprocessing functions and architecture, such as a multilabel approach to improve the model performance. The multilabel method comes from the idea that one kind of NPDR shares features between them. Moreover, a detection algorithm with a bounding box also will be studied.
Author Contributions
Conceptualization, T.O.F. and F.C.; funding acquisition, F.C. and B.F.; investigation, T.O.F. and A.A.; methodology, T.O.F. and A.A.; supervision, F.C.; writing—original draft, A.A. and T.O.F.; writing—review & editing, A.A., B.F. and F.C. All authors have read and agreed to the published version of the manuscript.
Funding
This work was financed in part by the Coordenação de Aperfeiçoamento de Pessoal de Nível Superior—Brasil (CAPES)—Finance Code 001, Fundação de Amparo a Ciência e Tecnologia do Estado de Pernambuco (FACEPE), Conselho Nacional de Desenvolvimento Científico e Tecnológico (CNPq)—Brazilian research agencies, and Universidad Central de Chile under the research project CIP2020013.
Institutional Review Board Statement
Not applicable.
Informed Consent Statement
Not applicable.
Conflicts of Interest
The authors declare no conflict of interest.
References
- Mellitus, D. Diagnosis and classification of diabetes mellitus. Diabetes Care 2005, 28, S5–S10. [Google Scholar]
- Fong, D.S.; Aiello, L.; Gardner, T.W.; King, G.L.; Blankenship, G.; Cavallerano, J.D.; Ferris, F.L.; Klein, R. Retinopathy in diabetes. Diabetes Care 2004, 27, s84–s87. [Google Scholar] [CrossRef] [PubMed] [Green Version]
- Klein, R.; Klein, B.E.; Moss, S.E.; Cruickshanks, K.J. The Wisconsin Epidemiologic Study of diabetic retinopathy: XIV. Ten-year incidence and progression of diabetic retinopathy. Arch. Ophthalmol. 1994, 112, 1217–1228. [Google Scholar] [CrossRef] [PubMed]
- Wilkinson, C.; Ferris, F.L.; Klein, R.E.; Lee, P.P.; Agardh, C.D.; Davis, M.; Dills, D.; Kampik, A.; Pararajasegaram, R.; Verdaguer, J.T. Proposed international clinical diabetic retinopathy and diabetic macular edema disease severity scales. Ophthalmology 2003, 110, 1677–1682. [Google Scholar] [CrossRef]
- Kempen, J.H.; O’Colmain, B.J.; Leske, M.C.; Haffner, S.M.; Klein, R.; Moss, S.E.; Taylor, H.R.; Hamman, R.F. The prevalence of diabetic retinopathy among adults in the United States. Arch. Ophthalmol. 2004, 122, 552–563. [Google Scholar] [PubMed] [Green Version]
- Nayak, J.; Bhat, P.S.; Acharya, U.R.; Lim, C.M.; Kagathi, M. Automated Identification of Diabetic Retinopathy Stages Using Digital Fundus Images. J. Med. Syst. 2008, 32, 107–115. [Google Scholar] [CrossRef] [PubMed]
- Yun, W.L.; Rajendra Acharya, U.; Venkatesh, Y.; Chee, C.; Min, L.C.; Ng, E. Identification of different stages of diabetic retinopathy using retinal optical images. Inf. Sci. 2008, 178, 106–121. [Google Scholar] [CrossRef]
- Gadekallu, T.R.; Khare, N.; Bhattacharya, S.; Singh, S.; Maddikunta, P.K.R.; Srivastava, G. Deep neural networks to predict diabetic retinopathy. J. Ambient. Intell. Humaniz. Comput. 2020, 1–14. [Google Scholar] [CrossRef]
- LeCun, Y.; Bengio, Y.; Hinton, G. Deep learning. Nature 2015, 521, 436–444. [Google Scholar] [CrossRef] [PubMed]
- He, K.; Zhang, X.; Ren, S.; Sun, J. Deep residual learning for image recognition. In Proceedings of the IEEE Conference on Computer Vision and Pattern Recognition, Las Vegas, NV, USA, 27–30 June 2016; pp. 770–778. [Google Scholar]
- Huang, G.; Liu, Z.; Van Der Maaten, L.; Weinberger, K.Q. Densely connected convolutional networks. In Proceedings of the IEEE Conference on Computer Vision and Pattern Recognition, Honolulu, HI, USA, 21–26 July 2017; pp. 4700–4708. [Google Scholar]
- Cree, M.J.; Olson, J.A.; McHardy, K.C.; Sharp, P.F.; Forrester, J.V. A fully automated comparative microaneurysm digital detection system. Eye 1997, 11, 622–628. [Google Scholar] [CrossRef] [Green Version]
- Rosas-Romero, R.; Martínez-Carballido, J.; Hernández-Capistrán, J.; Uribe-Valencia, L.J. A method to assist in the diagnosis of early diabetic retinopathy: Image processing applied to detection of microaneurysms in fundus images. Comput. Med. Imaging Graph. 2015, 44, 41–53. [Google Scholar] [CrossRef] [PubMed]
- Pratt, H.; Coenen, F.; Broadbent, D.M.; Harding, S.P.; Zheng, Y. Convolutional neural networks for diabetic retinopathy. Procedia Comput. Sci. 2016, 90, 200–205. [Google Scholar] [CrossRef] [Green Version]
- Ghosh, R.; Ghosh, K.; Maitra, S. Automatic detection and classification of diabetic retinopathy stages using CNN. In Proceedings of the 2017 4th International Conference on Signal Processing and Integrated Networks (SPIN), Noida, India, 2–3 February 2017; pp. 550–554. [Google Scholar]
- Gargeya, R.; Leng, T. Automated identification of diabetic retinopathy using deep learning. Ophthalmology 2017, 124, 962–969. [Google Scholar] [CrossRef] [PubMed]
- Dutta, S.; Manideep, B.; Basha, S.M.; Caytiles, R.D.; Iyengar, N. Classification of diabetic retinopathy images by using deep learning models. Int. J. Grid Distrib. Comput. 2018, 11, 89–106. [Google Scholar] [CrossRef]
- Mansour, R.F. Deep-learning-based automatic computer-aided diagnosis system for diabetic retinopathy. Biomed. Eng. Lett. 2018, 8, 41–57. [Google Scholar] [CrossRef] [PubMed]
- Qummar, S.; Khan, F.G.; Shah, S.; Khan, A.; Shamshirband, S.; Rehman, Z.U.; Khan, I.A.; Jadoon, W. A deep learning ensemble approach for diabetic retinopathy detection. IEEE Access 2019, 7, 150530–150539. [Google Scholar] [CrossRef]
- Majumder, S.; Elloumi, Y.; Akil, M.; Kachouri, R.; Kehtarnavaz, N. A deep learning-based smartphone app for real-time detection of five stages of diabetic retinopathy. In Real-Time Image Processing and Deep Learning 2020; International Society for Optics and Photonics: Bellingham, WA, USA, 2020; Volume 11401, p. 1140106. [Google Scholar]
- Gulshan, V.; Peng, L.; Coram, M.; Stumpe, M.C.; Wu, D.; Narayanaswamy, A.; Venugopalan, S.; Widner, K.; Madams, T.; Cuadros, J.; et al. Development and validation of a deep learning algorithm for detection of diabetic retinopathy in retinal fundus photographs. JAMA 2016, 316, 2402–2410. [Google Scholar] [CrossRef] [PubMed]
- Gomes, J.C.; Masood, A.I.; Silva, L.H.d.S.; da Cruz Ferreira, J.R.B.; Júnior, A.A.F.; dos Santos Rocha, A.L.; de Oliveira, L.C.P.; da Silva, N.R.C.; Fernandes, B.J.T.; Dos Santos, W.P. COVID-19 diagnosis by combining RT-PCR and pseudo-convolutional machines to characterize virus sequences. Sci. Rep. 2021, 11, 1–28. [Google Scholar]
- Ferreira, J.; Júnior, A.A.; Galvão, Y.M.; Barros, P.; Fernandes, S.M.M.; Fernandes, B.J. Performance Improvement of Path Planning algorithms with Deep Learning Encoder Model. In Proceedings of the 2020 Joint IEEE 10th International Conference on Development and Learning and Epigenetic Robotics (ICDL-EpiRob), Valparaiso, Chile, 26–30 October 2020; pp. 1–6. [Google Scholar]
- Silva, L.H.d.S.; George, O.d.A.; Fernandes, B.J.; Bezerra, B.L.; Lima, E.B.; Oliveira, S.C. Automatic Optical Inspection for Defective PCB Detection Using Transfer Learning. In Proceedings of the 2019 IEEE Latin American Conference on Computational Intelligence (LA-CCI), Guayaquil, Ecuador, 11–15 November 2019; pp. 1–6. [Google Scholar]
- George, O.d.A.; Silva, L.H.d.S.; Júnior, A.A.; Fernandes, B.J.; Oliveira, S.C. Binary and Multi-label Defect Classification of Printed Circuit Board based on Transfer Learning. In Proceedings of the European Symposium on Artificial Neural Networks (ESANN), Bruges, Belgium, 2–4 October 2020; pp. 655–660. [Google Scholar]
- Torrey, L.; Shavlik, J. Transfer learning. In Handbook of Research on Machine Learning Applications and Trends: Algorithms, Methods, and Techniques; IGI Global: Hershey, PA, USA, 2010; pp. 242–264. [Google Scholar]
- Russakovsky, O.; Deng, J.; Su, H.; Krause, J.; Satheesh, S.; Ma, S.; Huang, Z.; Karpathy, A.; Khosla, A.; Bernstein, M.; et al. ImageNet Large Scale Visual Recognition Challenge. Int. J. Comput. Vis. (IJCV) 2015, 115, 211–252. [Google Scholar] [CrossRef] [Green Version]
- Decencière, E.; Zhang, X.; Cazuguel, G.; Lay, B.; Cochener, B.; Trone, C.; Gain, P.; Ordonez, R.; Massin, P.; Erginay, A.; et al. Feedback on a publicly distributed image database: The messidor database. Image Anal. Stereol. 2014, 33, 231–234. [Google Scholar] [CrossRef] [Green Version]
| Publisher’s Note: MDPI stays neutral with regard to jurisdictional claims in published maps and institutional affiliations. |
© 2021 by the authors. Licensee MDPI, Basel, Switzerland. This article is an open access article distributed under the terms and conditions of the Creative Commons Attribution (CC BY) license (https://creativecommons.org/licenses/by/4.0/).


