Article

Experimental and Numerical Investigation of Contact Parameters in a Dovetail Type of Blade Root Joints

DIMEAS, Department of Mechanical and Aerospace Engineering, Politecnico di Torino, Corso Duca degli Abruzzi 24, 10129 Turin, Italy
*
Author to whom correspondence should be addressed.
Appl. Sci. 2021, 11(24), 12008; https://doi.org/10.3390/app112412008
Submission received: 17 November 2021 / Revised: 14 December 2021 / Accepted: 14 December 2021 / Published: 16 December 2021
(This article belongs to the Special Issue Bladed Disks Structural Dynamics)

Abstract

:
This paper focuses on the contact characteristics of the blade root joints subjected to the dry friction damping under periodic excitation. The numerical method and experimental procedure are combined to trace the contact behavior in the nonlinear vibration conditions. In experimental procedure, a novel excitation method alongside the accurate measurements is used to determine the frequencies of the blade under different axial loads. In numerical simulations, local behavior of contact areas is investigated using the reduction method as a reliable and fast solver. Subsequently, by using both experimental measurements and numerical outcomes in a developed code, the global stiffness matrix is calculated. This leads to find the normal and tangential stiffness in the contact areas of a dovetail blade root joints. The results indicate that the proposed method can provide an accurate quantitative assessment for investigation the dynamic response of the joints with focusing the contact areas.

1. Introduction

Complex mechanical structures usually include several subassemblies, which may have contact surfaces in common. These interfaces affect the behavior of the entire system. It can be realized grossly by introducing two contact parameters, namely contact stiffness and equivalent damping.
The major sources of damping in systems, beneficial for controlling the amplitude of vibrations, are the material damping, aerodynamic damping, and friction at contact interfaces. Regarding the last type, the energy is dissipated via friction when contact surfaces undergo a relative displacement. Micro-sliding or “microslip”, macro-sliding or “gross-slip”, and separation or “lift-off” are the three common states in the surfaces contact behavior. Partial sliding of the regions at the edge of the contact generates microslip.
Regarding the micro-scale measurements, sliding contacts between spherical surfaces were first analyzed by Mindlin et al. [1], who measured the hysteresis loops for convex surfaces. Johnson [2] measured the static and dynamic hysteresis of steel balls pressed on flat surfaces. Goodman and Brown [3] examined steel balls oscillating between two parallel planes in compression. Filippi et al. measured the friction coefficient, cycles of hysteresis and the tangential contact stiffness at room temperature [4] and at high temperature [5] for spherical surfaces in contact with flat surfaces. The sliding contacts between compliant surfaces were examined by Lavella et al. [6] by using a test bench, and measured the hysteresis cycles, the friction coefficient and the tangential stiffness of contact by varying normal load and excitation frequency. Schwingshackl et al. [7] and Stanbridge et al. [8] obtained the coefficient of friction and tangential stiffness of a plane contact for different materials and load conditions. To compute the Jacobian matrix for 3D friction contact modeling using an alternate frequency time domain method was presented by Afzal et al. [9]. In a separate study [10], they showed the damping potential of multiple friction contacts in a bladed disk, and the possibility of increasing the damping effectiveness. Recently, a few studies [11,12,13] devoted their attention to analyze the nonlinear dynamic behavior of blade-like structures, namely disk-beam, rotating beam, and rotating disk-beam, with dry friction dampers.
Regarding the macro-scale measurements, the first experimental analyses of the sliding contacts effect on global dynamic behavior of aeronautical turbine rotors were carried out by Goodman and Klumpp [14], who measured the hysteresis cycles for disc-blade joints subjected to a uniform compression load. Allara et al. [15] designed a test bench to study the behavior of dovetail joints between disc and blade as the centrifugal load and the vibrations amplitude vary. Firstly, the oscillations’ free decay of an axially loaded beam under electromagnetic excitation was measured. Then, the obtained signals were analyzed to derive the frequency and the lost factor of the nonlinear system, as a function of the traction load and amplitude of vibration. The test bench is used in the present work for conducting experimental investigations. The same test equipment was utilized by Firrone and Bertino [16] to measure the forced response in the frequency domain to validate the numerical results based on the Harmonic Balance Method. Asai et al. [17] analyzed the behavior of a cantilever beam dovetail root joints of different geometries and evaluated the corresponding friction damping in the system. Simmons and Iyengar [18] employed the same method to contiguous palettes to study the tension distribution and notch effect in the blade attachments. Umer and Botto [19] evaluated the global dynamic behavior of a vane in contact with under platform dampers, simultaneously investigated the local contact behavior to realize the performance curves of these dampers. Very recently, Li and coauthors [20,21,22] conducted several in-depth studies, contributing to better understanding of different contact models. For instance, in Ref. [22], Iwan density function was utilized to model sphere-on-sphere contact and flat-on-flat contact, and the results were then validated with analytical and experimental data.
The present work carries out an experimental procedure to measure the dynamic responses of a typical dovetail joint used for connecting the blades to the disc. Extracting the contact parameters of a blade simulacrum as a function of centrifugal force leads to deepen understanding of joints’ dynamic performance. Furthermore, it provides a valuable measured database during free decay of oscillations to validate newly proposed methods of nonlinear temporal integration. Eventually, the current contribution is an attempt to obtain normal and tangential contact stiffness from the macroscopic measurements to find needed parameters for contact models development.

2. Experimental Configuration

In this section, the response due to an excitation is analyzed in terms of centrifugal force and the amplitude of vibration. The dummy blade beam, which replaces the real blade is shown in Figure 1.

2.1. Test Bench

Experimental equipment utilized in the current study was in use as described in Ref. [15], and it consists of the following five subsystems:
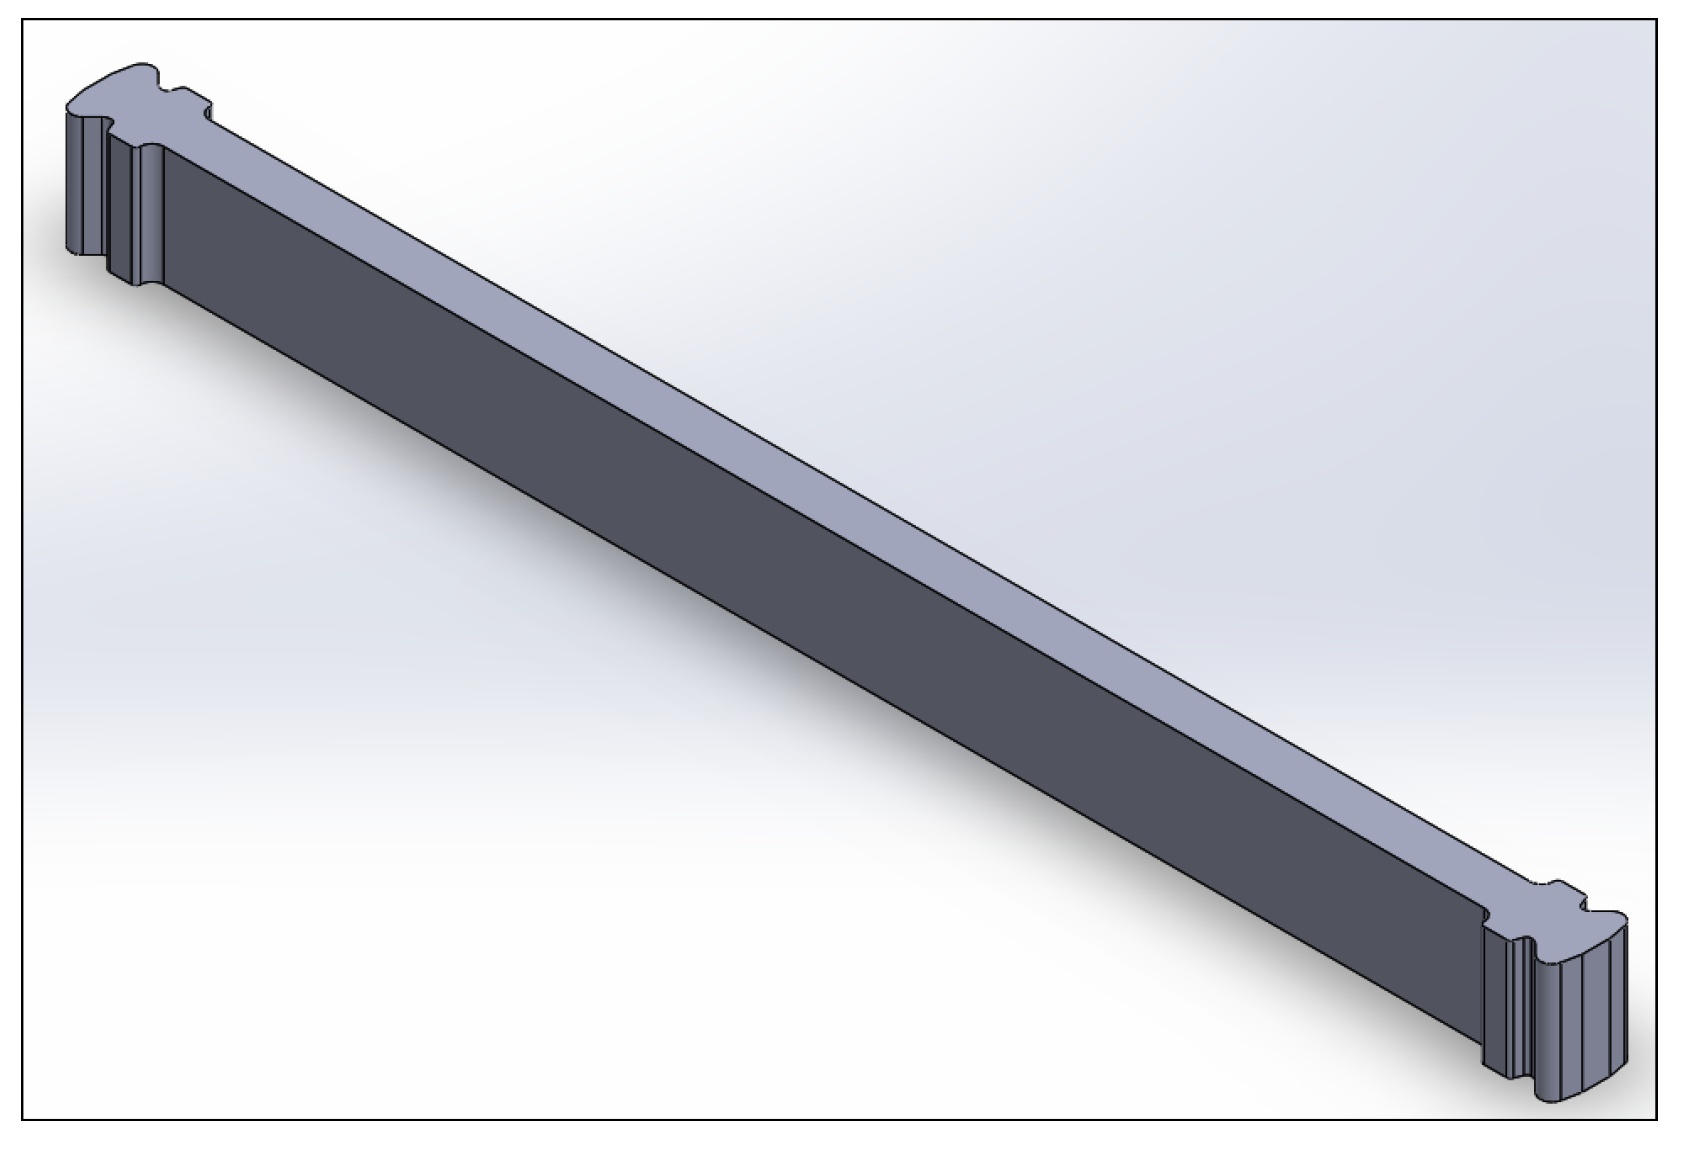
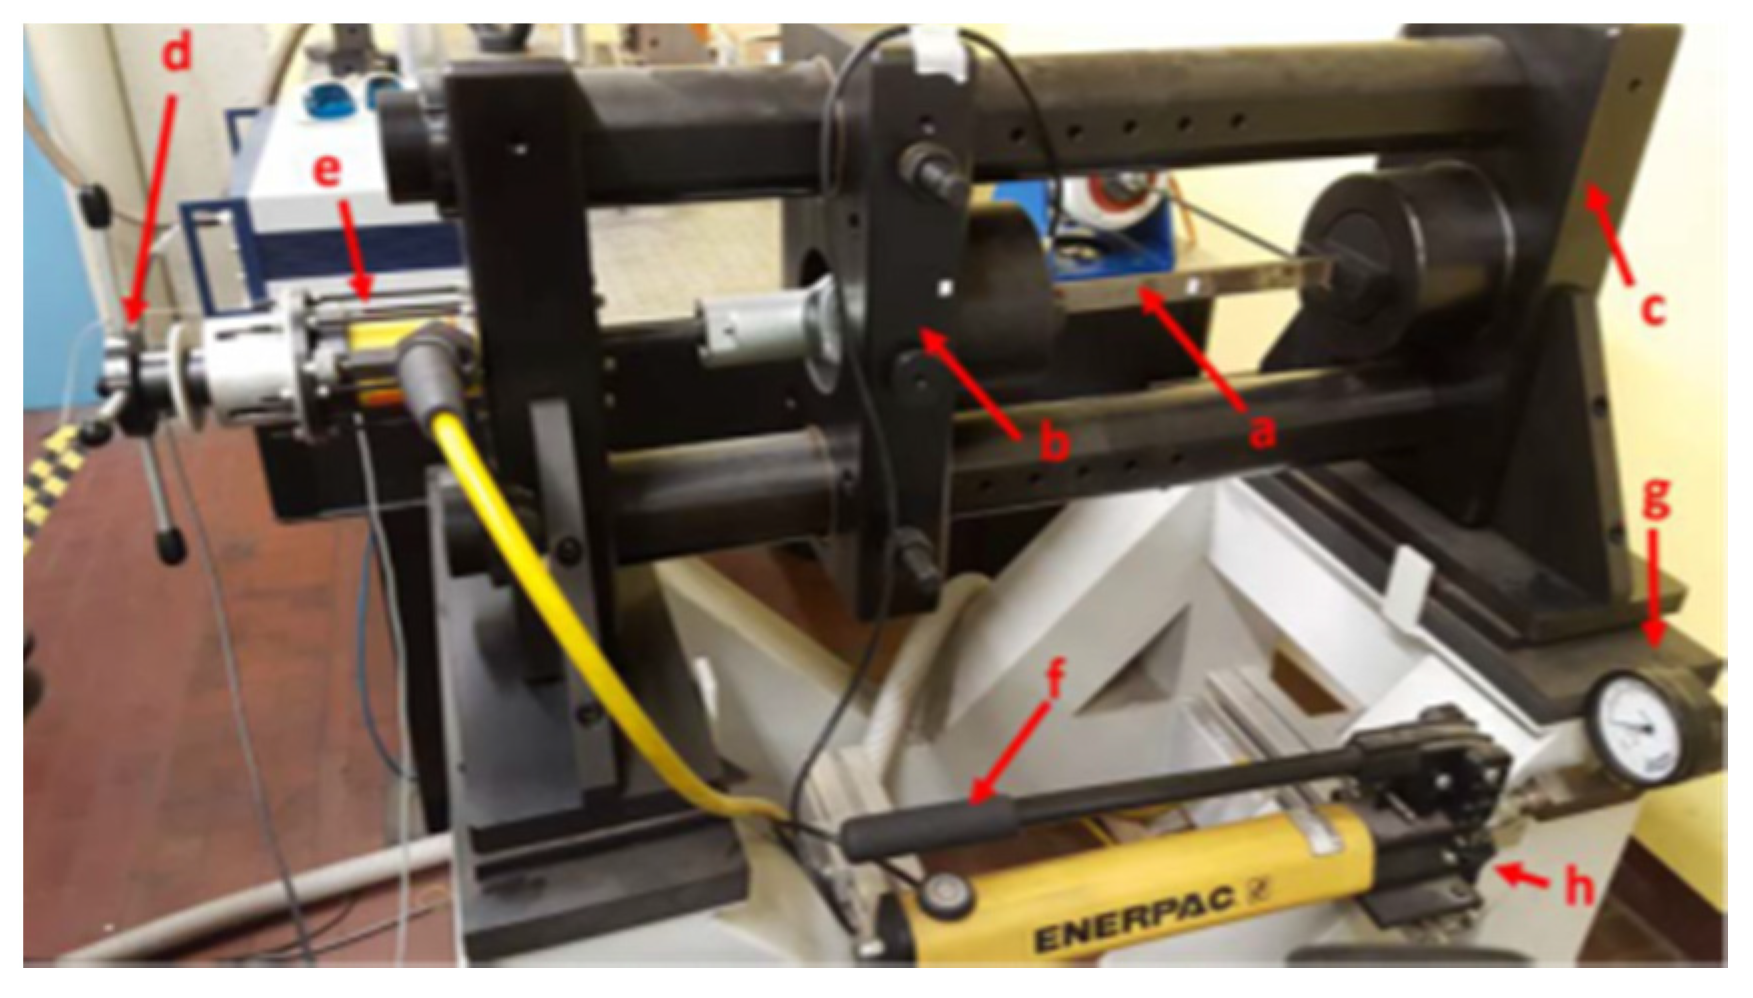
  • The support and traction system of the blade simulacrum, shown in Figure 2. This system includes two crosspieces: a fixed piece integrated with a support of dovetail type (c); and a mobile piece connected to a hydraulic actuator that enables the traction (b).
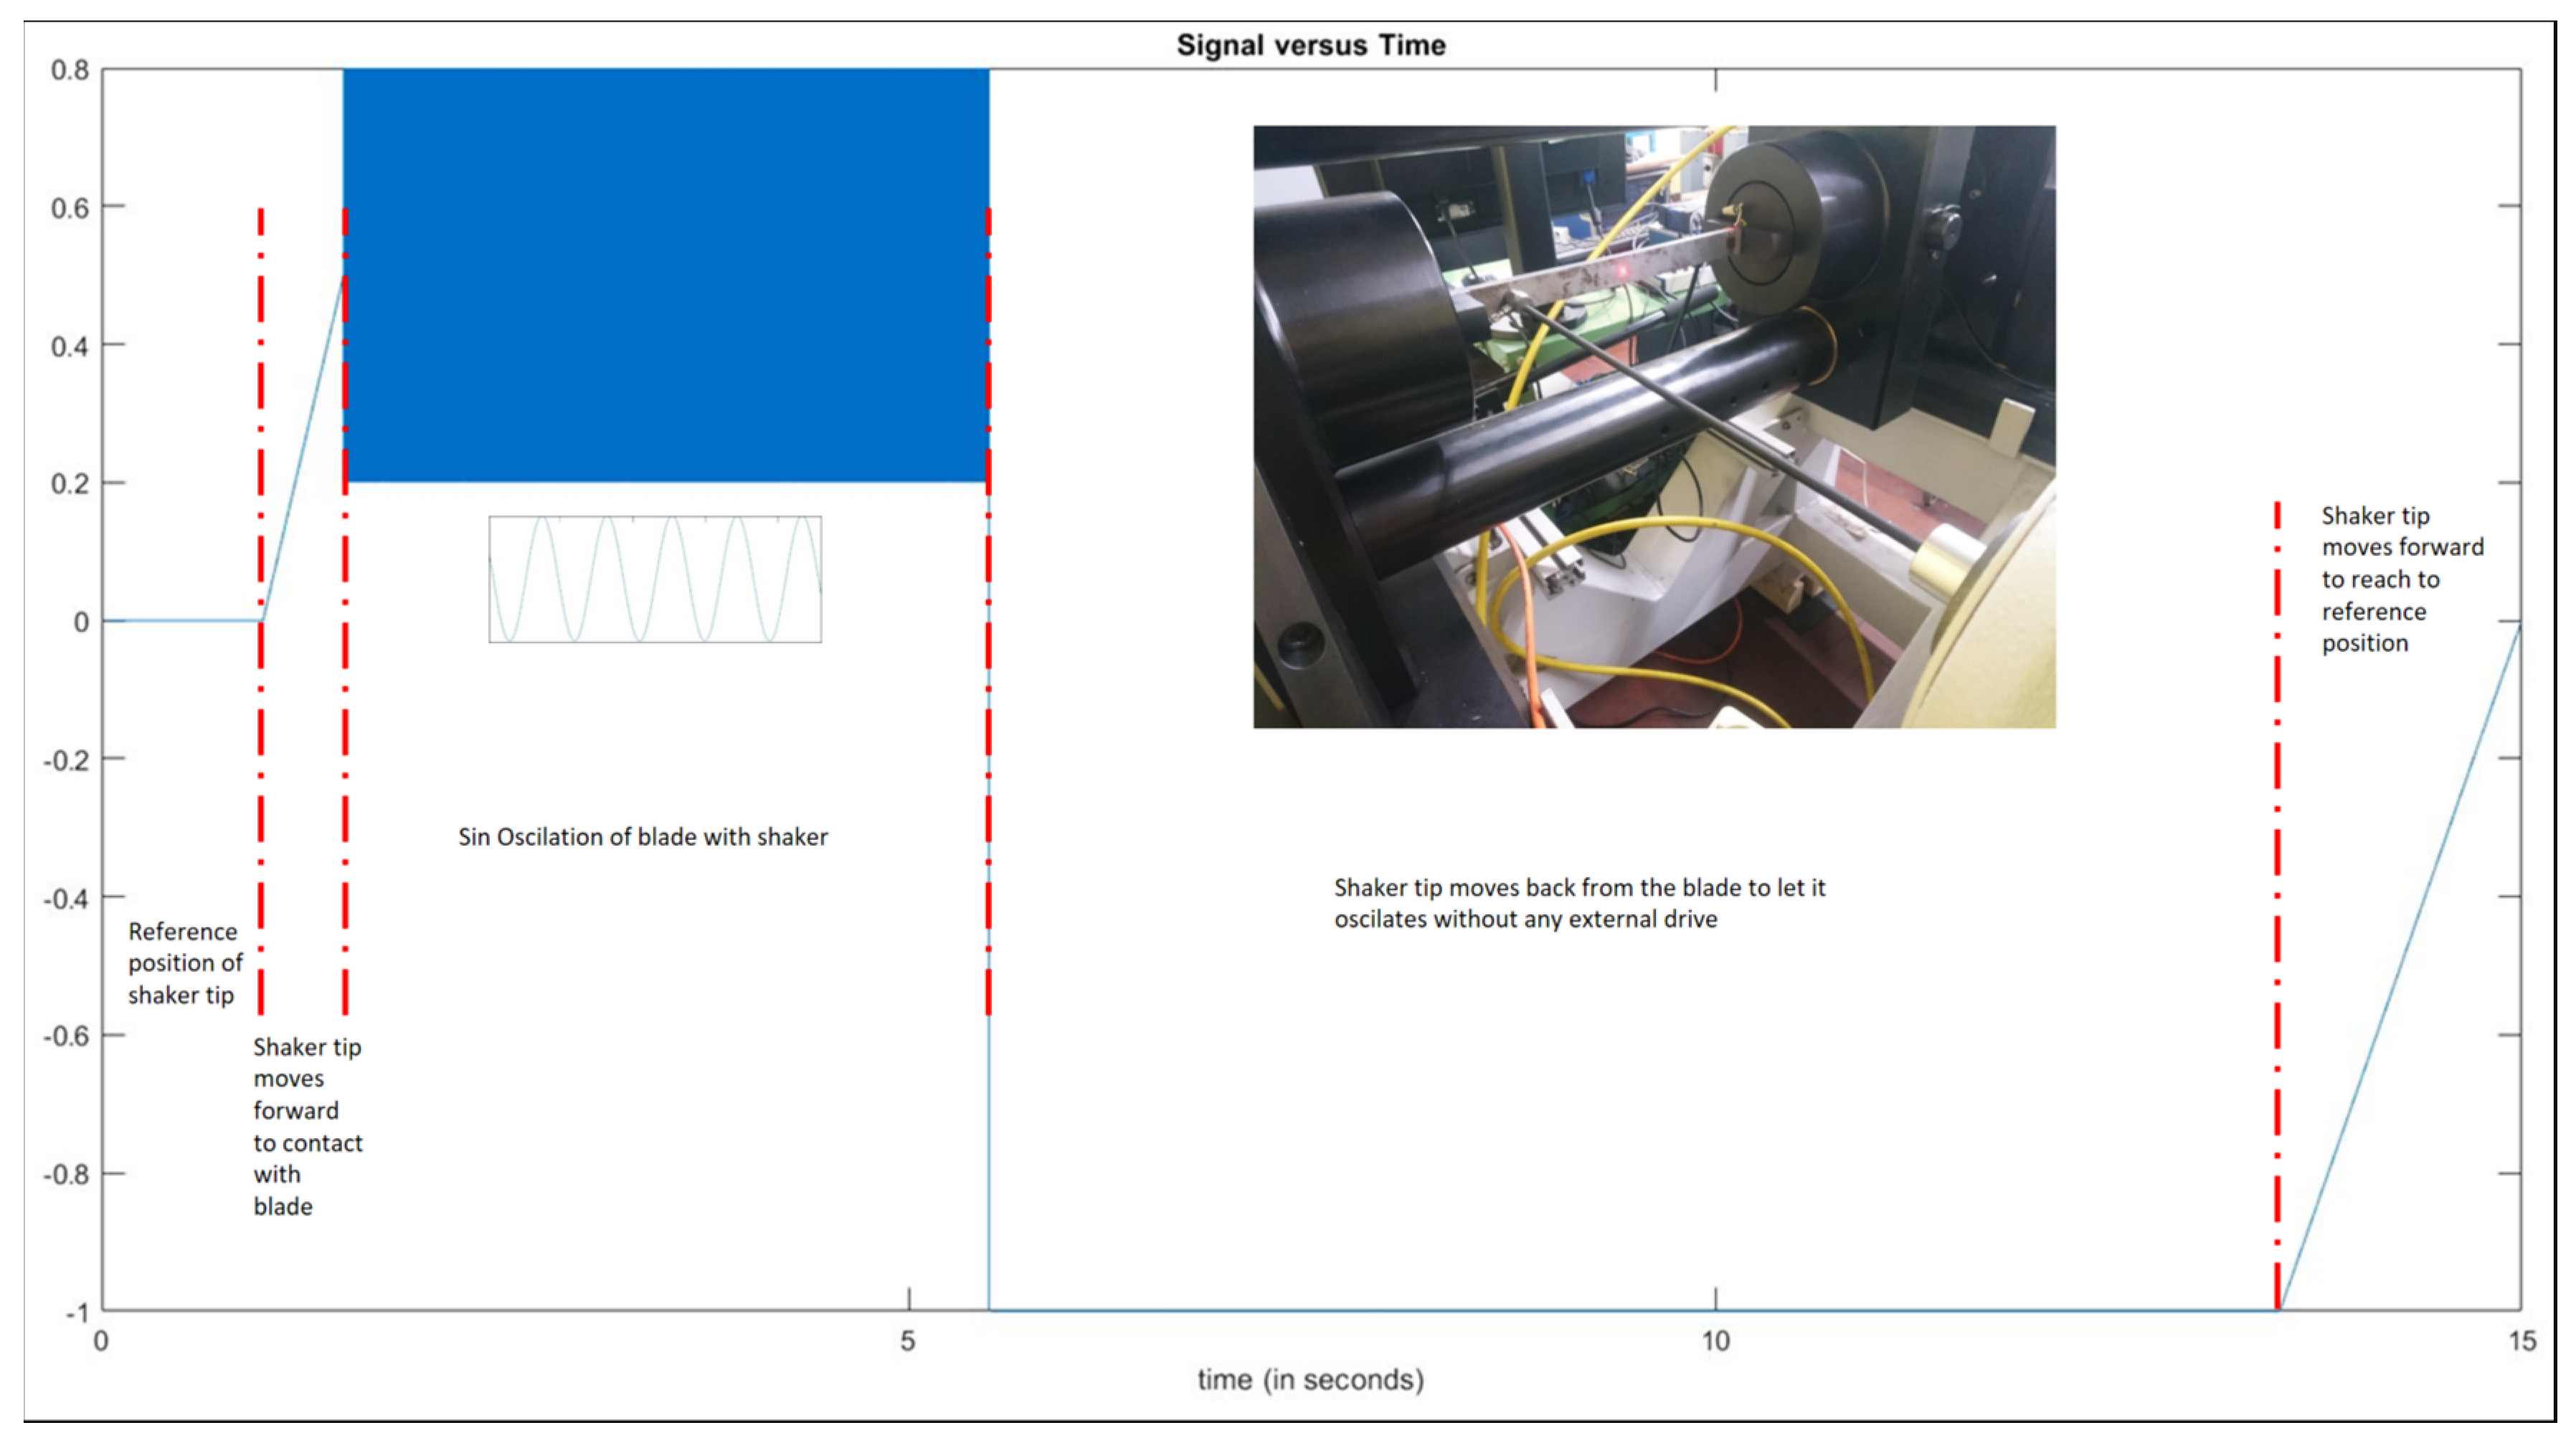
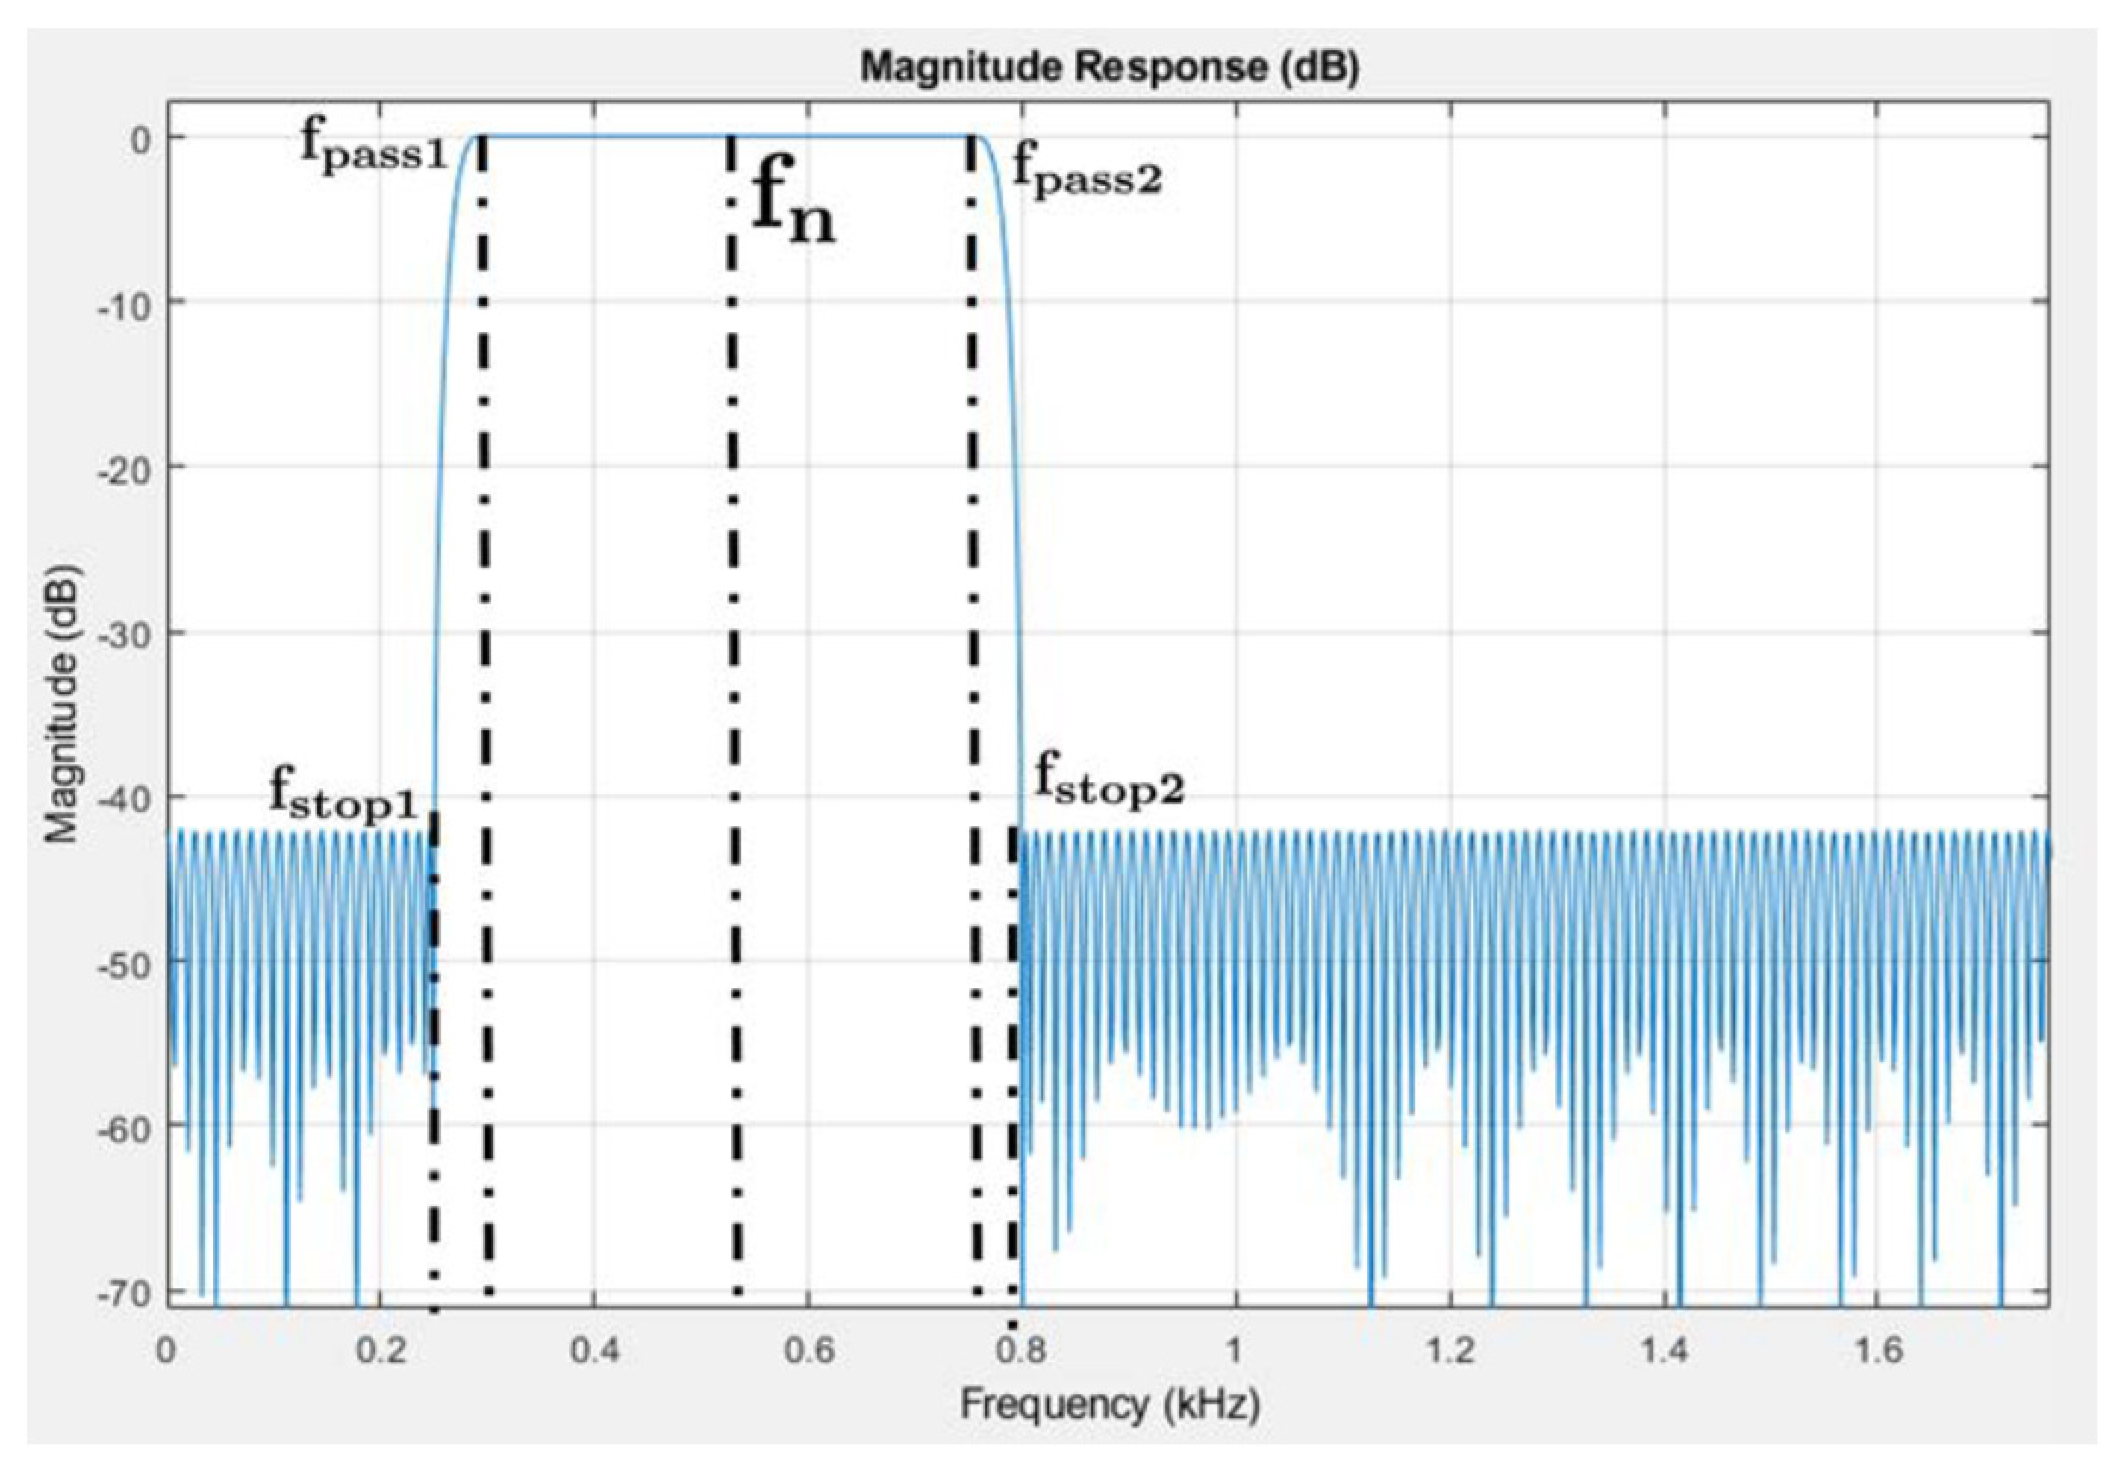
  • The dynamic excitation system, which includes a signal generator, an amplifier, and a shaker. To obtain the response associated with the mode shapes, a type of input signal, shown in Figure 3, is applied. Performing excitation by the shaker was utilized for the first time in the present study unlike other contributions [6,15,16].
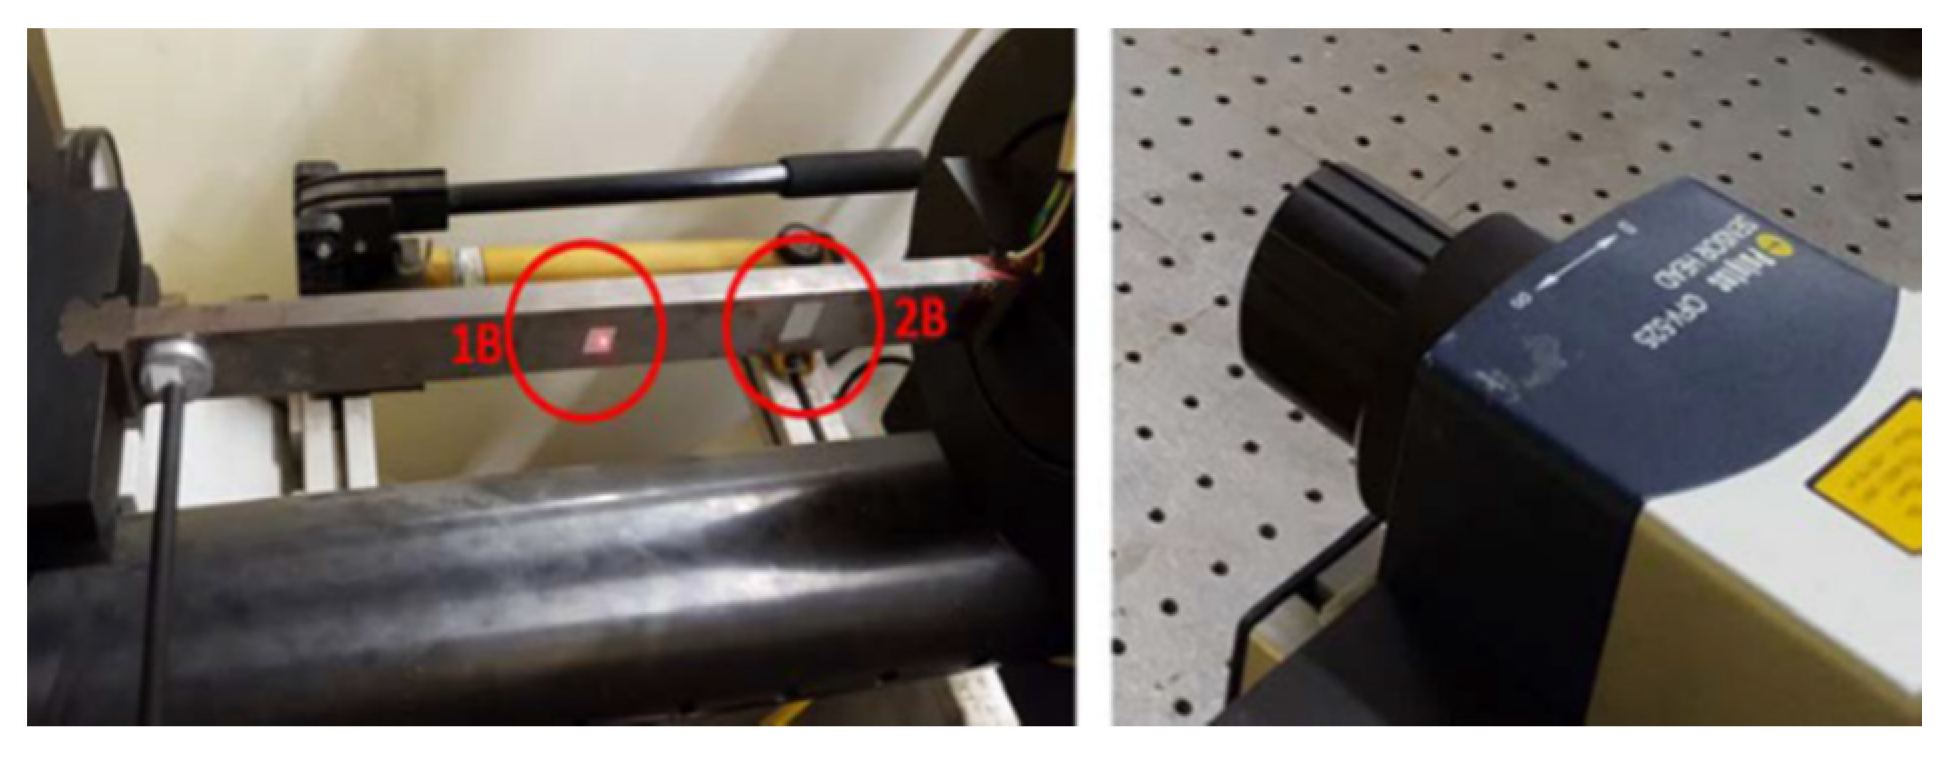
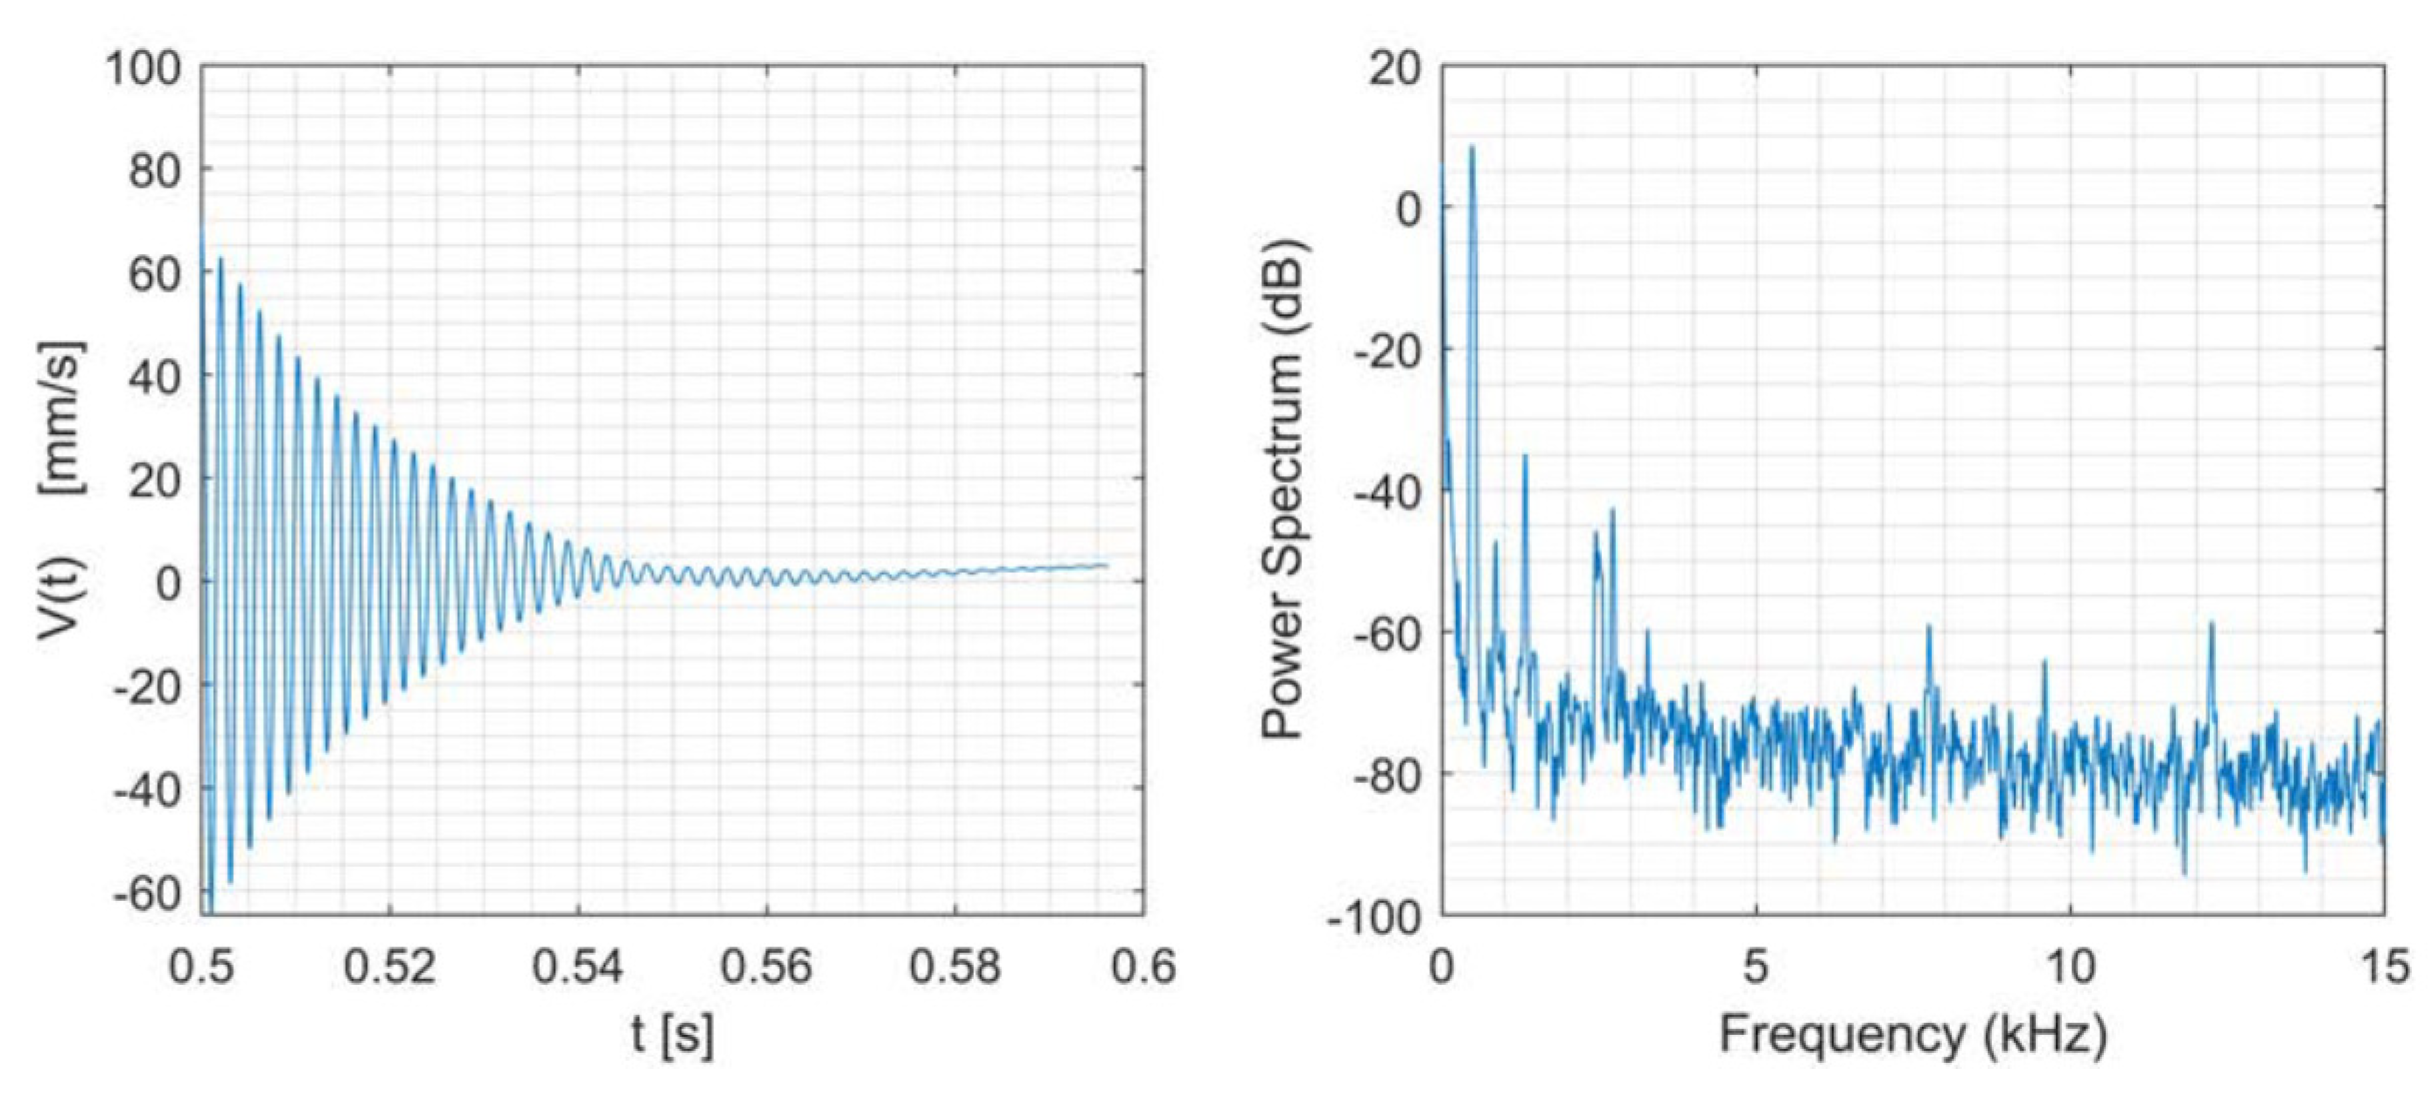
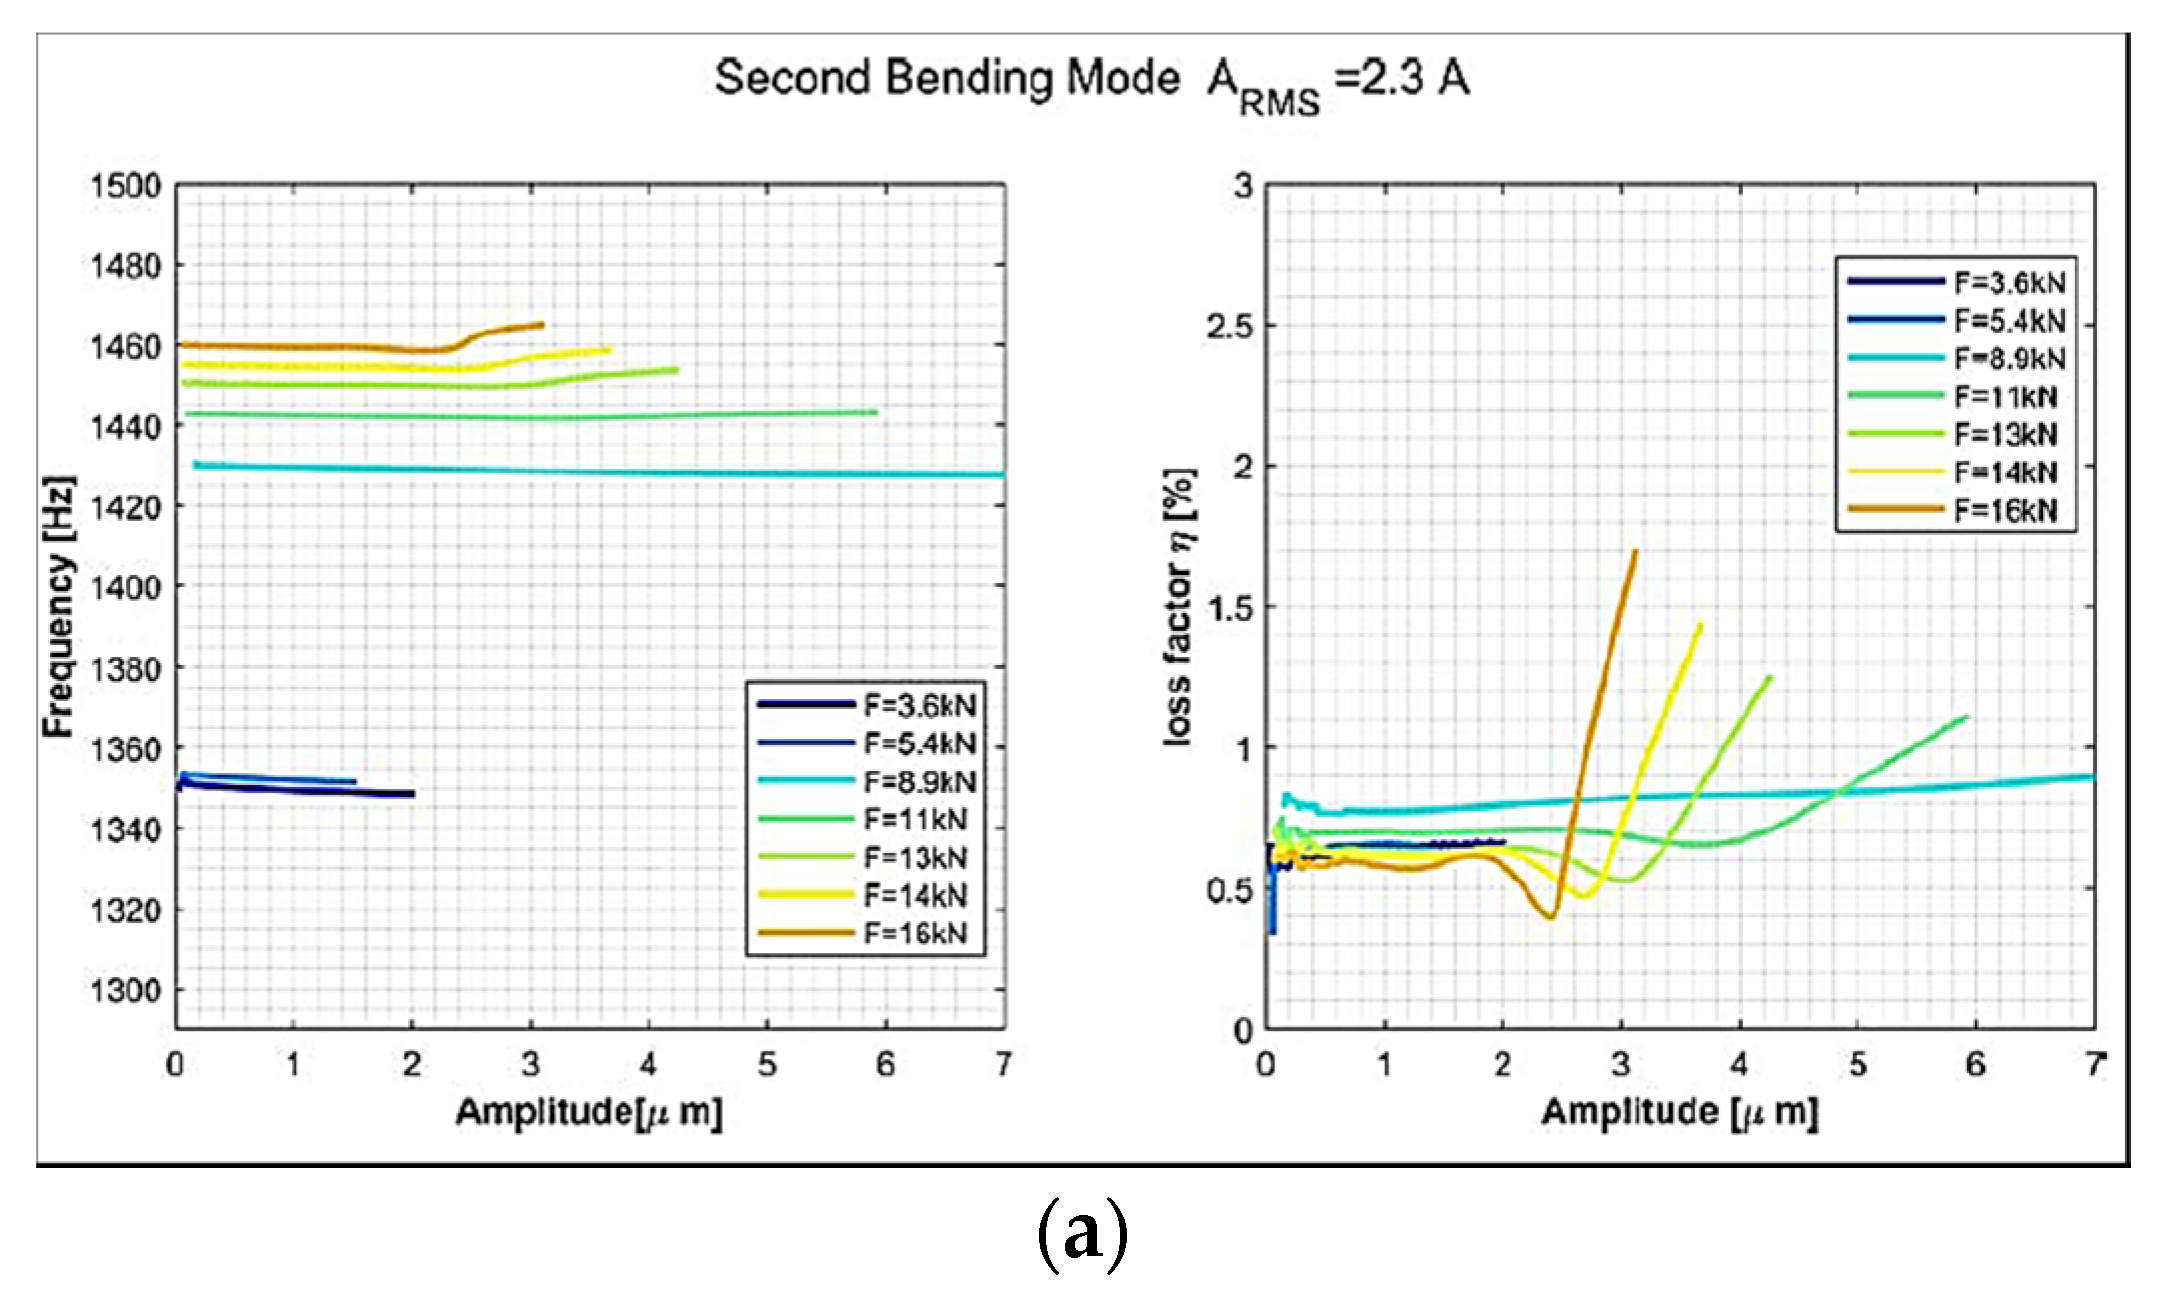
  • The vibration measurement system, which consists of a laser pointer, Figure 4, and a laser controller. As the specimen were excited at frequencies close to the first and second flexural modes (1B and 2B), the laser was pointed towards the nodes of the corresponding mode shapes, where the maximum amplitude occurs.
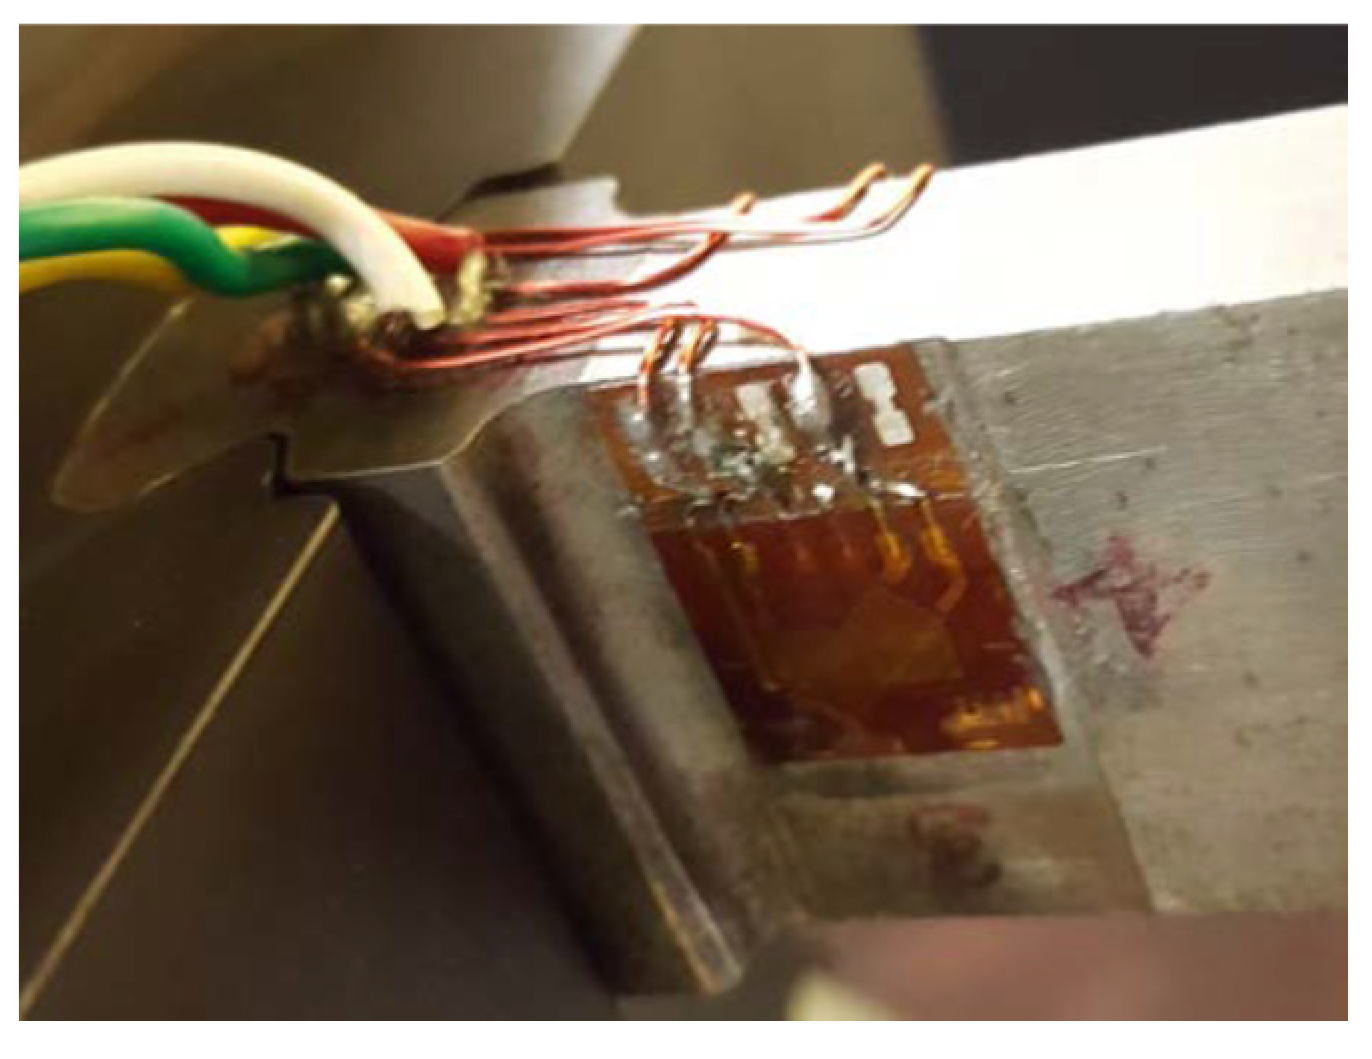
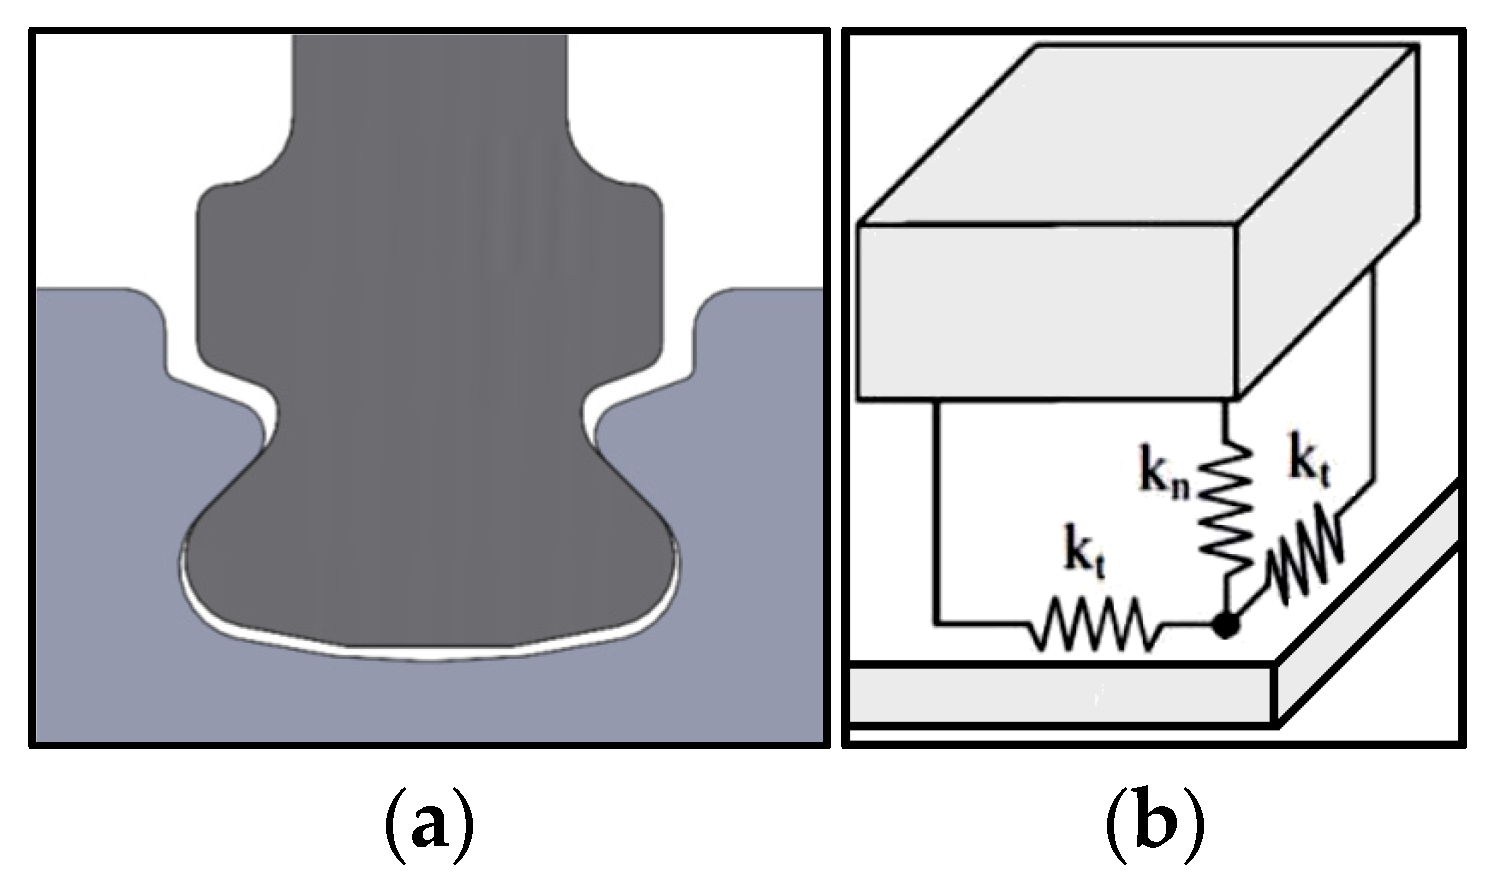
  • The traction force measurement system, incorporating two independent subsystems that allow for double checking the measurements. The first consists of a pressure gauge, providing pressure inside the hydraulic actuator. The second is composed of a Wheatstone bridge strain gauges (Figure 5) for measuring the axial deformation δ of the beam and a data acquisition system.
  • The data collection and acquisition system, which collects the velocity signals measured by the laser and the strain from the gauges and the input currents of the shaker, later to be used for further analysis.

2.2. Technical Limitations

After obtaining the velocity signal v ( t ) for each applied tensile force, it is possible to realize the dependence of nonlinear modal parameters, i.e., natural frequency f n and damping   η from the vibration amplitude. To this purpose, the free decay of the envelope velocity signal v ( t ) from the excitation starting points until the detachment of the shaker tip should be analyzed. However, the signal is still the superposition of all modes of the beam vibration, as shown Figure 6. A filter has therefore been implemented to extract the main modal component without altering the phase of the signal, necessary for subsequent identification of the modal parameters. A Parks–McClellan Finite Impulse Response (FIR) filter with a ripple of 1·10–40 dB in the passband and a ripple of −40 dB in the remaining frequency band was adopted (see Figure 7).
To identify the nonlinear dependence of the natural frequency f n and the damping η on the amplitude of vibration, the theory of analytical signals and Hilbert transform were utilized following the “FREEVIB” method proposed by Feldman in [23] for nonlinear systems. It can be only applied to systems that have frequency-independent damping [15,20]. To obtain a stable solution, particular methods such as that proposed in Ref. [20] should be taken into account due to Kelvin type structural damping in the model.
The measurement points, (P1) for the first and (P2) for the second flexural mode is displayed in Figure 8. Concerning the first mode, the dependence of damping on the vibration amplitude for different value of axial loads is shown in Figure 9. For small vibration amplitudes, it observes a constant damping, i.e., independent of amplitude. This suggests the complete adhesion at the contact region, implying the linearity of the system in question. For amplitudes greater than a critical value, the damping shows a steep increase, indicating the beginning of possible sliding in the contact region, and thereby the establishment of the hysteresis loop due to the alternation between adhesion and sliding states during each oscillation cycle. Furthermore, the dissipation peaks at a critical value of vibration amplitude, as can be seen in Figure 9, and eventually decreases as amplitude exceeds that critical value. Moreover, the peak (maximum damping) drops as the traction force F increases. This is because not all four contact regions are in the state of macro-creep, and some regions are in the state of microslip, i.e., sliding only at edges of the contact regions. Indeed, various combinations of the macroslip and microslip states at the four contact zones could influence the results in different manners. This hypothesis is compatible with the previous supposition on the variation in force normal to the contact region.
The variation of the frequency against the vibration amplitude is depicted in Figure 10. Based on the figure, rather flat curves for small oscillations suggest linearity of the system, the indication of complete adhesion. As the amplitude grows, the frequency decreases sharply, signaling the occurrence of possible sliding in the contact region. Eventually, the stiffening phenomenon (increase in frequency) is observed for further larger values of vibration amplitude, which can be attributed to the variation of normal force at the contact region caused by the bending of the blade simulacrum.
Regarding the second flexural mode, variations of damping and frequency with respect to the vibration amplitude are shown in Figure 11. According to this, an initial stretch of constant damping is observed for small vibration amplitudes. Then, a steep growth is evident beyond a critical amplitude at which the sliding begins. Considering the same traction force, the critical amplitude depends upon the effective I_RMS current sent to the shaker. This current defines the amplitude of oscillation of the exciting force before the detachment of the shaker tip from the beam, and therefore the amplitude of the vibration at the beginning of the free decay. Close examination of the figure suggests that the highest damping is achieved when a traction force of approximately 8   kN is exerted to the beam, and more intense loading results in a drop in damping. Besides, a decrease in the critical amplitude is observed as the traction force increases, the phenomenon also presents in the first flexural mode.
The dependence of the frequency on the vibration amplitude is also illustrated in Figure 11, where the frequency follows a constant trait for low amplitude values, revealing the complete adhesion at the contact regions. Stiffening effect, already identified for the first bending mode, can be recognized from the frequency trend against the traction force.

3. Contact Model

In this part the normal and tangential stiffness components, i.e., k n and k t , are investigated by considering the equivalent model of the dovetail joint (see Figure 12).
The following procedure was followed to search for the values of k n and k t :
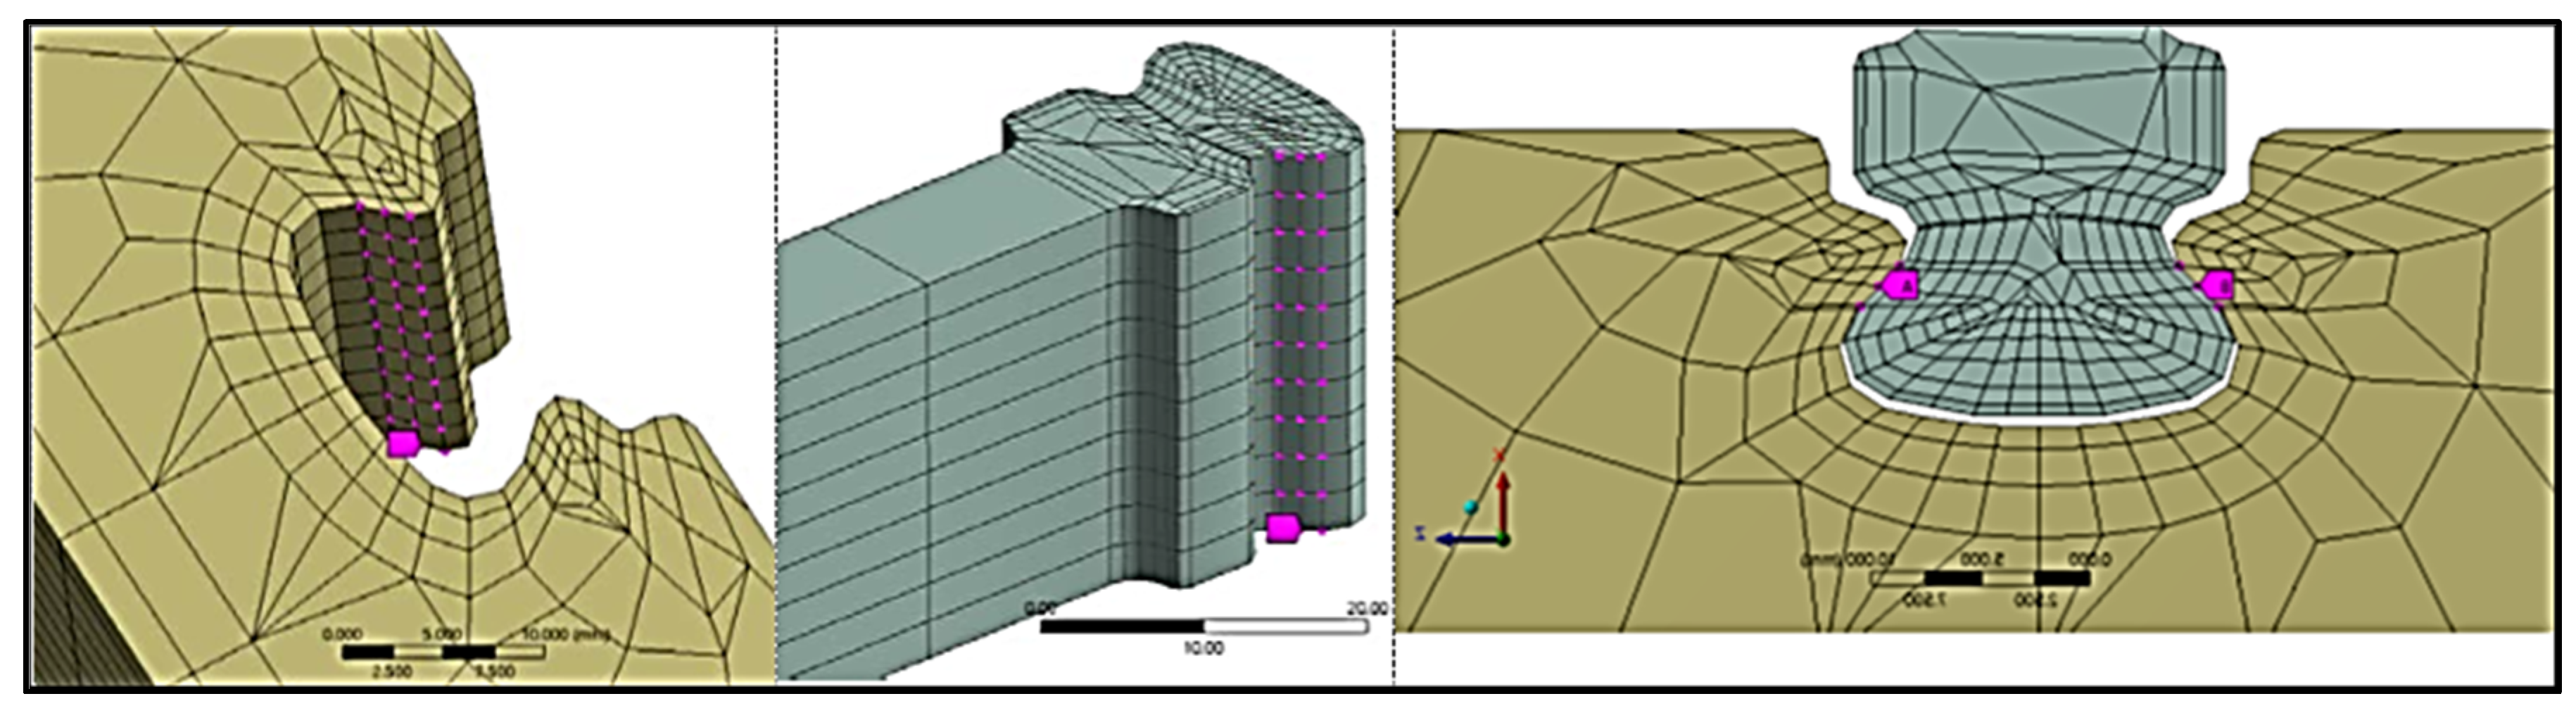
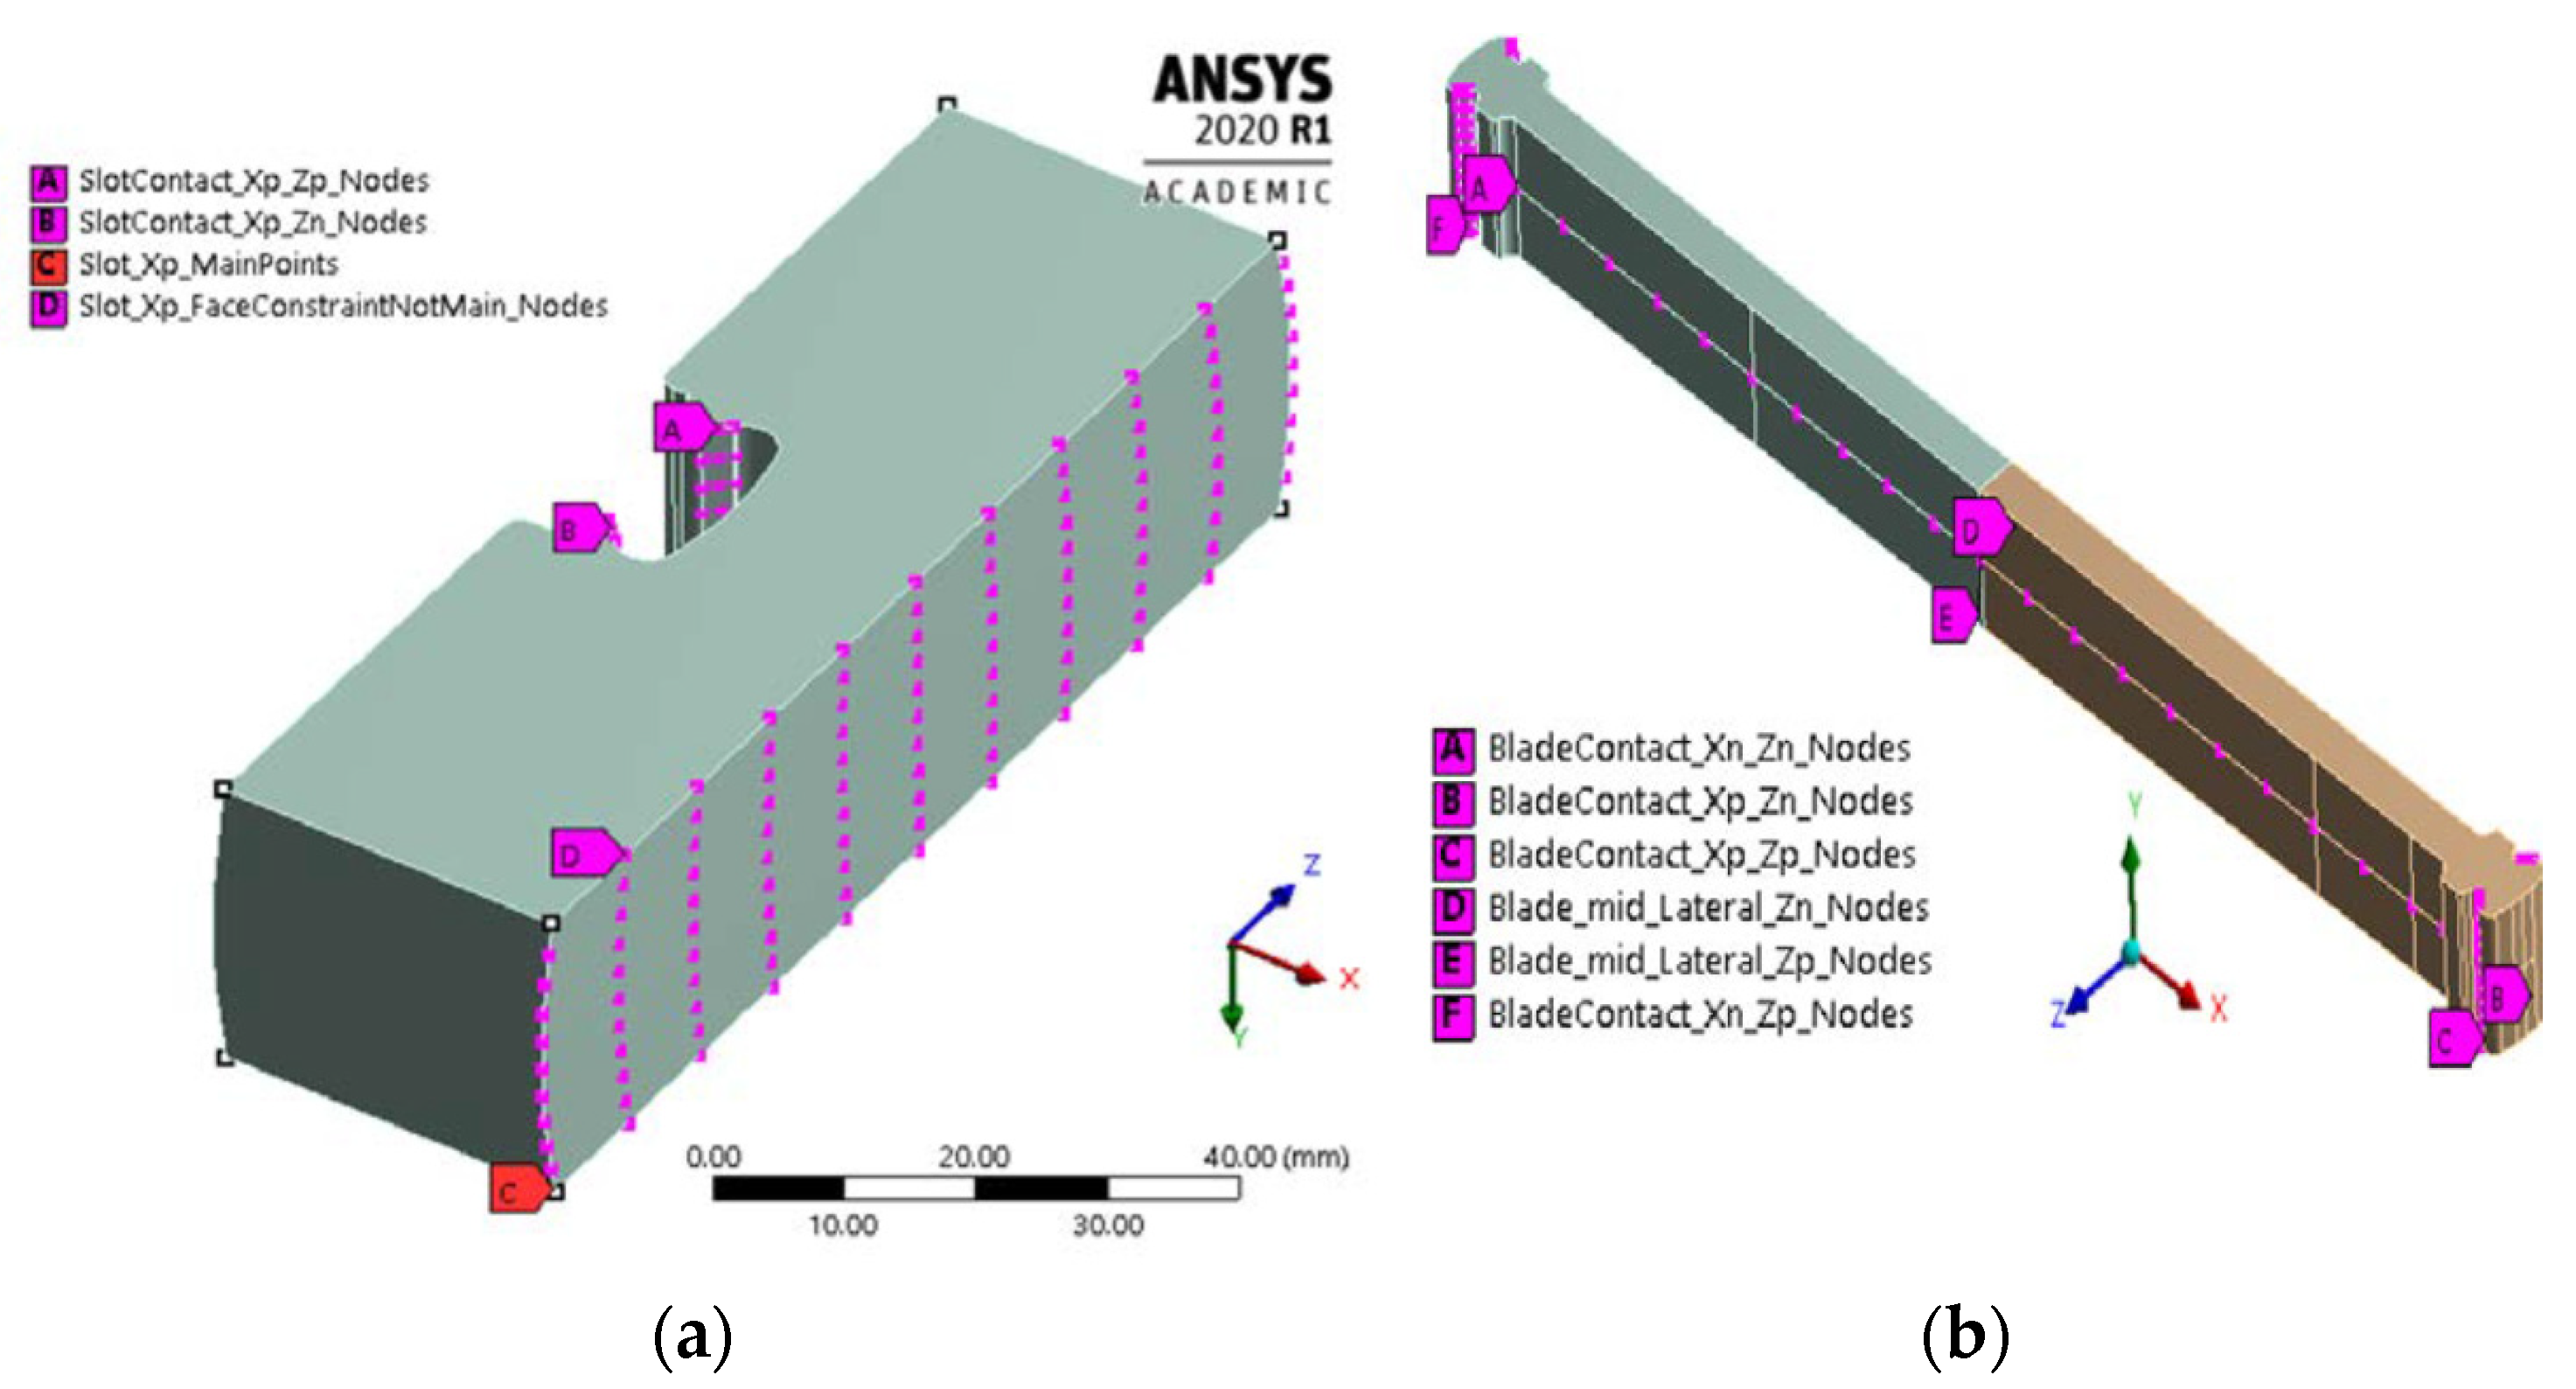
  • The model of the beam with dovetail supports at both ends as well as the corresponding supports was discretized with the finite element method implemented in commercial finite element software, paying particular attention to the coincidence of the nodes in the contact interfaces.
  • Nonlinear static analyses were carried out in commercial finite element software on the beam alone as the axial traction varied to discern the stiffening effect of the force on the stiffness matrices of the blade simulacrum.
  • Reducing the model DOF in commercial finite element software using Craig-Bampton’s Component Mode Synthesis technique [24] and importing the reduced mass and stiffness matrices into a numeric computing environment.
  • The reduced models of the blade simulacrum and supports (slots) were assembled in a numeric computing environment by introducing linear contact elements.
A script was developed to search for k n and k t , which compares the frequencies of the first and second flexural modes from the FEM model with those obtained from the measurements within the range of axial traction forces in which complete adhesion of the contacts was recognized.

3.1. Finite Element Method

To discretize the model using the ANSYS® 2020-R2, SOLID185 8-node hexahedral linear elements (ANSYS, Canonsburg, PA, USA) were utilized for meshing, the size of which was gradually reduced in the vicinity of the contact areas. To employ Node-to-Node contact elements in the subsequent assembly in a numeric computing environment, the nodes at the contact interfaces were set to coincide geometrically, as shown in Figure 13.

3.2. Reduction Technique

The search for the values of the k n and k t was carried out by comparing the frequencies of the first and second flexural modes of the FEM model with those obtained from the measurements. This procedure required the use of a global method varying k n and k t . In this regard, the degrees of freedom of the beam and support were reduced. In particular, the technique proposed by Craig–Bampton [24] was adopted in the present study, already implemented in commercial finite element software.
The method implements a change of coordinates of the equations of motion to obtain a description of the system with a reduced number of generalized coordinates. The first step is to break down the degrees of freedom of the model into master DOFs (m), which will be also present in the final reduced model, and slave DOFs (s).
In a general case, the system of equations of the motion is of the form:
[ M ]   { u ¨ } + [ K ]   { u } = { 0 }
where the matrices [M] and [K] and the vector {u} can be considered in the following form:
{ u } = { u m u s }
[ M ] = [ M m m 0 0 M s s ]
[ K ] = [ K m m K m s K s m K s s ]
Defining the static modes [ Φ ¯ C ] as the displacements of the slave DOFs due to the displacements of master DOFs, one can extract:
[ K s m ] { u m } + [ K s s ] { u s } = { 0 }         { u s } = [ Φ ¯ C ] { u m }
with
[ Φ ¯ C ] = [ K s s ] 1 [ K s m ]
The internal modes [ Φ N ] are defined as:
ω 2 [ M s s ] [ Φ N ] = [ K s s ] [ Φ N ]  
When all the “master DOFs” are bound, it is now assumed that the movements of the “slave DOFs” can be approximated by a combination of a subset of the internal modes [ Φ N ] as:
{ u s } = [ Φ N ] { p N } = [ Φ ¯ N | Φ ^ N ] { p ¯ N p ^ N } [ Φ ¯ N ] { p ¯ N }  
Defining a new generalized coordinate system consisting of the master DOFs and the coordinates { p N } as:
{ p } = { u m p ¯ N }  
Thus, the movements of the slave DOFs can be written according to the new coordinates using the static modes and internal modes in the following form:
{ u s } = [ Φ C ] { u m } + [ Φ N ] { p N }  
The above relation implies that the initial degrees of freedom and the new generalized coordinate system are related by the following transformation matrix:
{ u m u s } = [ I 0 Φ ¯ C Φ ¯ N ] { u m p ¯ N }  
Defining [ α ] = [ I 0 Φ ¯ C Φ ¯ N ] and { p } = { u m p ¯ N } , the equations of motion of the structure in the new coordinates are therefore:
[ α ] T [ M ] [ α ] { p ¨ } + [ α ] T [ K ] [ α ] { p } = { 0 }         [ M ¯ ] { p ¨ } + [ K ¯ ] { p } = { 0 }
where
[ K ¯ ] = [ α ] T [ K ] [ α ]  
[ M ¯ ] = [ α ] T [ M ] [ α ]
To analyze the problem of interest, the master nodes chosen for the beam are:
  • 33 nodes for each of the four contact interfaces
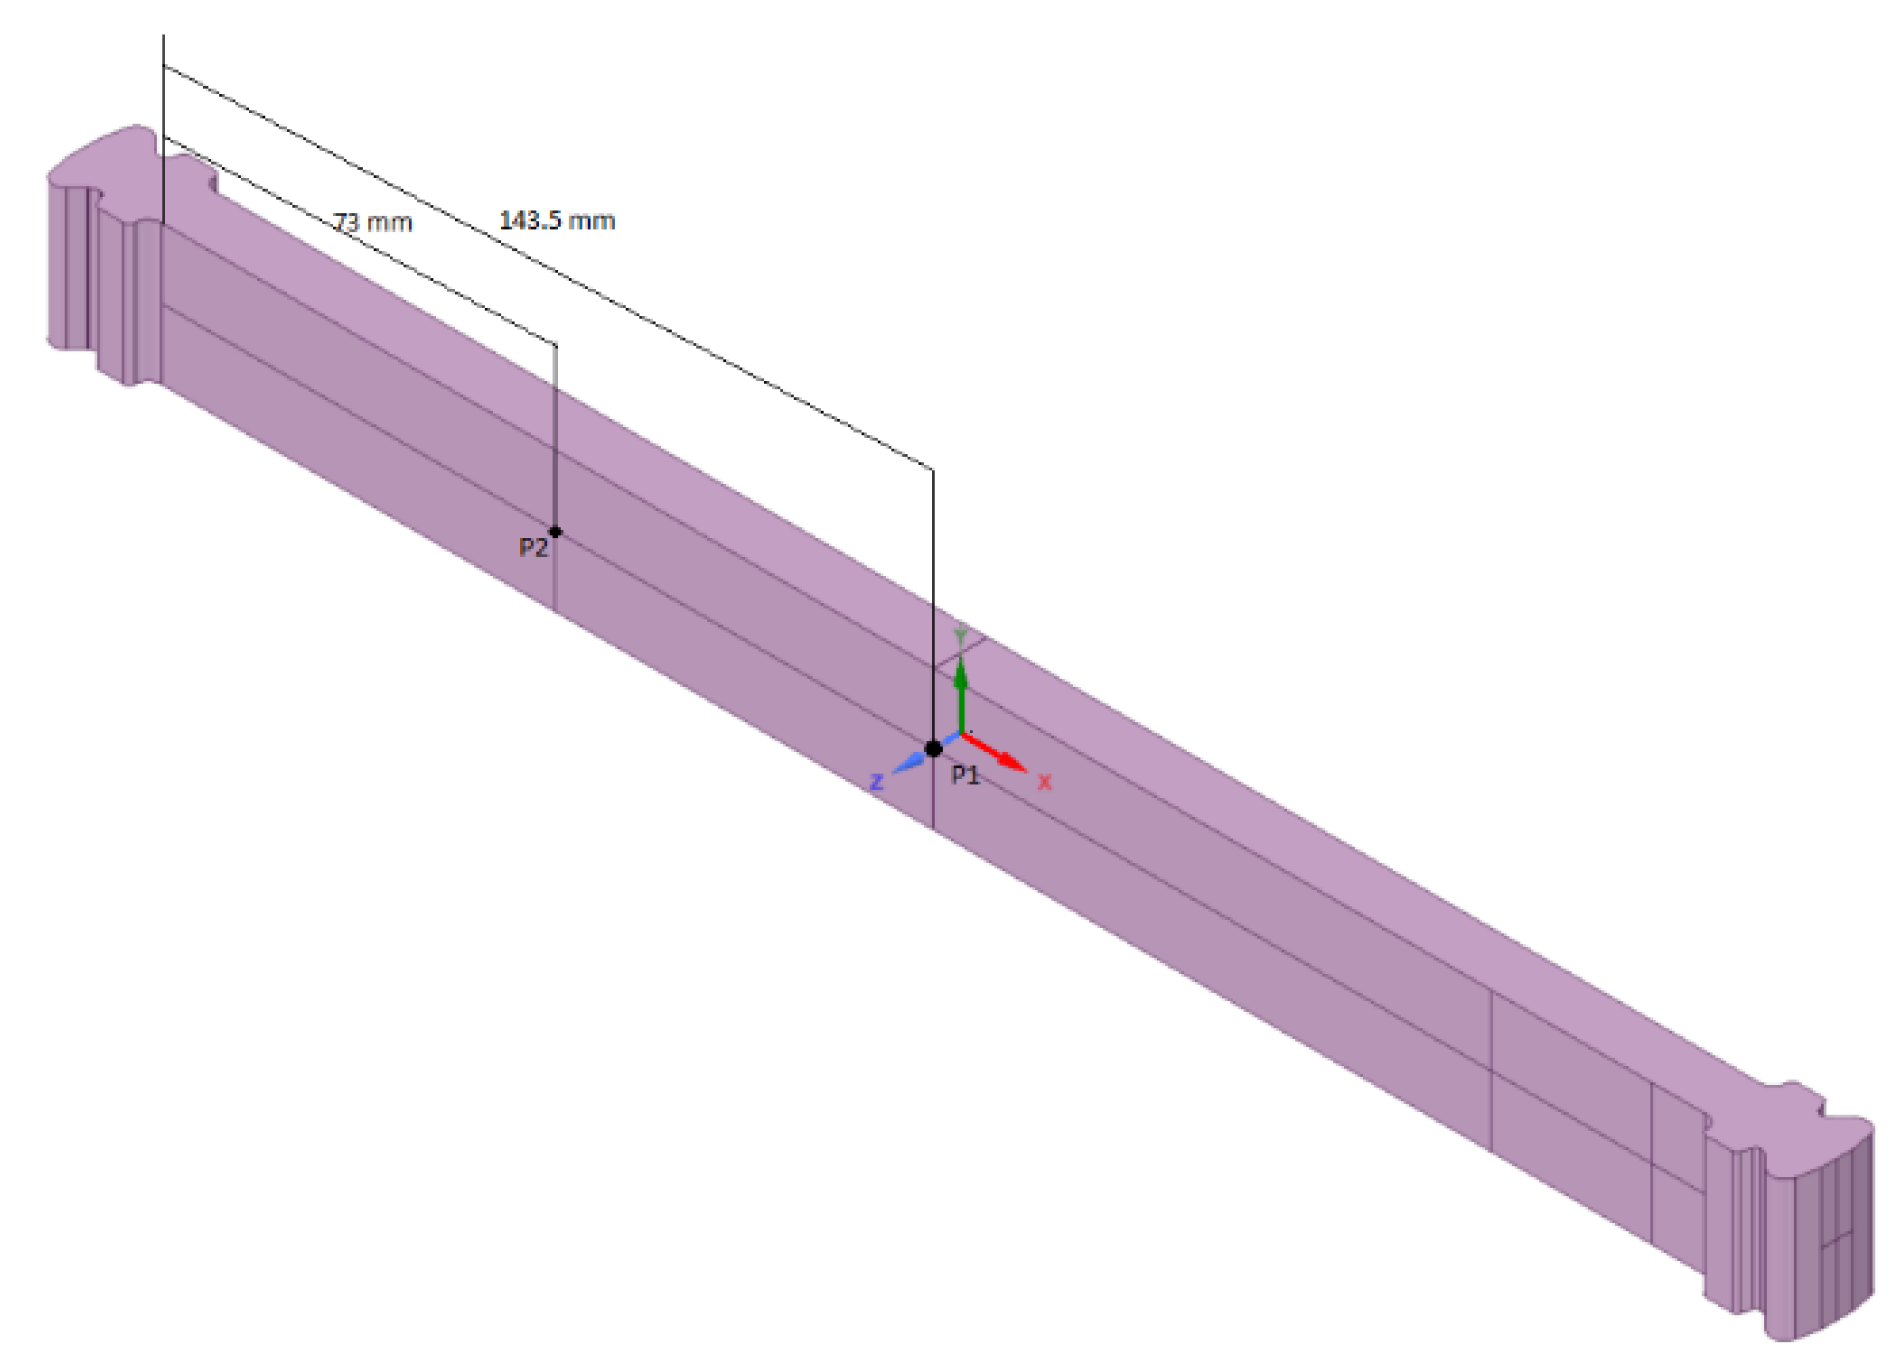
  • 21 nodes along the longitudinal axis of the beam on each side, see Figure 14b, to be capable of viewing the mode shapes of the reduced model.
Regarding each slot, the following master nodes were chosen:
  • 33 nodes for each of the two contact interfaces
  • 8 nodes corresponding to the vertices of the support for displaying the modes.
  • 117 nodes at the base of the support, see Figure 14a, to be subsequently constrained in a numeric computing environment.
Once the master nodes for the blade simulacrum and the supports were defined, the reduction of each was carried out and the respective reduced matrices [ M ] and [ K ]   were exported to a numeric computing environment.

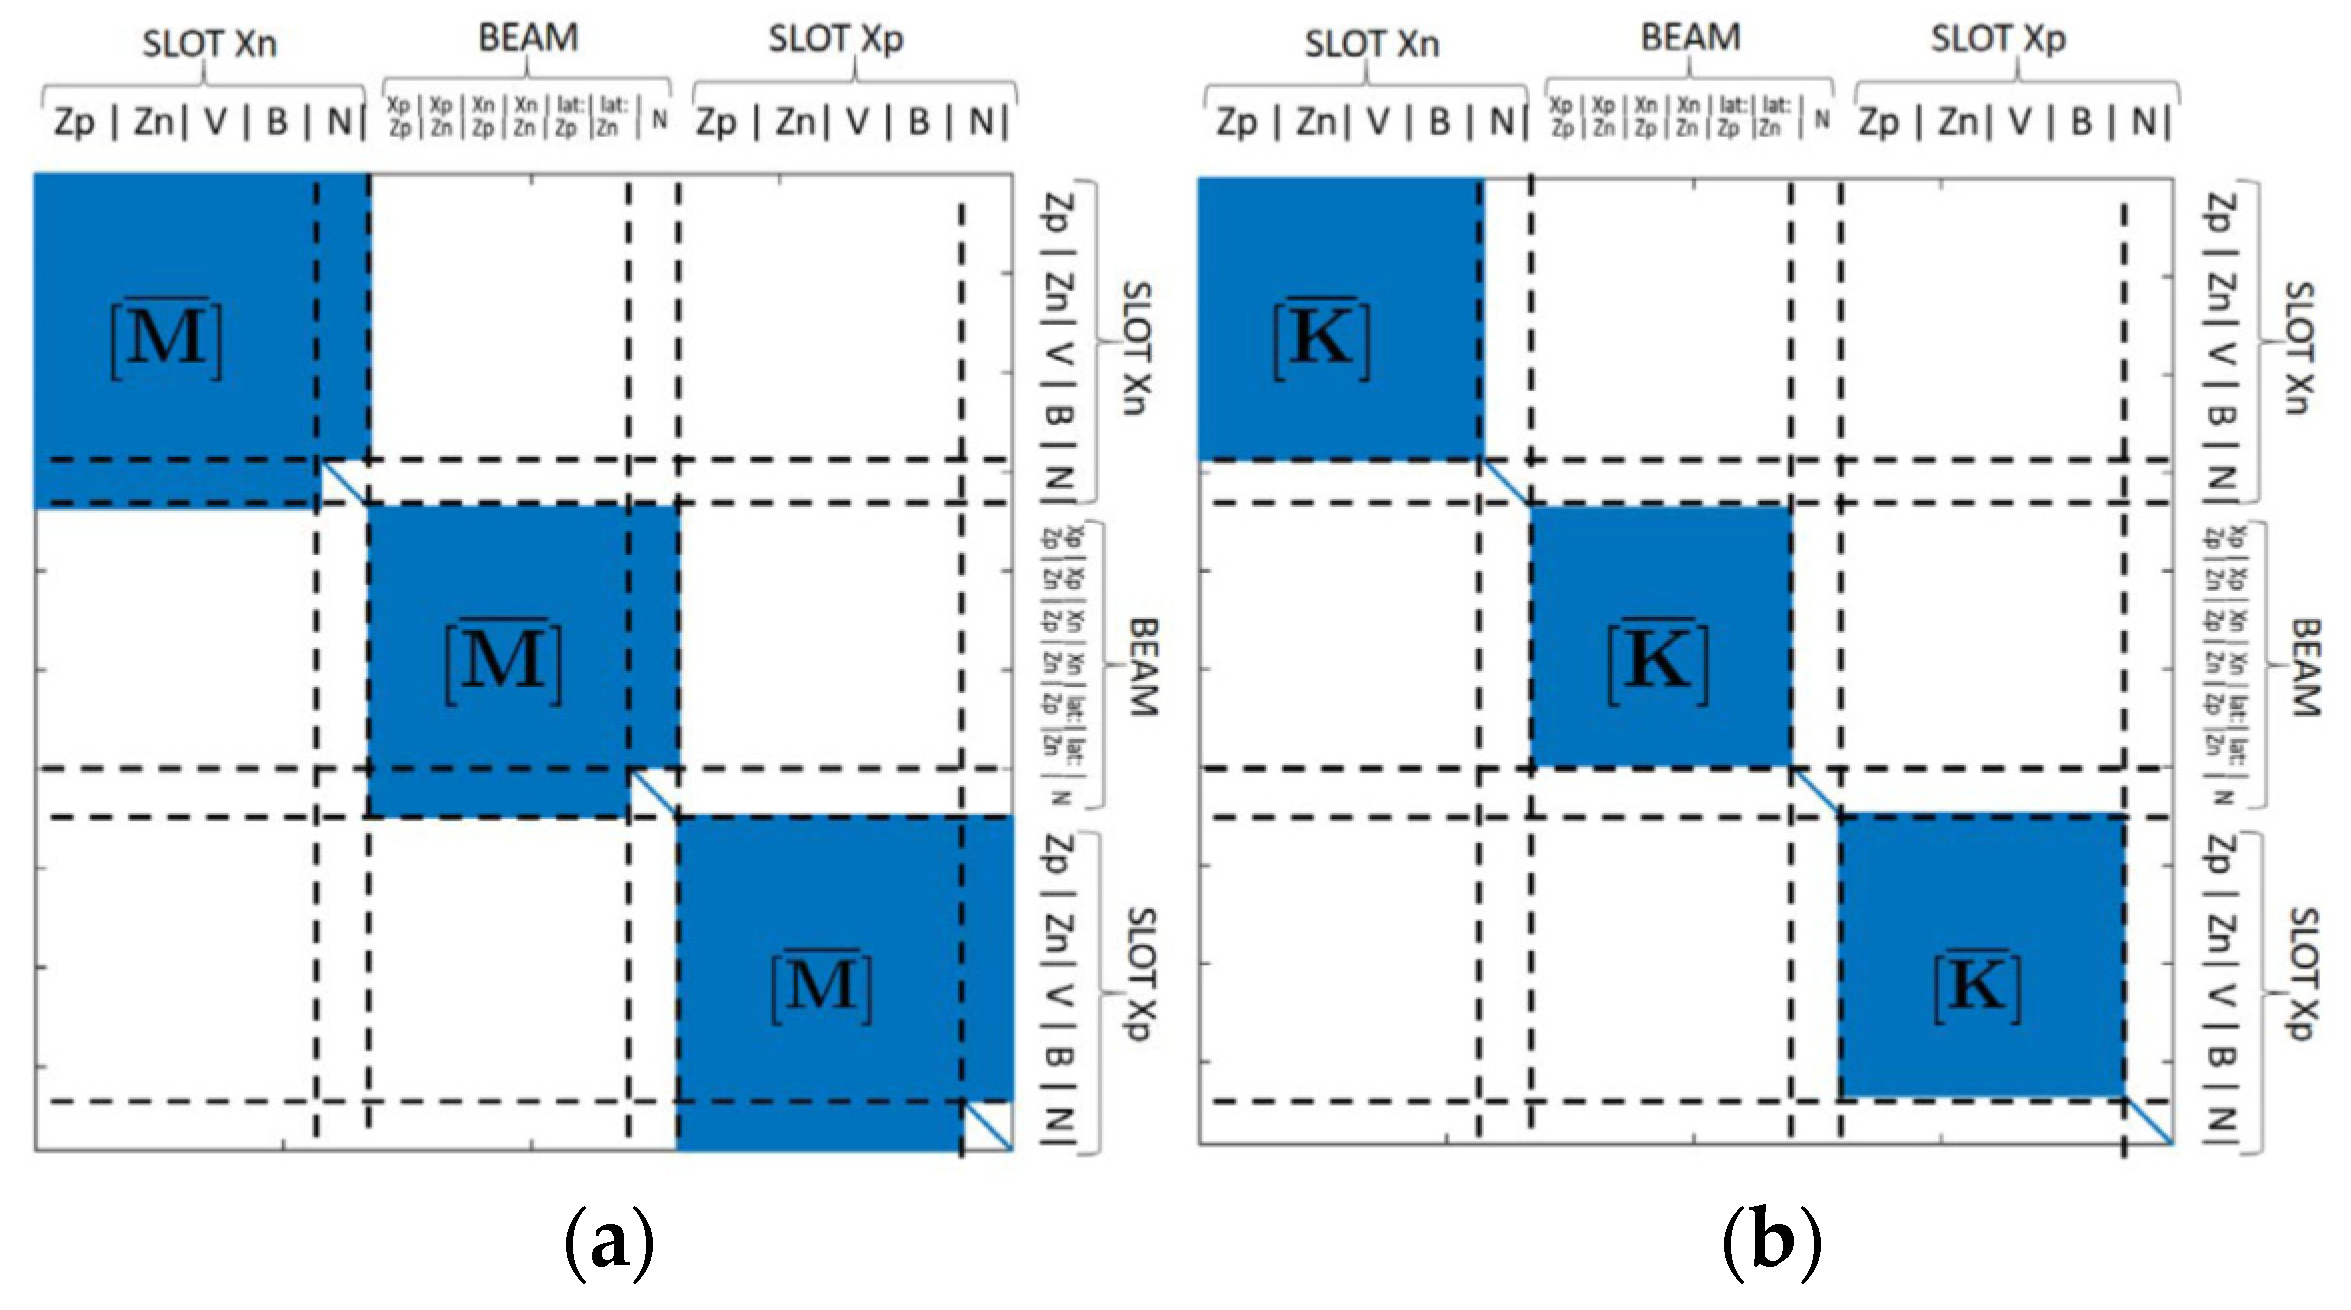
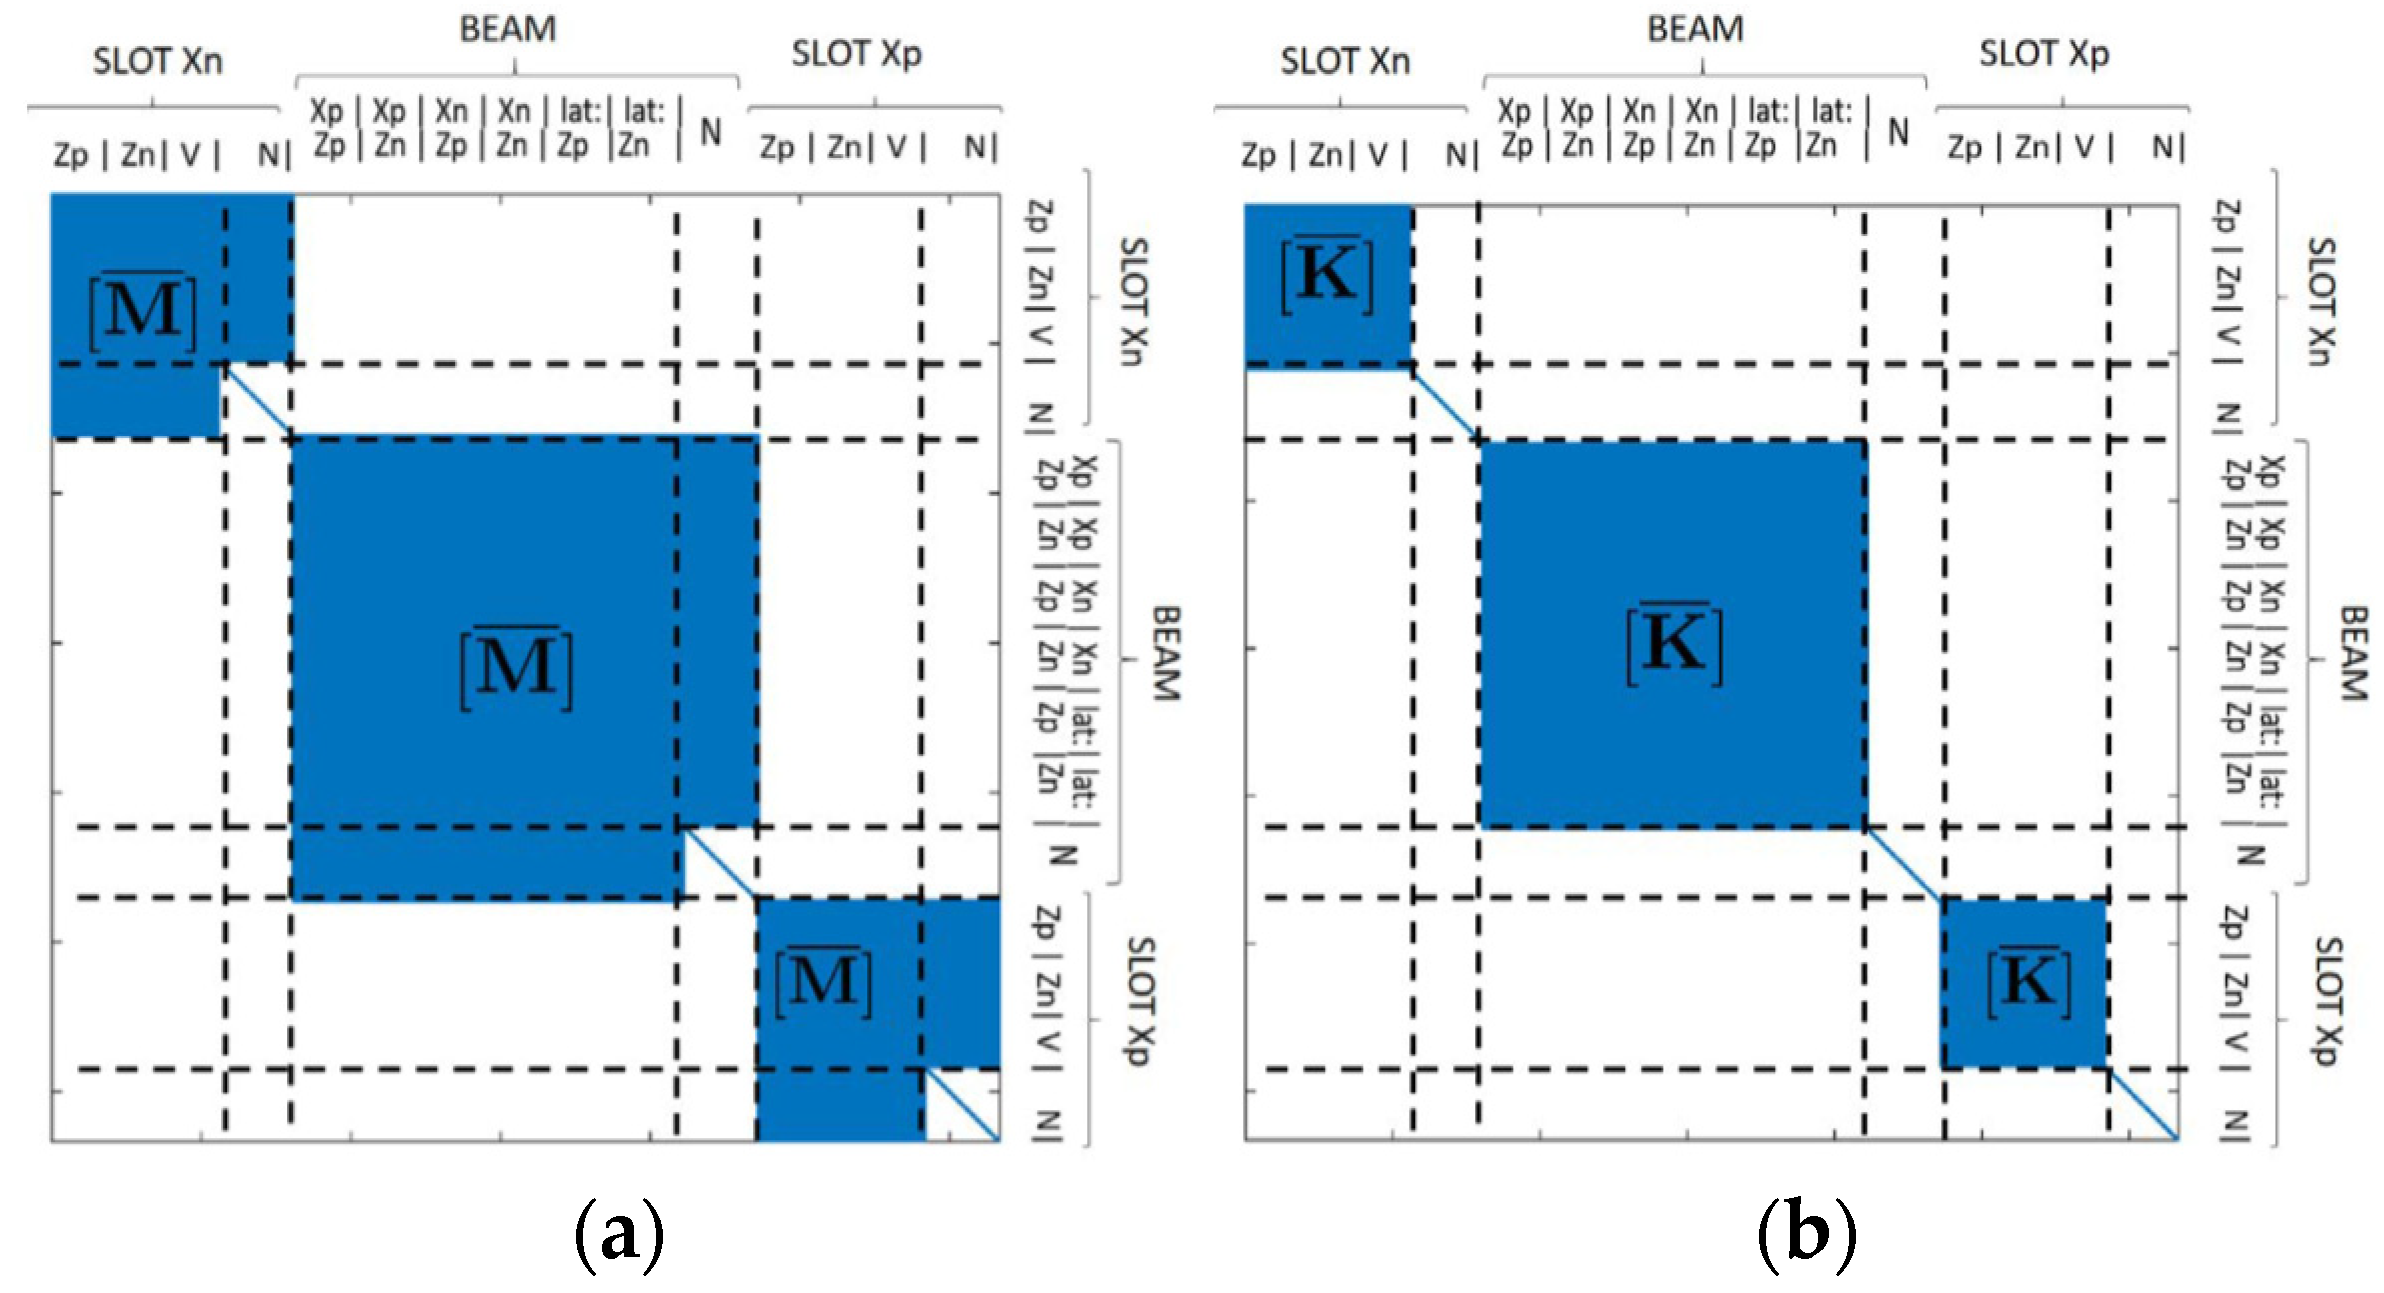
3.3. Assembly of Stiffness and Mass Matrices

The derived local matrices [ M ] and [ K ] from the reduced models of the beam and two supports are used to calculate the global matrices [ M G L O B ] and [ K G L O B ] of the assembly. As described in Figure 15, the degrees of freedom of the reduced models were ordered for both beam and slots.
By dividing the degrees of freedom into two categories, namely free (F) and the constrained (C), it was possible to split the mass and stiffness matrices as:
( ω 2 [ M G L O B ] + [ K G L O B ] ) { q } = { 0 } + { R v } { ( ω 2 [ M F F ] + [ K F F ] ) { q F } = { 0 } ( ω 2 [ M C F ] + [ K C F ] ) { q F } = { R v }  
The modal analysis was then carried out using the matrices [ M F F ] and [ K F F ] , obtained from the global matrices [ M G L O B ] and [ K G L O B ] by eliminating the rows and columns corresponding to the degrees of freedom of the bases of the two slots. The structure of the resulting matrices is exhibited in Figure 16.
To insert the contact elements to the interfaces, it is necessary to define a connectivity matrix to associate the degrees of freedom of the coinciding nodes of the blade simulacrum and supports. Each row of the connectivity matrix corresponds to a pair of coinciding nodes between which a contact element operates. Coincident nodes were identified by looking for nodes with the same identification number used in commercial finite element software, according to the procedure explained above. Linear contact elements were created, i.e., contact elements that do not allow sliding nor the separation at the contact region. The stiffness matrix for the contact elements in the local coordinate system is:
[ K ( e ) L ] = [ k n 0 0 k n 0 0 0 k t 0 0 k t 0 0 0 k t 0 0 k t k n 0 0 k n 0 0 0 k t 0 0 k t 0 0 0 k t 0 0 k t ]  
The rotation matrix [Λ] was used to switch from the local to the global coordinate system. Indeed, since the total potential energy is invariant with respect to the reference system, the global stiffness matrix becomes:
[ K ( e ) G ] = [ Λ ( e ) ] T [ K ( e ) L ] [ Λ ( e ) ]  
where
[ Λ ] = [ c 0 s 0 0 0 0 1 0 0 0 0 s 0 c 0 0 0 0 0 0 c 0 s 0 0 0 0 1 0 0 0 0 s 0 c ]
with c and s denoting the trigonometric functions cos and sin. Eventually, the corresponding stiffness matric of contact elements for each pair of coincident nodes was inserted into the global matrix of the assembly [ ( K G L O B ) F F ] (see Figure 17).

3.4. Determination of Stiffness, k n and k t

The global matrix [ ( K G L O B ) F F ] is a function of the parameters k n   and   k t . To compare the natural frequencies with experimental outcomes, they need to be measured during the complete adhesion of the contact regions. Specifically, by examining the concerning curves (see Figure 9 and Figure 11), the bandwidth in which the frequency has a rather constant trend was selected, to indicate the complete contact adhesion.
The frequencies of FEM model (for each axial traction force) were obtained from the classical linear modal analysis. Considering the global matrices [ M ] = [ ( M G L O B ) F F ] and [ K ] = [ ( K G L O B ) F F ] , the governing equations of motion are:
[ M ] { q ¨ ( t ) } + [ K i ( k n ,   k t ) ] { q ( t ) } = 0       F a x   i t h  
With the following linear harmonic solution:
{ q ( t ) } = { q }   e i ω t     ( ω 2 M + K i ) { q } = 0  
Excluding the trivial solution {q} = 0, other possible solutions (eigenvectors) are obtained for the eigenvalues of the generalized problem ω 2 , for which the matrix ( ω 2 M + K ) is not invertible. This condition is verified when:
d e t ( ω 2 M + K i ( k n ,   k t ) ) = 0         F i  
from which ω n , i 2 are the roots of the characteristic polynomial and the eigenvalues:
j = 0 N d o f a j ( k n ,   k t ) ( ω n ,   i 2 ) j = 0       F i  
The shape of each depends on the coefficients   a j , which are nonlinear functions of the parameters k n and k t . Thus, the frequencies depend non-linearly on these parameters, which required an iterative local or global method to find the solution ( k n , k t ).
By making a comparison between the measured frequencies and those from the FEM model, for the first and second flexural modes (1B and 2B):
  ( f 1 B ) F E M ( k n ,   k t ) ( f 1 B ) M e a s u r e d = 0     ( f 2 B ) F E M ( k n ,   k t ) ( f 2 B ) M e a s u r e d = 0
which can be written in the following vector form:
{ Δ f } = { ( Δ f ) 1 B ( k n ,   k t ) ( Δ f ) 2 B   ( k n ,   k t )   } = { 0 0 }  
The function { Δ f } does not vanish at any point, i.e., there are no ( k n , k t ) such as to satisfy both Equation (20); however, it can be minimized. Therefore, the system of equations becomes:
{ | Δ f | } < δ { Δ f }  
This system was solved with a global search within the domain ( k n , k t ) for satisfying the following condition:
| | { Δ f } | | < δ | | { Δ f } | |  
where | | { Δ f } | | is the Euclidean norm of the vector { Δ f } and δ | | { Δ f } | | is the error, calculated with the theory of error propagation and σ defines the stress.
Following the procedure explained above, the parameters k n and k t are obtained for i-th axial force and reported in Table 1.
Eventually the frequencies obtained from the experiment are compared with those from the presented numerical approach and the analytical method in Figure 18. The theoretical data are extracted from the beam model of Euler-Bernoulli (constrained at both ends), modified to consider the stiffening effect of the traction force. The discrepancies between the calculated frequencies from the theoretical model for low traction values can be attributed to the microslip at the contact regions. In fact, that is why the axial traction forces greater than 12 kN are taken into account, where the contacts behave linearly, in the numerical model.

4. Conclusions

The present work is devoted to identifying the corresponding parameters of a type of contact element, namely normal stiffness, and tangential stiffness. The contact element intends to simulate the vibration of a turbine blade connected to its disc via a dovetail joint. For that matter, an experimental procedure was carried out, with the aim of realizing the modal parameters (frequency and damping) of system that resembles the disc-blade configuration. The first and second flexural modes of the experimental setup were extracted from its free decay, when excited with a frequency close to that of the mode shapes in question. Then, the collected data along with a comprehensive numerical method were utilized for determining the normal and tangential stiffness of the system. Along this path, finite element model of the configuration was built in commercial finite element software, and the corresponding stiffness and mass matrices were imported in a numeric computing environment after applying the Craig–Bampton reduction technique. Once the global matrices of the system were obtained and assembled with the global stiffness matrix of the contact element, the concerning parameters were extracted through an iterative process. Acceptable agreement was found between the obtained values and those from the measurements and analytical models.

Author Contributions

Conceptualization, H.D. and D.B.; methodology, H.D.; software, M.G.; validation, H.D., D.B. and M.G.; formal analysis, H.D.; investigation, D.B.; resources, H.D.; data curation, H.D.; writing—original draft preparation, H.D.; writing—review and editing, D.B.; visualization, M.G.; supervision, D.B.; project administration, H.D.; funding acquisition, H.D. All authors have read and agreed to the published version of the manuscript.

Funding

This research received no external funding.

Institutional Review Board Statement

Not applicable.

Informed Consent Statement

Not applicable.

Data Availability Statement

Generated during the study.

Conflicts of Interest

The authors declare no conflict of interest.

References

  1. Mindlin, R.D.; Mason, W.P.; Osmer, T.F.; Deresiewicz, H. Effects of an Oscillating Tangential Force on the Contact Surfaces of Elastic Spheres. Proc. First US Natl. Congr. Appl. Mech. 1952, 1951, 203–208. [Google Scholar]
  2. Johnson, K.L. Surface Interaction between Elastically Loaded Bodies under Tangential Forces. Proc. R. Soc. Lond. Ser. A Math. Phys. Sci. 1955, 230, 531–548. [Google Scholar] [CrossRef]
  3. Goodman, L.E.; Brown, C.B. Energy Dissipation in Contact Friction: Constant Normal and Cyclic Tangential Loading. J. Appl. Mech. Trans. ASME 1960, 29, 17–22. [Google Scholar] [CrossRef]
  4. Filippi, S.; Akay, A.; Gola, M.M. Measurement of Tangential Contact Hysteresis during Microslip. J. Tribol. 2004, 126, 482–489. [Google Scholar] [CrossRef]
  5. Filippi, S.; Rodrigues, E.B.; Gola, M.M. Experimental Characterization of Contact Hysteresis at High Temperatures. In Proceedings of the ASME Turbo Expo, Barcelona, Spain, 19 September 2006; American Society of Mechanical Engineers Digital Collection. Volume 5, Part B. pp. 893–902. [Google Scholar]
  6. Lavella, M.; Botto, D.; Gola, M.M. Test Rig for Wear and Contact Parameters Extraction for Flat-on-Flat Contact Surfaces. In Proceedings of the American Society of Mechanical Engineers, Tribology Division, TRIB, Copenhagen, Denmark, 9 February 2011; American Society of Mechanical Engineers Digital Collection. pp. 307–309. [Google Scholar]
  7. Schwingshackl, C.W.; Petrov, E.P.; Ewins, D.J. Measured and Estimated Friction Interface Parameters in a Nonlinear Dynamic Analysis. Mech. Syst. Signal Process. 2012, 28, 574–584. [Google Scholar] [CrossRef]
  8. Stanbridge, A.B.; Ewins, D.J.; Sanliturk, K.Y.; Ferreira, J.V. Experimental Investigation of Dry Friction Damping and Cubic Stiffness Non-Linearity. In Proceedings of the ASME Design Engineering Technical Conference, Pittsburgh, PA, USA, 11 November 2001; American Society of Mechanical Engineers Digital Collection. Volume 6B, pp. 2141–2148. [Google Scholar]
  9. Afzal, M.; Arteaga, I.L.; Kari, L. An analytical calculation of the Jacobian matrix for 3D friction contact model applied to turbine blade shroud contact. J. Comput. Struct. 2006, 177, 204–217. [Google Scholar] [CrossRef] [Green Version]
  10. Afzal, M.; Arteaga, I.L.; Kari, L. Numerical analysis of multiple friction contacts in bladed disks. Int. J. Mech. Sci. 2018, 137, 224–237. [Google Scholar] [CrossRef]
  11. Liu, T.; Zhang, D.; Xie, Y. A Nonlinear vibration analysis of forced response for a bladed-disk with dry friction dampers. J. Low Freq. Noise Vib. Act. Control 2019, 38, 1522–1539. [Google Scholar] [CrossRef]
  12. She, H.; Li, C.; Tang, Q.; Wen, B. Nonlinear Vibration Analysis of a Rotating Disk-Beam System Subjected to Dry Friction. Shock Vib. 2020, 2020, 19. [Google Scholar] [CrossRef]
  13. Chaofeng, L.; Xiaowen, L.; Qiansheng, T.; Zilin, C. Modeling and nonlinear dynamics analysis of a rotating beam with dry friction support boundary conditions. J. Sound Vib. 2021, 498, 115978. [Google Scholar] [CrossRef]
  14. Goodman, L.E.; Klumpp, J.H. Analysis of Slip Damping with Reference to Turbine-Blade Vibration. J. Appl. Mech. 1956, 23, 421–429. [Google Scholar] [CrossRef]
  15. Allara, M.; Filippi, S.; Gola, M.M. An Experimental Method for the Measurement of Blade-Root Damping. In Proceedings of the ASME Turbo Expo, Barcelona, Spain, 19 September 2006; American Society of Mechanical Engineers Digital Collection. Volume 5, Part B. pp. 903–912. [Google Scholar]
  16. Firrone, C.M.; Bertino, I. Experimental Investigation on the Damping Effectiveness of Blade Root Joints. Exp. Mech. 2015, 55, 981–988. [Google Scholar] [CrossRef]
  17. Asai, K.; Sakurai, S.; Kudo, T.; Ozawa, N.; Ikeda, T. Evaluation of Friction Damping in Dovetail Root Joints Based on Dissipation Energy on Contact Surfaces. In Proceedings of the ASME Turbo Expo, Orlando, FL, USA, 16 February 2009; American Society of Mechanical Engineers Digital Collection. Volume 6, pp. 301–313. [Google Scholar]
  18. Simmons, H.R.; Iyengar, V. Effect of Non-Uniform Blade Root Friction and Sticking on Disk Stresses. In Proceedings of the ASME International Conference, Denver, CO, USA, 1 January 2011; pp. 829–838. [Google Scholar]
  19. Umer, M.; Botto, D. Measurement of Contact Parameters on Under-Platform Dampers Coupled with Blade Dynamics. Int. J. Mech. Sci. 2019, 159, 450–458. [Google Scholar] [CrossRef]
  20. Li, D.; Botto, D.; Xu, C.; Liu, T.; Gola, M. A Micro-Slip Friction Modeling Approach and Its Application in Underplatform Damper Kinematics. Int. J. Mech. Sci. 2019, 161–162, 105029. [Google Scholar] [CrossRef]
  21. Li, D.; Xu, C.; Botto, D.; Zhang, Z.; Gola, M. A Fretting Test Apparatus for Measuring Friction Hysteresis of Bolted Joints. Tribol. Int. 2020, 151, 106431. [Google Scholar] [CrossRef]
  22. Li, D.; Botto, D.; Xu, C.; Gola, M. A New Approach for the Determination of the Iwan Density Function in Modeling Friction Contact. Int. J. Mech. Sci. 2020, 180, 105671. [Google Scholar] [CrossRef]
  23. Feldman, M. Non-Linear System Vibration Analysis Using Hilbert Transform--I. Free Vibration Analysis Method “Freevib”. Mech. Syst. Signal Process. 1994, 8, 119–127. [Google Scholar] [CrossRef]
  24. Craig, R.R.; Bampton, M.C.C. Coupling of Substructures for Dynamic Analyses. AIAA J. 1968, 6, 1313–1319. [Google Scholar] [CrossRef] [Green Version]
Figure 1. 3D model of dummy blade with dovetail joints at both ends.
Applsci 11 12008 g001
Figure 2. Support and traction system; Blade (a), mobile piece (b), fixed piece (c), handle (d), oil pump (e), hydraulic actuator handle (f), pressure gauge (g), hydraulic actuator (h).
Applsci 11 12008 g002
Figure 3. Input signal for shaker.
Applsci 11 12008 g003
Figure 4. Laser pointer (1B) and velocity measurement (2B) spots.
Applsci 11 12008 g004
Figure 5. Strain gauge configuration for strain measurement system.
Applsci 11 12008 g005
Figure 6. Example of a signal restricted to free decay range.
Applsci 11 12008 g006
Figure 7. Adopted Parks–McClellan FIR passband filter.
Applsci 11 12008 g007
Figure 8. Measurement points, (P1) for first and (P2) second flexural mode.
Applsci 11 12008 g008
Figure 9. Damping as a function of vibration amplitude for first flexural mode.
Applsci 11 12008 g009
Figure 10. Frequency as a function of vibration amplitude for first flexural mode.
Applsci 11 12008 g010
Figure 11. Frequency and damping versus vibration amplitude for different values of effective I_RMS: (a) I_RMS = 2.3 A, (b) I_RMS = 2.7 A, and (c) I_RMS = 3.1 A.
Applsci 11 12008 g011aApplsci 11 12008 g011b
Figure 12. (a) A dovetail joint; (b) diagram of contact element.
Applsci 11 12008 g012
Figure 13. Detail of dovetail joint in FEM model with nodes at contact interfaces. A: SlotContact_Xp_Zp_Nodes. B: SlotContact_Xp_Zn_Nodes.
Applsci 11 12008 g013
Figure 14. Master nodes for reduced model: (a) support and (b) beam.
Applsci 11 12008 g014
Figure 15. Assembly of super-element: (a) mass matrices and (b) stiffness matrices.
Applsci 11 12008 g015
Figure 16. Global matrices considering constraints: (a) mass matrix and (b) stiffness matrix.
Applsci 11 12008 g016
Figure 17. Assembly of contact elements into global stiffness matrix.
Applsci 11 12008 g017
Figure 18. Obtained frequencies from experimental, numerical, and analytical approaches: (a) first flexural mode and (b) second flexural mode.
Applsci 11 12008 g018
Table 1. Obtained results of search for k n and k t .
F k n σ n n δ k n / k n k t σ t t δ k t / k t
[ k N ] [ N / m m ] [ N / m m 2 ] [ % ] [ N / m m ] [ N / m m 2 ] [ % ]
1241,428.64866.611.768,285.76587.210.2
1450,000.010,042.720.161,428.610,822.917.6
1650,000.05439.410.972,857.16550.79.0
1855,714.39546.317.175,714.311,395.615.1
2058,571.411,672.819.984,285.714,891.417.7
2261,428.616,485.426.884,285.719,768.323.5
Publisher’s Note: MDPI stays neutral with regard to jurisdictional claims in published maps and institutional affiliations.

