
Distraction Potential of Vehicle-Based On-Road Projection

 , , ,
, , , 
Abstract
:1. Introduction
1.1. State of the Art
1.2. Definition of Distraction
2. Study Design
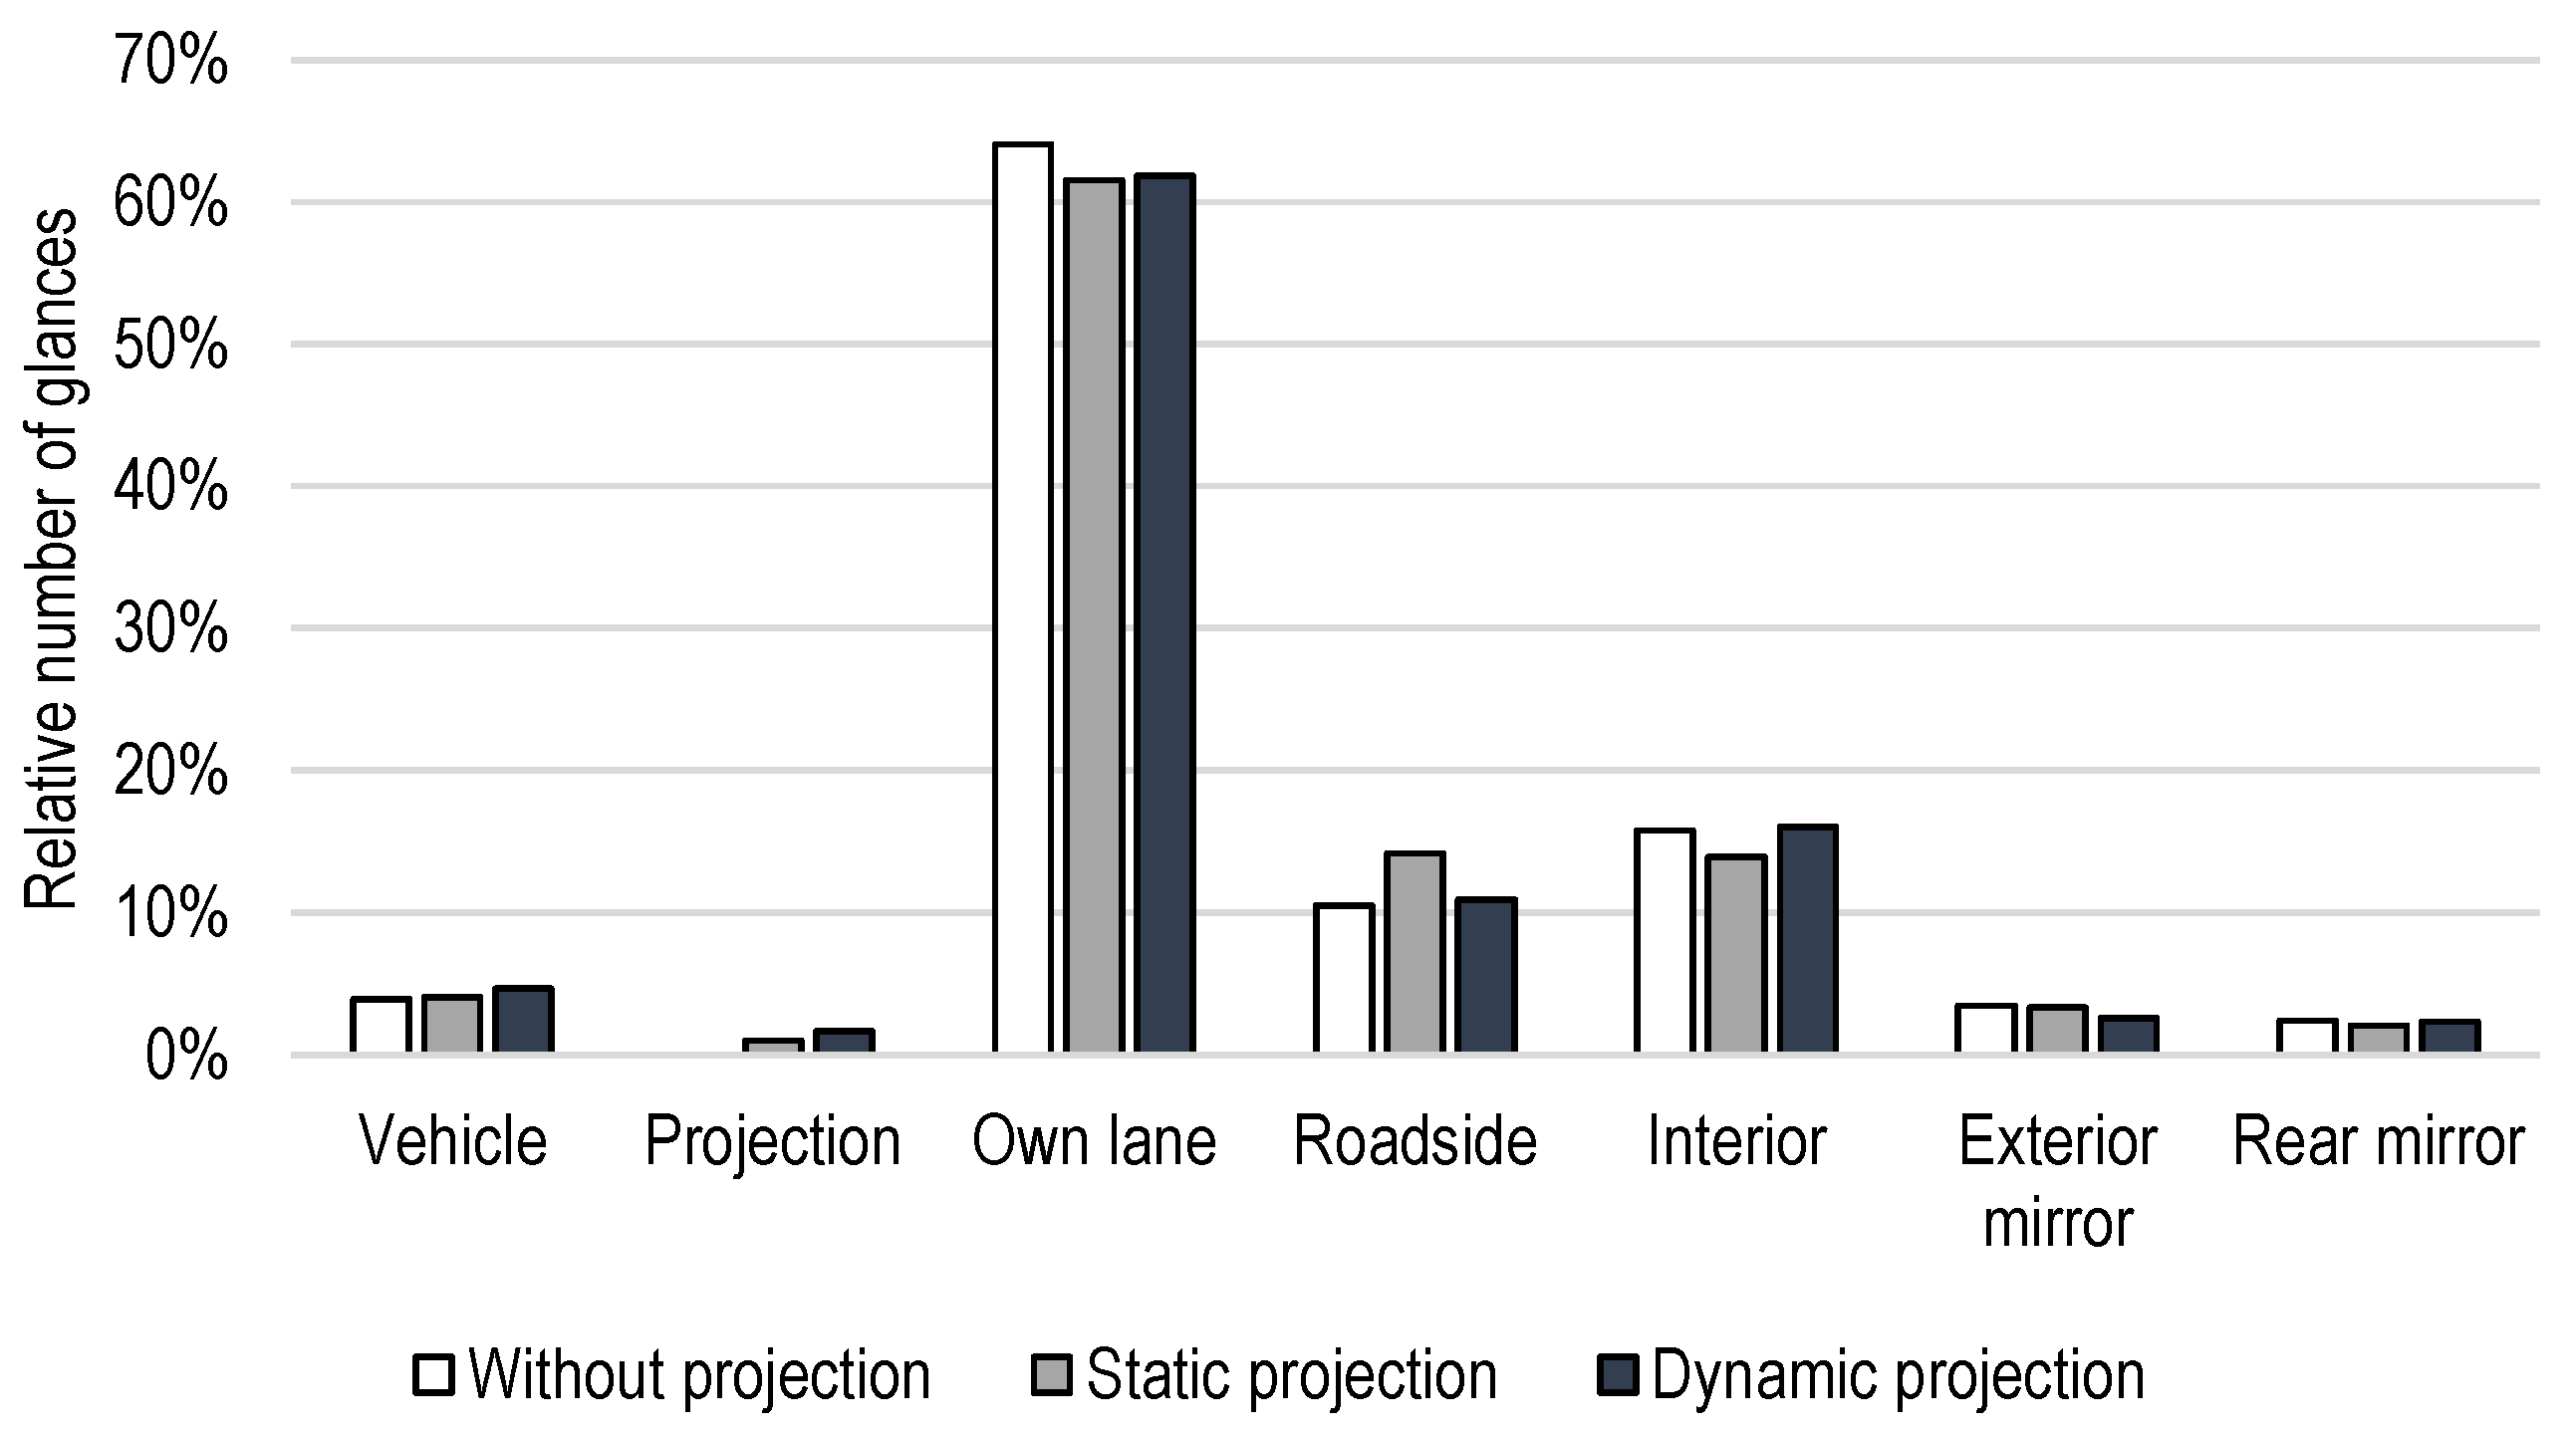
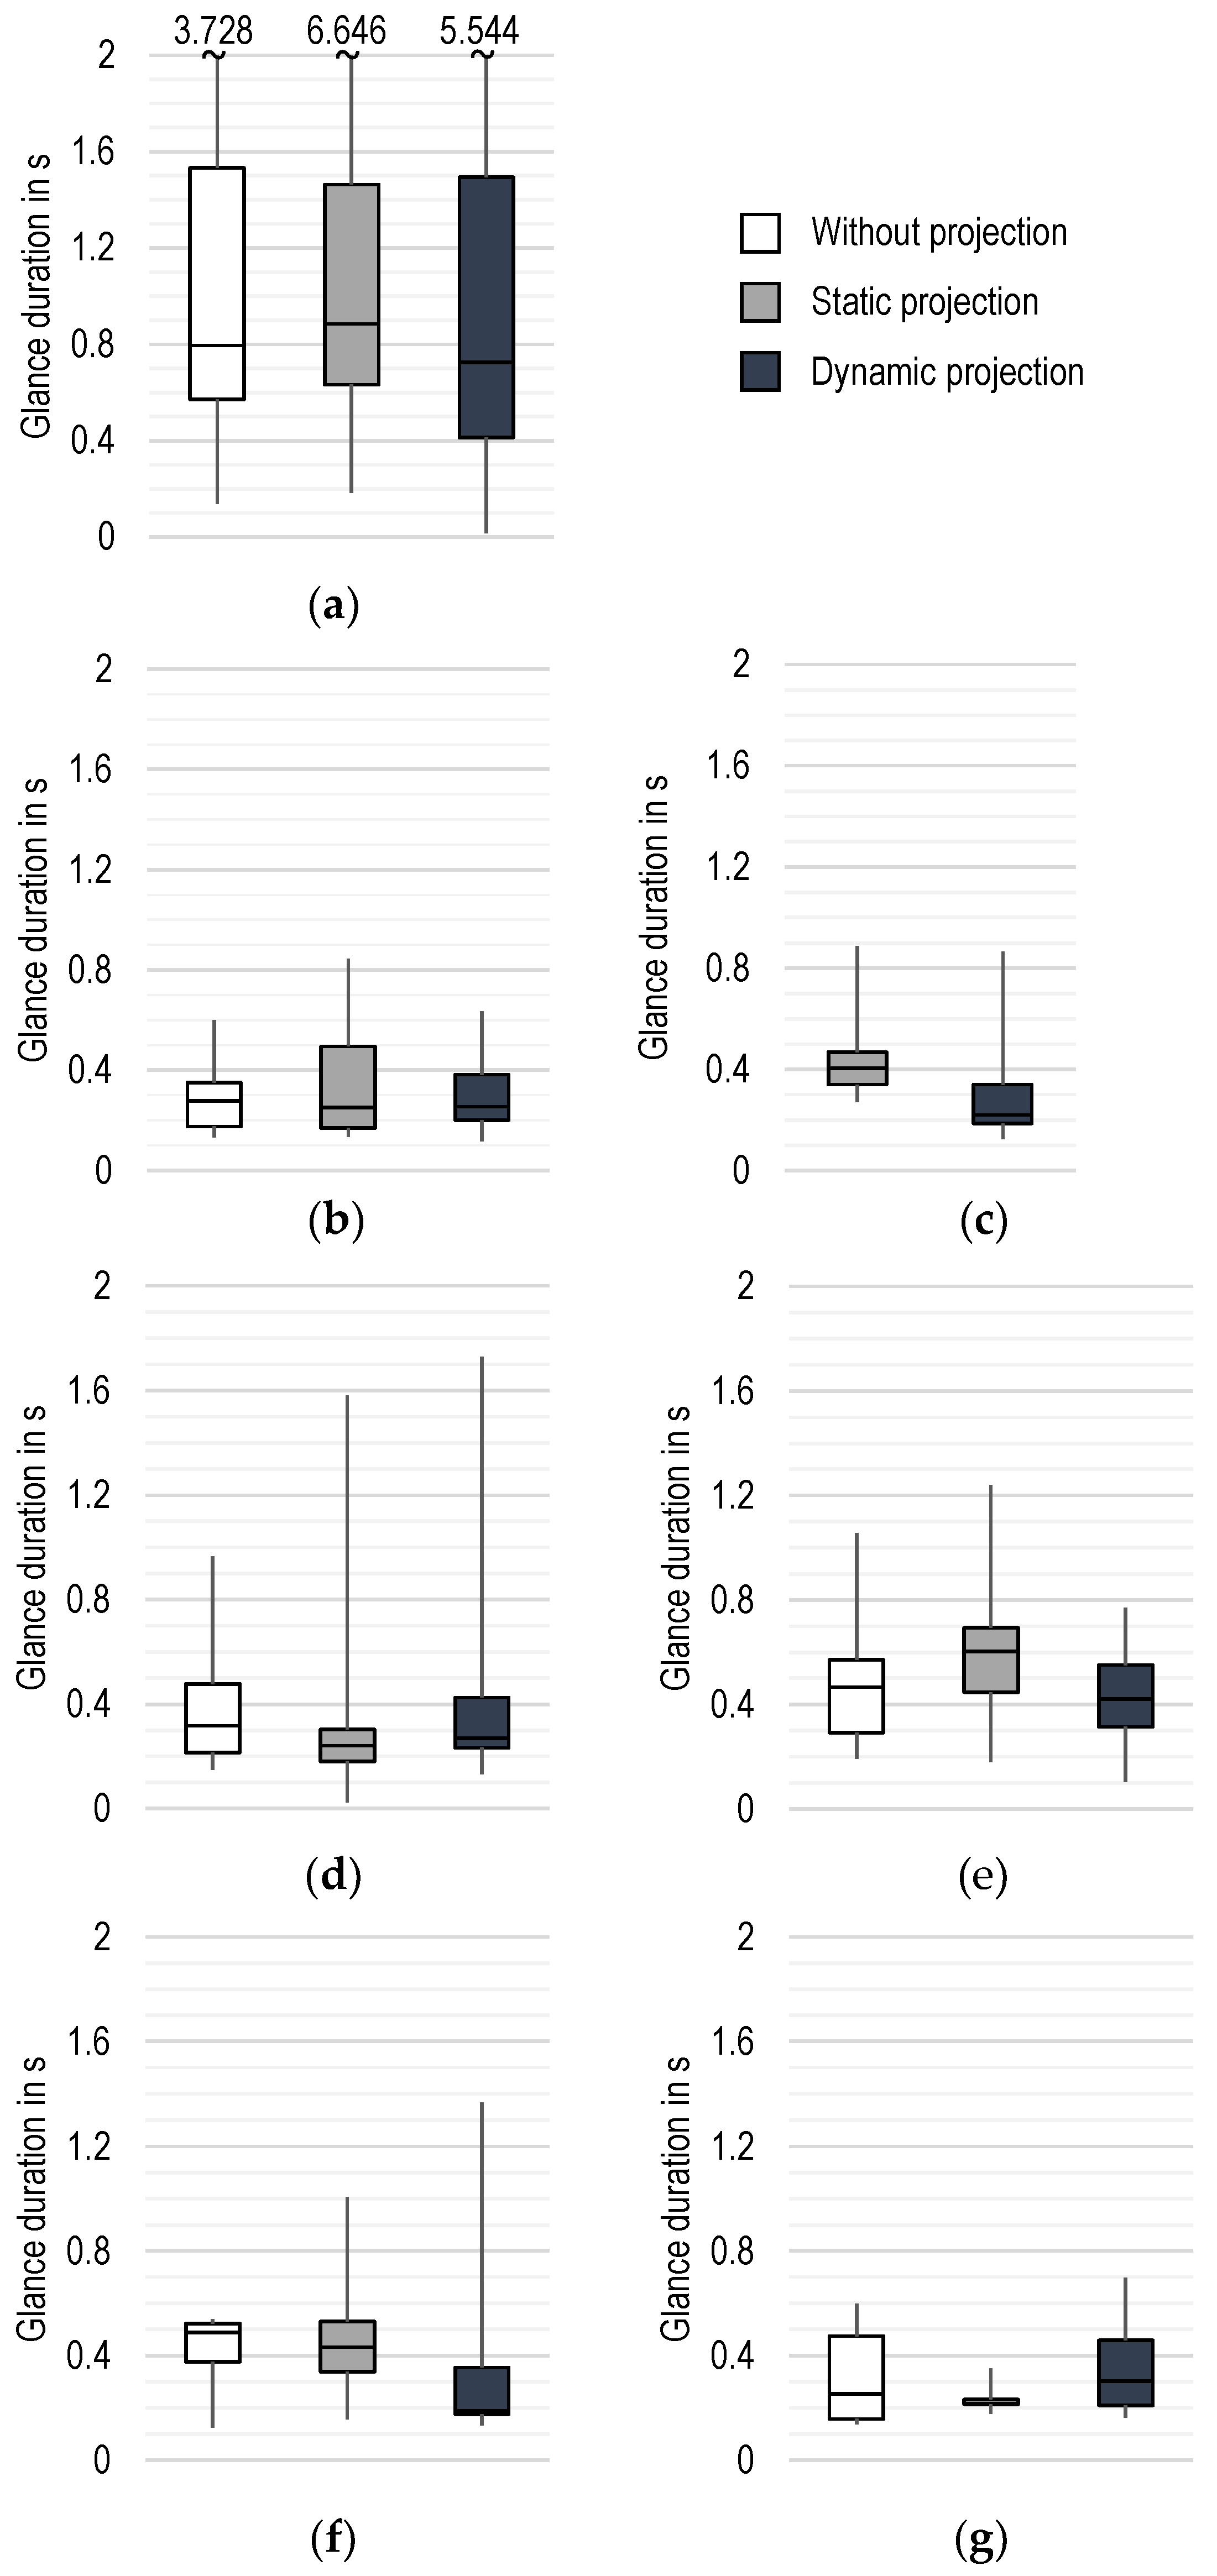
- How long do test persons look at the projections?
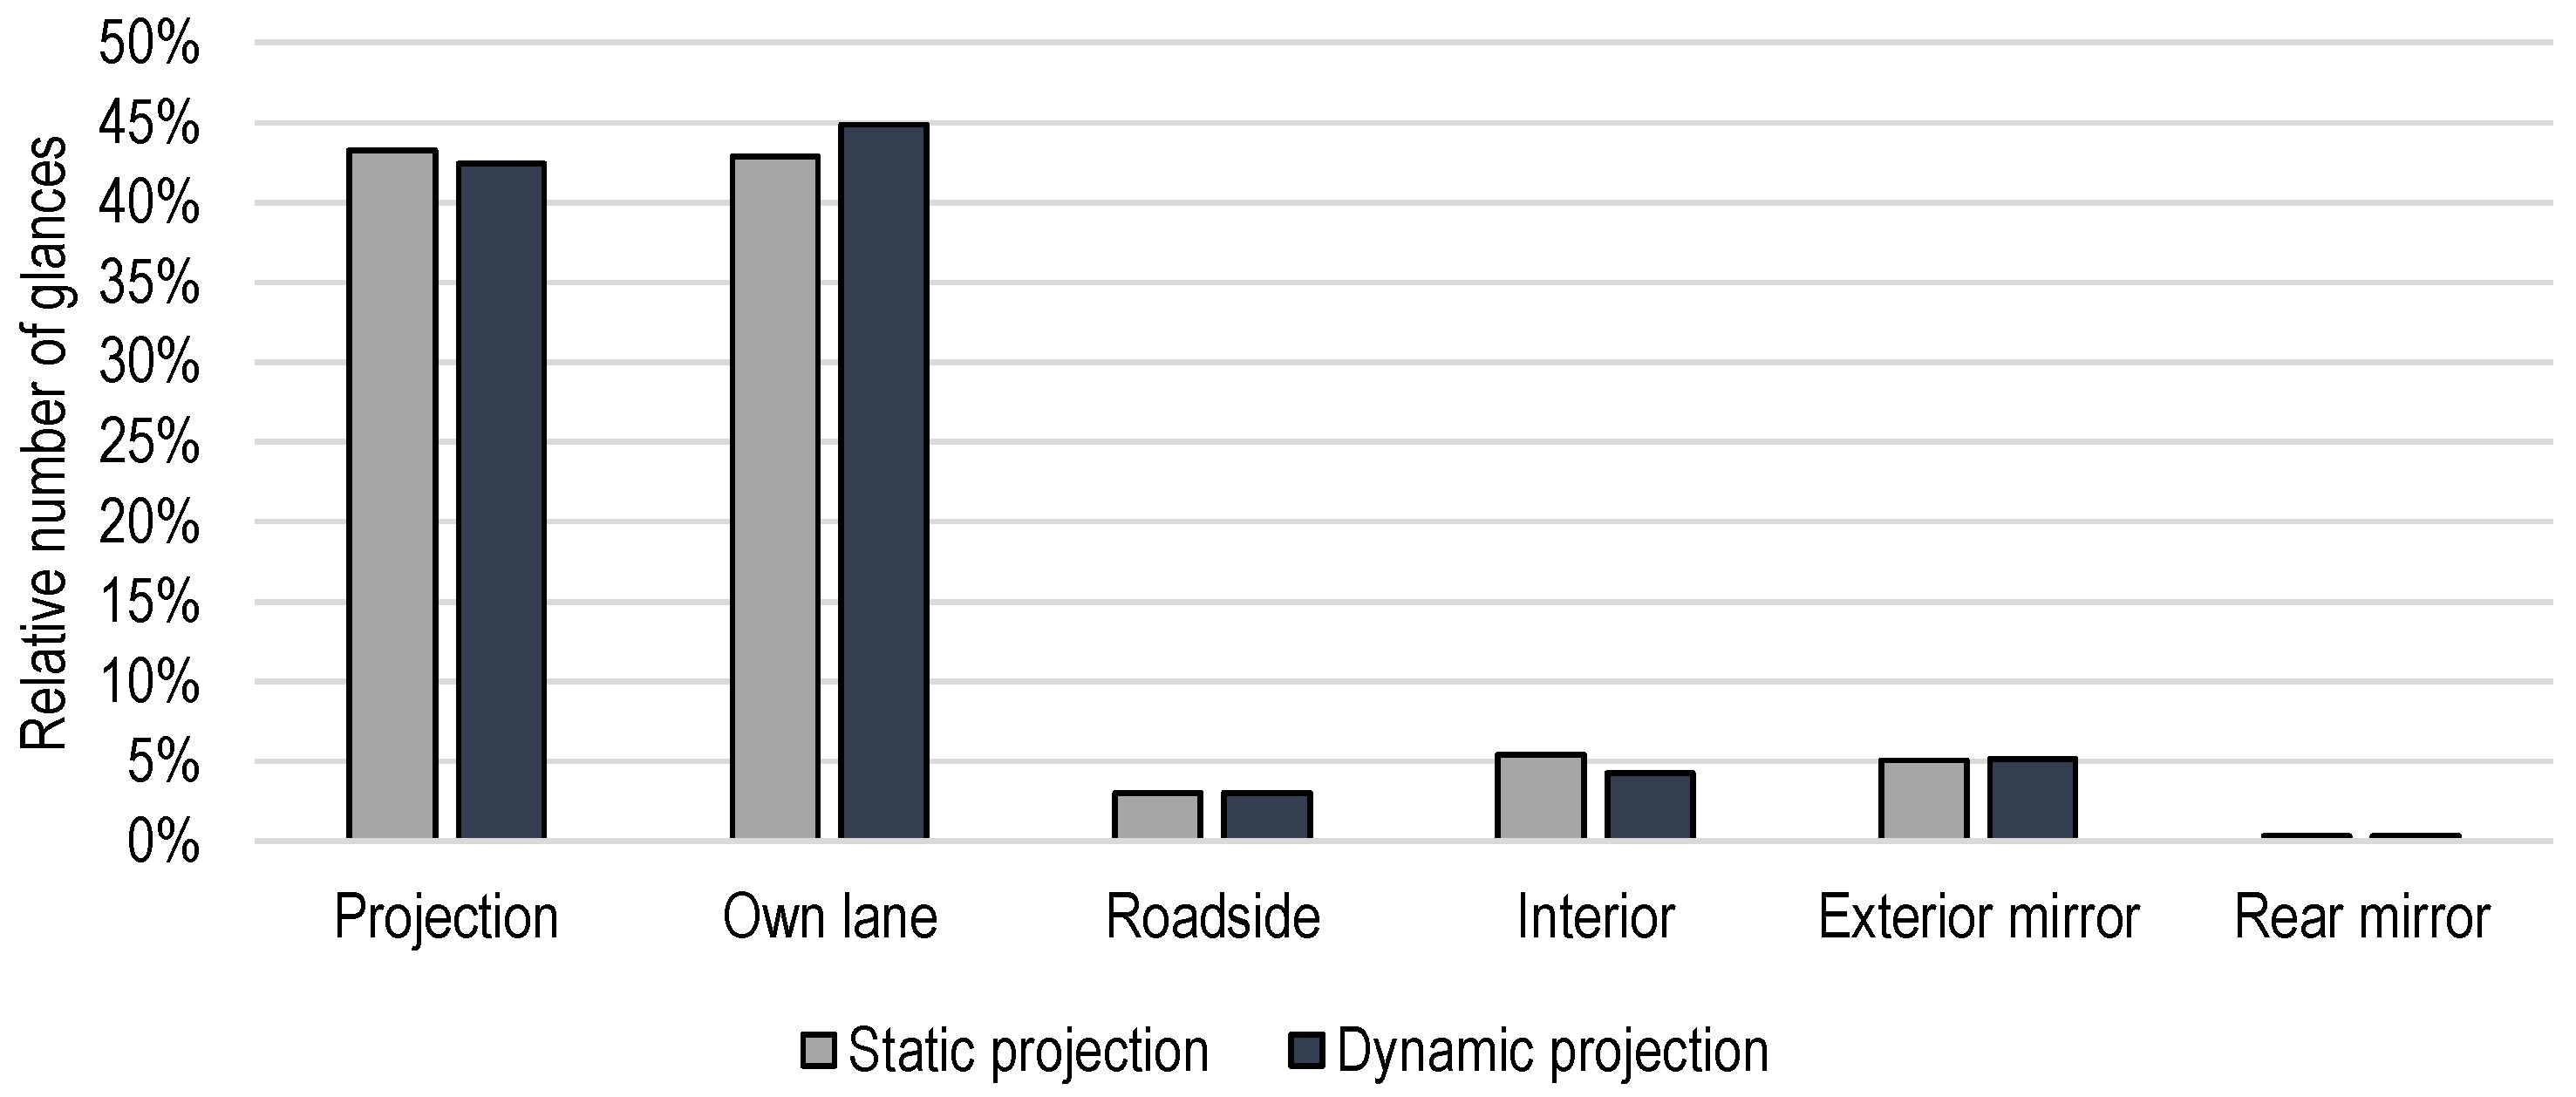
- Is there a difference in the gaze behavior between static and dynamic projections?
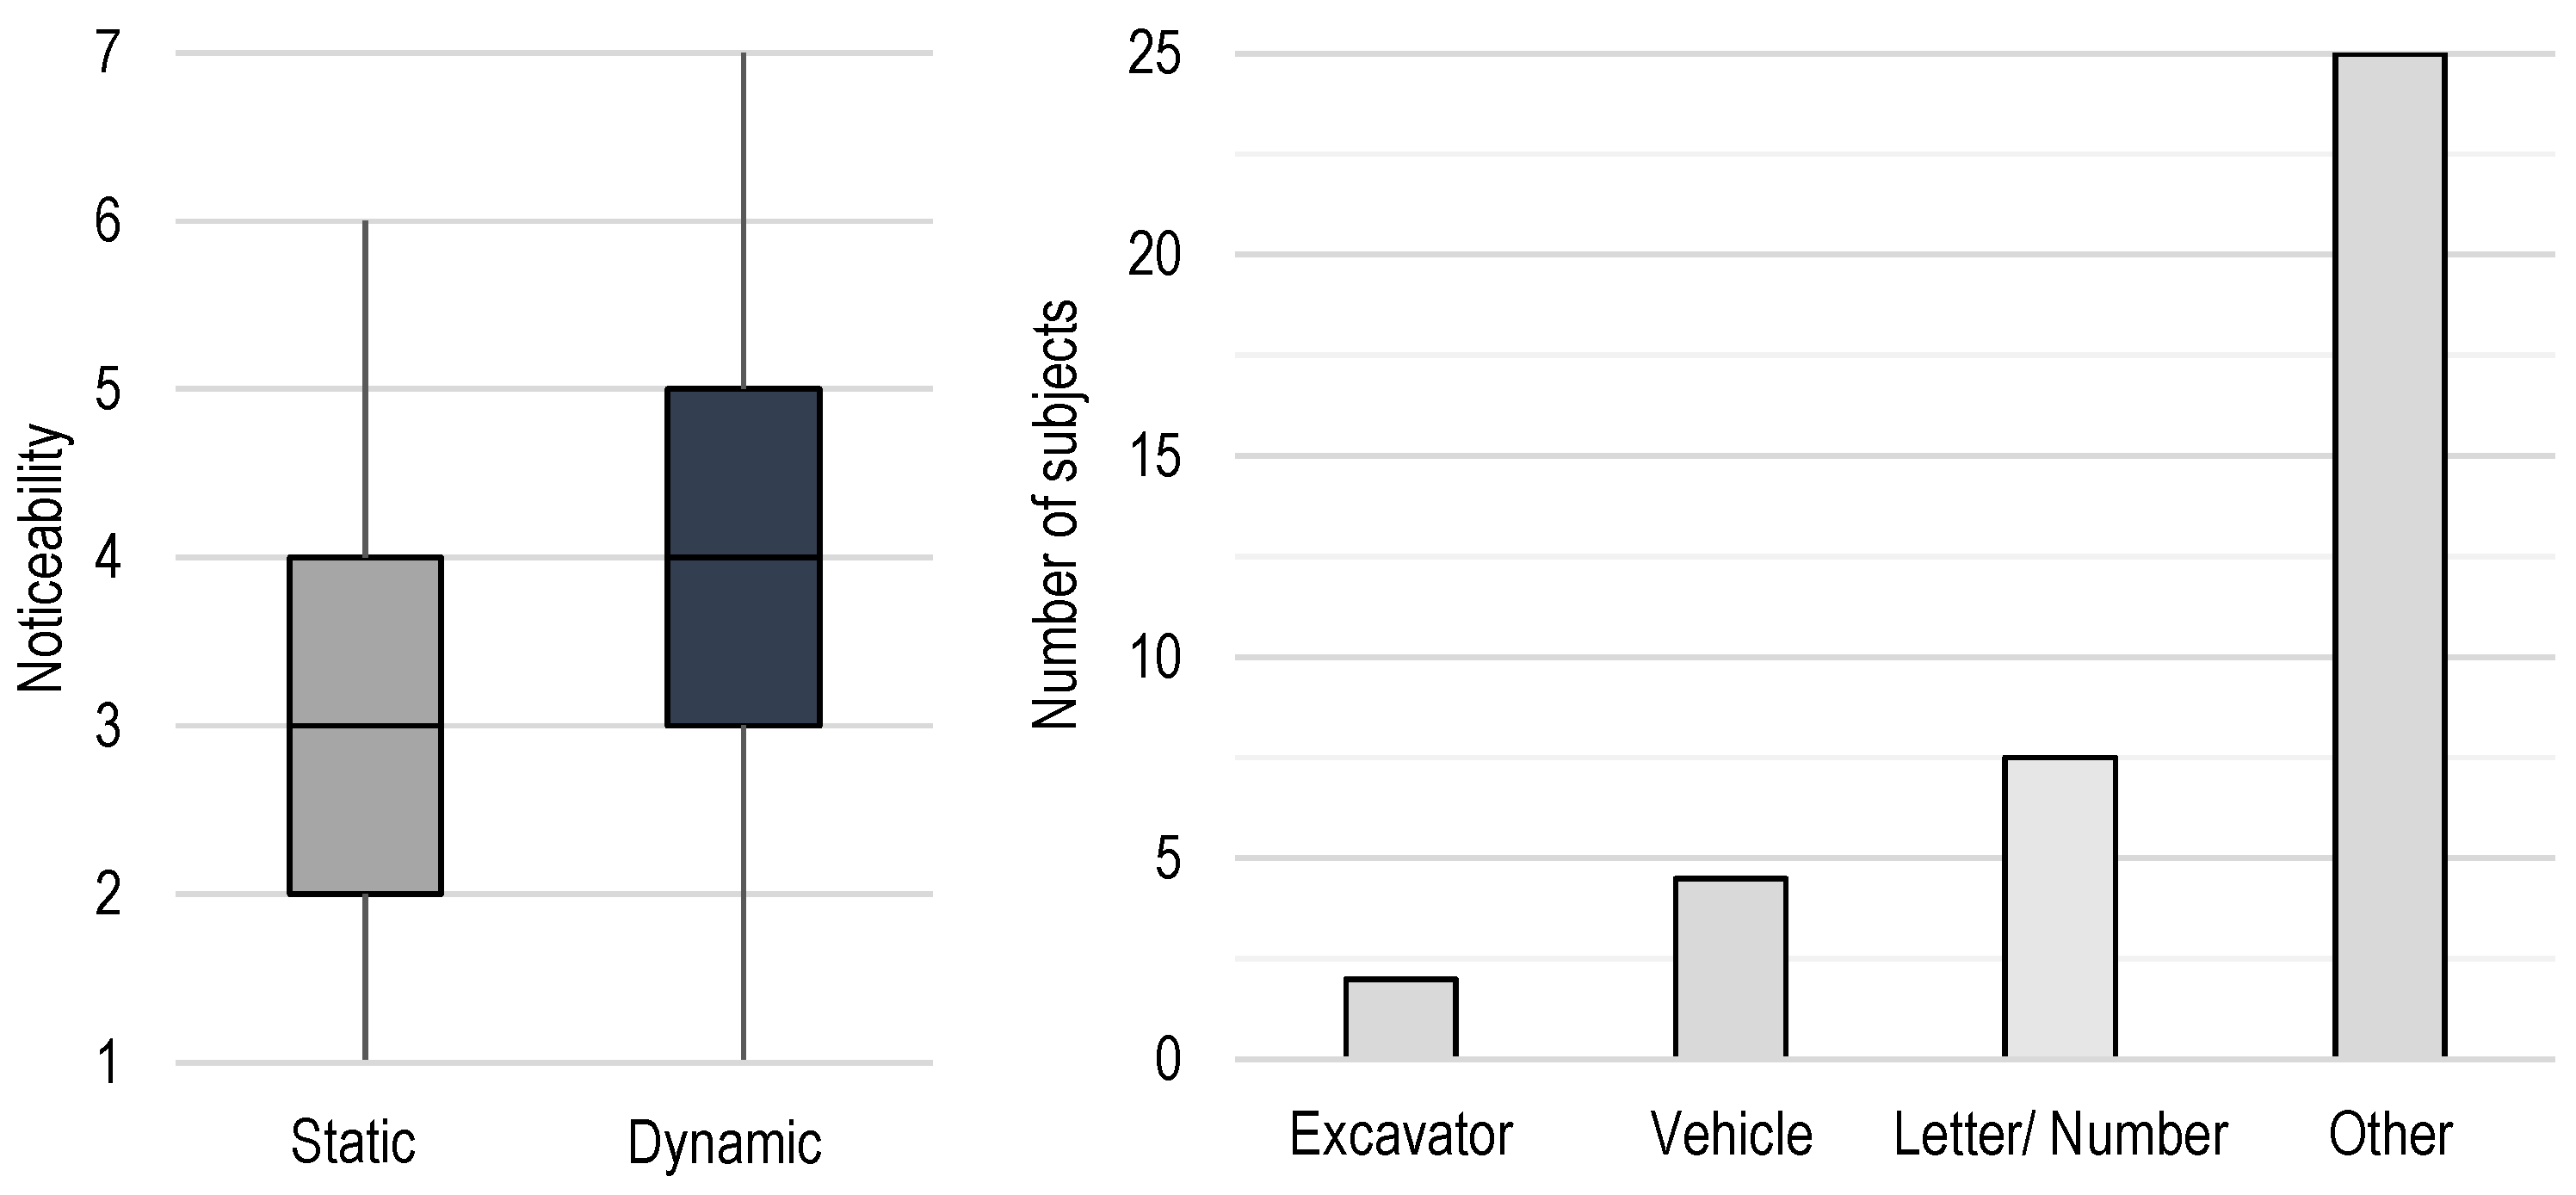
- Do the test persons consciously see the projections?
- How well is the projected symbol perceived by the test persons?
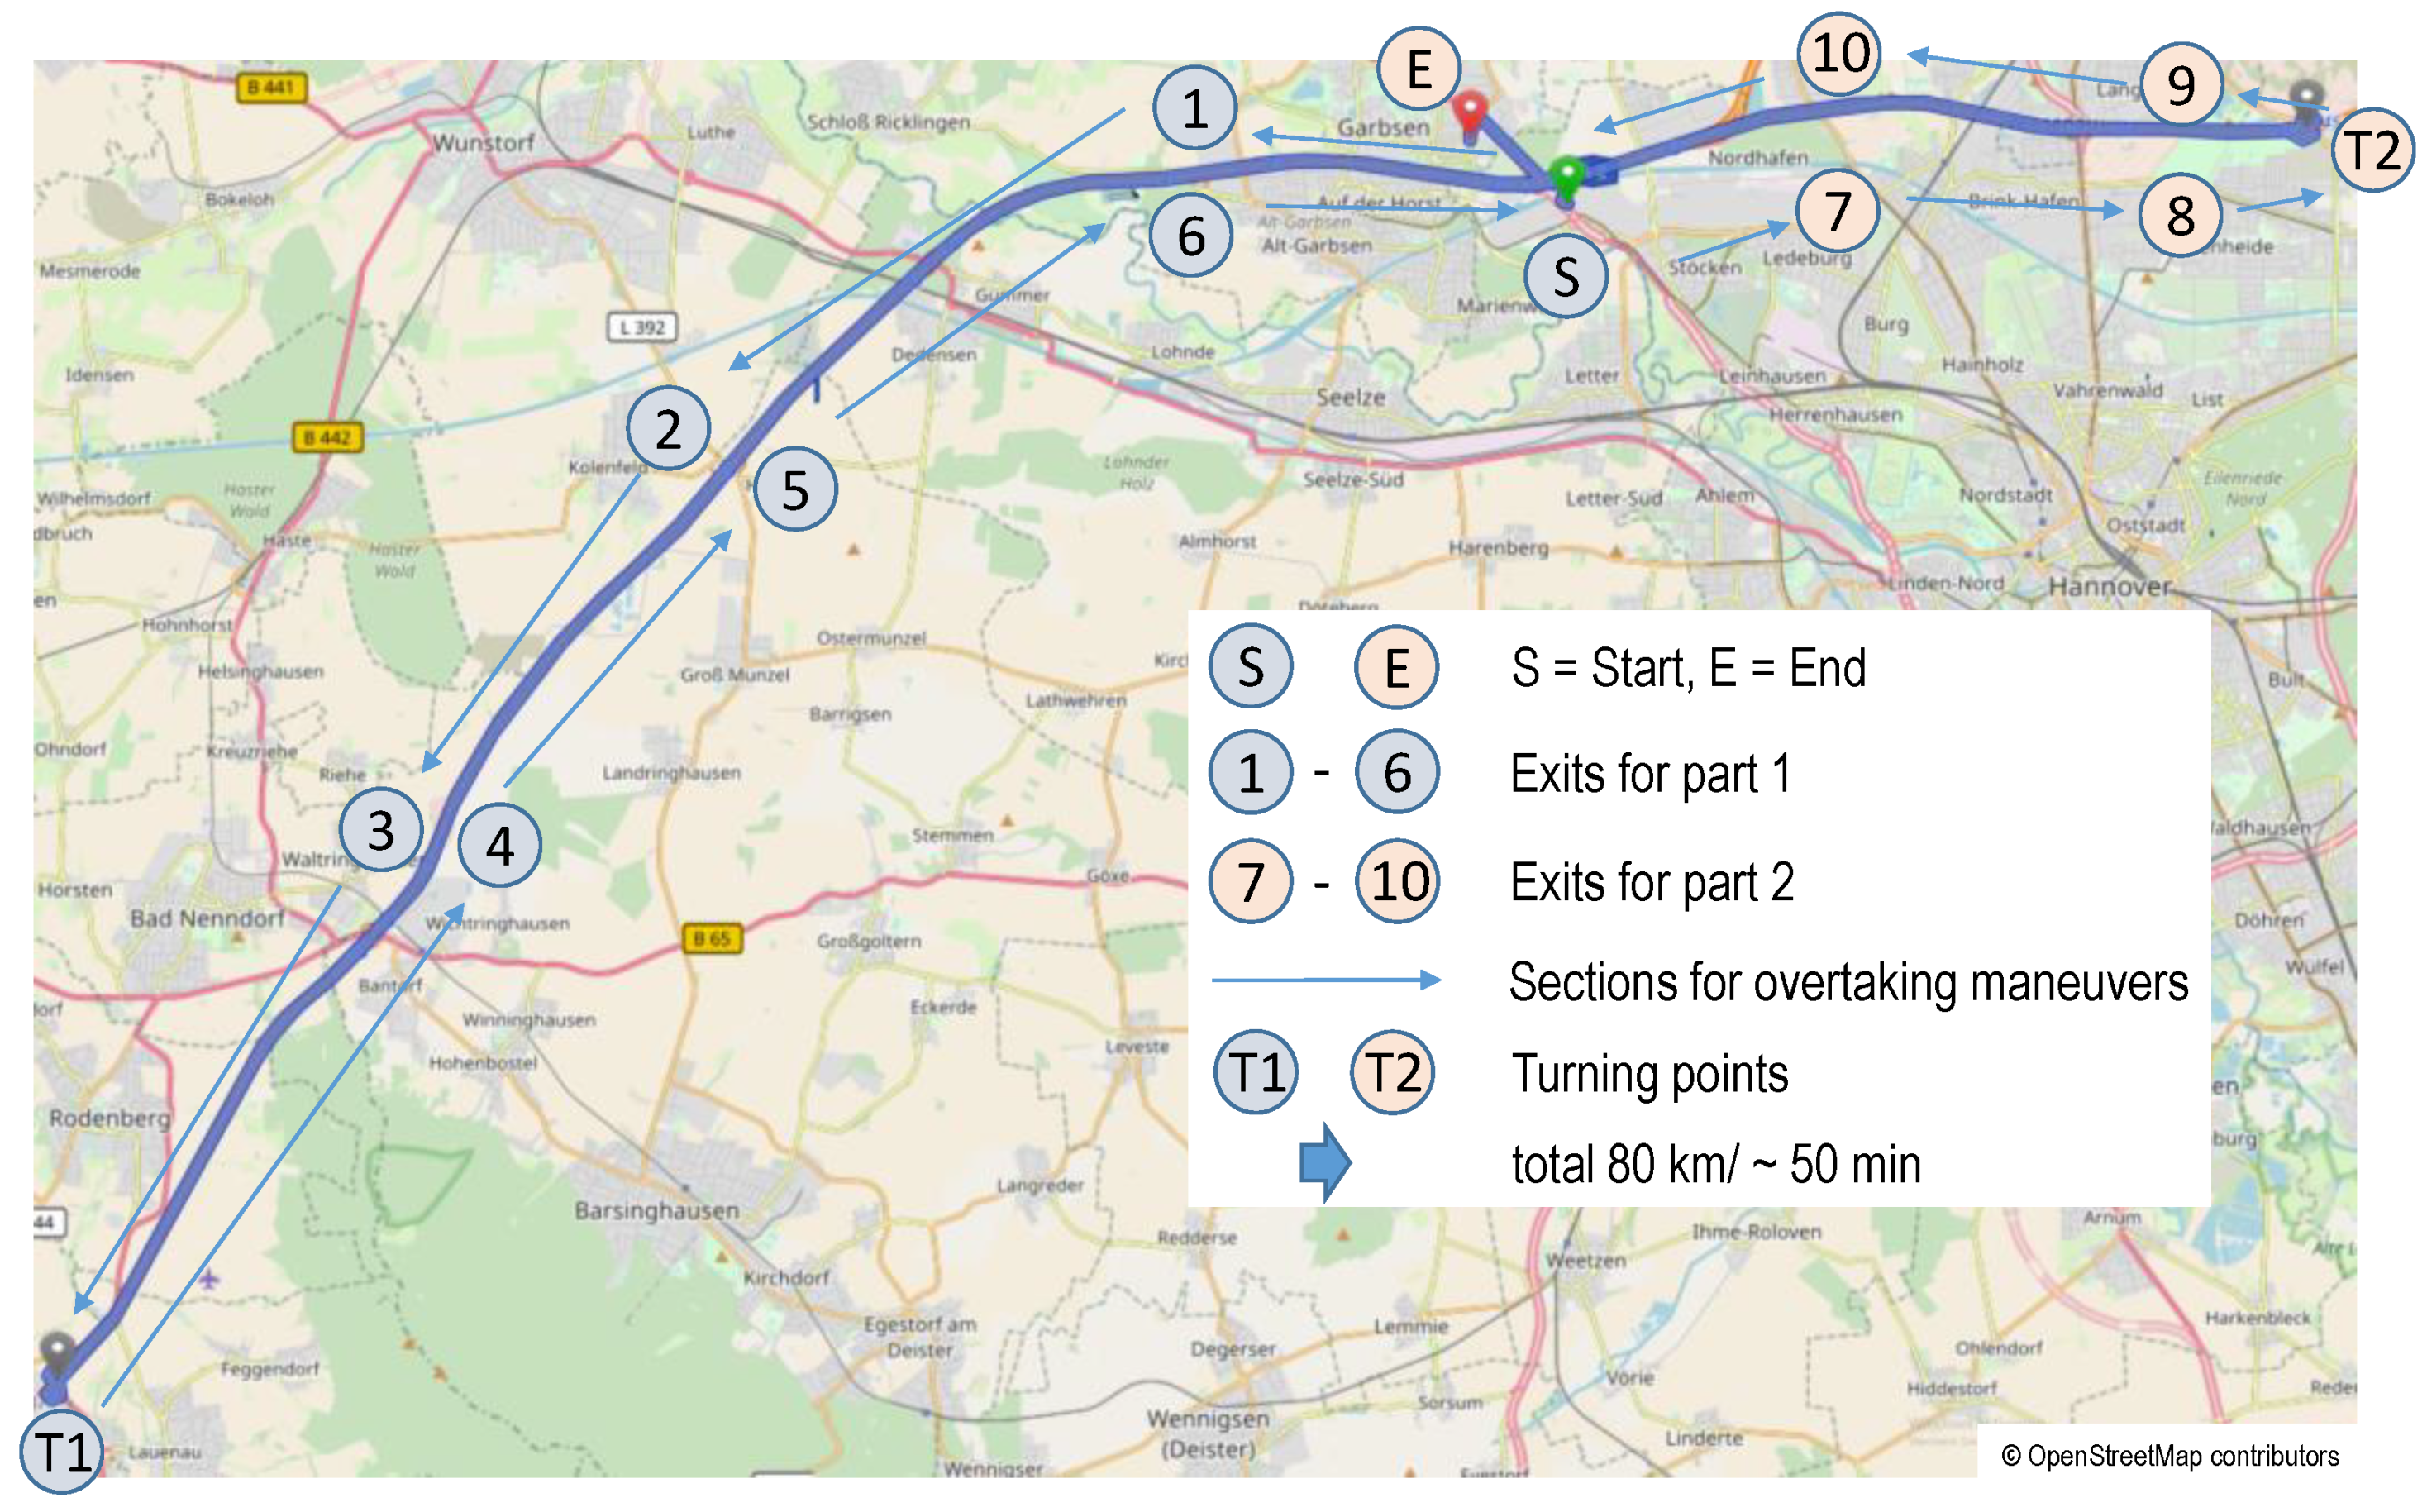
2.1. Environment
2.2. Subject Vehicle
2.3. Projection Vehicle
2.4. On-Road Projection
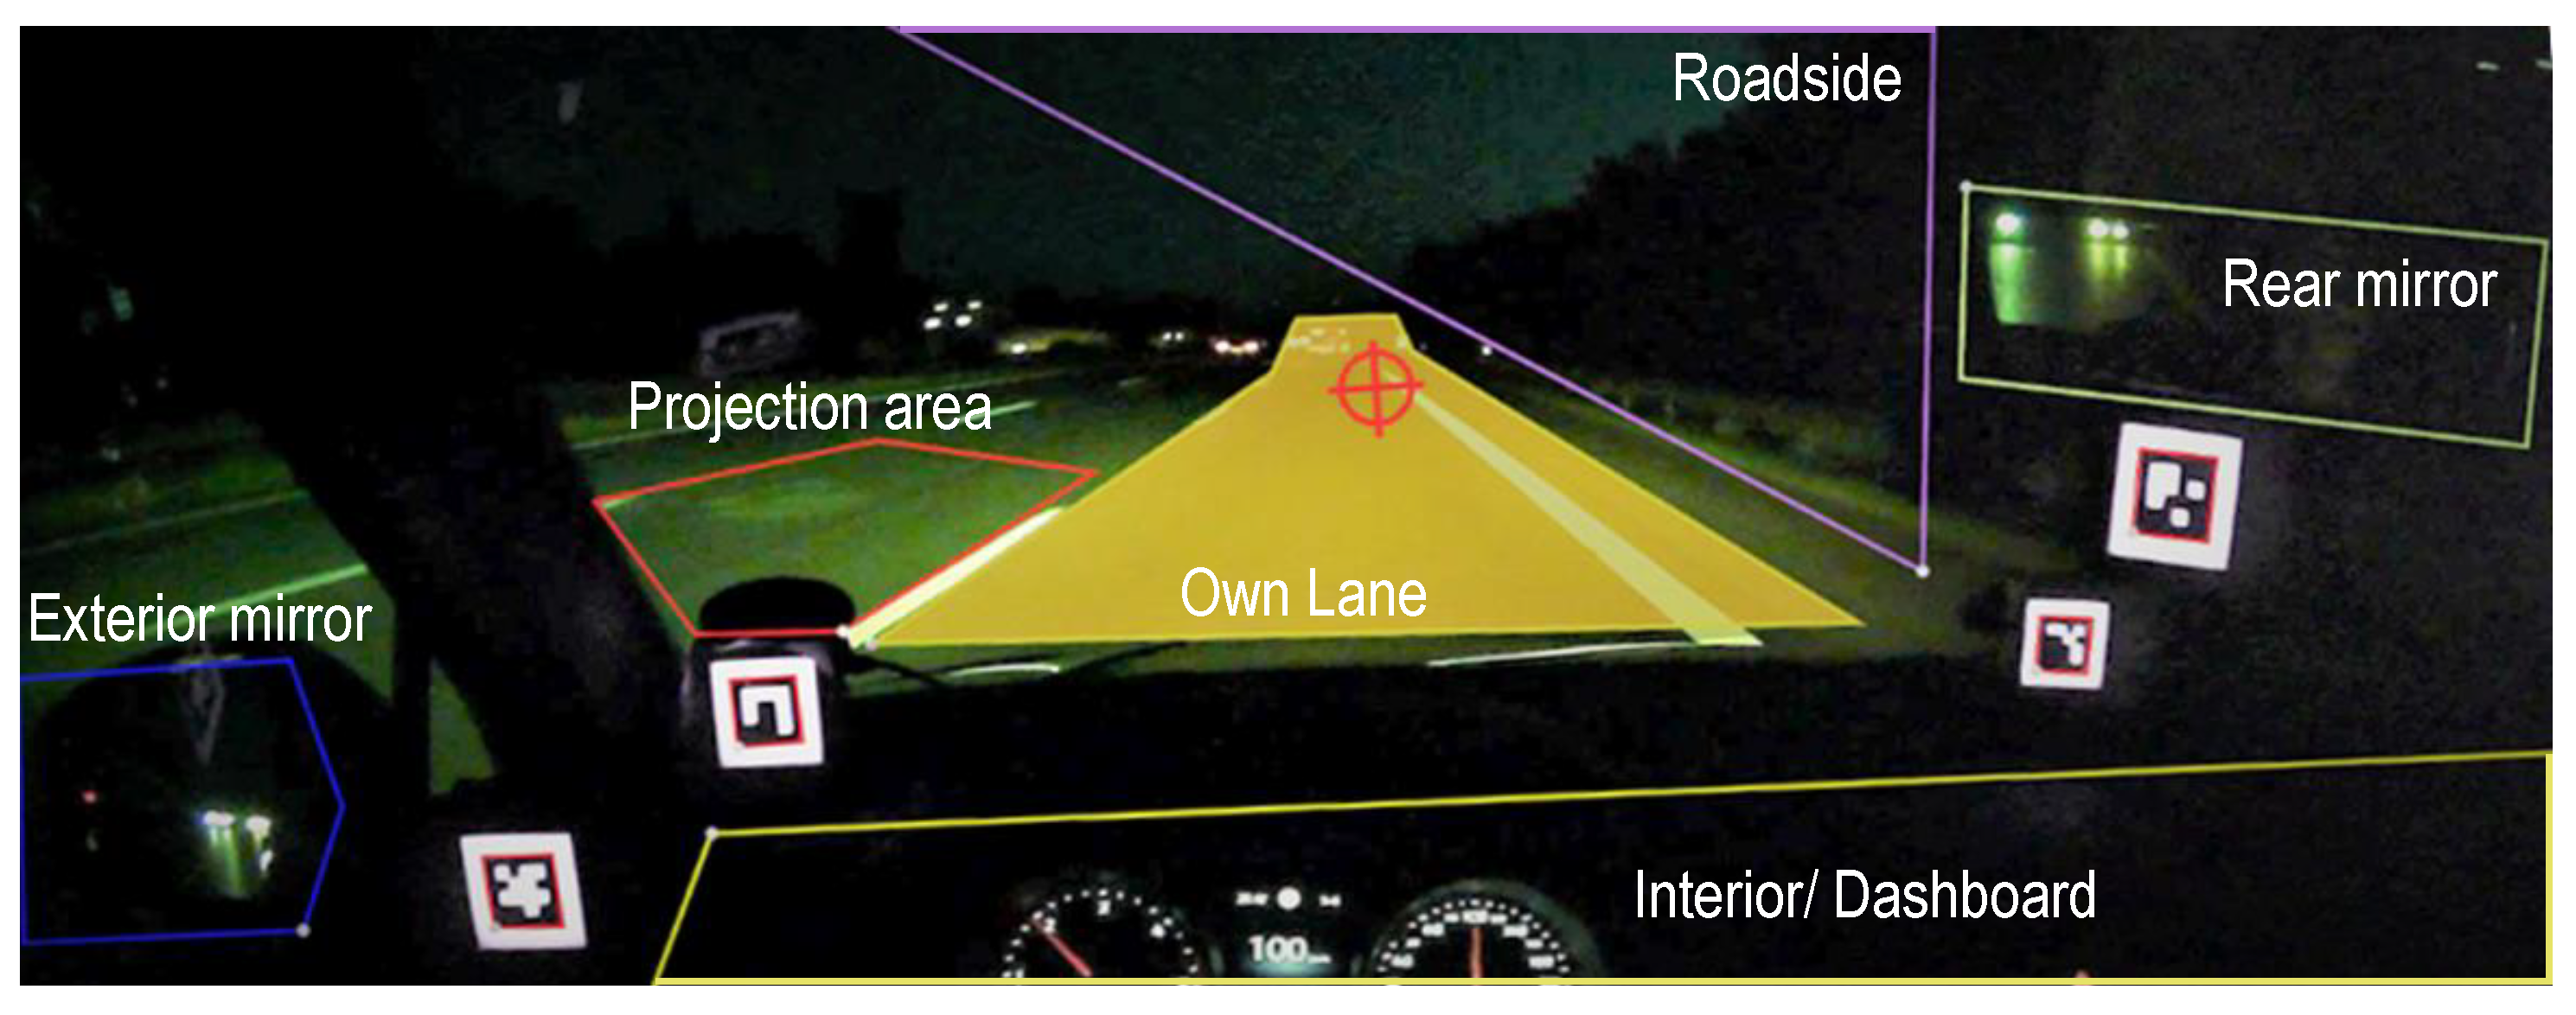
2.5. Human
2.6. Human Reaction
3. Study Results
3.1. Part I
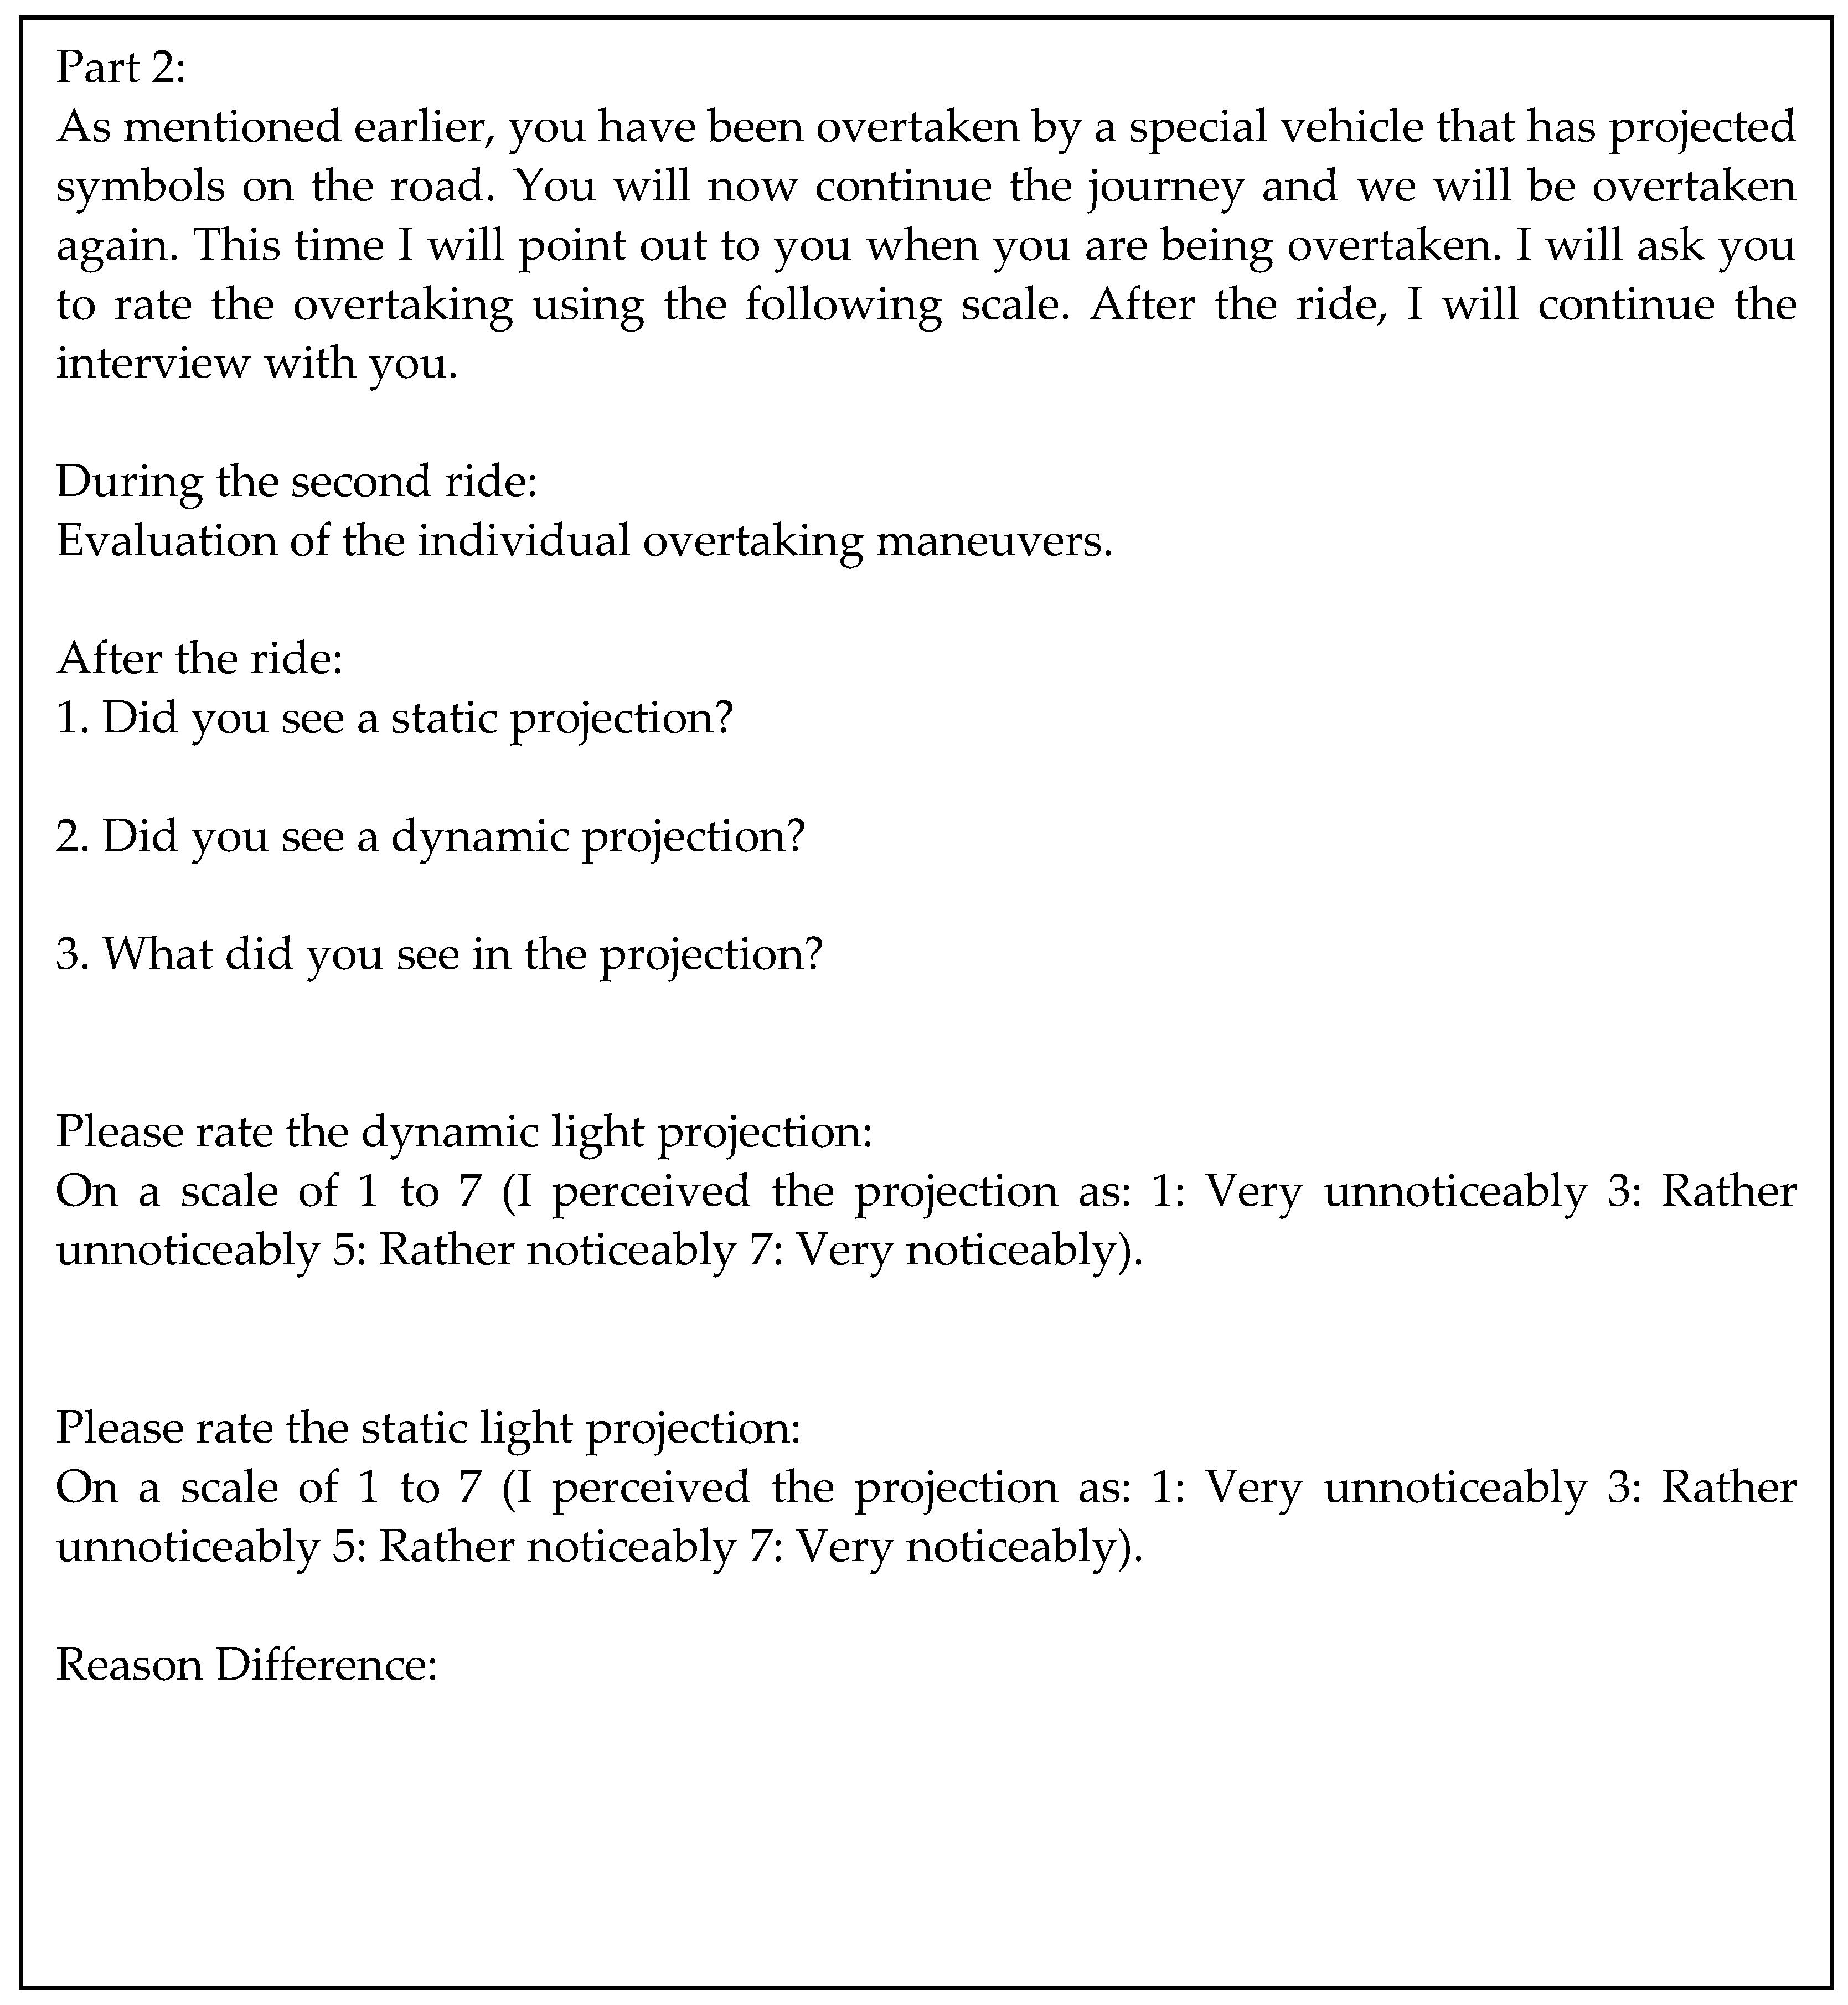
3.2. Part II
4. Discussion
5. Conclusions
Author Contributions
Funding
Institutional Review Board Statement
Informed Consent Statement
Data Availability Statement
Conflicts of Interest
Appendix A


References
- Stutts, J.; Reinfurt, D.; Staplin, L.; Rodgman, E. The Role of Driver Distraction in Traffic Crashes; AAA Foundation for Traffic Safety: Washington, DC, USA, 2001. [Google Scholar]
- Kountouriotis, G.K.; Spyridakos, P.; Carsten, O.M.J.; Merat, N. Identifying cognitive distraction using steering wheel reversal rates. Accid. Anal. Prev. 2016, 96, 39–45. [Google Scholar] [CrossRef] [PubMed]
- Engström, J.; Johansson, E.; Östlund, J. Effects of visual and cognitive load in real and simulated motorway driving. Transp. Res. Part F Traffic Psychol. Behav. 2005, 8, 97–120. [Google Scholar] [CrossRef]
- Santos, J.; Merat, N.; Mouta, S.; Brookhuis, K.; de Waard, D. The interaction between driving and in-vehicle information systems: Comparison of results from laboratory, simulator and real-world studies. Transp. Res. Part F Traffic Psychol. Behav. 2005, 8, 135–146. [Google Scholar] [CrossRef] [Green Version]
- Liang, Y.; Lee, J.D. Combining cognitive and visual distractions: Less than the sum of its parts. Accid. Anal. Prev. 2010, 42, 881–890. [Google Scholar] [CrossRef]
- Victor, T.W.; Harbluk, J.L.; Engström, J.A. Sensitivity of eye-movement measures to in-vehicle task difficulty. Transp. Res. Part F Traffic Psychol. Behav. 2005, 8, 167–190. [Google Scholar] [CrossRef]
- Reyes, M.L.; Lee, J.D. Effects of cognitive load presence and duration on driver eye movements and event detection performance. Transp. Res. Part F Traffic Psychol. Behav. 2008, 11, 391–402. [Google Scholar] [CrossRef]
- Godthelp, H.; Milgram, P.; Blaauw, G.J. The development of a time-related measure to describe driving strategy. Hum. Factors J. Hum. Factors Ergon. Soc. 1984, 26, 257–268. [Google Scholar] [CrossRef]
- Alm, H.; Nilsson, L. The Effects of a Mobile Telephone Task on Driver Behaviour in a Car Following Situation. Accid. Anal. Prev. 1995, 27, 707–715. [Google Scholar] [CrossRef] [Green Version]
- Burns, P.C.; Parkes, A.; Burton, S.; Smith, R.K.; Burch, D. How Dangerous Is Driving with a Mobile Phone? Benchmarking the Impairment to Alcohol (TRL Report TRL547); TRL Limited: Berkshire, UK, 2002. [Google Scholar]
- Haigney, D.E.; Taylor, R.G.; Westerman, S.J. Concurrent mobile (cellular) phone use and driving performance: Task demand characteristics and compensatory processes. Transp. Res. Part F Traffic Psychol. Behav. 2000, 3, 113–121. [Google Scholar] [CrossRef]
- Rakauskas, M.E.; Gugerty, L.J.; Ward, N.J. Effects of naturalistic cell phone conversation on driving performance. J. Saf. Res. 2004, 35, 453–464. [Google Scholar] [CrossRef]
- Jamson, A.H.; Westerman, S.J.; Hockey, G.R.J.; Carsten, M.J. Speech-based e-mail and driver behavior: Effects of an in-vehicle message system interface. Hum. Factors J. Hum. Factors Ergon. Soc. 2004, 46, 625–639. [Google Scholar] [CrossRef] [PubMed]
- Strayer, D.L.; Drews, F.A. Profiles in driver distraction: Effects of cell phone conversations on younger and older drivers. Hum. Factors 2004, 46, 640–649. [Google Scholar] [CrossRef] [PubMed]
- Strayer, D.L.; Drews, F.A.; Johnston, W.A. Cell phone-induced failures of visual attention during simulated driving. J. Exp. Psychol. Appl. 2003, 9, 23–32. [Google Scholar] [CrossRef] [PubMed] [Green Version]
- Brookhuis, K.A.; de Vries, G.; de Waard, D. The effects of mobile telephoning on driving performance. Accid. Anal. Prev. 1991, 23, 309–316. [Google Scholar] [CrossRef]
- Harbluk, J.L.; Noy, Y.I.; Eizenman, M. The Impact of Cognitive Distraction on Driver Visual Behaviour and Vehicle Control (TP No. 13889 E); Transport Canada: Ottowa, ON, Canada, 2002.
- Rosenhahn, E.O.; Seibold, H.; Geywitz-Senn, J.; Rutkiewicz, I. Digital Light Millions of Pixels on the Road. ATZ Worldw. 2018, 120, 42–45. [Google Scholar] [CrossRef]
- Li, Y.; Knöchelmann, M.; Lachmayer, R. Beam Pre-Shaping Methods Using Lenslet Arrays for Area-Based High-Resolution Vehicle Headlamp Systems. Appl. Sci. 2020, 10, 4569. [Google Scholar] [CrossRef]
- Knöchelmann, M.; Held, M.P.; Kloppenburg, G.; Lachmayer, R. High-resolution headlamps—Technology analysis and system design. Adv. Opt. Technol. 2019, 8, 33–46. [Google Scholar] [CrossRef]
- Kloppenburg, G.; Wolf, A.; Lachmayer, R. High-resolution vehicle headlamps: Technologies and scanning prototype. Adv. Opt. Technol. 2016, 5, 147–155. [Google Scholar] [CrossRef] [Green Version]
- Rosenhahn, E.O.; Link, F. Traffic Safety Benefits provided by High Resolution Headlamp Systems. In 13th International Symposium on Automotive Lightning-ISAL 2019-Proceedings of the Conference; Khanh, T.Q., Ed.; Herbert, Utz: München, Germany, 2019; pp. 239–248. ISBN 978–3–8316–4818–4. [Google Scholar]
- Busch, S.; Schlichting, A.; Brenner, C. Generation and communication of dynamic maps using light projection. Proc. ICA 2018, 1, 16. [Google Scholar] [CrossRef] [Green Version]
- Kleinkes, M.; Pohlmann, W.; Wilks, C. Boost Safety & Styling–New HD-LED Systems for front and rear. In 13th International Symposium on Automotive Lightning-ISAL 2019-Proceedings of the Conference; Khanh, T.Q., Ed.; Herbert, Utz: München, Germany, 2019; pp. 249–258. ISBN 978–3–8316–4818–4. [Google Scholar]
- Roth, J.; Thamm, M.; Held, M.P.; Lachmayer, R. Micro-Pixel-LED-Headlights. In 13th International Symposium on Automotive Lightning-ISAL 2019-Proceedings of the Conference; Khanh, T.Q., Ed.; Herbert, Utz: München, Germany, 2019; pp. 259–268. ISBN 978–3–8316–4818–4. [Google Scholar]
- Lee, H. The Study of Functionality for Now and Future High Definition Lighting. In 13th International Symposium on Automotive Lightning-ISAL 2019-Proceedings of the Conference; Khanh, T.Q., Ed.; Herbert, Utz: München, Germany, 2019; pp. 299–308. ISBN 978–3–8316–4818–4. [Google Scholar]
- Jahn, P.; Cristea, I.; Neumann, C. High-Resolution Light-Based Driver-Assistance–Optimal Contrast for Symbols. In 12th International Symposium on Automotive Lightning-ISAL 2017-Proceedings of the Conference; Khanh, T.Q., Ed.; Herbert, Utz: München, Germany, 2017; pp. 43–52. ISBN 978-3-8316-4672-2. [Google Scholar]
- Bremer, C.; Lewerich, B.; Hendricks, F.; Neumann, C. LCoS projection system. In 13th International Symposium on Automotive Lightning-ISAL 2019-Proceedings of the Conference; Khanh, T.Q., Ed.; Herbert, Utz: München, Germany, 2019; pp. 331–341. ISBN 978–3–8316–4818–4. [Google Scholar]
- Reiss, B.; Cladé, S. Road Marking Solutions with Pixelized Light Source. In 13th International Symposium on Automotive Lightning-ISAL 2019-Proceedings of the Conference; Khanh, T.Q., Ed.; Herbert, Utz: München, Germany, 2019; pp. 343–352. ISBN 978–3–8316–4818–4. [Google Scholar]
- Gonçalves, W.; Issoufou, A.; Becherer, U. Optimized ADB Symbol Projection. In 13th International Symposium on Automotive Lightning-ISAL 2019-Proceedings of the Conference; Khanh, T.Q., Ed.; Herbert, Utz: München, Germany, 2019; pp. 355–361. ISBN 978–3–8316–4818–4. [Google Scholar]
- Shibata, Y.; Kito, M.; Ishida, H.; Goto, Y.; Kamijo, M. Requirement Performance of Road Projection Lamp in Conjunction with Turn Signal Lamp. In 13th International Symposium on Automotive Lightning-ISAL 2019-Proceedings of the Conference; Khanh, T.Q., Ed.; Herbert, Utz: München, Germany, 2019; pp. 362–373. ISBN 978–3–8316–4818–4. [Google Scholar]
- Azouigui, S.; Barbedette, B.; Saudrais, S.; Sortais, Y.; Bordel, S.; Neumann, C.; Jahn, P. Impact of Advanced Lighting Function based on Road Projection for Departing Indication in Parking Lots. In 13th International Symposium on Automotive Lightning-ISAL 2019-Proceedings of the Conference; Khanh, T.Q., Ed.; Herbert, Utz: München, Germany, 2019; pp. 375–384. ISBN 978–3–8316–4818–4. [Google Scholar]
- Reschke, J.; Rabenau, P.; Hamm, M.; Neumann, C. Symbolische Fahrzeug-Fußgänger-Interaktion. In VDI Berichte-2323 Optische Technologien in der Fahrzeugtechnik; VDI Verlag GmbH: Düsseldorf, Germany, 2018; Volume 2323, pp. 95–106. [Google Scholar] [CrossRef]
- Kloppenburg, G. Scannende Laser-Projektionseinheit Für Die Fahrzeugfrontbeleuchtung; TEWISS-Technik und Wissen GmbH: Garbsen, Germany, 2017; ISBN 978–3–95900–168–7. [Google Scholar]
- Krahnstöver, A.Z. Licht Führt!? Konzeption Und Evaluation Von Fahrmanöverunterstützung Durch Lichtbasierte Fahrerassistenzsysteme; (AutoUni–Schriftenreihe 98); Springer: Wiesbaden, Germany, 2017; ISBN 978–3–658–17161–2. [Google Scholar]
- Hamm, M.; Huhn, W.; Reschke, J. Ideas for Next Lighting Generations in Digitalization and Autonomous Driving. SAE Tech. Pap. 2018, 11, 2018-01-1038. [Google Scholar] [CrossRef]
- Budanow, M.; Neumann, C. Road projections as a new and intuitively understandable human-machine interface. Adv. Opt. Technol. 2019, 8, 77–84. [Google Scholar] [CrossRef]
- Budanow, M.; Neumann, C. Success of Driver Assistance through Light Projections on the Road. In 13th International Symposium on Automotive Lightning-ISAL 2019-Proceedings of the Conference; Khanh, T.Q., Ed.; Herbert, Utz: München, Germany, 2019; pp. 311–320. ISBN 978–3–8316–4818–4. [Google Scholar]
- Krieft, F.; Thoma, A.; Willeke, B.; Kubitza, B.; Kaup, M. Symbol Projections: Gain or Gadget? In 13th International Symposium on Automotive Lightning-ISAL 2019-Proceedings of the Conference; Khanh, T.Q., Ed.; Herbert, Utz: München, Germany, 2019; pp. 321–330. ISBN 978–3–8316–4818–4. [Google Scholar]
- S-Class Configurator Headlamp Options (German). Available online: https://www.mercedes-benz.de/passengercars/mercedes-benz-cars/car-configurator.html/configuration/CCci/DE/de/de_DE__2230331__AJ-052_AU-201_GC-421_LE-L_LU-040_MJ-802_PC-P20-P44-P64-PBG_PS-953%23-M05%23_SA-01R-01U-02B-14U-16U-17U-218-233-235-243-249-266-275-282-292-321-325-33U-351-355-365-367-383-475-489-513-51U-534-537-546-581-587-628-642-70B-726-79B-868-871-873-881-883-891-897-927-942-969-971-B13-H02-K32-K33-K34-L2B-R01-U01-U10-U12-U19-U22-U35-U60-U79_SC-0U1-194-1B3-2U1-2U8-4V3-502-51B-6P5-7B4-8B1-8U1-8U8-998-K13-K27-K37-K40-K41-LS1-R7J/headlights (accessed on 5 October 2021).
- C-class Configurator Headlamp Options (German). Available online: https://www.mercedes-benz.de/passengercars/mercedes-benz-cars/car-configurator.html/configuration/CCci/DE/de/de_DE__2060411__AU-001_GC-421_LE-L_LU-040_MJ-802_PC-30P-D1I-D1P-D3L-P44-P49-P75-P76-PAX-PBG-PFB_SA-01U-02B-14U-16R-16U-17U-218-233-235-243-249-262-266-272-30U-310-318-325-33U-345-351-355-365-367-383-42U-43U-475-4B8-500-513-521-537-546-579-587-58U-628-677-70B-757-79B-7U1-859-876-893-897-927-94B-964-969-B01-B59-H00-K32-K33-K34-L3E-R01-U01-U10-U12-U60_SC-001-0B4-0U1-1B3-1U9-1V5-2U1-2U6-2U8-502-51B-6P5-7B4-8P8-8U8-8X2-998-AA5-B10-K06-K13-K31-K37-R7D/headlights (accessed on 5 October 2021).
- EQS Configurator Package (and Headlamp) Options (German). Available online: https://www.mercedes-benz.de/passengercars/mercedes-benz-cars/car-configurator.html/configuration/CCci/DE/de/de_DE__2971441__AU-201_LE-L_LU-197_MJ-802_PC-431-P14-P17-P20-P47-P49-P76-PAF-PAG-PAX-PBG-PDB_PS-S89%23_PV-DSQ_SA-01U-02B-13U-14U-16U-17U-201-215-233-235-241-242-243-249-262-266-272-275-287-290-292-294-299-309-30U-318-321-324-325-351-355-365-367-36U-384-42U-436-43U-475-489-500-501-513-51U-535-537-546-580-587-5B1-628-63B-70B-723-72B-775-79B-7U2-82B-83B-860-871-873-876-889-890-891-894-897-969-9B2-B51-B53-B59-H08-K32-K33-K34-L2B-R01-R84-U01-U10-U12-U19-U22-U25-U60_SC-0U1-1B3-2S0-2U8-502-51B-5V5-6P5-6S3-7B4-8B4-8P8-8U4-8U8-998-A02-BAC-EMA-EMQ-K12-K37-R7K/package_types (accessed on 5 October 2021).
- E-Tron Sportback (and E-Tron) Configurator Digital Matrix LED Headlamp (German). Available online: https://www.audi.de/de/brand/de/neuwagen/tron/audi-e-tron-sportback/exterieur.html#layer=/de/brand/de/neuwagen/tron/audi-e-tron-sportback.mediathek_infolayer.GPXCPXC.html (accessed on 5 October 2021).
- Preview of the A8 2022 (Facelift) with Digital Matrix LED Headlamp Available (German). Available online: https://www.audi.de/de/brand/de/neuwagen/a8/a8.html (accessed on 5 October 2021).
- Huestegge, L.; Böckler, A. Out of the corner of the driver’s eye: Peripheral processing of hazards in static traffic scenes. J. Vis. 2016, 16, 1–15. [Google Scholar] [CrossRef] [Green Version]
- Omerbegovic, S.; Reim, J.; Funk, C. Construction zone light: A study on safety and distraction. In 12th International Symposium on Automotive Lightning-ISAL 2017-Proceedings of the Conference; Khanh, T.Q., Ed.; Herbert, Utz: München, Germany, 2017; pp. 307–314. ISBN 978-3-8316-4672-2. [Google Scholar]
- Hamm, M. Real Driving Benefits and Research Findings with Digital Light Functions. In 13th International Symposium on Automotive Lightning-ISAL 2019-Proceedings of the Conference; Khanh, T.Q., Ed.; Herbert, Utz: München, Germany, 2019; pp. 229–238. ISBN 978–3–8316–4818–4. [Google Scholar]
- Hamm, M.; Huhn, W. Glare Investigations and Safety Research on Digital Light Technologies. SAE Tech. Pap. 2019, 01–0849. [Google Scholar] [CrossRef]
- Jahn, P.; Neumann, C. Ablenkpotenzial eines Baustellenlichtes auf andere Verkehrsteilnehmer. In Proceedings of the Lux Junior 2017: 14. Internationales Forum Für Den Lichttechnischen Nachwuchs, Dörnfeld an der Ilm, Germany, 8–10 September 2017. [Google Scholar]
- Polin, D.; Khanh, T.Q. Investigation on Headlights with High-resolution Projection Modules. ATZ Worldw. 2018, 120, 70–73. [Google Scholar] [CrossRef]
- Japan Automobile Standards Internationalization Center (JASIC). A Study on the Effects of Driver Assistance Projections on the Driver’s Perception of Nearby Traffic, UNECE. In Proceedings of the Simplification of the Lighting and Light Signalling Regulations (SLR), 38th Session, Geneva, Switzerland, 27–29 May 2020. [Google Scholar]
- Regan, M.A.; Hallett, C.; Gordon, C.P. Driver distraction and driver inattention: Definition, relationship and taxonomy. Accid. Anal. Prev. 2011, 43, 1771–1781. [Google Scholar] [CrossRef]
- Goldenbeld, C.; Regan, M. European Commission–Driver Distraction. 2015. Available online: https://ec.europa.eu/transport/road_safety/sites/roadsafety/files/ersosynthesis2015-driverdistraction25_en.pdf (accessed on 5 October 2021).
- Hanowski, R.J.; Hickman, J.S.; Olson, R.L.; Bocanegra, J. Evaluating the 2003 revised hours-of-service regulations for truck drivers: The impact of time-on-task on critical incident risk. Accid. Anal. Prev. 2009, 41, 268–275. [Google Scholar] [CrossRef] [PubMed]
- Sivak, M. The information that drivers use: Is it indeed 90% visual? Perception 1996, 25, 1081–1089. [Google Scholar] [CrossRef]
- Zwahlen, H.T.; Adams, C.C.; Schwartz, P.J. Safety aspects of cellular telephones in automobiles. In Proceedings of the ISATA Conference, Florence, Italy, 30 May–3 June 1988. [Google Scholar]
- Rockwell, T.H. Spare visual capacity in driving-revisited. In Vision in Vehicles II, Procedia–Social and Behavioral Sciences; Elsevier Science & Technology: Amsterdam, The Netherlands, 1988; pp. 317–324. ISBN 978–0-444-70423-8. [Google Scholar]
- Klauer, S.G.; Dingus, T.A.; Neale, V.L.; Sudweeks, J.D. The Impact of Driver Inattention on Near-Crash/Crash Risk: An Analysis Using the 100-Car Naturalistic Driving Study Data; National Technical Information Service: Alexandria, VA, USA, 2006.
- Horrey, W.J.; Wickens, C.D. In-vehicle glance distribution, tails, and models of crash risks. Transp. Res. Record 2007, 2018, 22–28. [Google Scholar] [CrossRef] [Green Version]
- Theeuwes, J. Visuele Afleiding in Het Verkeer; Vrije Universiteit: Amsterdam, The Netherlands, 2008. [Google Scholar]
- DIN EN ISO 15007-1: 2015-03: Road Vehicles-Measurement of Driver Visual Behaviour with Respect to Transport Information and Control Systems-Part 1: Definitions and Parameters (ISO 15007-1:2014); Deutsches Institut für Normung e.V.: Berlin, Germany, 2015. [CrossRef]
- Oviedo-Trespalacios, O.; Truelove, V.; Watson, B.; Hinton, J.A. The impact of road advertising signs on driver behaviour and implications for road safety: A critical systematic review. Transp. Res. Part A Policy Pr. 2019, 122, 85–98. [Google Scholar] [CrossRef]
- Ishikawa, K. Guide to Quality Control; Asian Productivity Organization: Tokyo, Japan, 1976; ISBN 92–833-1036–5.
- Driving Route from the Study for the Test Drive. Available online: https://routing.openstreetmap.de/?z=11¢er=52.405561%2C9.768906&loc=52.418591%2C9.634795&loc=52.281956%2C9.348378&loc=52.427260%2C9.776330&loc=52.424830%2C9.616113&hl=de&alt=0&srv=0 (accessed on 10 March 2021).


Publisher’s Note: MDPI stays neutral with regard to jurisdictional claims in published maps and institutional affiliations. |
© 2021 by the authors. Licensee MDPI, Basel, Switzerland. This article is an open access article distributed under the terms and conditions of the Creative Commons Attribution (CC BY) license (https://creativecommons.org/licenses/by/4.0/).
Share and Cite
Glück, T.; Biermann, T.; Wolf, A.; Budig, S.; Ziebehl, A.; Knöchelmann, M.; Lachmayer, R. Distraction Potential of Vehicle-Based On-Road Projection. Appl. Sci. 2021, 11, 12030. https://doi.org/10.3390/app112412030
Glück T, Biermann T, Wolf A, Budig S, Ziebehl A, Knöchelmann M, Lachmayer R. Distraction Potential of Vehicle-Based On-Road Projection. Applied Sciences. 2021; 11(24):12030. https://doi.org/10.3390/app112412030
Chicago/Turabian StyleGlück, Tobias, Tobias Biermann, Alexander Wolf, Sören Budig, Arved Ziebehl, Marvin Knöchelmann, and Roland Lachmayer. 2021. "Distraction Potential of Vehicle-Based On-Road Projection" Applied Sciences 11, no. 24: 12030. https://doi.org/10.3390/app112412030