Article

Establishment of the Optimal Common Data Model Environment for EMR Data Considering the Computing Resources of Medical Institutions

1
Department of Medical Informatics, College of Medicine, The Catholic University of Korea, Seoul 06591, Korea
2
Department of Ophthalmology, Seoul National University College of Medicine, Seoul National University Bundang Hospital, Seongnam 13620, Korea
3
Department of Ophthalmology and Visual Science, College of Medicine, The Catholic University of Korea, Catholic University of Korea Yeouido Saint Mary’s Hospital, Seoul 06591, Korea
*
Authors to whom correspondence should be addressed.
Co-first author.
Appl. Sci. 2021, 11(24), 12056; https://doi.org/10.3390/app112412056
Submission received: 3 November 2021 / Revised: 5 December 2021 / Accepted: 14 December 2021 / Published: 17 December 2021
(This article belongs to the Special Issue New Trends in Medical Informatics II)

Abstract

:
Electronic medical record (EMR) data vary between institutions. These data should be converted into a common data model (CDM) for multi-institutional joint research. To build the CDM, it is essential to integrate the EMR data of each hospital and load it according to the CDM model, considering the computing resources of each hospital. Accordingly, this study attempts to share experiences and recommend computing resource-allocation designs. Here, two types of servers were defined: combined and separated servers. In addition, three database (DB) setting types were selected: desktop application (DA), online transaction processing (OLTP), and data warehouse (DW). Scale, TPS, average latency, 90th percentile latency, and maximum latency were compared across various settings. Virtual memory (vmstat) and disk input/output (disk) statuses were also described. Transactions per second (TPS) decreased as the scale increased in all DB types; however, the average, 90th percentile and maximum latencies exhibited no tendency according to scale. When compared with the maximum number of clients (DA client = 5, OLTP clients = 20, DW clients = 10), the TPS, average latency, 90th percentile latency, and maximum latency values were highest in the order of OLTP, DW, and DA. In vmstat, the amount of memory used for the page cache field and free memory currently available for DA, OLTP, and DW were large compared to other fields. In the disk, DA, OLTP, and DW all recorded the largest value in the average size of write requests, followed by the largest number of write requests per second. In summary, this study presents recommendations for configuring CDM settings. The configuration must be tuned carefully, considering the hospital’s resources and environment, and the size of the database must consider concurrent client connections, architecture, and connections.

1. Introduction

With the development of information technologies and the accumulation of big data in the medical field, medical institutions have embarked on more joint studies with quality by sharing data from a common base [1]. Electronic medical records (EMRs) are mainly used in hospitals to collect patient data [2], and these hospitals have limitations in using these data directly for research because their data collection is not for research but patient care [3]. In addition, because the form and amount of EMR data vary between institutions, it is necessary to convert the data into a common data standard for multi-institutional joint research. Lacking standards makes it difficult to advance through collective research efforts [4]. This standard is implemented by the common data model (CDM) [5]. CDM enables EMR data to be standardized and to facilitate data storage, sharing, exchange, especially when the data have been collected via heterogeneous and distinct systems [6,7,8,9]. In addition, CDM provides tools that allow to assess data quality, integrate models, analyze data, and visualize results [10,11,12,13]. The most prominent example is the observational medical outcomes partnership (OMOP) CDM created by observational health data sciences and informatics (OHDSI’s OMOP [14,15]. To develop OMOP CDM, it is essential to integrate the data of each hospital and load them according to the CDM model considering each hospital’s computing resources [14].
In addition, because the amount of medical data has increased and has become big data in recent years, moving from existing physical servers to cloud servers has become a trend. As big data accumulate in the medical field, the need to build cloud computing resources for databases and applications is increasing [7,8]. Public clouds require an efficient allocation design of computing resources based on their usage purposes, as costs increase with the use of computing resources [16,17,18]. OMOP CDM also operates a computing environment for cohort definition, data extraction, and data analysis with multiple software [4,10]; therefore, it is necessary to efficiently allocate computing resources. Moreover, the performance configuration for conducting research using OMOP CDM is well established [19]. Most CDM-based studies are focused on clinical analysis, under the premise that the OHDSI environment has already been established [20]. Even the methods described in the OHDSI OMOP CDM official GitHub [21] do not describe the conditions for affordable computing resources for each medical institution. Therefore, it is necessary to share experiences and establish a recommendation for computing resource allocation design, considering the growth of medical data in various forms and the computing resource condition of each institution.
This study proposes specific recommendations for computing resource allocation in establishing OMOP CDM for medical institutions in various environments. The recommendation first proposes two types of server scenarios: combined and separated servers. Next, three types of databases (DB) are proposed, according to the two server types: standalone desktop application DB (DA), online transaction processing DB (OLTP), and data warehouse DB (DW). Finally, we demonstrate the feasibility of the proposed recommendation by converting EMR data from one tertiary hospital and two secondary hospitals in Korea into an OMOP CDM form and benchmark them.

2. Materials and Methods
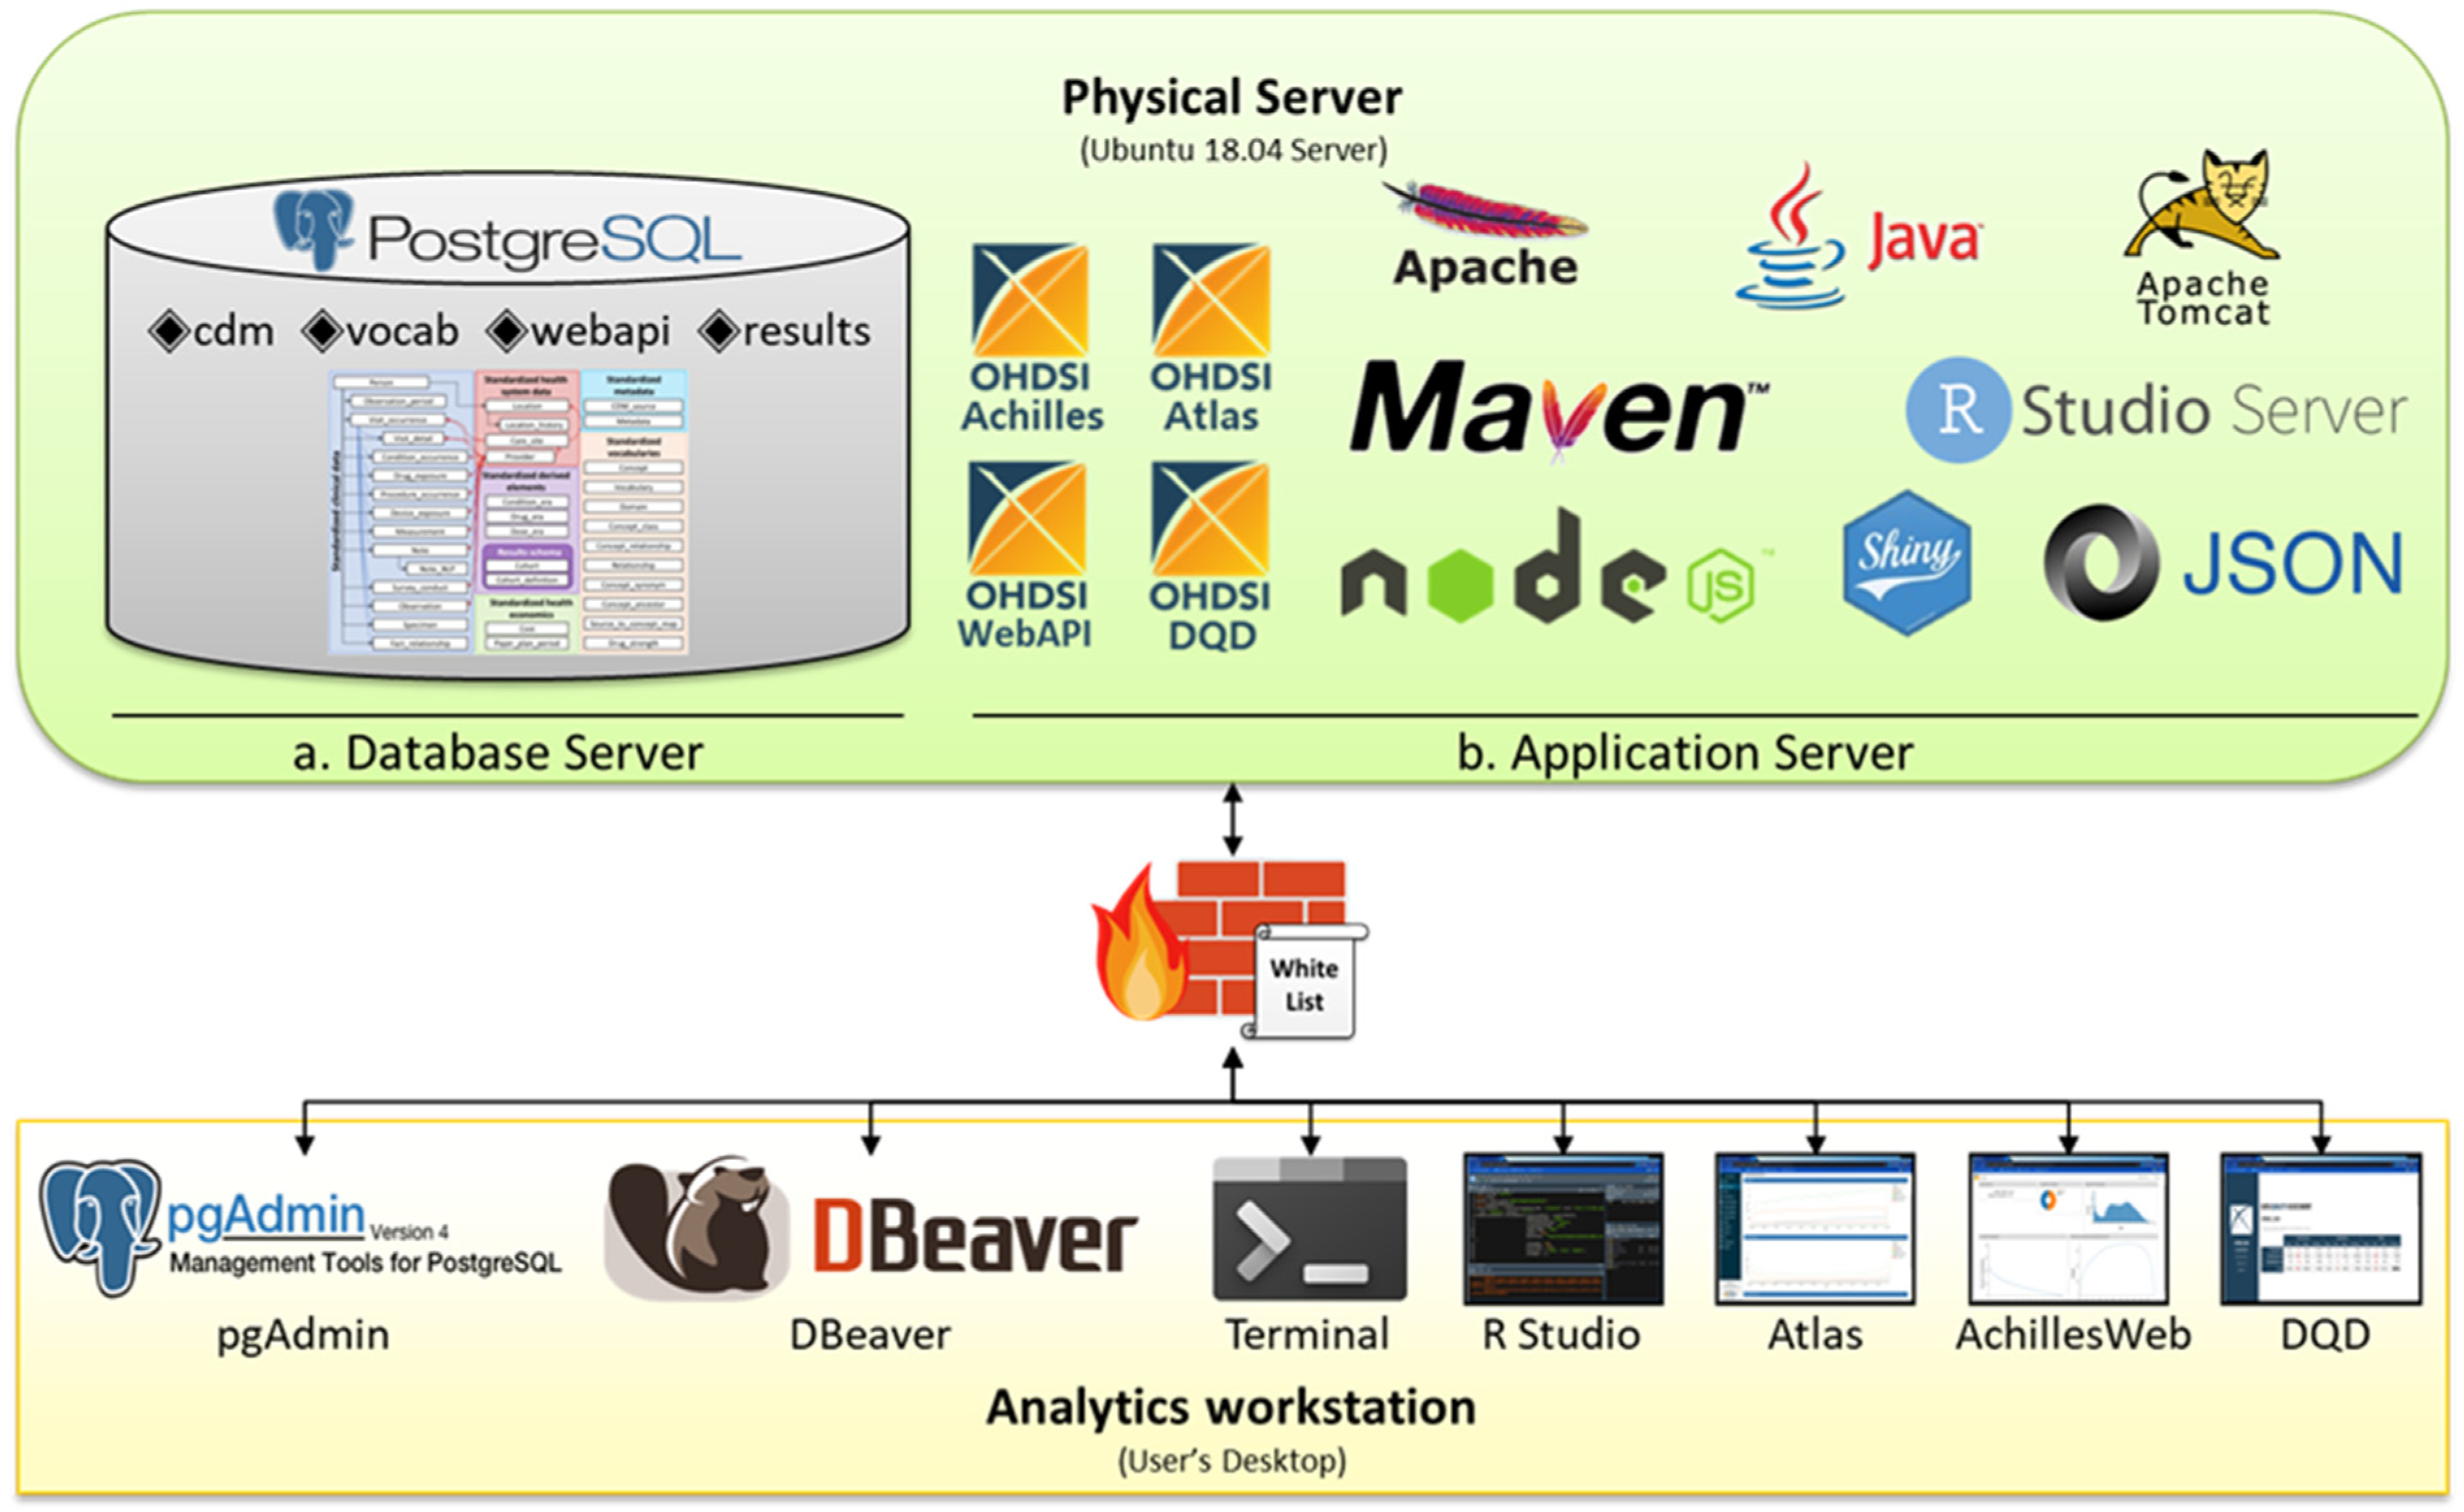
Hospital types can be divided into several categories depending on the size and type of treatment [22]. In this study, we divided hospital types into primary, secondary, and tertiary hospitals. Here, a primary hospital is defined as a community medical institution that provides primary health services, a secondary hospital is a local medical institution that provides comprehensive health services, while a tertiary hospital is a regional medical institution that provides comprehensive and specialized health services [23].

2.1. Server Design

To set up the OHDSI OMOP CDM environment, computing environments should be considered: DB server and analytics workstation [5]. The DB server stores medical data in the CDM format, while the OMOP CDM DB server can be run by a wide range of DB management systems (DBMS), including conventional DB systems (PostgresSQL, Microsoft SQL Server, Oracle, etc.), parallel data warehouses (Microsoft APS, IBM Netezza, Amazon RedShift, etc.), and big data platforms (Hadoop, Google BigQuery) [5]. PostgreSQL is officially supported by conventional DB systems [24]. The research methodology library runs on the analytics workstation, which can be a local system, such as a user’s laptop or a remote server running an RStudio Server. Allocating multiple processing cores and sufficient memory can help speed up the analysis because the analysis workstation has several computationally intensive jobs. In addition, the analytics workstation should be connected to the DB server, and multiple researchers should be able to access it simultaneously in their own connection environment. In particular, the DB server access port should be opened to the analytics workstation, such that the firewall between the 2 can be connected [5].

2.1.1. Combined Server Design

A combined server design combines both the DB and application (AP) logical servers to support the analytics workstation on 1 server. Figure 1 illustrates a case in which all OMOP CDM environments were built with 1 physical system in a tertiary hospital in Korea. Because the institution in Figure 1 supported only one physical server, a combined server design was adopted in which both the DB (Figure 1a) and AP (Figure 1b) servers were built into 1 physical server. Figure 1 suggests that there is a single firewall between the physical server where both DB and AP servers are built and the analytics workstation, an environment where analysts can analyze. The firewalls were configured to allow data traffic from a specific Internet protocol (IP) addressed in the whitelist.
The advantage of the combined server design is that it is simpler to build than the separated server design; hence, it can be easily introduced in hospitals with insufficient resources, such as human and computing resources. In addition, because the AP and DB servers are included in 1 system, they can communicate with each other via localhost rather than external IP; hence, they may not be influenced by the external server’s infrastructure, such as bandwidth provision.
However, because the DB and AP servers are in 1 system, the overall performance may be lower than that of the separated server design, as the 2 servers share and compete for resources within one server. Moreover, because medical data are frequently generated and added in large amounts, it is often necessary to load new data into the DB, which makes DB management cumbersome. For example, whenever a large amount of data needs to be loaded on the DB, the DB configuration also needs to be modified, such that the DB server can maximize the physical server’s resources, thereby prohibiting users from using the analytics workstation. Moreover, the more frequent the number of data additions, the more complicated the DB management because the configuration tuning process must be repeated. In addition, because the DB and the AP servers are within the same physical server, a stability problem emerges, such that the combined server cannot be used if either server is attacked or stopped because of overload.

2.1.2. Separated Server Design

The separated server design builds the DB and AP servers on 2 physical servers. Figure 2 presents a design adopted by 1 tertiary hospital and 2 secondary hospitals in Korea, showing a case of establishing an OHDSI OMOP CDM environment by installing a DB server in 1 physical server and an AP server in the other cloud server. Because these hospitals could support the computing resources of 1 physical server and 1 cloud server, they adopted a separate server design that was built separately from the DB and AP servers. There were firewalls between the physical server, cloud server, and analytics workstation, and they have a safelist, such that they only allow specific IPs.
The advantage of the separated server design is that DB and AP servers are functionally separated; therefore, they do not share or compete with computing resources, thereby maximizing each server’s resources and improving the performance and speed of each server. Unlike the combined server design, this design requires less configuration tuning of the DB server when additional data need to be loaded. Similarly, when applications in the AP server need to be updated, it is convenient for users to directly access the DB and conduct analysis because the AP server is separated from the DB server. In addition, data in the DB server are safe because the DB server is not affected, even if the AP server to which many researchers access is down or attacked.
It is difficult to adopt a separated server design when computing resources are insufficient, such as in primary and secondary hospitals. In addition, depending on the infrastructure environment of each server, such as the bandwidth between the AP and DB servers, there may be a decrease in the communication speed between the servers. When communicating between servers, it is not called by localhost; additional server-to-server connection tasks such as IP and port registration between servers are required. Furthermore, user management is complicated because the whitelist is managed separately for each server.

2.2. Database Design

2.2.1. HW Resources Used in DB

Because the medical server environment handles a large amount of big data, it is necessary to be DB intensive, thereby maximizing DB performance. To maximize the DB performance, software (SW) methods and hardware (HW) methods can be adopted. Regarding SW, methods such as properly adding indexes [25] or efficiently coding structured query language (SQL) queries [26,27], are adopted. As an HW method, tuning the configuration of a computing resource allocated to a DB can increase the DB performance [28,29]. To determine the settings required to maximize the efficiency of computing resource consumption, we focused on computing resource configurations to increase DB performance. Because OHDSI announced that its official support would be limited to PostgreSQL going forward [24], we selected PostgreSQL DB as the DB system. There were several configuration parameters that influenced DB performance [30,31,32,33], most of which were related to memory, storage, connection, checkpoint, and worker processes [34,35,36], which will be tuned in this study. A summarized description of each parameter is presented in Table 1 [30,31,32,33].

2.2.2. Database Usage Type

DB usage types can be largely divided into DA, OLTP, DW, general web server, and mixed-use [35,36]. We focused on DA, OLTP, and DW, which are mainly applicable to medical environments. Note that each hospital can use multiple DB types at the same time, but this paper assumes that only one DB type per hospital is used for convenience.
The DA type is for a general workstation that is not a dedicated database, and it is adopted by individuals for standalone usage. Memory- and checkpoint-related configurations should be set to a minimum because footprints can be minimized because they are for personal use. The DA type is suitable for combined server design with relatively little data and insufficient computing resources for personal use.
The OLTP type is a method in which multiple users on a network process unit task, such as frequently updating or inquiring data in a single database in real-time. This type often has a DB size that is larger than random access memory (RAM) to 1 TB in DB size; hence, only part of it should be loaded in the memory and used. Therefore, it is conventionally a central processing unit (CPU)-or input/output (I/O)-bound because it is influenced by the CPU rate and I/O when processing queries. In addition, this type should have a large memory-related configuration because it is a type that occurs in several small data write queries, some long transactions, and complex reads. This type can be applied to primary and secondary hospitals in a combined server design, where there is a high possibility of using large amounts of data but small computing resources.
The DW type is a typical I/O-or RAM-bound owing to a large data load because it mainly has a function that supports decisions using bulk loads of data and sizeable complex reporting queries. Therefore, this type should allocate sufficient computing resources to memory, query, and connection-related parameters. This type can be applied to secondary and tertiary hospitals that collect a large amount of data and support separate servers with sufficient computing resources.

2.2.3. DB Tuning

Several tools provide configuration-tuning recommendations for the aforementioned DB type [34]. These tools calculate the configuration values for PostgreSQL based on the maximum performance for a given computing resource. Because several settings depend on the size of the DB, the number of clients, the complexity of the query, and HW configuration must be specified for optimal database configuration. We present a new tuning recommendation by reconstructing the results from PGTune [35]and PGConfg [36] for the medical environment (Table 2).

2.2.4. Performance Measurement

Pgbench is a benchmark tool provided by PostgreSQL by default [37]. Queries such as select, insert, and update are combined to simulate, and the performance is evaluated at the number of transactions per second (TPS) obtained accordingly. In other words, the performance is measured by performing a transaction of a certain pattern in the currently installed HW and operating system environment. However, because pgbench can only assume a simple TPS and does not consider CPU, disk I/O, and memory, this study utilized pgbench tools [38], which improved the pgbench for comprehensive performance measurements. Pgbench tools are tools that automate benchmarking tests, allowing statistical collection of computing resource-related information, basic configuration, and memory usage monitoring. We compared performance changes according to the DB type and configuration on a server of the exact specification.

3. Results

Table 3 presents examples of building CDM servers and DBs in various infrastructures for CDM data from Seoul St. Mary’s Hospital, Yeouido St. Mary’s Hospital, and St. Vincent in Korea for each purpose, as well as applying the formula in Table 2. An example of the DA type is a case in which both a DB and an AP server are built on a personal desktop by collecting data from 1000 patients out of the entire Seoul St. Mary’s CDM database as an example. An example of the OLTP type is a case in which both DB and AP servers are built on the Amazon cloud server by collecting data from patients with eight diseases (non-small cell lung cancer, non-Hodgkin lymphoma, dyslipidemia, hypertension, type 2 diabetes mellitus, ischemic stroke, Alzheimer’s disease, and rheumatoid arthritis) of Seoul St. Mary’s Hospital. An example of the DW type is a case in which all CDM data from Seoul St. Mary, Yeouido St. Mary, and St. Vincent Hospital are extracted, and the DB server is built on the physical server, and the AP server is built on another cloud server and constructed with a separated design.
Table 4 presents TPS, average latency, 90th percentile latency, and maximum latency parameters according to the scale for each DB type. Scale factor refers to the size of the DB that multiplies the default size of DB. TPS decreased as scale increased in all DB types; however, average, 90th percentile, and maximum latencies exhibited no tendency according to scale.
Table 5 presents TPS, average latency, 90th percentile latency, and maximum latency parameters according to clients by DB type. The value of the client is the number of concurrent accesses to the DB. The maximum number of clients was set by subtracting 10 from max_connection for each DB type in Table 3, and the test was performed by dividing it into 5 parts. When the number of clients was the same in all DB types (client = 1, 5), the TPS, average latency, 90th percentile latency, and maximum latency values of each DB type were also similar. When comparing the max values of each client (DA client = 5, OLTP clients = 20, DW clients = 10), the TPS, average latency, 90th percentile latency, and maximum latency values were highest in the order of OLTP, DW, and DA.
Table 6 presents the results obtained from measuring the virtual memory status (vmstat) for 1 min during the test runtime. Regarding vmstat, the amount of memory used for the page cache field (cache) and the amount of free memory currently available field (free) for DA, OLTP, and DW were larger than those of other fields. These two fields are significantly larger than the other fields, thus the other features are invisible in the graph. The cache capacity was similar for OLTP and DW, and both of them were higher than those of DA. Free capacity was also similar for OLTP and DW, and both were lower than those of DA.
Table 7 presents the results obtained from measuring disk I/O status (disk) for 1 min during the test runtime. Regarding disks, DA, OLTP, and DW all recorded the largest value in the average size of write requests (wareq-sz), followed by the largest number of write requests per second (w/s). These values were obtained from 1 to 3 peaks for 1 min in all DB types. The rates of disk-related fields were similar for DA, OLTP, and DW.

4. Discussion

In this study, specific recommendations for customized servers and DB designs for medical institutions were proposed, considering the computing resource status of medical institutions using OHDSI OMOP CDM, and validated using actual examples of the proposed recommendation. This study proposed two types of server designs (combined/separated) and three types of DB designs (DA/OLTP/DW). Each design was applied to OMOP CDM systems, which were employed in one tertiary hospital and two secondary hospitals in Korea. The recommendation presented here is not based on the hospital itself but on the hospital’s HW resources. Therefore, this recommendation can be applied to hospitals in other countries because it is independent of the hospital’s locations.
We demonstrated that the configuration tuning of the computing resource needs to be customized according to the size of the data and the CDM service plan according to the medical institution. The obtained tuning results are presented in Table 3. To observe the effect of tuning itself, we only changed the configuration tuning according to the purpose, without altering the server specification, data amount, and service amount. The performance varied, depending on the tuning. TPS refers to the number of unit tasks processed per second, and latency is the time it takes for the server to receive a request from a client and send a response. The larger the scale, the smaller the TPS, and the larger the latency (Table 4). At the same scale, OLTP exhibited the highest TPS because the setting at OLTP had the largest number of max_connections. Latency was the highest in OLTP because the higher the throughput, the slower the response time (Table 4). If the number of clients is increased within the max_connection, the TPS increases because the number of unit tasks processed per second increases. Increasing the number of clients increased the throughput and thus increased the latency (Table 5). From the results, when HW resources are the same, the TPS and latency performance varies according to the hospital’s requirements (DB scale, the number of clients). To maintain the maximum performance on the same resource, it is important to properly tune according to the recommendations presented in this study. For example, in the case of a primary hospital, since the DB scale and number of clients are smaller than those of secondary and tertiary hospital, TPS and latency values can be reduced even with the same resource if the DA of Table 3 is used as the base when tuning.
The results of OLTP and DW were similar using the benchmark tool. In this study, we adopted the same system and measured the parameters by altering the DB configurations. OLTP and DW shared similar configurations in the shared_buffers, effective_cache_size, and maintenance_work_mem (max = 2 GB) fields. This explains why they exhibited similar results in the virtual memory status (Table 6). Disk performance exhibited similar results in OLTP and DW, which originated from the same disk speed and configuration (Table 7). From the results, we confirm that the resource usage rate varies according to configuration tuning even in the same resource. Therefore, this study proved that the configuration tuning should be different according to the type of hospital based on the recommendation.
The limitation of this study is that the number of max_connections is small. This is because it is designed assuming an environment where only the minimum applications provided by OHDSI are installed, and the number of researchers simultaneously accessing it is small. Unlike this assumption, as in the IBM cloud, there are cases where super-users reserve 15 connections by default to maintain DB status and integrity [39]. Max_connection must be increased according to the medical institution’s research needs. However, because too much max_connection reduces the working_mem that can be used per connection, it is not recommended to increase it unconditionally. In the case of the primary hospital simulation, data from 1000 randomly sampled patients in the tertiary hospital were used, but further studies are needed because the data are not directly obtained from the primary hospital. Another limitation is that there are more configurations other than the configurations covered in this study, and they were not all considered. Solely relatively critical configurations in performance were considered, such that even researchers who do not specialize in DB can easily adapt. Finally, upgrading the computing resource itself may be the definite method for increasing DB performance; however, it is not always possible to conduct this because of the budget. Our recommendation is to maximize the performance at PostgreSQL when the computing resource is fixed.
This study directly compared the performance of computing resources according to various design scenarios and configuration tuning and then presented recommendations for setting them. The configuration must be tuned carefully, considering the hospital’s resources and environment, and the size of the database must consider concurrent client connections, architecture, and connections.

Author Contributions

Conceptualization, T.M.K., S.J.P. and D.-J.C.; data curation, T.M.K.; methodology, T.M.K. and T.K.; software, T.M.K.; validation, T.M.K. and Y.-s.Y.; formal analysis, T.M.K.; investigation, T.M.K. and T.K.; resources, I.-Y.C. and D.-J.C.; data curation, T.M.K.; writing—original draft preparation, T.M.K.; writing—review and editing, T.K., I.-Y.C. and D.-J.C.; visualization, T.M.K.; supervision, I.-Y.C. and D.-J.C.; project administration, D.-J.C.; funding acquisition, D.-J.C. All authors have read and agreed to the published version of the manuscript.

Funding

This research was supported by a grant from the Korea Health Technology R&D Project through the Korea Health Industry Development Institute (KHIDI), funded by the Ministry of Health and Welfare, Republic of Korea (Grant No. HI19C0373). The publication cost of this article was funded by KHIDI and it had no role in the design or conduct of this research.

Institutional Review Board Statement

Not applicable.

Informed Consent Statement

Not applicable.

Data Availability Statement

Not applicable.

Conflicts of Interest

The authors declare no conflict of interest.

References

  1. Safran, C.; Bloomrosen, M.M.; Hammond, W.E.; Labkoff, S.; Markel-Fox, S.; Tang, P.C.; Detmer, D.E. Toward a national framework for the secondary use of health data: An American medical informatics association white paper. J. Am. Med. Inform. Assoc. 2007, 14, 1–9. [Google Scholar] [CrossRef] [Green Version]
  2. Shortliffe, E.H. The evolution of electronic medical records. Acad. Med. 1999, 74, 414–419. [Google Scholar] [CrossRef]
  3. Bleich, H.L.; Slack, W.V. Reflections on electronic medical records: When doctors will use them and when they will not. Int. J. Med. Inform. 2010, 79, 1–4. [Google Scholar] [CrossRef] [PubMed]
  4. Guttha, N.; Miao, Z.; Shamsuddin, R. Towards the development of a substance abuse index (SEI) through Informatics. Healthcare 2021, 9, 1596. [Google Scholar] [CrossRef]
  5. Observational Health Data Sciences and Informatics. The Book of OHDSI, 1st ed.; Observational Health Data Sciences and Informatics: Seoul, Korea, 2019; Available online: https://ohdsi.github.io/TheBookOfOhdsi/ (accessed on 30 March 2021).
  6. Lamer, A.; DePas, N.; Doutreligne, M.; Parrot, A.; Verloop, D.; Defebvre, M.-M.; Ficheur, G.; Chazard, E.; Beuscart, J.-B. Transforming french electronic health records into the observational medical outcome partnership’s common data model: A feasibility study. Appl. Clin. Inform. 2020, 11, 13–22. [Google Scholar] [CrossRef]
  7. Rho, M.J.; Kim, S.R.; Park, S.H.; Jang, K.S.; Park, B.J.; Choi, I.Y. Development common data model for adverse drug signal detection based on multi-center emr systems. In Proceedings of the 2013 International Conference on Information Science and Applications (ICISA), Pattaya, Thailand, 24–26 June 2013. [Google Scholar]
  8. Kent, S.; Burn, E.; Dawoud, D.; Jonsson, P.; Østby, J.T.; Hughes, N.; Rijnbeek, P.; Bouvy, J.C. Common problems, common data model solutions: Evidence generation for health technology assessment. PharmacoEconomics 2021, 39, 275–285. [Google Scholar] [CrossRef] [PubMed]
  9. Klann, J.G.; Joss, M.A.H.; Embree, K.; Murphy, S.N. Data model harmonization for the all of US research program: Transforming i2b2 data into the OMOP common data model. PLoS ONE 2019, 14, e0212463. [Google Scholar] [CrossRef] [Green Version]
  10. Schwalm, M.; Raoul, T.; Chu, D.; Shah, U.; Potdar, M.; Van Zandt, M.; Coffin, G.; Jouaville, S. Conversion of a french electronic medical record (Emr) database into the observational medical outcomes partnership common data model. Value Health 2017, 20, A741. [Google Scholar] [CrossRef]
  11. Kim, Y.H.; Ko, Y.-H.; Kim, S.; Kim, K. How closely is COVID-19 related to HCoV, SARS, and MERS? Clinical comparison of coronavirus infections and identification of risk factors influencing the COVID-19 severity using common data model (CDM). medRxiv 2021. [Google Scholar] [CrossRef]
  12. Williams, R.D.; Markus, A.F.; Yang, C.; Duarte Salles, T.; Falconer, T.; Jonnagaddala, J. Seek COVER: Development and validation of a personalized risk calculator for COVID-19 outcomes in an international network. MedRxiv 2020. [Google Scholar] [CrossRef]
  13. Warner, J.L.; Dymshyts, D.; Reich, C.G.; Gurley, M.J.; Hochheiser, H.; Moldwin, Z.H.; Belenkaya, R.; Williams, A.E.; Yang, P.C. HemOnc: A new standard vocabulary for chemotherapy regimen representation in the OMOP common data model. J. Biomed. Inform. 2019, 96, 103239. [Google Scholar] [CrossRef]
  14. Maier, C.; Lang, L.; Storf, H.; Vormstein, P.; Bieber, R.; Bernarding, J.; Herrmann, T.; Haverkamp, C.; Horki, P.; Laufer, J.; et al. Towards implementation of OMOP in a German university hospital consortium. Appl. Clin. Inform. 2018, 9, 54–61. [Google Scholar] [CrossRef] [PubMed] [Green Version]
  15. Overhage, J.M.; Ryan, P.B.; Reich, C.G.; Hartzema, A.G.; Stang, P.E. Validation of a common data model for active safety surveillance research. J. Am. Med. Inform. Assoc. 2012, 19, 54–60. [Google Scholar] [CrossRef] [PubMed] [Green Version]
  16. Griebel, L.; Prokosch, H.-U.; Köpcke, F.; Toddenroth, D.; Christoph, J.; Leb, I.; Engel, I.; Sedlmayr, M. A scoping review of cloud computing in healthcare. BMC Med. Inform. Decis. Mak. 2015, 15, 17. [Google Scholar] [CrossRef] [Green Version]
  17. Aceto, G.; Persico, V.; Pescapé, A. Industry 4.0 and health: Internet of things, big data, and cloud computing for healthcare 4.0. J. Ind. Inf. Integr. 2020, 18, 100129. [Google Scholar] [CrossRef]
  18. Chang, Y.-W.; Hsu, P.-Y. An empirical investigation of organizations’ switching intention to cloud enterprise resource planning: A cost-benefit perspective. Inf. Dev. 2017, 35, 290–302. [Google Scholar] [CrossRef]
  19. Sudhakar, G.; Karmouch, A.; Georganas, N. Design and performance evaluation considerations of a multimedia medical database. IEEE Trans. Knowl. Data Eng. 1993, 5, 888–894. [Google Scholar] [CrossRef]
  20. OHDSI. Publications—OHDSI. Available online: https://www.ohdsi.org/resources/publications/ (accessed on 30 March 2021).
  21. OHDSI. Observational Health Data Sciences and Informatics Repositories. GitHub.com. 2020. Available online: https://github.com/OHDSI/ (accessed on 3 April 2021).
  22. Liu, J.B.; Kelz, R.R. Types of hospitals in the United States. JAMA 2018, 320, 1074. [Google Scholar] [CrossRef]
  23. Bi, Y.; Zhu, D.; Cheng, J.; Zhu, Y.; Xu, N.; Cui, S.; Li, W.; Cheng, X.; Wang, F.; Hu, Y. The status of glycemic control: A cross-sectional study of outpatients with type 2 diabetes mellitus across primary, secondary, and tertiary hospitals in the jiangsu province of China. Clin. Ther. 2010, 32, 973–983. [Google Scholar] [CrossRef] [PubMed]
  24. OHDSI. Releases OHDSI/WebAPI GitHub. Available online: https://github.com/OHDSI/WebAPI/releases (accessed on 29 April 2021).
  25. Cioloca, C. Increasing database performance using indexes. Database Syst. J. 2011, 2, 13–22. Available online: https://pdfs.semanticscholar.org/1b96/91b7957ec3418c2b088177940de07483ee21.pdf (accessed on 29 April 2021).
  26. Myalapalli, V.K.; Savarapu, P.R. High performance SQL. In Proceedings of the 2014 Annual IEEE India Conference (INDICON), Pune, India, 11–13 December 2014. [Google Scholar]
  27. Myalapalli, V.K.; Totakura, T.P.; Geloth, S. Augmenting database performance via SQL tuning. In Proceedings of the 2015 International Conference on Energy Systems and Applications, Pune, India, 30 October–1 November 2015; pp. 13–18. [Google Scholar]
  28. Duan, S.; Thummala, V.; Babu, S. Tuning database configuration parameters with iTuned. Proc. VLDB Endow. 2009, 2, 1246–1257. [Google Scholar] [CrossRef] [Green Version]
  29. Kwan, E.; Lightstone, S.; Storm, A.; Wu, L.; Automatic Configuration for IBM DB2 Universal Database. Performance Technical Report. 2002. Available online: http://citeseerx.ist.psu.edu/viewdoc/download?doi=10.1.1.84.8661&rep=rep1&type=pdf (accessed on 29 March 2021).
  30. PostgreSQL. PostgreSQL: Documentation: 12: 19.4. Resource Consumption. Available online: https://www.postgresql.org/docs/12/runtime-config-resource.html (accessed on 29 March 2021).
  31. PostgreSQL. PostgreSQL: Documentation: 12: 19.7. Query Planning. Available online: https://www.postgresql.org/docs/12/runtime-config-query.html (accessed on 29 April 2021).
  32. PostgreSQL. PostgreSQL: Documentation: 12: 19.3. Connections and Authentication. Available online: https://www.postgresql.org/docs/12/runtime-config-connection.html (accessed on 29 April 2021).
  33. PostgreSQL. PostgreSQL: Documentation: 12: 19.5. Write ahead Log. Available online: https://www.postgresql.org/docs/12/runtime-config-wal.html (accessed on 29 April 2021).
  34. Shaik, B. Configure Your Database for Better Performance; PostgreSQL Configuration Apress: Berkeley, CA, USA, 2020; pp. 29–59. [Google Scholar] [CrossRef]
  35. Vasiliev, A. PGTune—Calculate Configuration for PostgreSQL Based on the Maximum Performance for a Given Hardware Configuration. Available online: https://pgtune.leopard.in.ua/#/ (accessed on 3 April 2021).
  36. Pgconfig.org. PGConfig—PostgreSQL Configuration Builder. Available online: https://www.pgconfig.org/ (accessed on 3 April 2021).
  37. PostgresSQL. PostgreSQL: Documentation: 13: Pgbench. Available online: https://www.postgresql.org/docs/current/pgbench.html (accessed on 30 March 2021).
  38. GitHub—Gregs1104/Pgbench-Tools: PostgreSQL Benchmarking Toolset. Available online: https://github.com/gregs1104/pgbench-tools (accessed on 27 May 2021).
  39. Managing PostgreSQL Connections. Available online: https://cloud.ibm.com/docs/databases-for-postgresql?topic=databases-for-postgresql-managing-connections&locale=en (accessed on 26 May 2021).
Figure 1. Combined Server Design for OHDSI OMOP CDM.
Applsci 11 12056 g001
Figure 2. Design adopted by one tertiary hospital and two secondary hospitals in Korea.
Applsci 11 12056 g002
Table 1. A summarized description of each parameter of PostgreSQL.
ParametersDescription
Memory
 shared_buffers
 effective_cache_size
 work_mem
 maintenance_work_mem

Amount of memory the DB server uses for shared memory buffers
Effective size of the disk cache available to a single query
Maximum amount of memory to be used by a query operation
Maximum amount of memory to be used by maintenance operations
Storage
 random_page_cost
 effective_io_concurrency

Planner’s estimate of the cost of a non-sequentially-fetched disk page
Number of concurrent disk I/O operations executed simultaneously
Query and Connection
 default_statistics_target
 max_connections

Default statistics target for table columns without a column-specific target set
Maximum number of concurrent connections to the database server
Write-Ahead Logging (WAL)
 min_wal_size
 max_wal_size
 checkpoint_completion_target
 wal_buffers

Minimum size to let the WAL grow during automatic checkpoints
Maximum size to let the WAL grow during automatic checkpoints
Target of checkpoint completion
Shared memory amount used for WAL data yet to be written to disk
Worker Processes
 max_worker_processes
 max_parallel_workers_per_gather
 max_parallel_workers
 max_parallel_maintenance_workers

Maximum number of background processes that the system can support
Maximum number of workers that can be started by a single Gather
Maximum number of workers that can support for parallel operations
Maximum number of parallel workers started by a single utility command
Table 2. DB configuration parameter tuning recommendation of PostgreSQL for medical environments.
DAOLTPDW
Hospital TypePrimarySecondary TertiaryTertiary
Data amountSmallMediumLarge
Number of ServersOneOneTwo or more
Server DesignCombinedCombinedSeparated
Memory
 shared_buffers
 effective_cache_size
 work_mem
 maintenance_work_mem (max = 2 GB)

RAM (GB)/16
RAM (GB)/4
RAM (GB)/6/MC
RAM (GB)/16

RAM (GB)/4
RAM (GB)/4 × 3
RAM (GB)/MC
RAM (GB)/16

RAM (GB)/4
RAM (GB)/4 × 3
RAM (GB)/2/MC
RAM (GB)/8
WStorage
 random_page_cost
 effective_io_concurrency

HDD = 4.0, SSD = SAN = 1.1
HDD = 2, SSD = 200, SAN = 300
Query and Connection
 default_statistics_target
 max_connections

100
15

100
30

500
20
Write-Ahead Logging
 min_wal_size
 max_wal_size
 checkpoint_completion_target
 wal_buffers (max = 16 MB)

100 MB
2 GB
0.5
SB × 0.03

2 GB
8 GB
0.9
SB × 0.03

4 GB
16 GB
0.9
SB × 0.03
Worker Processes
 max_worker_processes
 max_parallel_workers_per_gather
 max_parallel_workers
 max_parallel_maintenance_workers (max = 4)

CPU
CPU/2 (max = 4)
CPU
CPU/2

CPU
CPU/2 (max = 4)
CPU
CPU/2

Number of CPU
CPU/2
CPU
CPU/2
Table 3. Examples of applying DB configuration parameter tuning recommendations in actual scenarios.
DAOLTPDW
Data sourceCDM 1000 sample data per table from Seoul St. hospitalEight disease-related data from Seoul St. hospitalAll data from Seoul St. hospital, Yeouido St. hospital, and St. Vincent hospital
Number of Patient Data1000131,4117,956,745
DB Size12 GB76 GB634 GB
Number of ServersOneOneTwo
Server FormatPhysical DesktopCloud ServerPhysical Server
Server DesignCombinedCombinedSeparated
 Memory
 shared_buffers
 effective_cache_size
 work_mem
 maintenance_work_mem
32 GB
2 GB
8 GB
RAM (GB)/6/MC
2 GB
8 GB
2 GB
6 GB
RAM (GB)/MC
500 MB
128 GB
32 GB
96 GB
RAM (GB)/2/MC
2 GB
Storage
 random_page_cost
 effective_io_concurrency
SSD
1.1
200
SSD
1.1
200
HDD
4.0
2
Query and Connection
 default_statistics_target
 max_connections

100
15

100
30

500
20
Write-Ahead Logging
 min_wal_size
 max_wal_size
 checkpoint_completion_target
wal_buffers

100 MB
2 GB
0.5
6 MB

2 GB
8 GB
0.9
6 MB

4 GB
16 GB
0.9
16 MB
Worker Processes
 max_worker_processes
 max_parallel_workers_per_gather
 max_parallel_workersmax_parallel_maintenance_workers

20
4
20
4

36
4
36
4

16
8
16
4
Table 4. TPS, average latency, 90th percentile latency, and maximum latency by scale.
DB TypeScaleTPSAvg. Latency90%<Max Latency
DA134,7580.0810.0880.323
1034,1310.0820.0900.668
10033,9850.0830.0890.405
100031,1610.0910.1002.086
OLTP167,7520.1260.1606.104
1066,8290.1280.1627.385
10065,8000.1300.1658.161
100062,5350.1380.1767.512
DW147,0460.1020.1132.780
1048,4220.0960.1060.985
10048,1720.0960.1061.059
100045,4920.1030.11334.36
Table 5. TPS, average latency, 90th percentile latency, and maximum latency by client.
DB TypeClientTPSAvg_Latency90%<Max_Latency
DA113,7780.0710.0750.220
224,5310.0800.0871.049
333,9160.0860.090.874
443,9420.0890.0960.597
551,3760.0950.1101.612
OLTP113,8390.0710.0760.262
551,8800.0940.1081.638
1075,9880.1280.1444.134
1591,5360.1590.21710.829
2095,4030.2000.28419.591
DW113,4880.0740.0765.986
332,7610.0910.09515.557
550,6630.0970.11112.840
763,1090.1080.1216.617
1076,3950.1270.1437.979
Table 6. Virtual memory status for 1 min during test runtime.
Virtual Memory Status
DA Applsci 11 12056 i001
OLTP Applsci 11 12056 i002
DW Applsci 11 12056 i003
Note: Procs: r: the number of processes waiting for run time. b: the number of processes in uninterruptible sleep. Memory: swpd: the amount of virtual memory used. free: the amount of idle memory. buff: the amount of memory used as buffers. cache: the amount of memory used as cache. inact: the amount of inactive memory. (-a option). active: the amount of active memory. (-a option) Swap: si: amount of memory swapped in from disk (/s). so: amount of memory swapped to disk (/s). IO: bi: blocks received from a block device (blocks/s). bo: tlocks sent to a block device (blocks/s). System: in: the number of interrupts per second, including the clock. cs: the number of context switches per second. CPU: these are percentages of total CPU time. us: time spent running non-kernel code. (user time, including nice time). sy: time spent running kernel code. (system time). id: time spent idle. Prior to Linux 2.5.41, this includes IO-wait time. wa: time spent waiting for IO. Prior to Linux 2.5.41, included in idle. st: time stolen from a virtual machine. Prior to Linux 2.6.11, unknown.
Table 7. Disk I/O status for 1 min during test runtime.
.Disk I/O Status
DA Applsci 11 12056 i004
OLTP Applsci 11 12056 i005
DW Applsci 11 12056 i006
Note: r/s: The number of read requests that were issued to the device per second. w/s: the number of write requests that were issued to the device per second. rMB/s: the number of megabytes read from the device per second. wMB/s: the number of megabytes written to the device per second. rrqm/s: the number of read requests merged per second that were queued to the device. wrqm/s: the number of write requests merged per second that were queued to the device. %rrqm: the percentage of read requests merged together before being sent to the device. %wrqm: the percentage of write requests merged together before being sent to the device. rawait: the average time (in milliseconds) for read requests issued to the device to be served. This includes the time spent by the requests in queue and the time spent servicing them. wawait: the average time (in milliseconds) for write requests issued to the device to be served. This includes the time spent by the requests in queue and the time spent servicing them. aqu-sz: the average queue length of the requests that were issued to the device. rareq-sz: the average size (in kilobytes) of the read requests that were issued to the device. wareq-sz: the average size (in kilobytes) of the write requests that were issued to the device. svctm: the average service time (in milliseconds) for I/O requests that were issued to the device. %util: percentage of elapsed time during which I/O requests were issued to the device.
Publisher’s Note: MDPI stays neutral with regard to jurisdictional claims in published maps and institutional affiliations.

