Article

Optimization of Multi-Energy Microgrid Operation in the Presence of PV, Heterogeneous Energy Storage and Integrated Demand Response

School of Electrical Engineering, Shandong University, Jinan 250061, China
*
Author to whom correspondence should be addressed.
Appl. Sci. 2021, 11(3), 1005; https://doi.org/10.3390/app11031005
Submission received: 30 December 2020 / Revised: 19 January 2021 / Accepted: 20 January 2021 / Published: 22 January 2021
(This article belongs to the Special Issue Resilient and Sustainable Distributed Energy Systems)

Abstract

:
In this paper, a model is proposed for the optimal operation of multi-energy microgrids (MEMGs) in the presence of solar photovoltaics (PV), heterogeneous energy storage (HES) and integrated demand response (IDR), considering technical and economic ties among the resources. Uncertainty of solar power as well as the flexibility of electrical, cooling and heat load demand are taken into account. A p-efficient point method is applied to compute PV power at different confidence levels based on historical data. This method converts the uncertain PV energy from stochastic to deterministic to be included in the optimization model. The concept of demand response is extended and mathematically modeled using a linear function based on the quantized flexibility interval of multi-energy load demand. As a result, the overall model is formulated as a mixed-integer linear program, which can be effectively solved by the commercial solvers. The proposed model is implemented on two typical summer and winter days for various cases. Results of case studies show the important benefits for maximum PV utilization, energy efficiency and economic system operation. Moreover, the influence of the different confidence levels of PV power and effectiveness of IDR in the stochastic circumstances are addressed in the optimization-based operation.

1. Introduction

Challenges of the continued growth of energy requirements, as well as energy shortage and environmental problems and the existing energy production and consumption patterns, cannot meet the growing needs of metropolitan regions for future development. Power energy systems need a transformation to overcome the above concerns. The development of concepts such as energy internet [1] and integrated energy systems [2] provide new ideas for energy efficiency and utilizing multiple energy carriers as well as renewable energy. Multi-energy microgrids (MEMGs), as small-scale integrated energy systems including electricity, gas, cooling, heating and other forms of energy for intelligent buildings, residential communities, industrial parks and other regions, comprise the developing trends of integrated energy systems [3].
Extensive research works are carried out on the small-scale integrated energy systems, including modeling, optimizing system structures and operation strategies. For instance, certain authors proposed a comprehensive model to decide the component capacities in an integrated energy system for a Swedish building, considering the system planning and system operation simultaneously [4]. In [5], the multi-carrier energy system, including hydro–wind–solar–hydrogen–methane–carbon dioxide–thermal energies, are integrated and modeled in a zero-energy building. The authors of [6] proposed the optimization configuration of a regional integrated energy system based on typical residential area modules and typical commercial modules built on actual regional plots. In [7], a double-layer planning model for an integrated energy system at the community level is proposed that considers varying coupling factors to determine the optimal planning and operation schemes for the system. Another study [8] proposed a capacity planning and optimization model for an integrated energy system in an industrial park, aiming to minimize the cost per unit power generation. A multi-criteria decision-making method for a selection problem involving integrated energy system composition schemes in a practical industrial park is presented in [9].
With the increasing penetration of variable renewable energies (VRE) in MEMGs, considering the VRE-associated uncertainties in the system would make the results more realistic. On the one hand, various methods have been applied to model the uncertainties and obtain the optimal values in different research works. The stochastic method is one of the most common methods [10]. Solar and wind are the most widely used VRE in power energy systems worldwide [11]. In [12,13,14], a stochastic programming modeling framework is studied for solving the solar PV and wind power integrated smart energy hub scheduling problem. A Monte Carlo sampling method is used to generate the solar PV and wind power scenarios. The scenario reduction method is introduced to reduce the number of scenarios and simulation burden. The shortcoming of the above method is that it is computationally expensive, and the probability density functions of uncertain parameters are necessary. Robust optimization is another common method to handle the uncertainties. For instance, the authors of [15] proposed an interval optimization-based operational strategy for integrated energy systems to overcome uncertainties associated with VRE and loads. In [16], the authors proposed an interval-based integrated energy system planning with wind power integration, and the authors developed a probability-interval method to describe the uncertain wind power. In [17], a two-stage hybrid stochastic-information gap decision theory (IGDT) based on the network-constrained unit commitment framework is proposed for integrated power- and heat-based energy systems. In the framework, the uncertainties of load demands and wind power generation are studied using the Monte Carlo simulation method and IGDT, respectively. In [18], the authors proposed an IGDT-based robust problem model for multi-carrier energy system management; it uses an IGDT model for handling the uncertainties associated with VRE. Although the interval- and IGDT-based robust models are useful for uncertainties, optimization results are conservative [10]. A data-driven p-efficient point method was used to compute renewable generation amounts, taking into account the renewable uncertainties in the distribution system, and achieved satisfactory results [19]. To properly handle the uncertainties associated with VRE in MEMGs, the p-efficient point method based on historical VRE data is involved in this paper.
On the other hand, the energy storage systems (ESS) are known as a solution for the integrated energy systems with high VRE penetration. The authors of [20] described the role of electrical energy storage in an energy system dominated by distributed generation as well as possible modes of deployment of energy storage solutions in an industrial setting. In integrated energy systems, ESS may be used to enhance the potential energy and cost savings provided by combined heat and power (CHP) generation, if properly sized and operated [21]. In [22], authors proposed the optimal configuration of ESS in integrated energy system, taking into account reducing wind curtailment, price arbitrage, peak demand shaving and coordinated operation with CHP. In [23], the optimal schedule of battery-integrated energy systems is investigated with consideration of forecast error, and the optimal battery charging/discharging state is analytically obtained to maintain the real-time balance between supply and demand and simultaneously improve the system’s economy. A combination of applications of ESS and thermal energy storage seems more promising as it offers higher potential to achieve energy efficiency improvement and cost savings in integrated energy systems. For instance, the electrical–thermal hybrid energy storage is used for mitigating the problem of intermittency that plagues electrical and thermal renewable forms of energy in [24]. The use of the energy stored in the hybrid energy storage to supply part of the energy required by the heating load leads to a reduction of the amount of power supplied by the mains, thus reducing the microgrid operating costs. In [25], an optimal configuration method for community-integrated energy systems considering electrical and heat storage devices is proposed, which can meet the load requirements of electricity, cooling and heating in the system and ensure economic efficiency simultaneously. In [26], the effects of cold storage on the performance and efficiency of the energy hub operation cost are investigated; it is demonstrated that the ice storage performance increases the flexibility of the energy hub to apply more energy resources, which leads to the cost reduction alongside using other programs and storages. In [27], a risk-averse method for the optimal deployment of heterogeneous energy storage (HES), consisting of electrical and thermal energy storage, in a residential MEMG is proposed; results indicate that the deployment of electrical and thermal energy storage can effectively increase the system equivalent daily profit and make it more immune to the uncertainties. It is obvious from the specialized literature that integration of the heterogeneous energy storage with MEMGs has undeniable impacts on enhancement of the systems’ operation. In this paper, HES consisting of electrical, cooling and heating energy storage is exploited to provide a potentially cost-effective solution to enhance the flexibility of the MEMG system.
Demand response (DR) is an important measure to guide the customers to consume electricity rationally to achieve economic and efficient operation. Traditionally, DR programs only focused on the electricity pattern of the customers and aimed to shift electrical loads from peak periods to off-peak periods [28]. In the presence of multiple energy demands, the concept of DR is extended to the multiple energy sector and a new concept of demand response, known as integrated demand response (IDR), is developed [29,30]. In [31], a framework which enables buildings to carry out heating demand response for the integrated heating/electricity community energy systems is presented. In [32], a demand response mechanism of electro-thermal IES considering electrical and thermal load is proposed, and a multi-objective operation optimization model is established based on the DR mechanism to improve the economic and energy efficiency of IES. In [33], the authors addressed the concept of a hydrogen-based smart micro-energy hub considering IDR and a fuel cell-based hydrogen storage system. IDR is introduced to manage consumers’ load patterns not only by shifting their electrical loads, but also by shifting their heat loads. In the specialized literature, IDR is a novel and developing concept and yet researchable subject, although the research on IDR models or strategies is far from being a full investigation. In addition, the coordinated operation and optimal scheduling of multi-energy carriers with both the IDR and HES, including electrical, heating and cooling, are not considered thoroughly.
In reality, the implementation of IDR is inseparable from interaction between the end users and operator. As described in [34], the energy box in a cloud-based architecture can be used as one of the possible solutions for the communication and interaction between the end users and operator in the MEMG system. IDR, on the other hand, is also available as an energy management technique from the demand-side perspective. The energy flows’ control and optimization are crucial for MEMGs to have a clear picture of the coordination of supply and demand at the scheduling and operational phases, considering distributed energy resources (DERs) and IDR. There are already some analytical approaches applicable to the optimization of power flow control of DERs, such as cost-optimal control and rule-based control [35]. Recently, model predictive control (MPC)-based applications on the optimization of power flows in energy systems were proposed in [36] to minimize electricity cost and to maximize DR services. In the predictive control method, operation of both demand- and supply-side entities are optimally controlled. MPC-based applications on energy flow control in MEMG systems considering IDR and HES are interesting open research topics that need further study but are out of the scope of the present paper.
In view of the aforementioned discussion, this work focuses on the optimal operation of multi-energy microgrids for buildings in the presence of variable PV; HES consisting of electrical, heating and cooling energy storage; and IDR. The main contributions of this paper are as follows:
  • To properly handle the uncertainty of variable PV generation, the p-efficient point method is applied to determine the expected PV generation amounts based on historical data at given confidence levels and then incorporate them into the MEMG optimization problem.
  • A generalized model for IDR is developed, and the role of IDR in accommodating PV generation within MEMGs is investigated.
  • A mixed-integer linear programming (MILP) model for properly integrating and coordinating the deployment of IDR, HES and also the energy conversion facilities for economic system operation is proposed. Coordinated operation of electrical, heating and cooling energy storage is optimized.
  • The proposed model is implemented on two typical summer and winter days for various cases to validate its effectiveness and feasibility. According to the obtained results, the proposed strategy can help the system operator to reduce the total energy costs by 5.44% on a typical summer day and 3.5% on a typical winter day.
The rest of the paper is organized as follows: The MEMG system description and required concepts are presented in Section 2. The mathematical formulation of the proposed optimization model is presented in Section 3. In Section 4, various case studies are considered to evaluate the effectiveness of the proposed method, and results obtained are discussed. In Section 5, conclusions are drawn along with future work research directions.

2. System Modeling

2.1. System Description

The focus of this work is a multi-energy microgrid for buildings, which is a small-scale version of an integrated energy system consisting of electricity, natural gas, solar PV panels, different energy converters and multi-energy storage units to supply many types of electrical, cooling and heating loads. The structure of the studied MEMG system is shown in Figure 1.
Key features of the MEMG system can be summarized as follows:
  • Electricity and natural gas are the two principal energy carriers for the energy inputs, which are converted and delivered to end users. Coupling electrical and gas infrastructures is an efficient approach to the optimal operation of the two different energy systems.
  • Solar PV panels are integrated into the MEMG system. Unlike other renewable resources, solar power can be more easily applied to the demand side in distributed patterns, e.g., solar PV-integrated buildings [37].
  • The MEMG consists of a combined heat and power (CHP) system, gas boiler (GB), electrical heat pump (EHP), electric chiller (EC), absorption chiller (AC) and heterogeneous energy storage (HES), which are integrated into the MEMG system for transferring, converting or storing heterogeneous energy to meet the multi-energy demands and to improve the efficiency.
  • The HES consists of electrical energy storage (ES), a cooling storage (CS) tank and a heat storage (HS) tank, which are deployed for the purposes of tackling the intermittent outputs from solar power, shaving peak energy demands and achieving higher energy utilization flexibility.
  • The use of variable solar power and HES adds to the flexibility and complexity of MEMG operation at the same time.

2.2. Model of Components

2.2.1. CHP

The CHP is fed by natural gas and generates electricity and heat as co-products; it plays an important role in streamlining the interconnection of electrical and gas infrastructures. It should be mentioned that the power and heat generated by the CHP units are co-dependent and cannot be changed separately. The relation between the input and the output of the CHP unit is described as follows:
P E C H P ( t ) = η E C H P P C H P G a s ( t )
P H C H P ( t ) = η H C H P P C H P G a s ( t )
where P E C H P ( t ) and P H C H P ( t ) are the amount of electricity and heat outputs of the CHP unit, respectively, P C H P G a s ( t ) is the natural gas entering the CHP unit, η E C H P and η H C H P are the electrical and heat conversion efficiency, respectively.

2.2.2. GB

The gas boiler is fed by natural gas and generates heat. The heat energy produced by the boiler unit is calculated as follows:
P H G B ( t ) = η H G B P G B G a s ( t )
where P H G B ( t ) is the amount of heat production of the boiler and P G B G a s ( t ) and η H G B are the natural gas entering the boiler and the conversion coefficient from gas to heat through the boiler, respectively.

2.2.3. EHP

The electrical heat pump uses electrical energy as the input to provide heating energy in the heating mode. For the sake of simplicity, it assumes a constant relation between electricity input and heat output [38]:
P H E H P ( t ) = ζ E H P P E E H P ( t )
where P H E H P ( t ) is the amount of heat produced and P E E H P ( t ) and ζ E H P are the electricity consumed by the EHP and the average coefficient of performance, respectively.

2.2.4. EC

The electric chiller consumes electrical energy to produce cooling energy with cooling coefficient of performance:
P C E C ( t ) = ζ E C P E E C ( t )
where P C E C ( t ) is the amount of cooling produced and P E E C ( t ) and ζ E C are the electricity consumed by the EC and the cooling coefficient of performance of the EC, respectively.

2.2.5. AC

The absorption chiller absorbs heat energy and produces cooling energy according to a coefficient of performance:
P C A C ( t ) = ζ A C P H A C ( t )
where P C A C ( t ) is the amount of output cooling energy and P H A C ( t ) and ζ A C are the heat energy fed into the AC and the coefficient of performance of the AC, respectively.

2.2.6. HES

• ES
Battery storage, as one of the most widely used electrical energy storage types in power systems, is deployed in the MEMG system. To consider the battery storage, the amount of charged/discharged energy is expressed as
E B ( t ) = ( 1 κ B ) E B ( t 1 ) + ( η B , c h P B , c h ( t ) P B , d i s ( t ) η B , d i s ) Δ t
where E B is the electrical energy stored in the ES; κ B indicates the decay rate of ES, which is assumed to be a constant; P B , c h and P B , d i s respectively represent the charging and discharging power of the ES; and η B , c h and η B , d i s respectively represent the charging and discharging efficiency of the ES.
• HS and CS
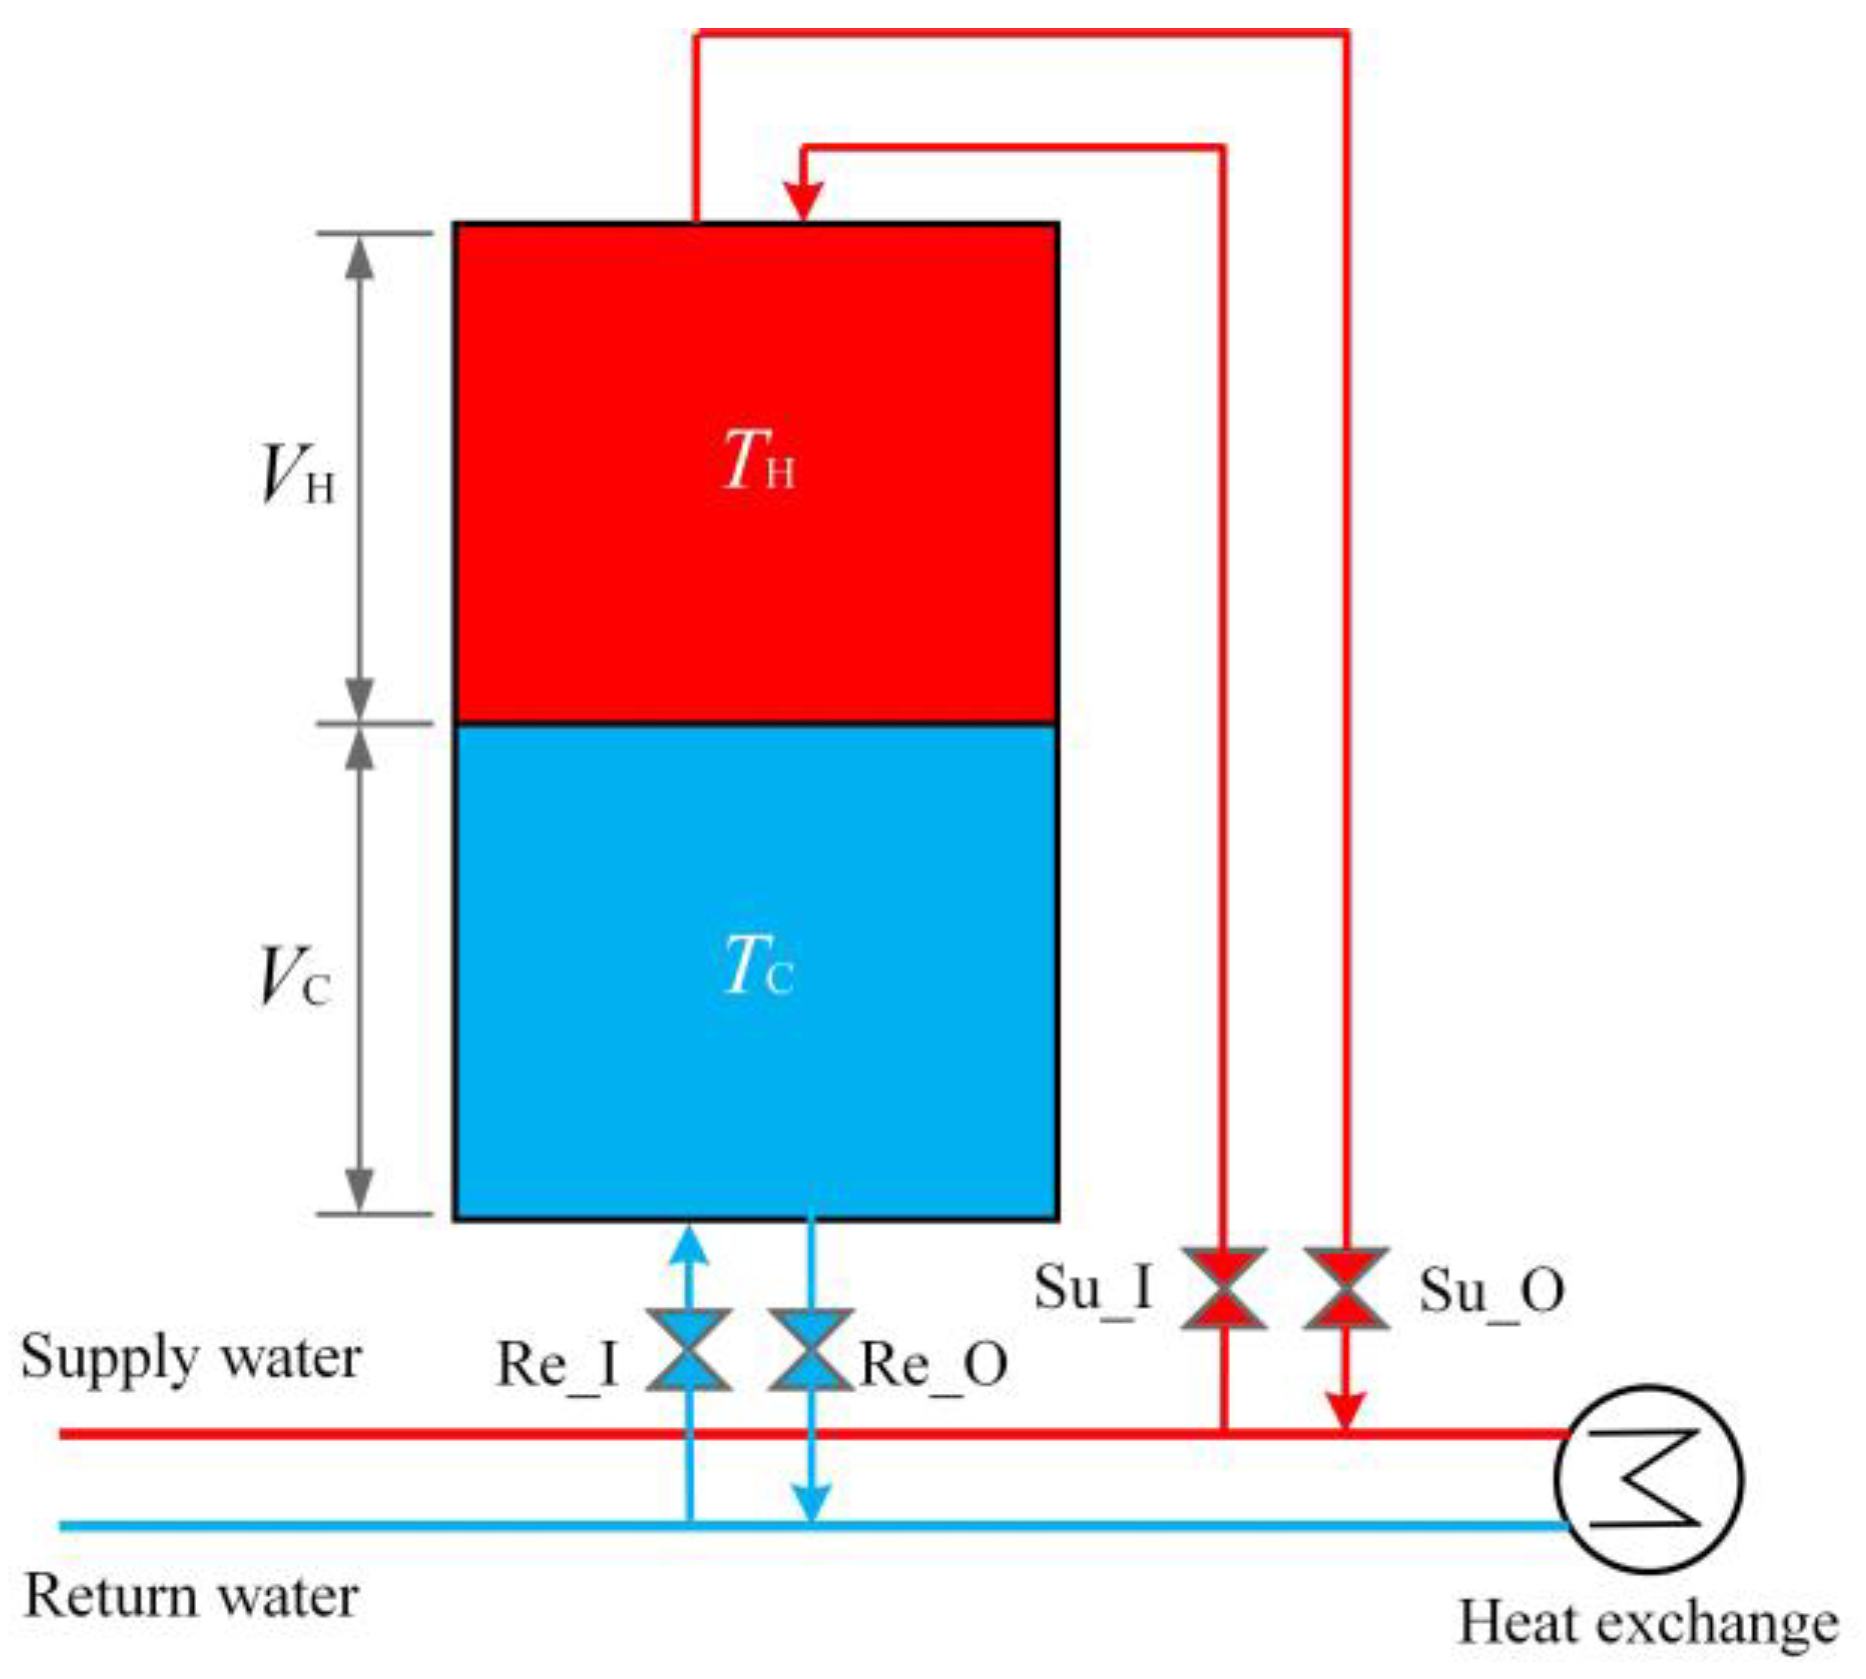
In the MEMG system, the heat storage tank and cooling storage tank are used to store heating and cooling energy, respectively. The way the HS and CS tanks work is similar, and the structure of the HS/CS tank [27] is shown in Figure 2. The HS (or CS) tank absorbs or releases heat (or cooling) energy by controlling the volume of hot or cold water ( V H or V C ). When a heat storage tank supplies heat, the temperature of the supply water ( T H ) becomes higher. When a cooling storage tank supplies cooling, the temperature of return water ( T C ) becomes higher.
The charging and discharging power of HS/CS tank can be formulated as
P ϕ , c h ( t ) = c W ρ W V H ( t ) ( T H T C )
P ϕ , d i s ( t ) = c W ρ W V C ( t ) ( T C T H )  
where P ϕ , c h and P ϕ , d i s respectively indicate the charging and discharging power of the HS/CS tank, the subscript ϕ represents the energy type—heating or cooling, c W represents the specific heat capacity of water, ρ W represents the density of water, V H and V C respectively represent the volume of the hot or cold water, and T H and T C represent the temperature of supply water and return water, respectively.
The heating/cooling storage energy utilization in the charge and discharge modes is defined in discrete time as follows:
E ϕ ( t ) = ( 1 κ ϕ ) E ϕ ( t 1 ) + η ϕ , c h P ϕ , c h ( t ) Δ t P ϕ , d i s ( t ) η ϕ , d i s Δ t
where E ϕ represents the heat or cooling energy stored in the tank; κ ϕ indicates the decay rate of HS or CS, which is assumed to be a constant; P ϕ , c h and P ϕ , d i s respectively represent the charging and discharging power of the HS or CS; and η ϕ , c h and η ϕ , d i s respectively represent the charging and discharging efficiency of the HS or CS.

2.2.7. Solar PV

For installed solar PV panels, power generated by the PV mostly depends on solar irradiance and ambient temperature. In reality, the forecast values of PV generation witness fluctuations due to uncertain solar radiation [39], thus accurate information of the PV generation for a future time is unpredictable. Therefore, the PV generation is stochastic and is an uncertain quantity. In this paper, the p-efficient point method is applied to determine the optimal amount of variable PV generation based on historical data at given confidence levels and then incorporates it into the MEMG optimization problem. A more detailed explanation of the proposed method is provided in the next section.

2.3. PV Uncertainty Handling

The p-efficient point method is a data-driven mathematical program used to determine probability efficient points of stochastic variables in a stochastic process, and then stochastic programming with probabilistic constraints can be converted into deterministic programming at a certain confidence level [19]. Y denotes a stochastic variable vector, v and w denote two realizations of Y, the probability distribution function of the stochastic vector is expressed as F Y ( v ) = Pr { v Y } and the p-level set of the stochastic vector is Y p = { v n : F Y ( v ) p } . According to [40], the p-efficient point is defined as follows.
Theorem 1.
For a given p∈(0,1), a point v n is called a p-efficient point of the probability distribution function FY, if F Y ( v ) p and there is nowv, wv such that F Y ( w ) p .
From the above, F Y ( w ) = Pr { w Y } p is equivalent to w v at a probability level p when v is the p-efficient point. Thus, a probabilistic chance-constrained Pr { w Y } p can be converted into a deterministic constraint w v . The solution of the p-efficient point based on historical data is key for the conversion. Without loss of generality, suppose S is the finite set of scenarios characterizing the probability distribution of the n-dimensional stochastic vector Y = ( y 1 , y 2 , , y n ) , and let y s = ( y 1 s , y 2 s , , y n s ) be the deterministic vector representing the realization of the stochastic vector Y under scenario s S . The probability of each scenario s is denoted by ϖ s , where ϖ s = Pr ( y s = Y ) > 0 and s S ϖ s = 1 . According to [40], the p-efficient point is calculated as follows:
min i = 1 n v i
s . t : s S ϖ s χ s p
v i y i s χ s , i = 1 , 2 , , n , s S
χ s { 0 , 1 } | S |
v + n
where v i v represents the components of realization of the stochastic variables based on historical data samples and χ s is a binary variable that is equal to 1 if all constraints v i y i s are met and that takes the value 0 otherwise.
It follows that a p-efficient point is the minimum point of a given confidence level set Y p = { v n : F Y ( v ) p } . The p-efficient point solution serves as the expected PV generation amount that can ensure the efficient consumption of solar PV and simultaneously the reliability of MEMGs in managing the uncertainty in PV.

2.4. IDR

A generalized IDR model is proposed in this section, considering not only the electrical load demand response, but also the heating and cooling loads’ demand responses. As shown schematically in Figure 1, we denote by H the set of energy hubs, and each energy carrier—i.e., the electricity carrier, heat carrier and cooling carrier, respectively—is attached to each energy hub K H. Let D denote the set of real energy demands. Demand at each energy hub K is aggregated and denoted by P K D ( t ) D. Let K , t d be a proportion of the load delivered at energy hub K at the time period t. Then, the flexibility interval of multiple energy demand is defined around K , t d = 1. Suppose [ K , t , K , t + ] is the flexibility interval of the demand at energy hub K at the time period t. The flexibility of multiple energy demands comes from the responsive loads participating in demand response programs at each energy hub K . If the demand at energy hub K in the time interval t is flexible, 0 ≤ K , t ≤ 1 and K , t + ≥ 1 are used to denote the scaled-down load and the scaled-up load, respectively. If the demand at energy hub K is not flexible, then K , t = K , t + = 1. Therefore, the model of the proposed IDR can be formulated in a linear form.
P K D ( t ) = ( 1 + Δ γ K , t ) P K D ( t )
Δ γ K , t = γ K , t + γ K , t
0 γ K , t + K , t + 1
0 γ K , t 1 K , t
where γ K , t and γ K , t + represent the decrease and increase of proportion in the amount of real energy load delivered to the demand at each energy hub K , respectively. The subscript K represents the energy type, which can be electricity, heating or cooling. (1 − K , t ) and ( K , t + − 1) indicate the upper limit proportions of the demand P K D ( t ) that can be decreased or increased, respectively.
This paper solves the optimization problem over a 24-h period on an hourly basis. To ensure conservation of the demand at each energy hub K , total decreased load must be equal with increased amount over the considered time horizon (i.e., a 24-h period), which is described as follows:
t = 1 T P K , t D , d e c = t = 1 T P K , t D , i n c

3. Problem Formulation

In this section, the mathematical framework of the proposed optimization model for the optimal operation of the MEMG is presented. The optimization model takes the minimized energy cost as the optimization objective, with solar PV, the terminal energy demands, the parameters of equipment and energy price as the inputs, and the optimal scheduling of equipment, optimal charging/discharging of HES, optimal scheduling of IDR, optimal scheduling electricity and gas energies as well as energy cost as the outputs. The details of the proposed model are described as follows.

3.1. Objective Function

The main goal of the proposed model is to minimize the costs associated with the imported energy (i.e., electricity and gas purchasing) and demand side management through deploying the full potential of the MEMG resources, ensuring the electrical, cooling and heating demands are satisfied.
The objective function for the MEMG optimization problem is expressed as follows:
min t = 1 T [ λ g r i d ( t ) P G r i d ( t ) + λ g a s ( t ) P Gas ( t ) ] + t = 1 T K [ ( σ K , t d + K , t + + σ K , t d K , t ) P K D ( t ) ]
where the first term represents the cost of the power and natural gas purchased from utility, wherein λ g r i d ( t ) and λ g a s ( t ) are the electricity price and gas price, respectively. The second term expresses the cost of IDR; σ K , t d and σ K , t d + are the cost of downward and upward regulation of the demand at energy hub K , respectively.

3.2. Constraints

The objective function is subjected to the following constraints.
(1) The electrical, heating and cooling energy balance are expressed as follows:
P Grid ( t ) + P P V ( t ) + P E C H P ( t ) + P B , d i s ( t ) = P E E C ( t ) + P E E H P ( t ) + P B , c h ( t ) + P E D ( t )
P H C H P ( t ) + P H G B ( t ) + P H E H P ( t ) + P H , d i s ( t ) = P H A C ( t ) + P H , c h ( t ) + P H D ( t )
P C E C ( t ) + P C A C ( t ) + P C , d i s ( t ) = P C , c h ( t ) + P C D ( t )
(2) The energy conversion facilities’ power limitations are expressed as follows:
0 P CHP ( t ) P M a x CHP
0 P GB ( t ) P M a x GB
0 P EHP ( t ) P M a x EHP
0 P EC ( t ) P M a x EC
0 P AC ( t ) P M a x AC
0 P PV ( t ) P M a x PV
where P M a x CHP , P M a x GB , P M a x EHP , P M a x EC , P M a x AC and P M a x PV stand for the maximum output power limits for the CHP, gas boiler, electrical heat pump, electric chiller, absorption chiller and PV, respectively.
(3) The technical constraints of the HES
The operational constraints of the battery storage are expressed as
0 P B , c h ( t ) μ B P B , c h max
0 P B , d i s ( t ) ( 1 μ B ) P B , d i s max
E B min E B ( t ) E B m ax
E B ( T ) = E B ( 0 )
Equations (25) and (26) express the minimum and maximum limits of charging/discharging power for the ES, wherein μ B is a binary charging/discharging state. Equation (27) expresses the minimum and maximum energy stored in the ES. Equation (28) expresses that the energy stored in the ES at the end of the considered time horizon must be equal to the initial one.
The operational constraints of the HS/CS are expressed as
μ ϕ P ϕ , c h min P ϕ , c h ( t ) μ ϕ P ϕ , c h max
( 1 μ ϕ ) P ϕ , d i s min P ϕ , d i s ( t ) ( 1 μ ϕ ) P ϕ , d i s max
E ϕ min E ϕ ( t ) E ϕ max
E ϕ ( T ) = E ϕ ( 0 )
Equations (29) and (30) express the minimum and maximum limits of charging/discharging power for the HS and CS, respectively, wherein μ ϕ is a binary charging/discharging state. Equation (31) expresses the upper and lower bounds of the stored heating/cooling energy in the HS/CS. Equation (32) denotes that the energy stored in the HS/CS at the end of the considered time horizon must be equal to the initial one.
(4) The input natural gas and electricity limitations are described by:
P Gas ( t ) = P C H P Gas ( t ) + P G B Gas ( t )
0 P Gas ( t ) P M a x Gas
0 P Grid ( t ) P M a x Grid
where P C H P Gas and P G B Gas represent the gas consumed by the CHP and GB, respectively. Equation (34) describes that the scheduled gas cannot exceed the maximum pipeline capacity. Equation (35) describes that the scheduled electrical power cannot exceed the maximum capacity of the tie-line between the MEMG and utility grid.
Further, the model of IDR includes Equations (13) and (14).

4. Case Studies

This section presents the validation results of the proposed optimization model, applied in the MEMG system for a commercial building presented in Figure 1. The simulation parameters of this test system are listed in Table 1.
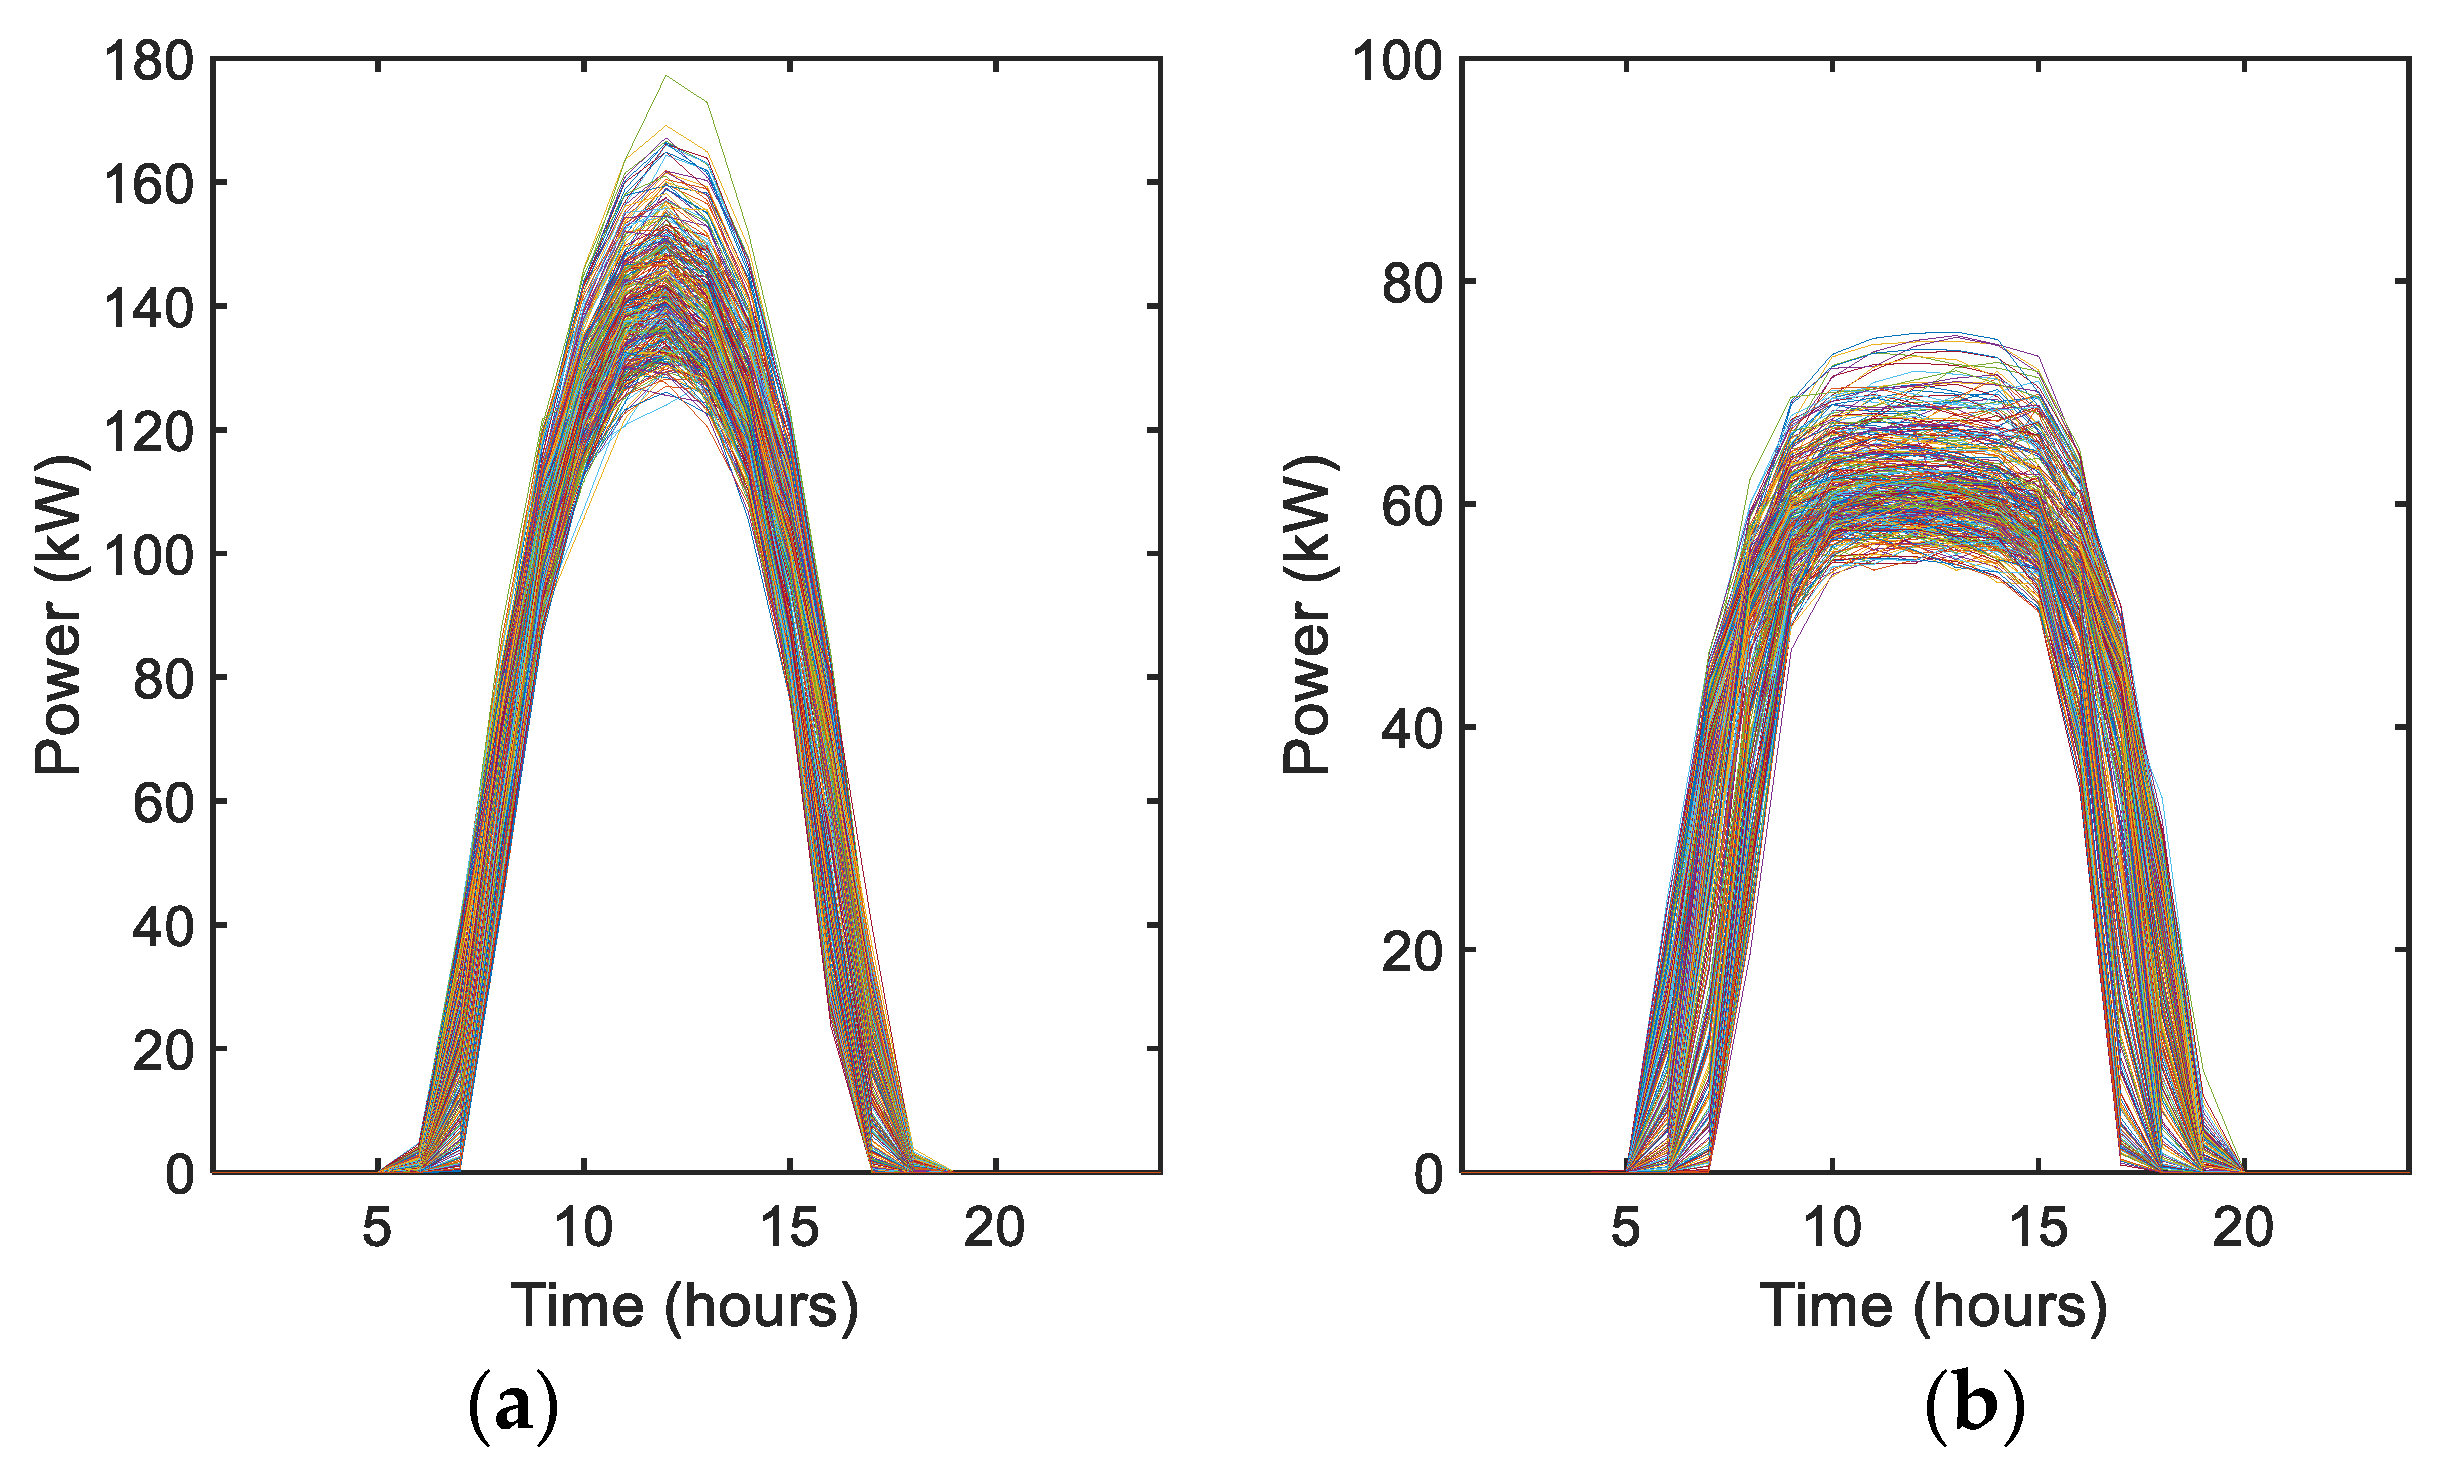
The installed solar PV capacity in the MEMG system is 180 kW. Due to the PV power generation having strong uncertainty, the p-efficient point method is proposed to determine the available PV generation based on historical data for typical days. Figure 3 shows the historical data for solar PV generation used for the p-efficient point method. It is noteworthy that the proposed formulation is implemented on two typical summer and winter days for various cases to verify the effectiveness of the proposed formulation. Furthermore, the effect of the different confidence levels of PV generation and effectiveness of IDR in the stochastic circumstances are addressed on the optimization-based operation. All the simulations have been carried out using MATLAB 2017a by calling the CPLEX solver [41] on a PC with Intel Core i5 CPU and 8 GB RAM.

4.1. Optimization Results

4.1.1. Typical Summer Day

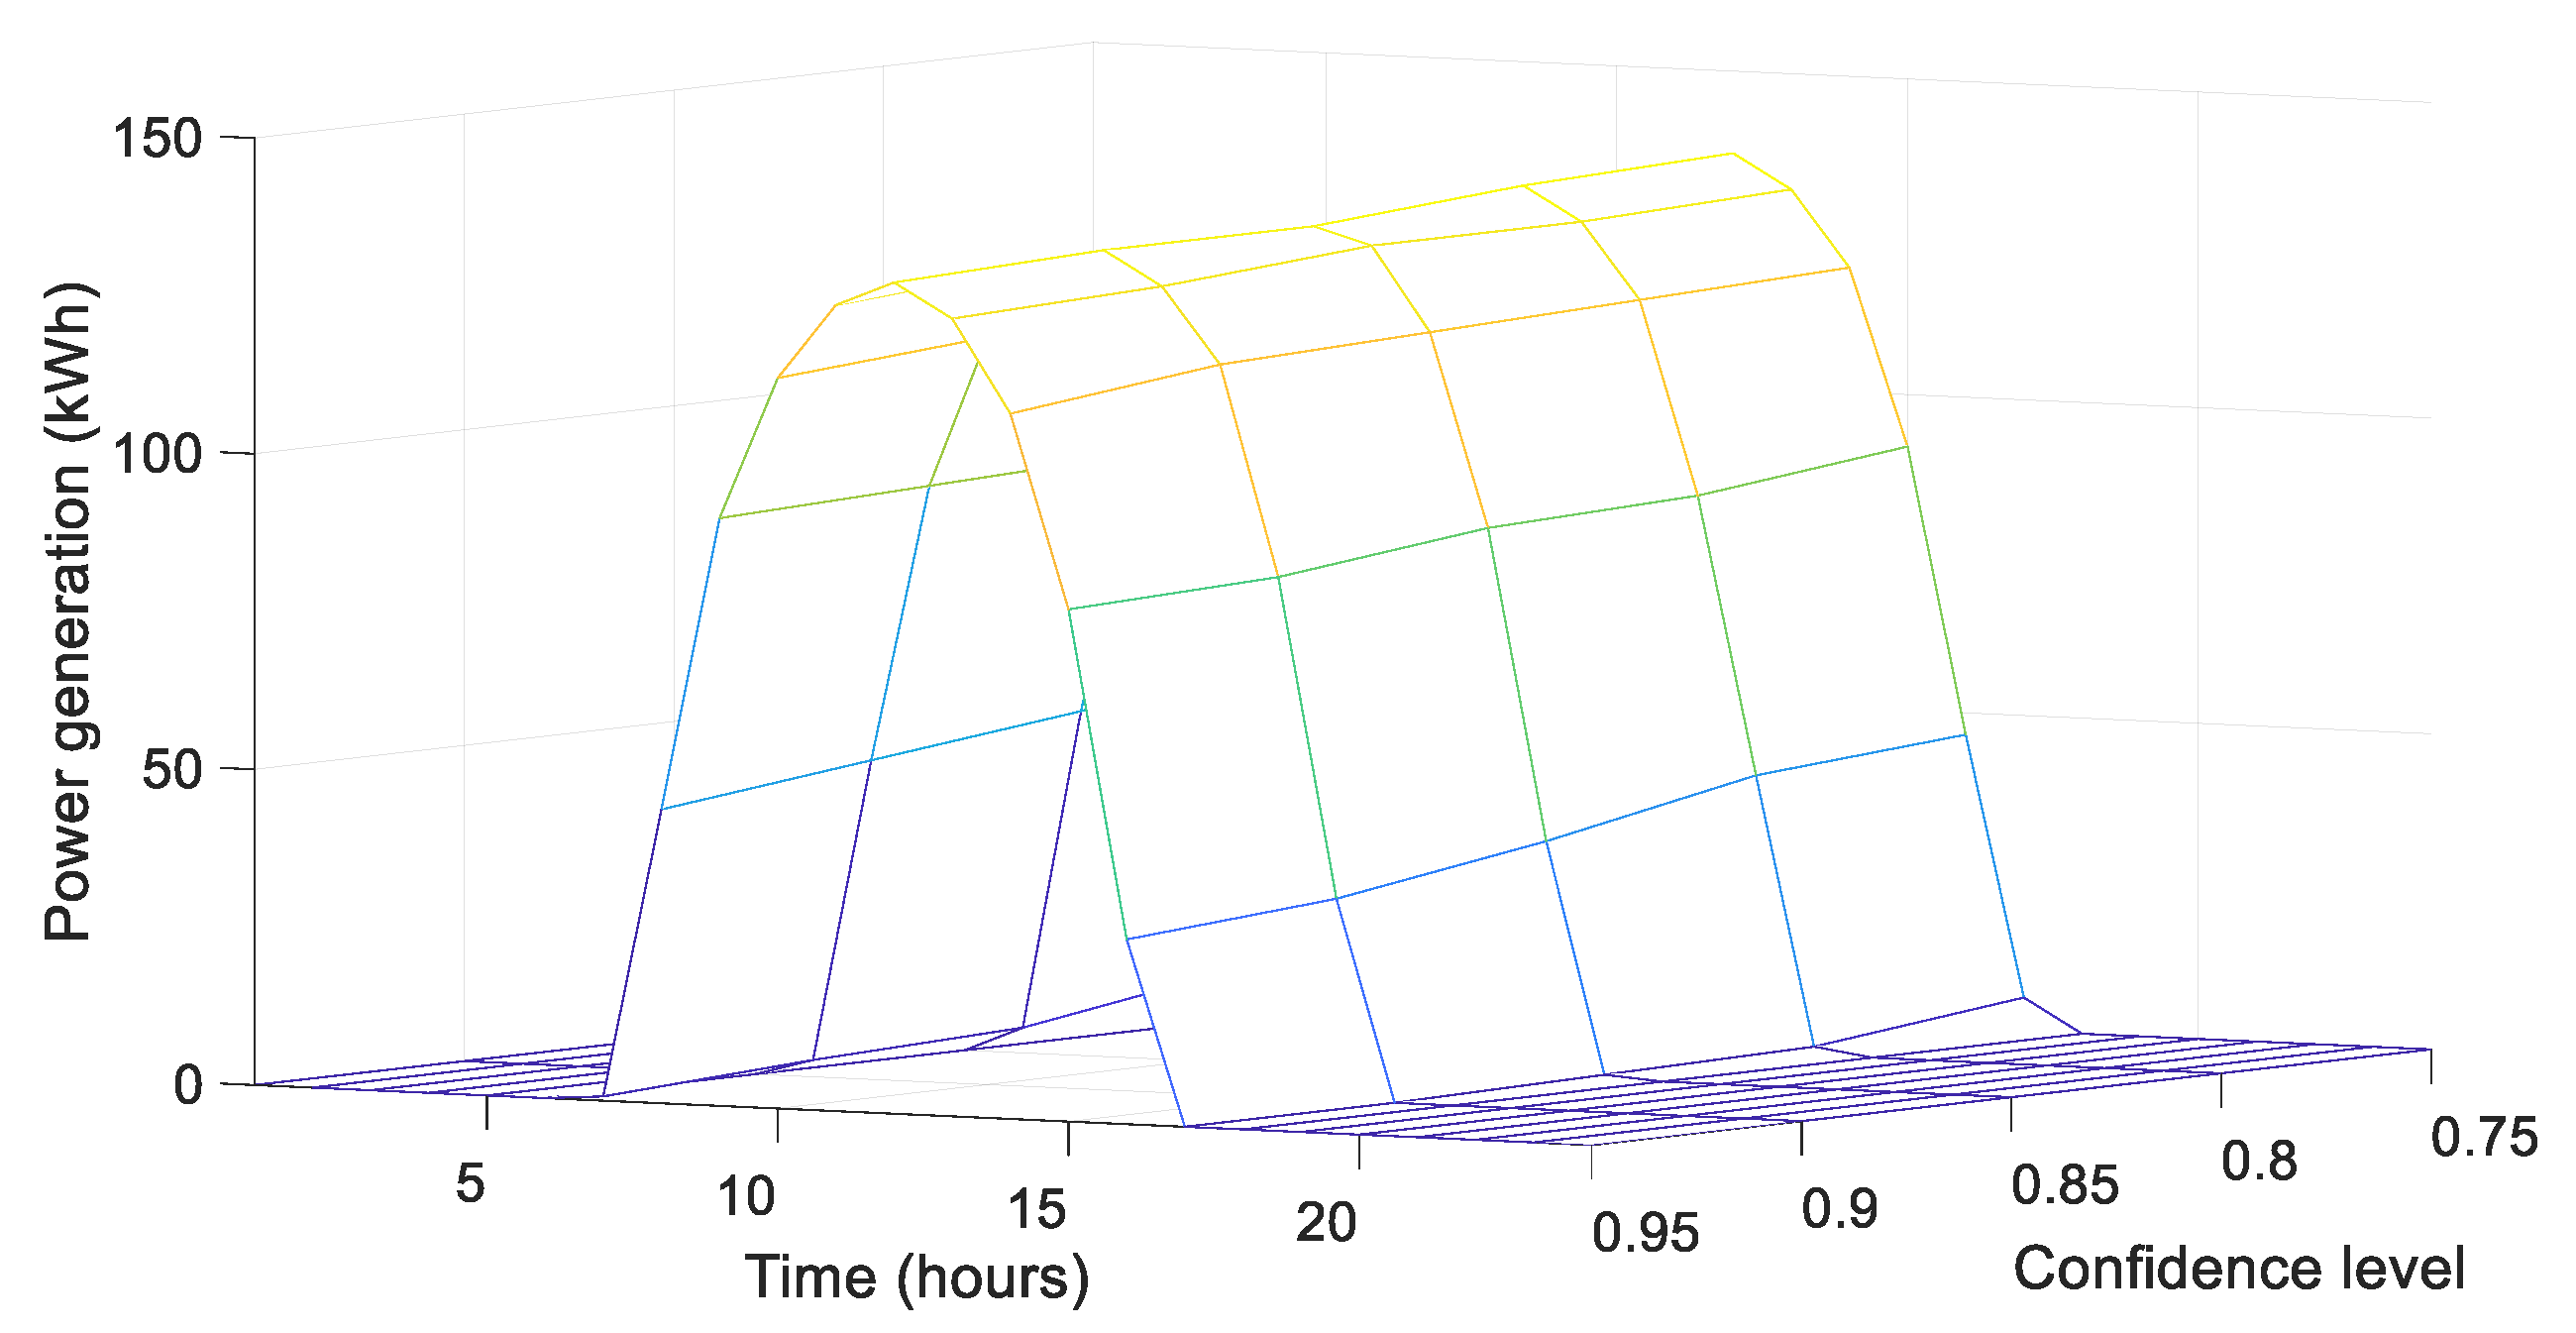
The initial daily electrical/cooling/heating load profiles for a typical summer day and time-of-use (TOU) electricity price are illustrated in Figure 4. PV generation obtained by the p-efficient point method based on historical data at different confidence levels is illustrated in Figure 5. In this set of tests, gas price is considered as a fixed price of 2.76¥/m3, PV generation obtained by the p-efficient point method at confidence level 0.9 is used, and it is assumed that 10% of the initial electrical/cooling/heat load participates in IDR. This study solves the optimization problem over a 24-h period on an hourly basis. Time horizon is separated into three periods: peak periods from 8 to 12 and 17 to 20, off-peak periods from 12 to 17 and 20 to 24, and valley periods from 1 to 7.
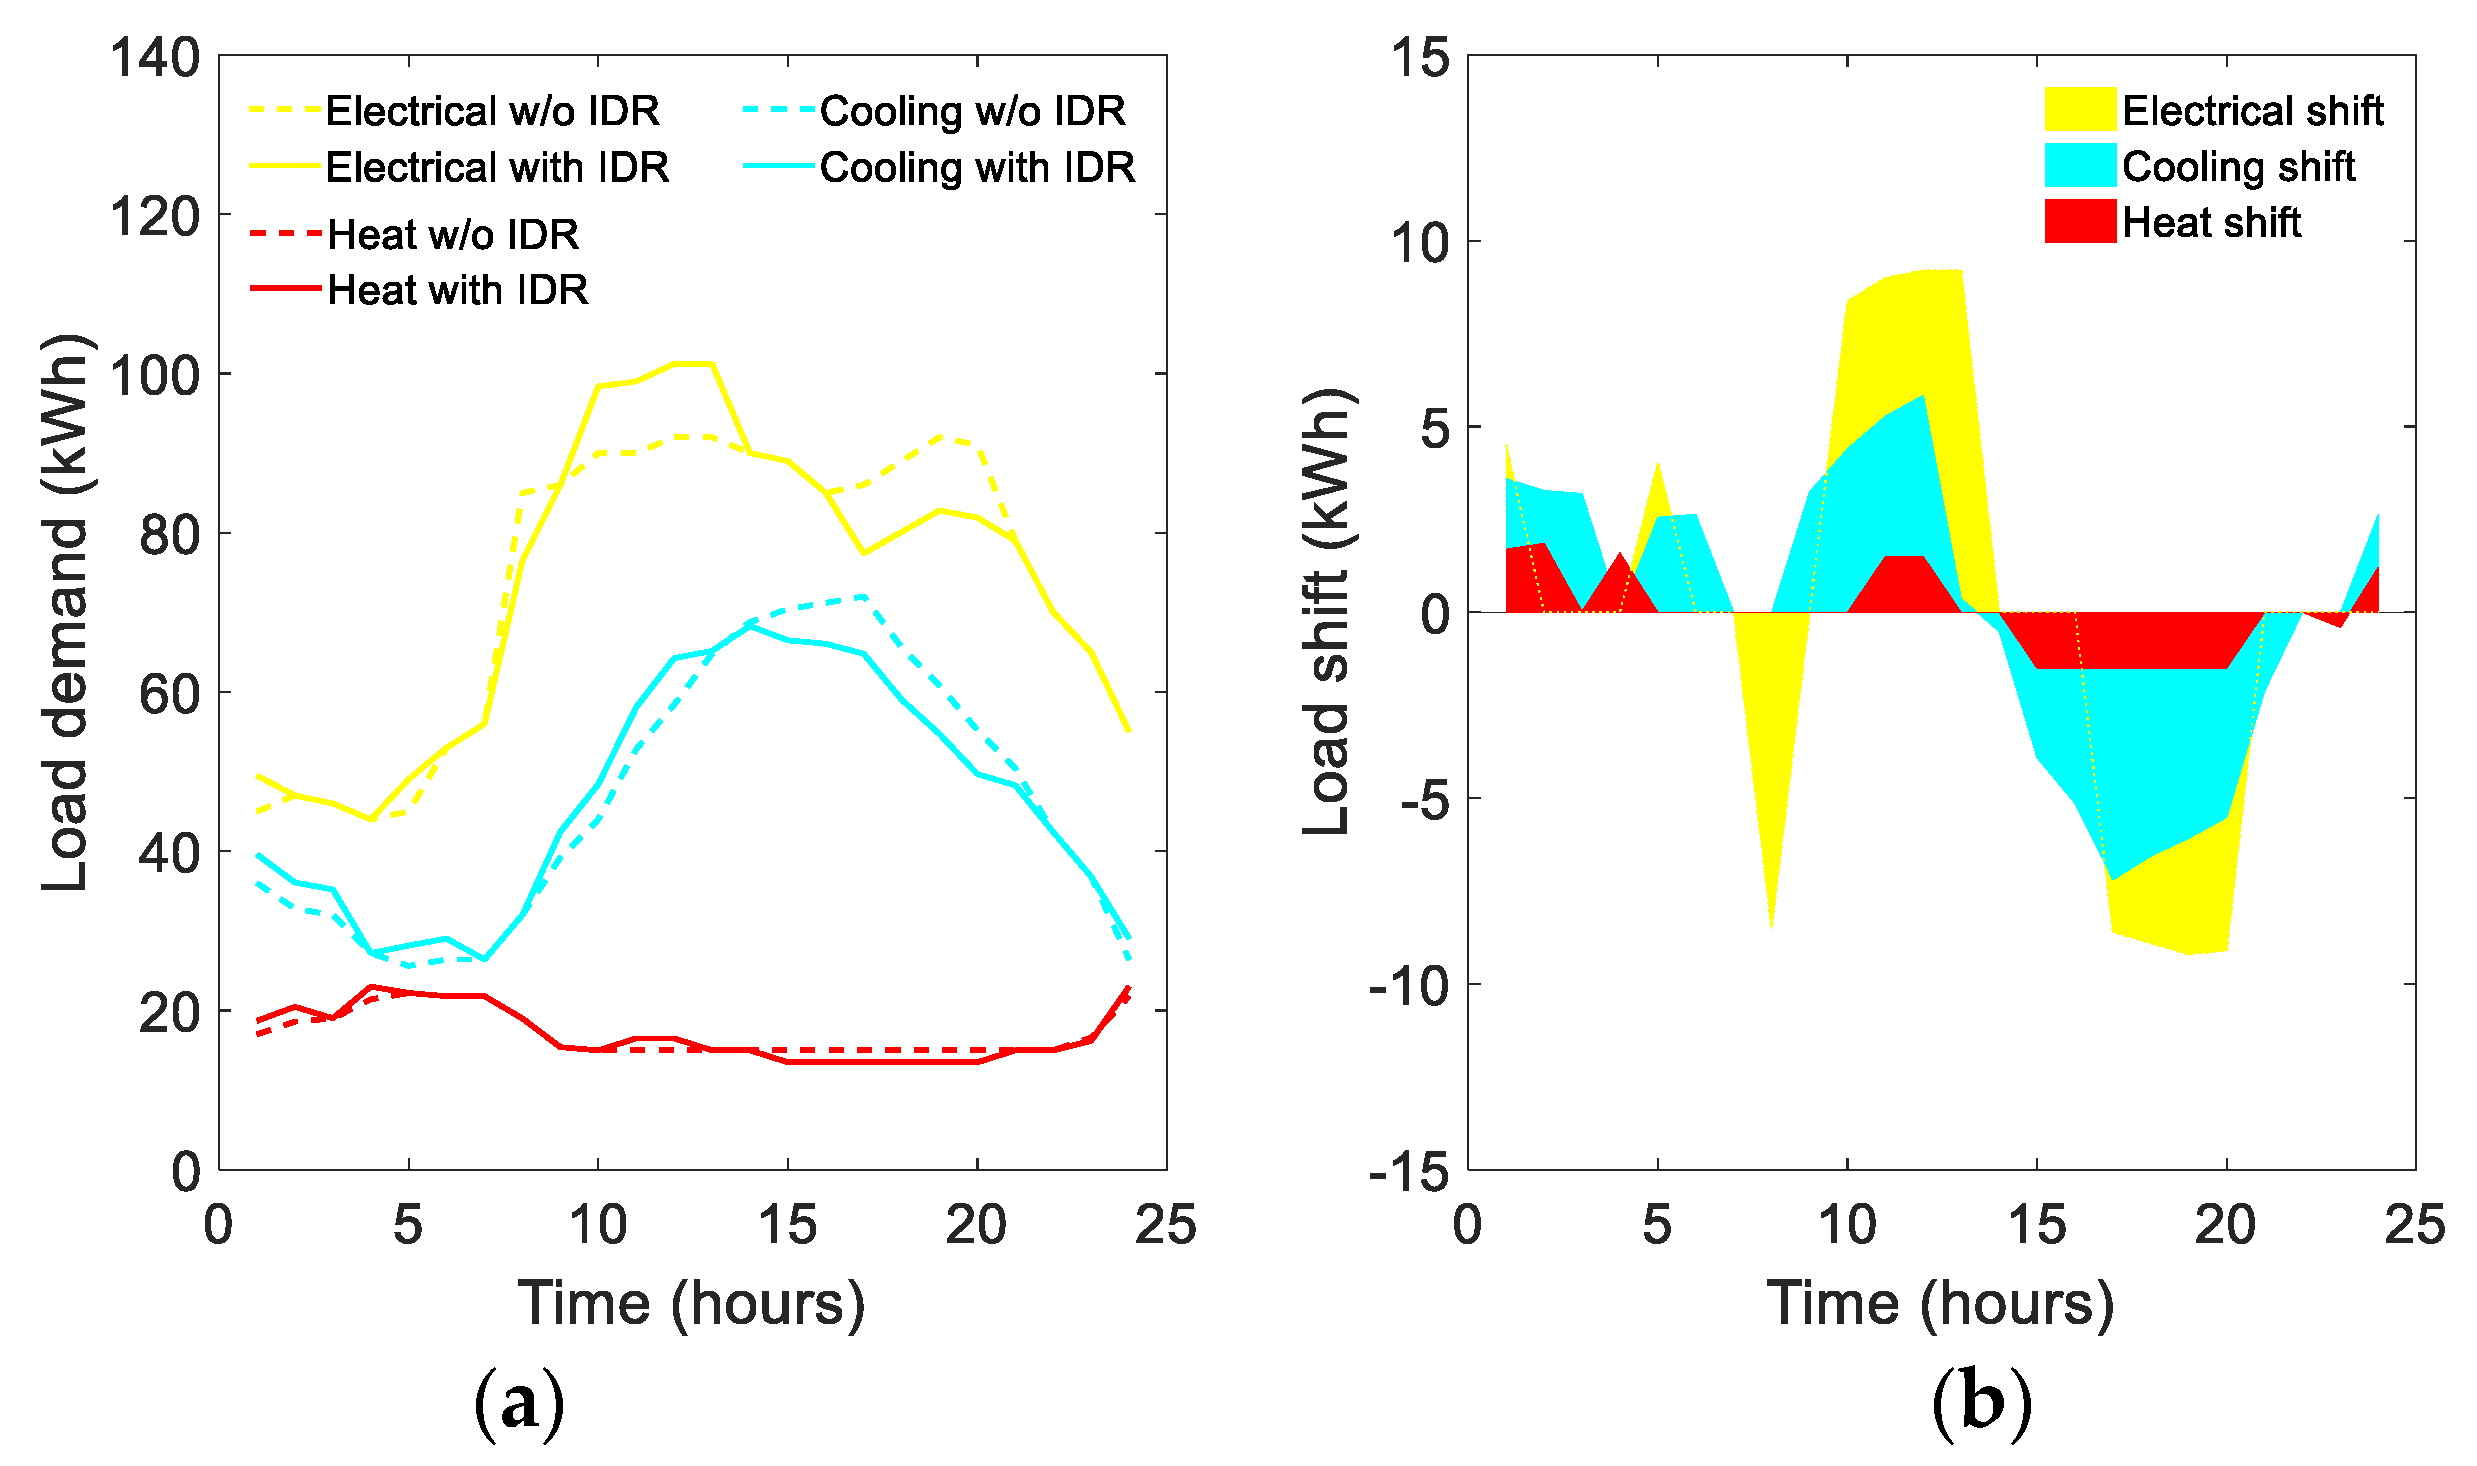
The optimized electrical, cooling and heating load profiles with and without considering IDR are comparatively studied in Figure 6a. The shift amount of electrical, cooling and heating loads in the entire scheduling period, i.e., a 24-h period on an hourly basis, is indicated in Figure 6b.
As observed in Figure 6, after performing the proposed optimization model, the electrical, cooling and heating load demands of peak periods are reduced and a certain amount is shifted to the valley period, which adjusts the peak by filling the valley sag. Meanwhile, a relatively large amount of the load demands of peak periods is shifted to the period 10–14; this leads to an increase in the load demands so as to consume PV-rich power, which is significant for PV power accommodation in the summer scenario.
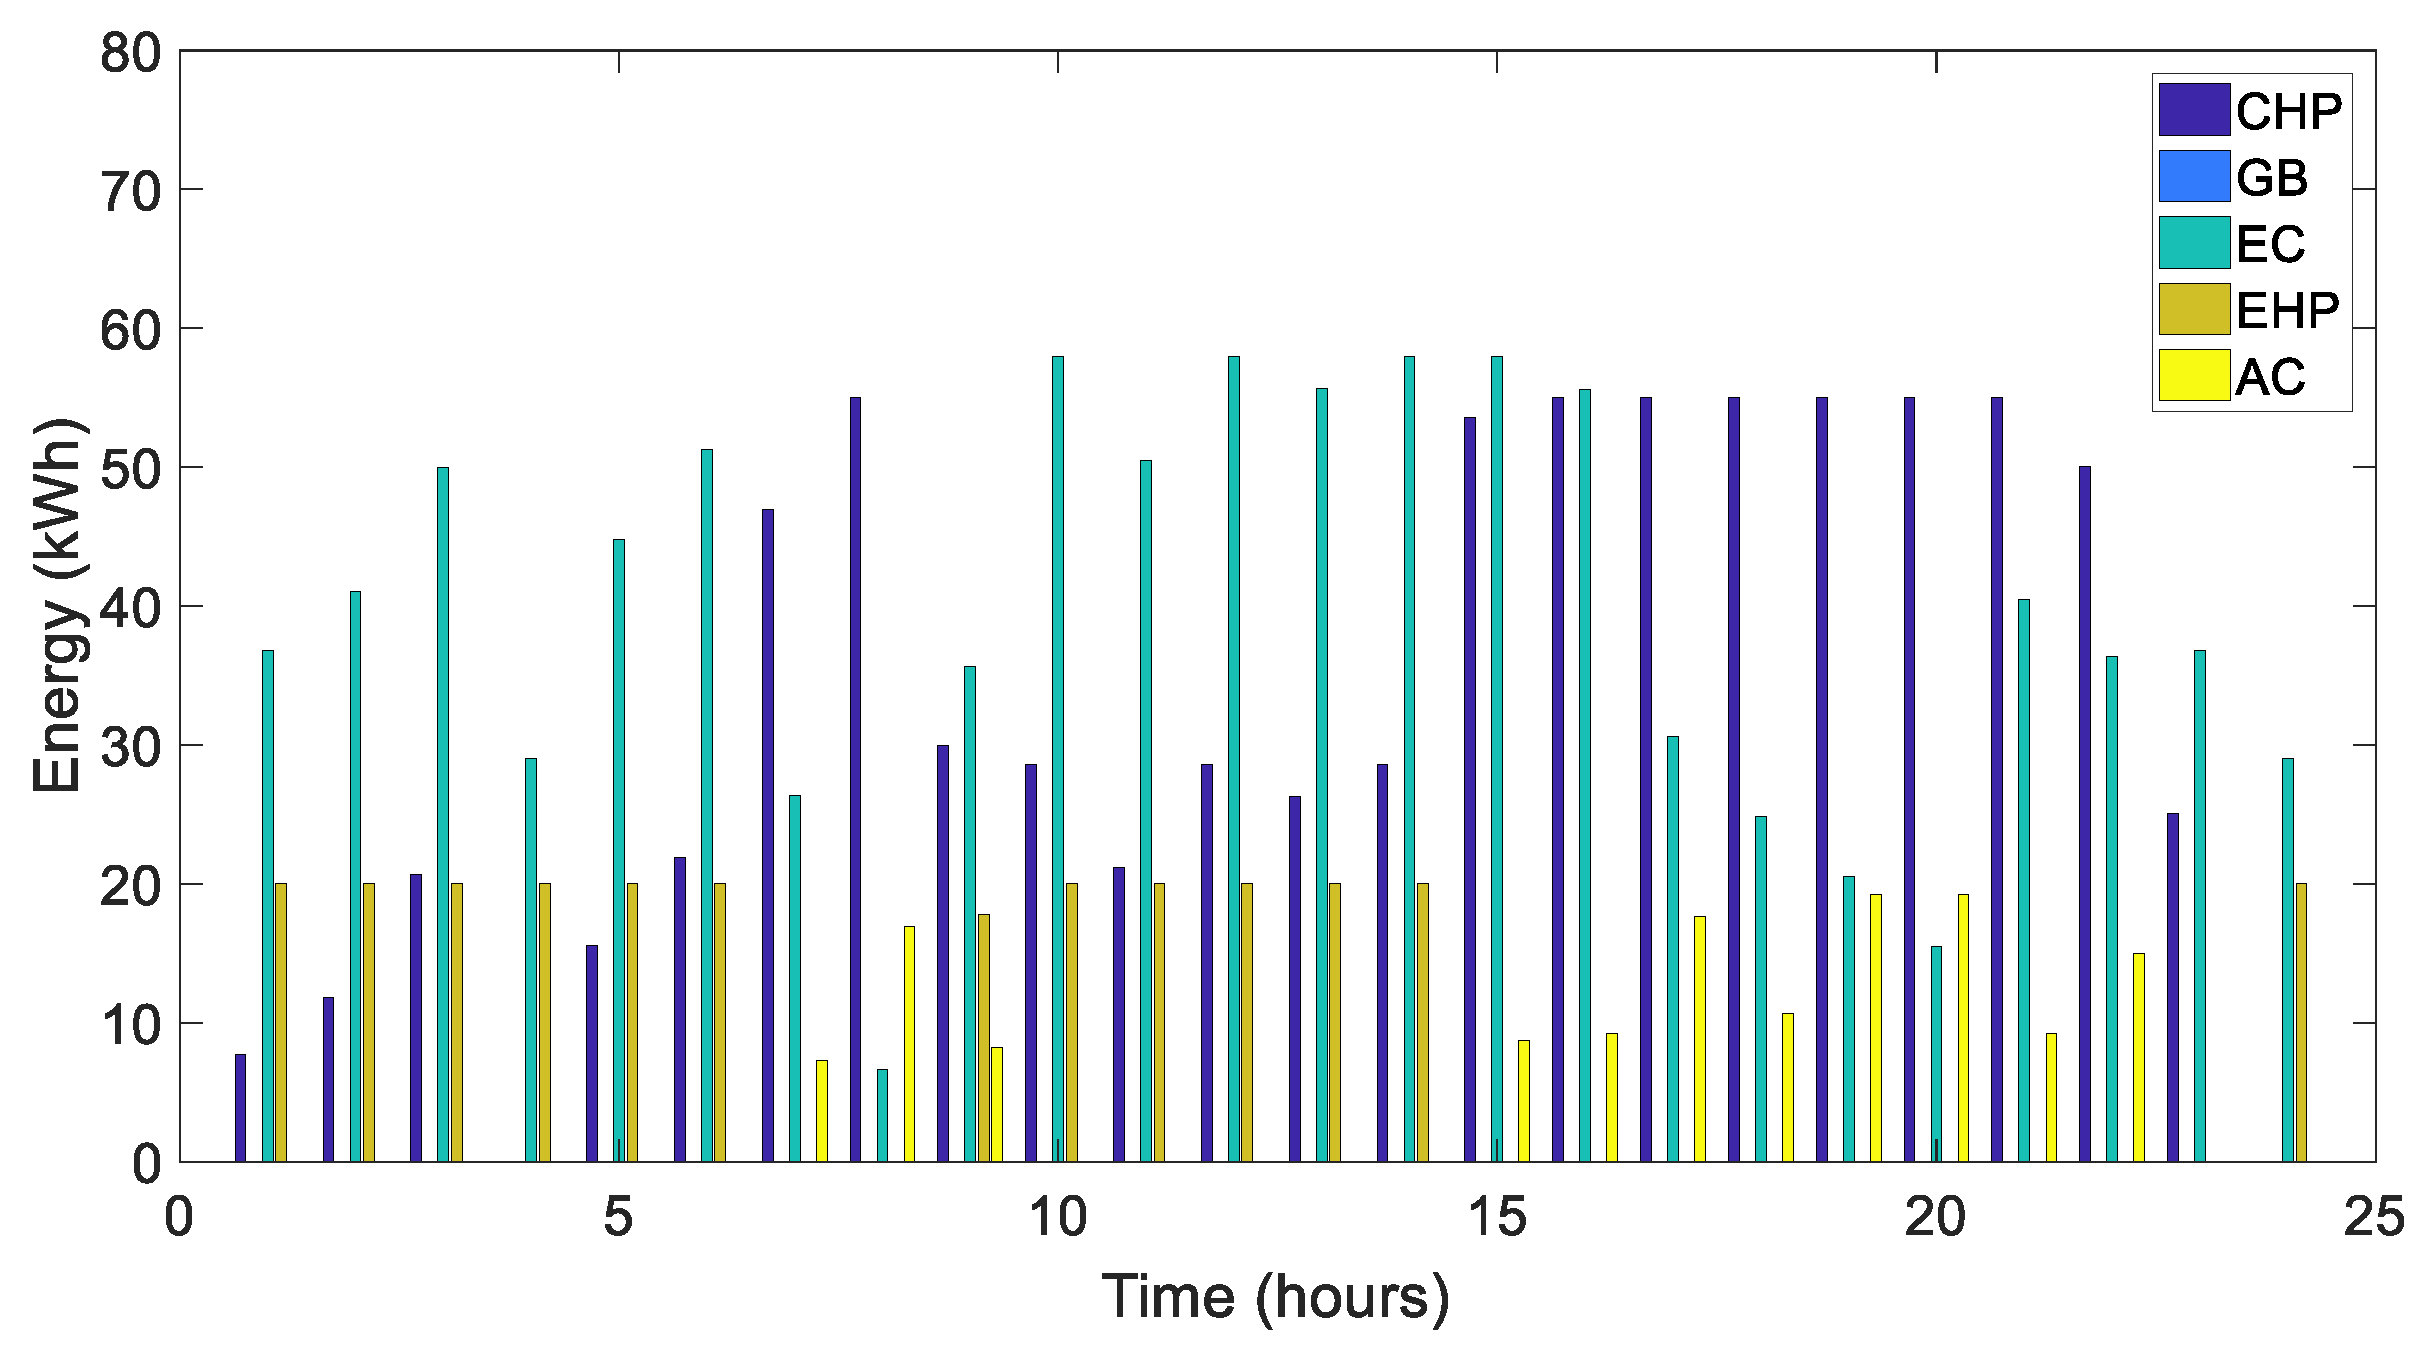
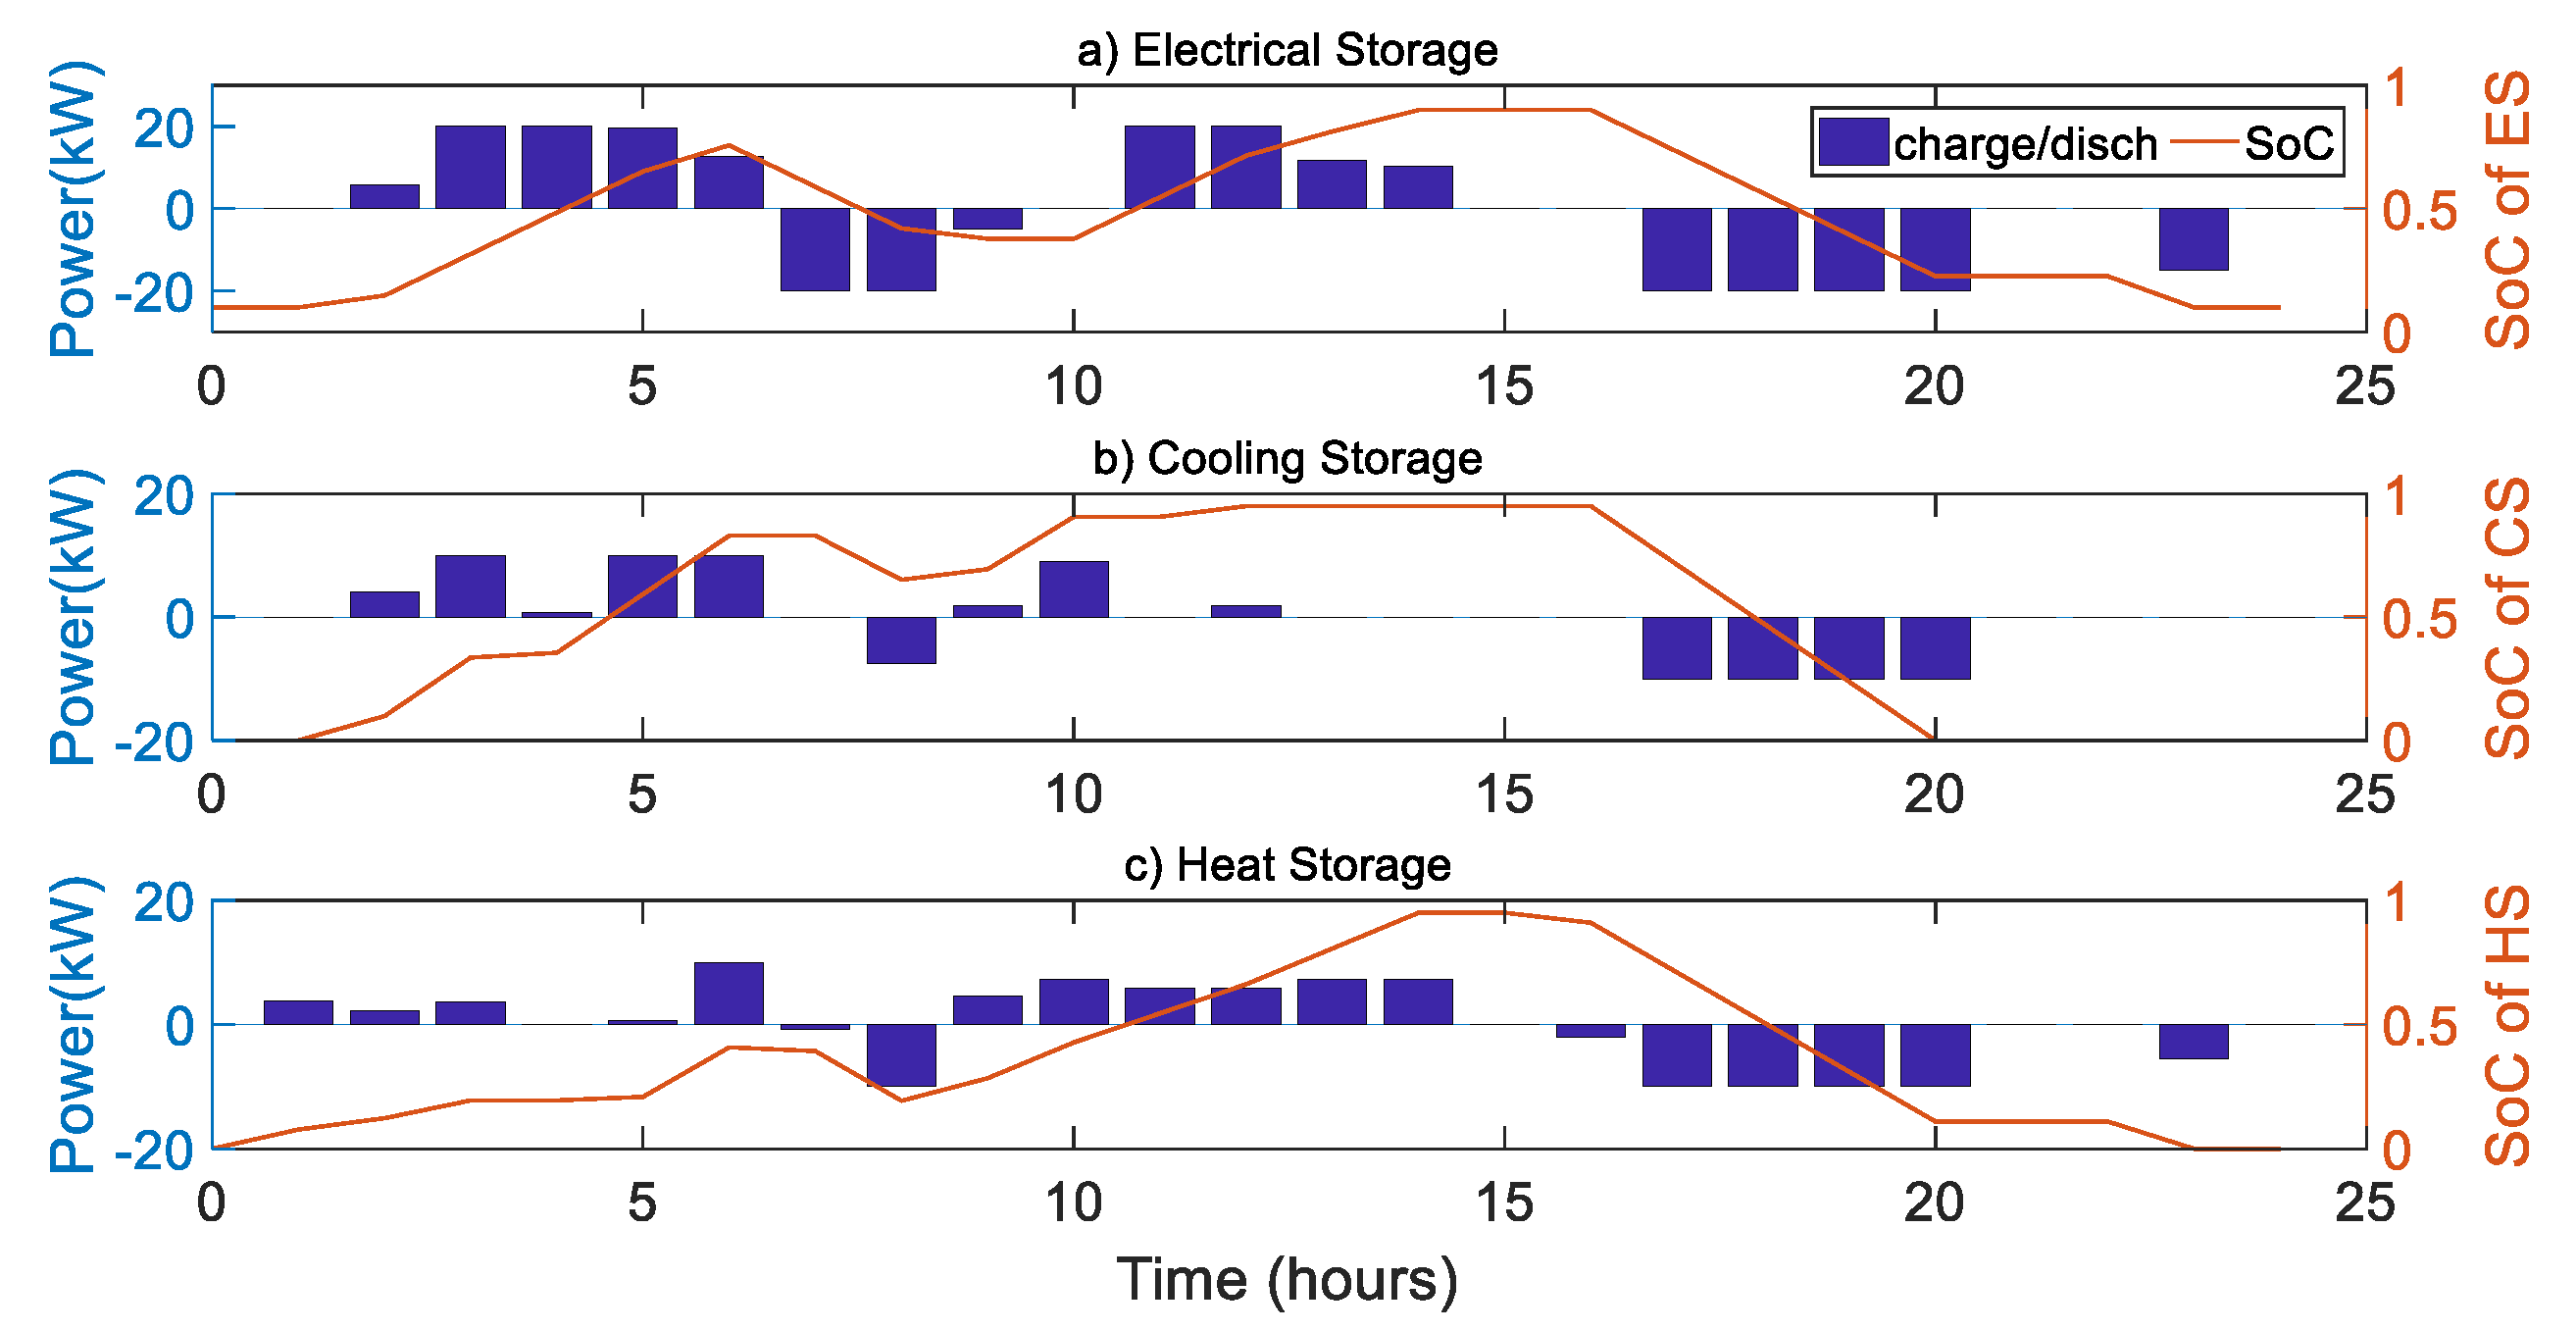
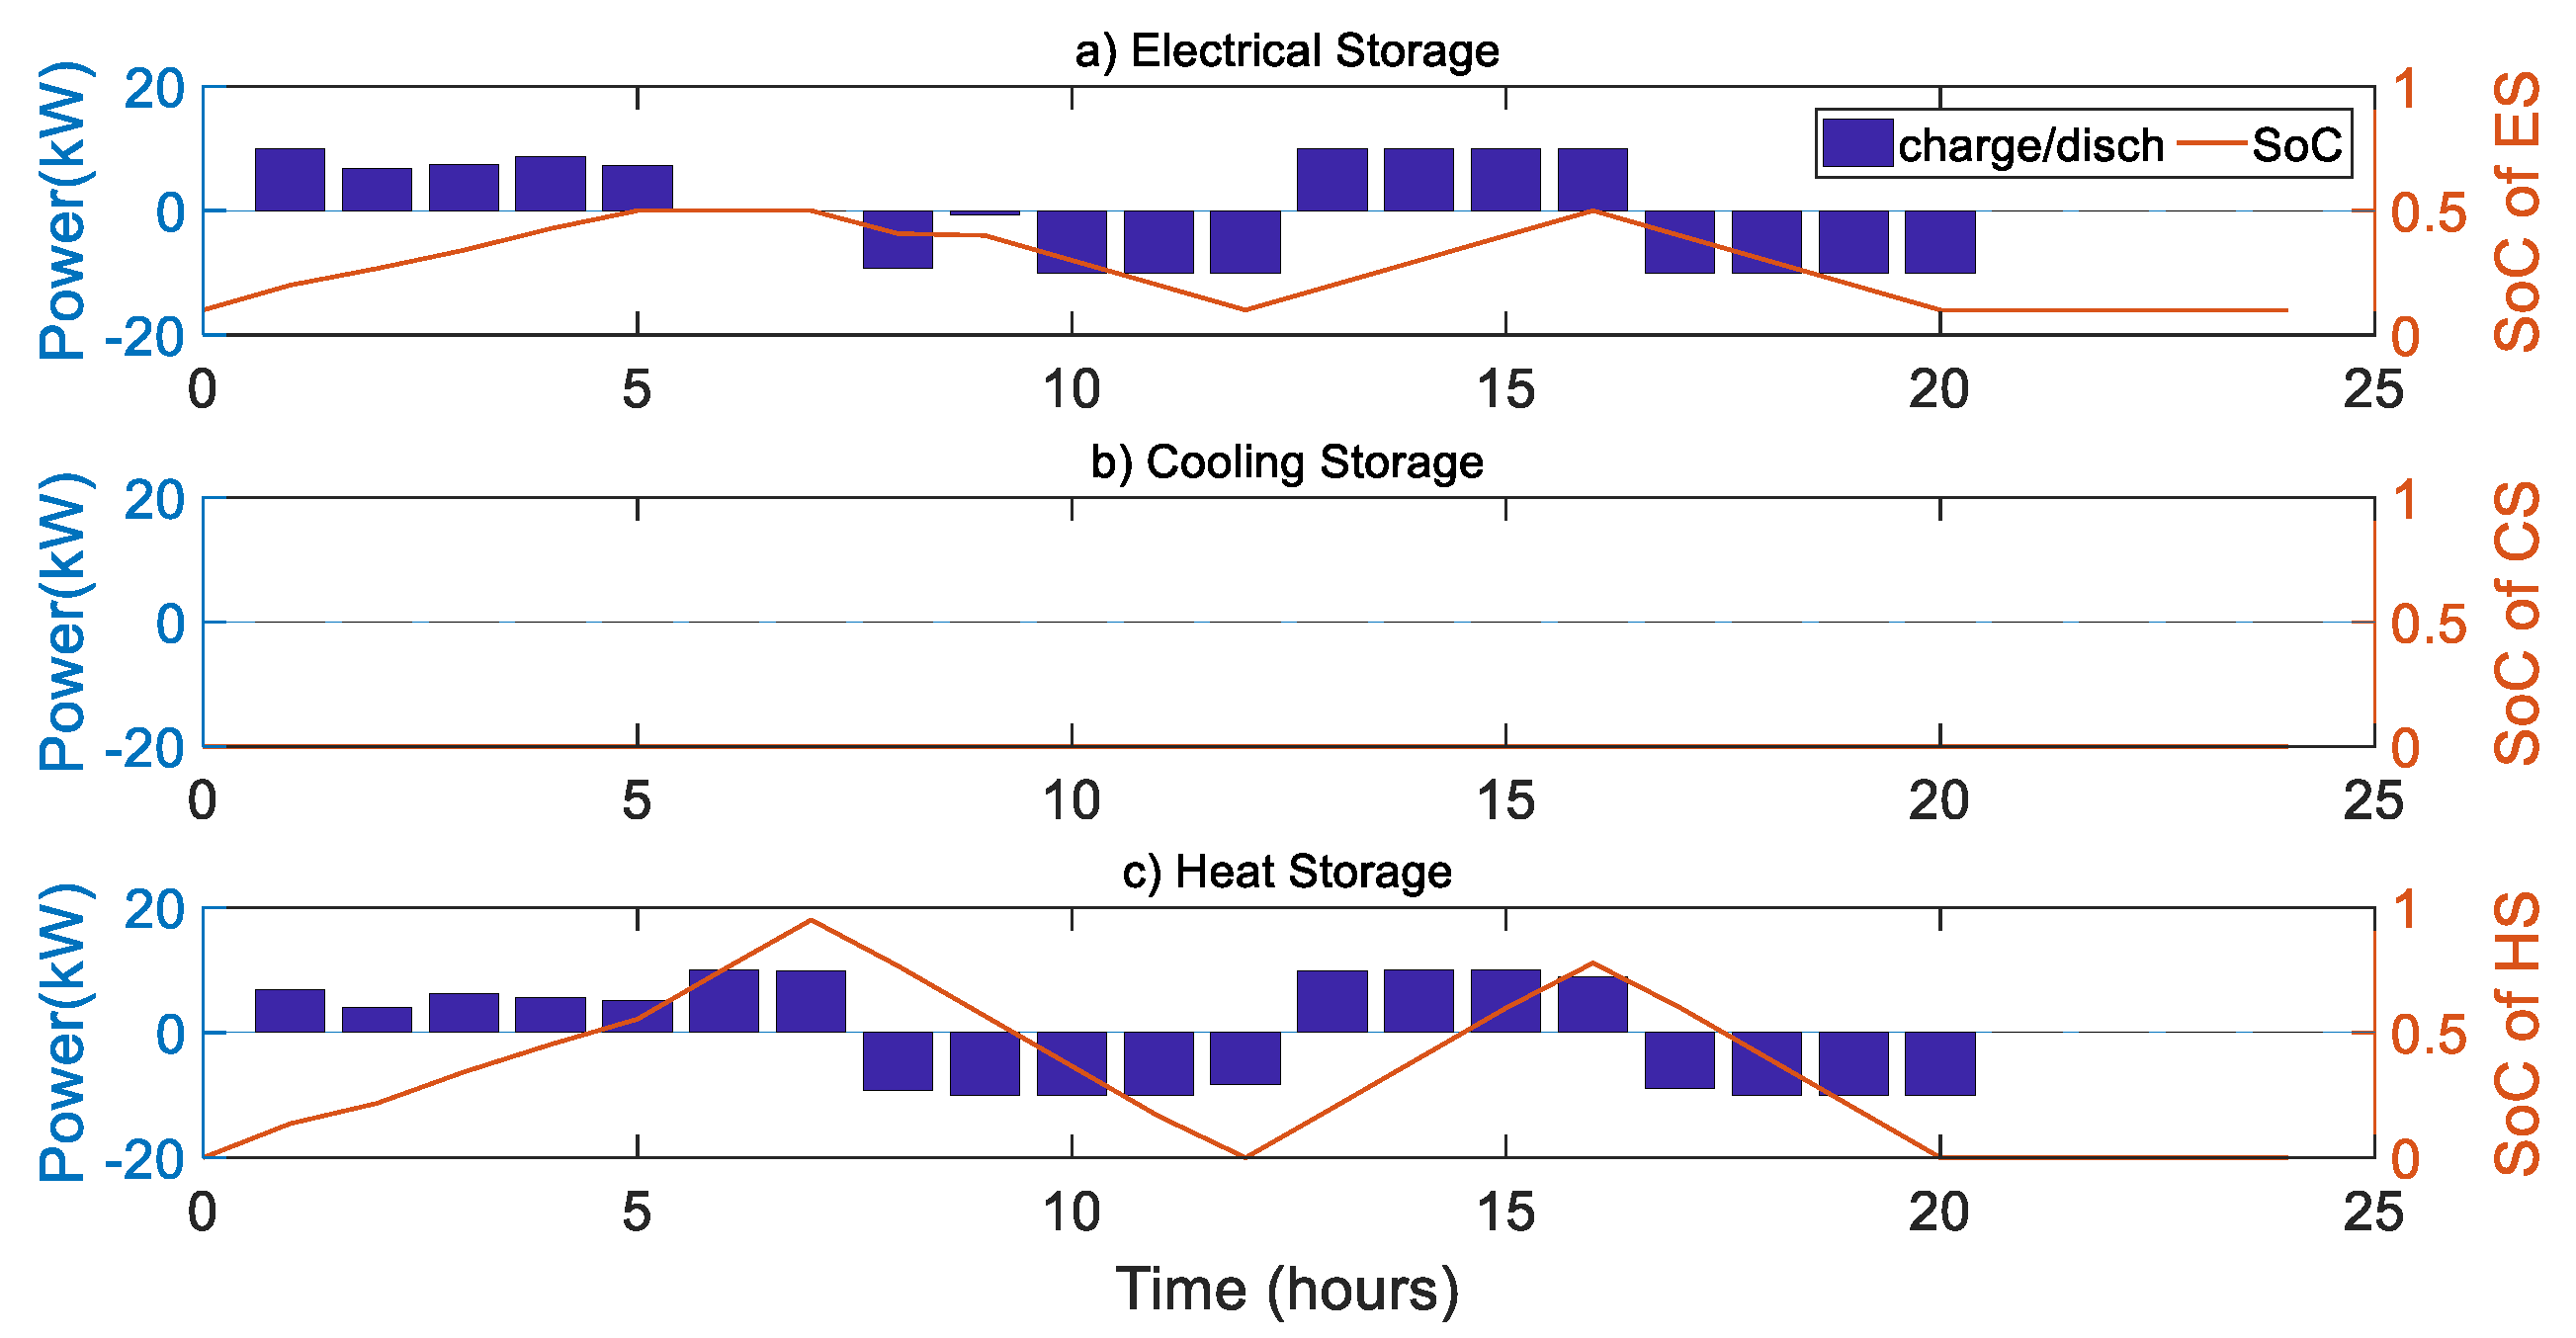
In this set of tests, the cooling is mainly used for the space cooling. The EC equipped in the system is the main cooling unit to produce cooling energy. Shown in Figure 7 is the optimized operation state of the energy conversion facilities over a 24-h period on an hourly basis. Figure 8 illustrates the cooperative operation of the ES, CS and HS.
In valley periods, e.g., 1–7, as the electricity is cheap, more electricity is purchased, the cooling energy is produced by the EC, and the heat energy is produced by the EH. Excess capacity is stored in the HES for future usage during peak hours, e.g., periods 17–20, as indicated in Figure 8. In peak periods, e.g., 17–20, as the electricity has a higher price, less electricity is purchased and the MEMG switches to consuming gas and producing power and heat using the CHP. During the period, the AC equipped in the system converts heat energy to output cooling energy to supply part of the cooling load demand while reducing the cooling energy produced by the EC to save cost.
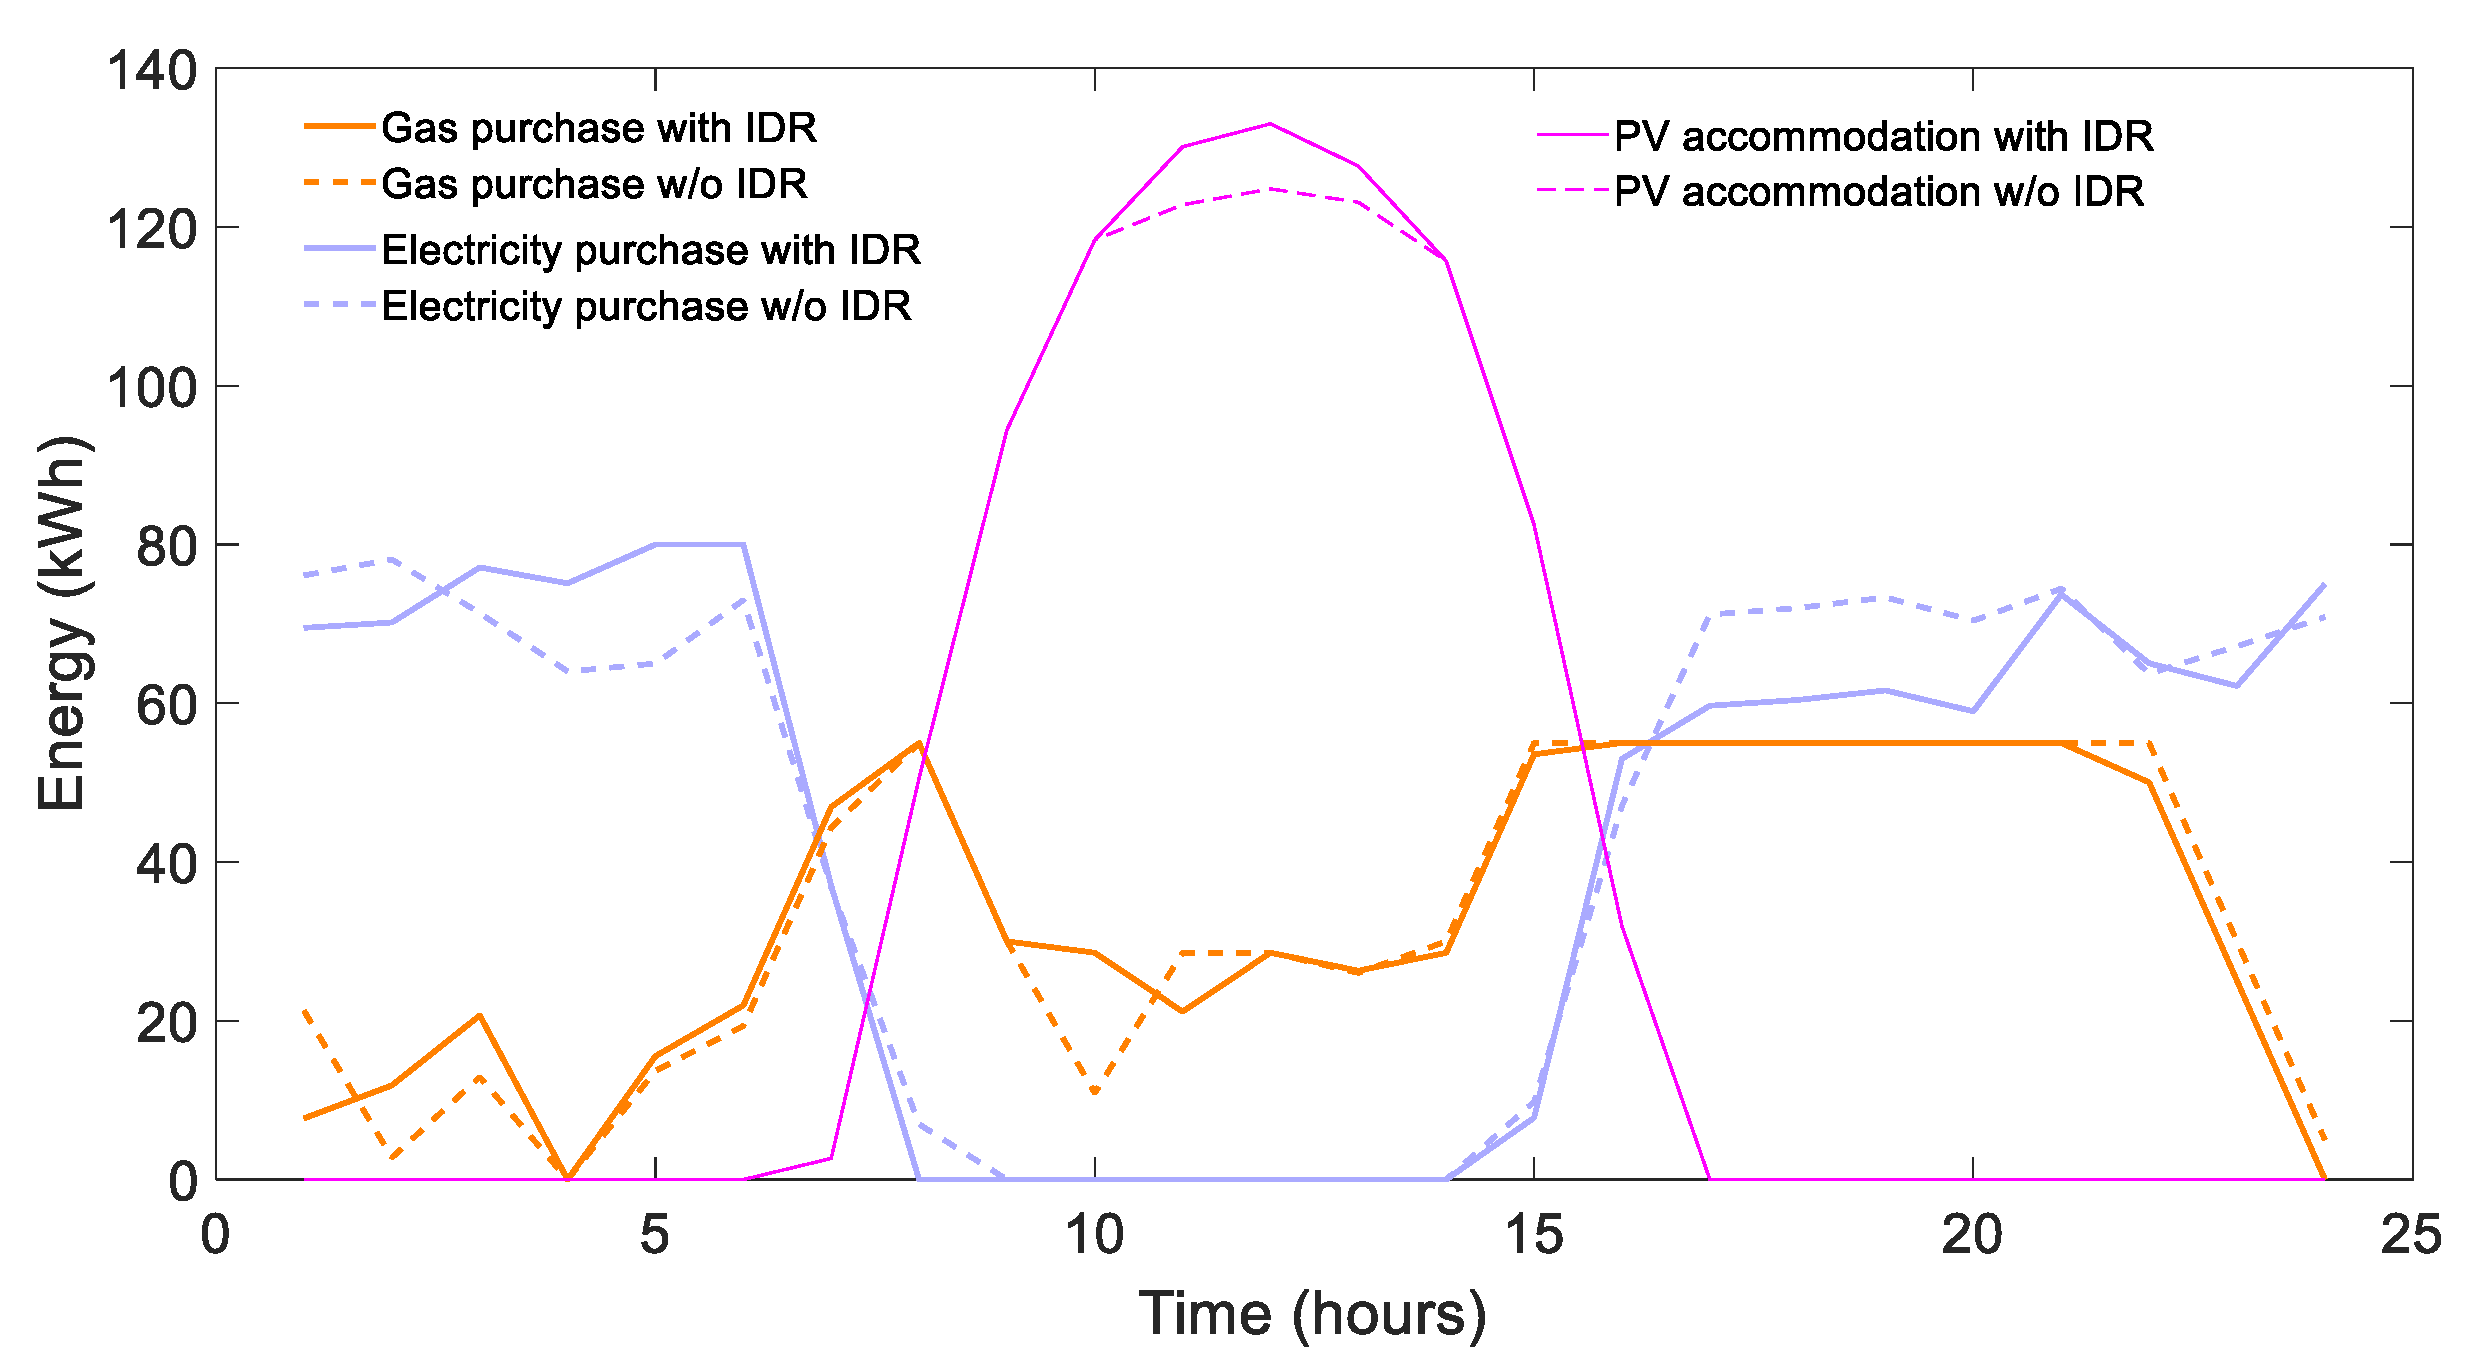
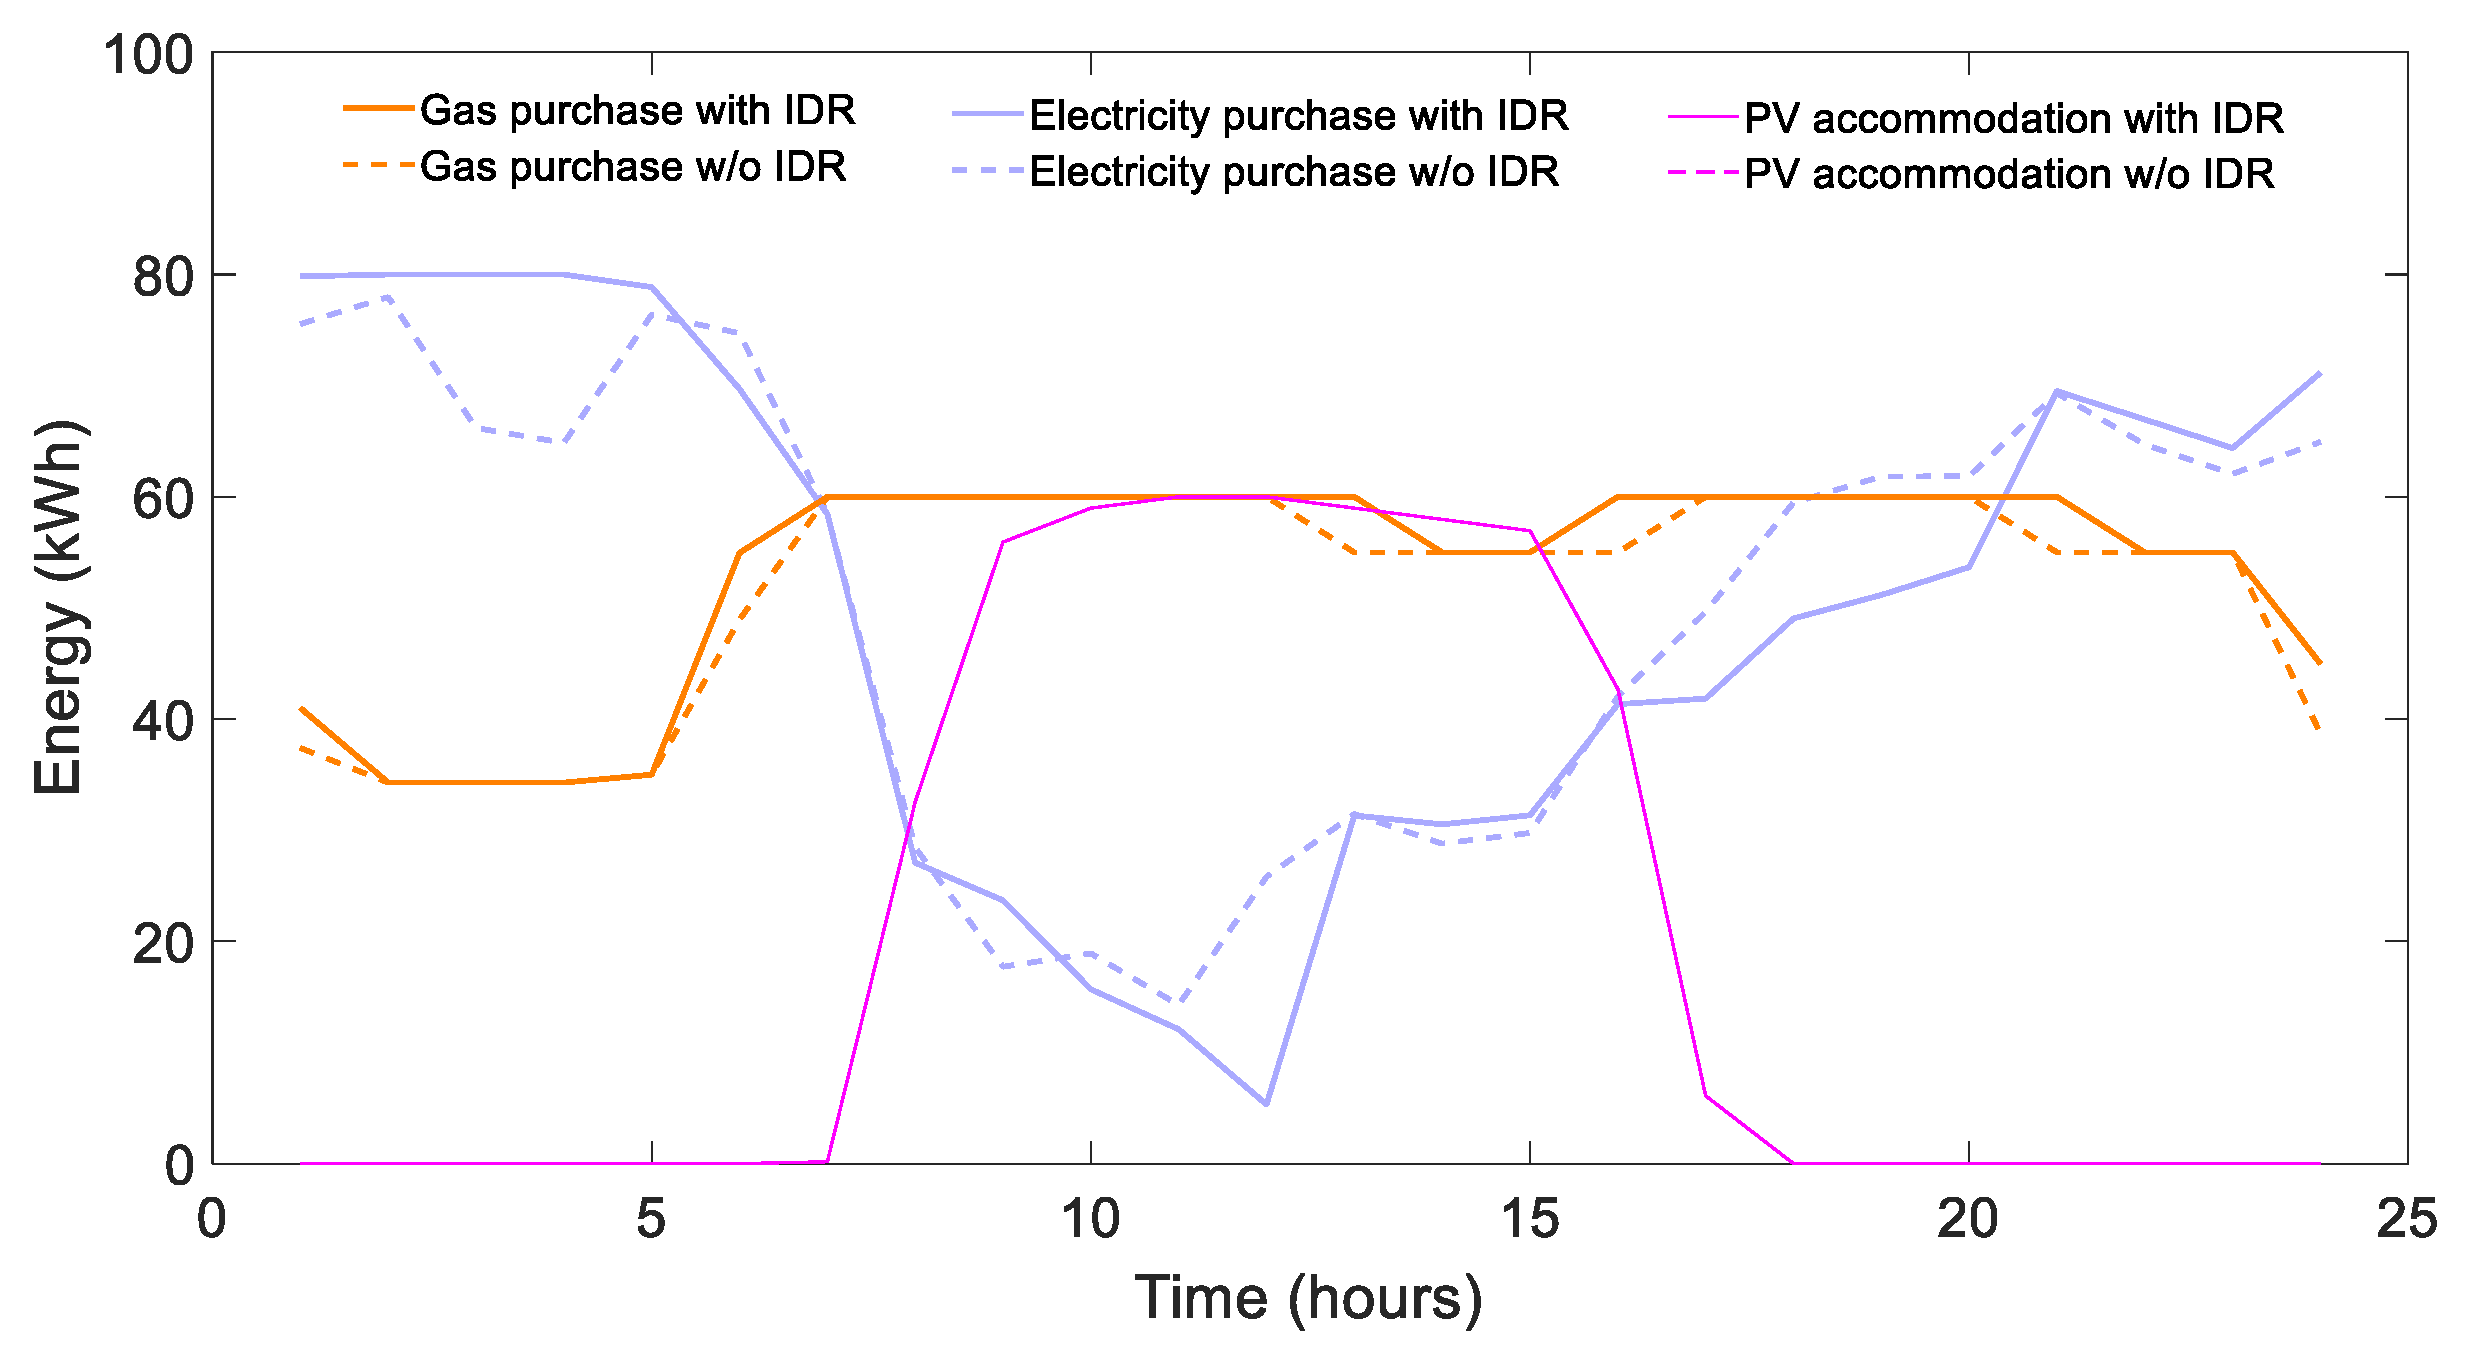
Electricity purchased from the main grid, gas purchased from the gas network and PV power accommodation under the optimization framework with and without considering IDR are comparatively studied in Figure 9. We can learn from the figure that the amount of the purchased electricity increased in the valley periods, e.g., 3–7, and reduced at the peak periods, e.g., 17–20, because of the presence of IDR and HES. There is a little difference in the amount of purchased gas because the gas price is considered to be fixed. The optimal daily cost of the studied system, which includes the electricity purchase cost from the main grid and gas consumption cost of the CHP and GB is attained as 881.3¥, which was 932.044¥ without considering IDR. This represents a reduction of 5.44% in the energy purchasing cost.
It is also observed in Figure 9 that curtailment of PV power occurs during the period from 10 to 14 before implementing IDR. After implementing IDR, all the available PV power is utilized to supply the electrical load demand. This is because IDR shifts the electrical, cooling and heat loads from peak load hours to high PV generation hours, which effectively improves the ability of the PV power accommodation in the MEMG system.

4.1.2. Typical Winter Day

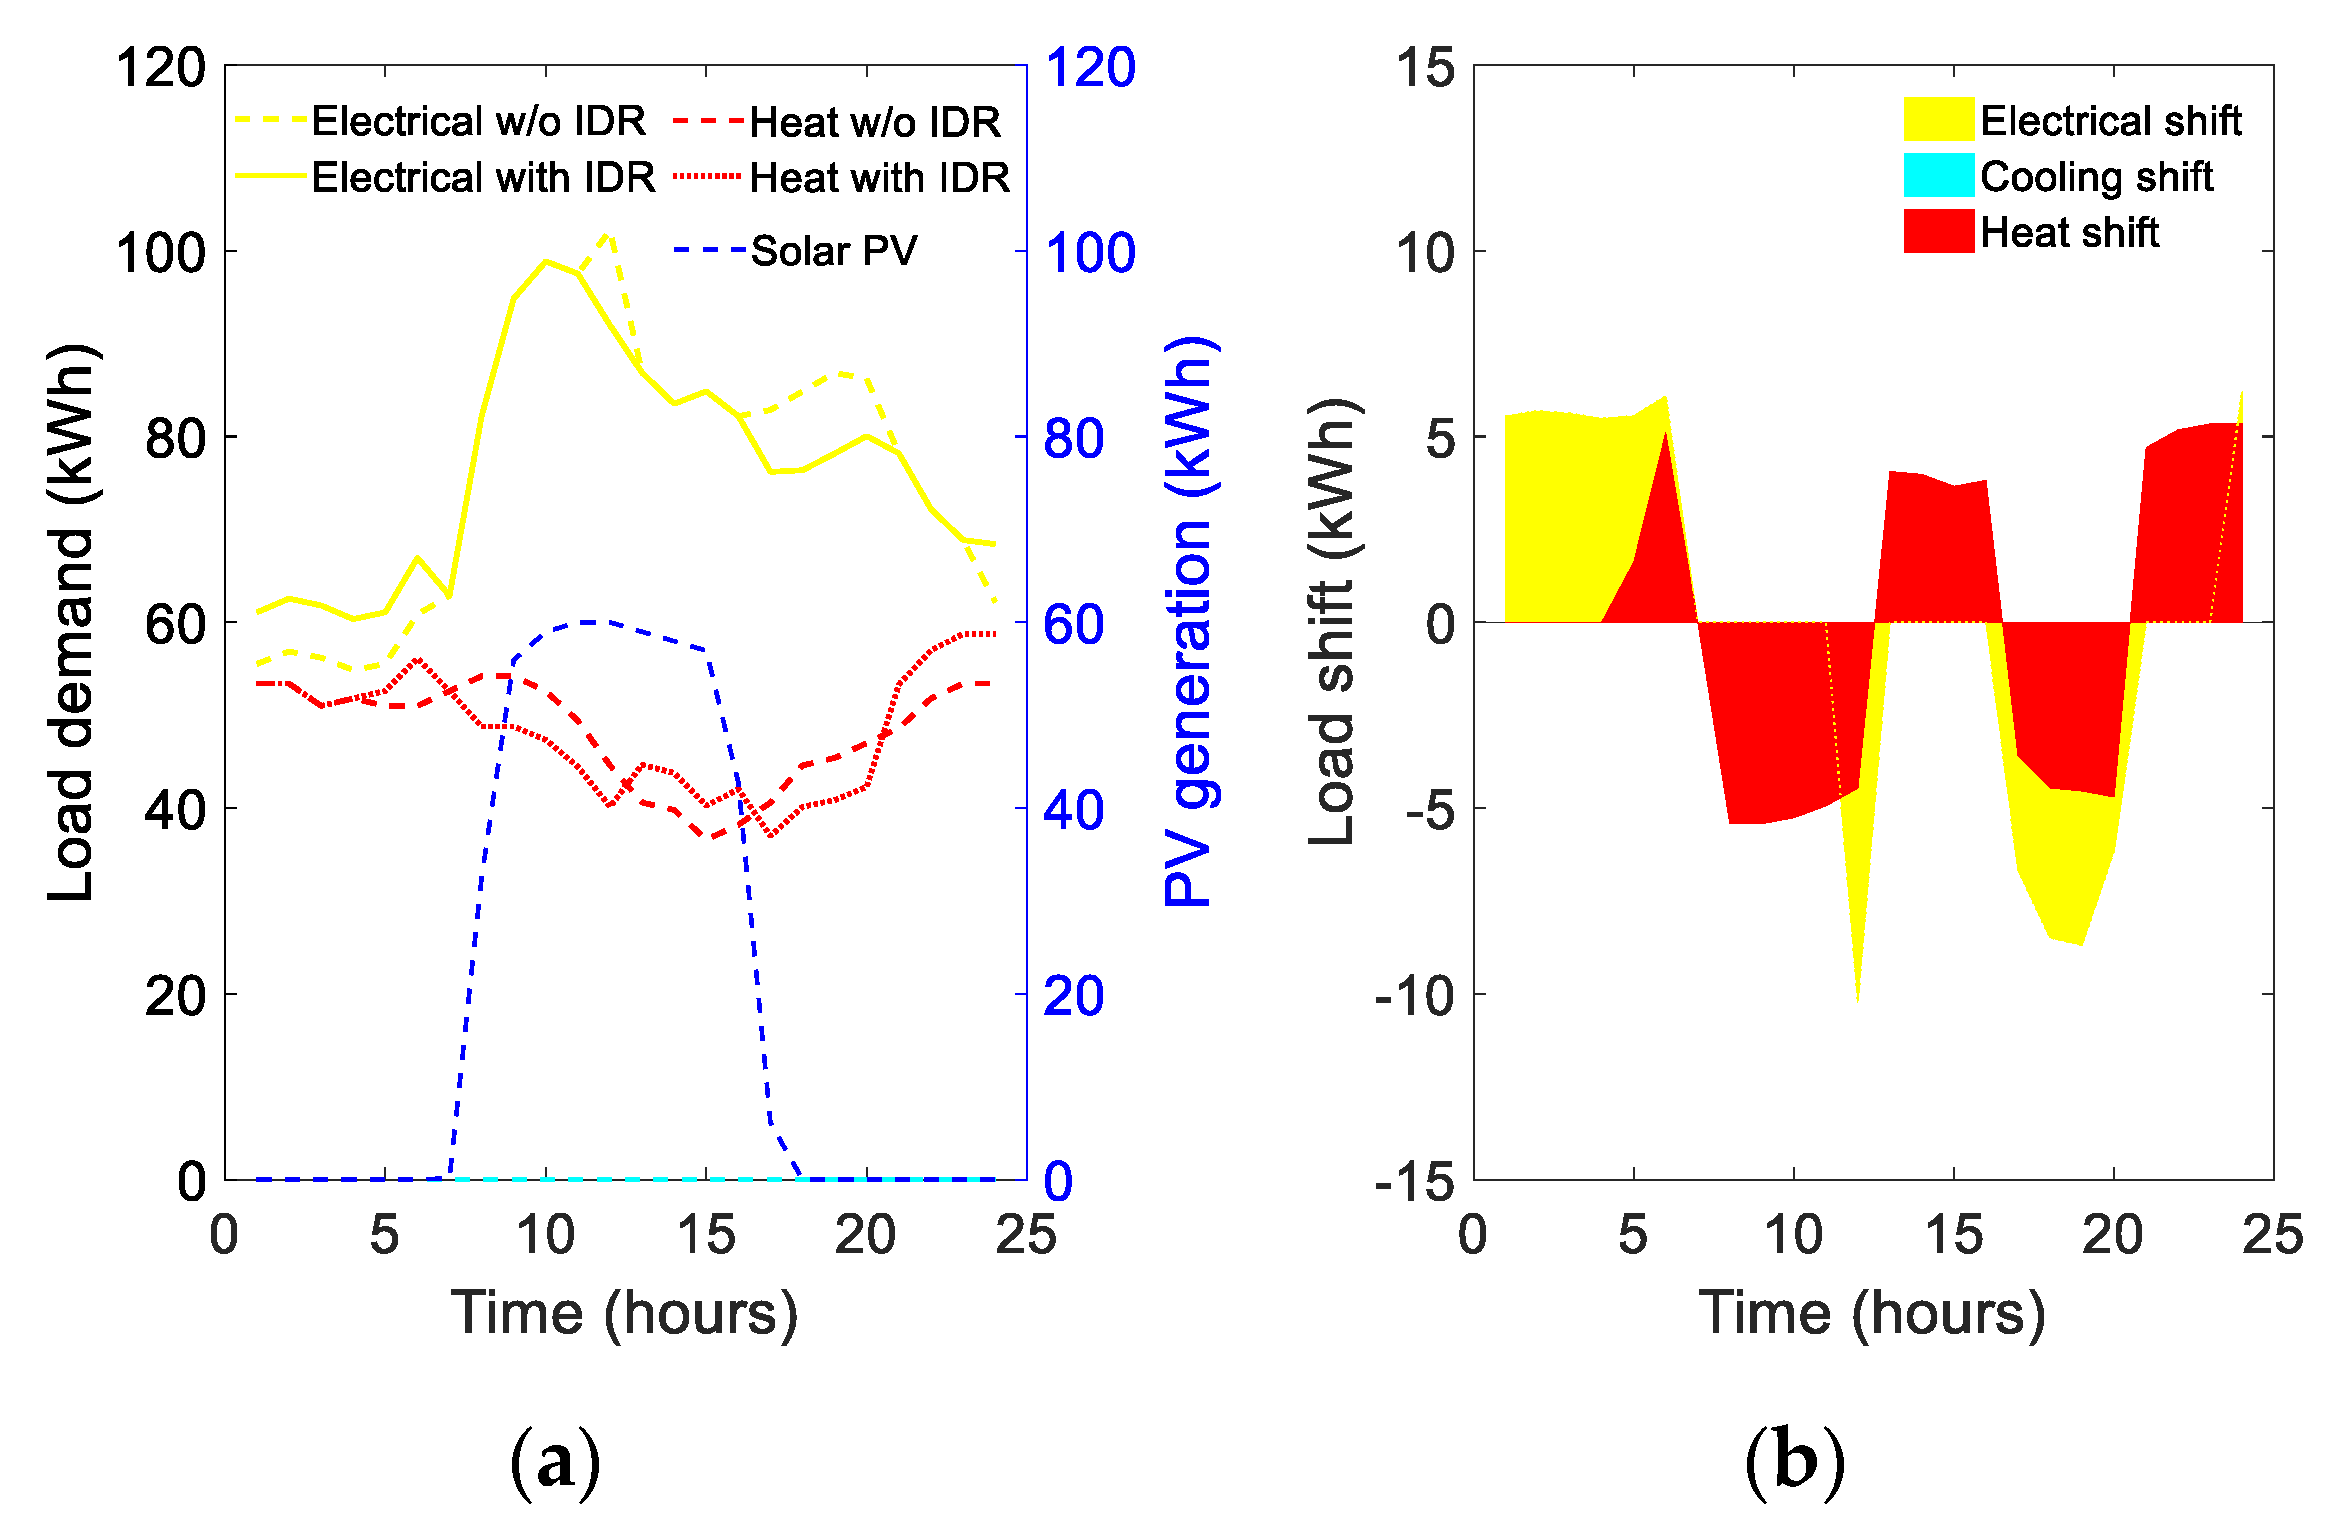
The initial multi-energy load profiles for a typical winter day are shown by dashed lines in Figure 10a. In this study, the heat is mainly used for the space heating and it is assumed that there are no cooling loads in winter. Available PV generation computed by p-efficient point at a confidence level of 0.85 is plotted by a blue dotted line in Figure 10a. TOU electricity price curve is consistent with the curve shown in Figure 4. Natural gas price is a fixed price of 2.76¥/m3.
In Figure 10a, the solid lines represent the optimized electrical, cooling and heating load profiles, respectively, considering IDR. The shift amount of the electrical and heat loads in the entire scheduling period is indicated in Figure 10b. It shows that IDR transfers a certain amount of the electrical and heat loads from the peak periods, i.e., 8–12 and 17–20, to the valley period, i.e., 1–7, and off-peak periods, i.e., 12–17 and 20–24, to flatten the load curve, which leads to reduction of cost.
Figure 11 shows a comparison in electricity purchased from the grid, gas purchased from the gas network and PV power utilization, respectively, under the proposed optimization framework with and without considering IDR. It is observed in Figure 11 that there is little difference in the amount of purchased gas due to a fixed gas price, and the amount of the purchased electricity in the valley periods is increased and at the peak periods is reduced to save cost. Electricity and gas resources are interdependent and complement each other, which enhances the flexibility of the MEMG system. The total cost of the purchased electricity and gas is attained as 1127¥ with considering IDR, which was 1168¥ without considering IDR. This represents a reduction of 3.5% in the energy purchasing cost.
The optimized operation state of the energy conversion facilities over a 24-h period on an hourly basis is shown in Figure 12. Scheduling of the ES and HS and their SOC dynamics are shown in Figure 13. It is observed in Figure 12 that the CHP is committed during the entire scheduling period. The reason is that the CHP is the main heating unit to produce heat energy for supplying a large part of the total heat demand in the winter scenario. For the rest, the heat energy produced by the EHP and GB and stored heat energy in the HS are used to satisfy the remaining heat demand of the MEMG system. At the same time, electrical load demand is supplied by the main grid, electrical power produced by the CHP, available PV power and charging and discharging power of the ES. We can also learn from Figure 12 and Figure 13 that during the valley period, i.e., 1–7, as the electricity price is low, providing a portion of the system heat demand by the EHP is more economical than by CHP, so that has cut down the heat energy produced by the CHP while increasing that produced by the EHP. During the peak periods, i.e., 8–12 and 17–20, as the electricity price is high, the production cost of heat generated from gas is more economical than that generated from electricity, so that has cut down the heat energy produced by the EHP while increasing that produced by the CHP. Meanwhile, the ES and HS capture the energy produced during the valley and off-peak periods, which is used to assist in the energy supply during the peak periods, e.g., 8–12 and 17–20, to save cost, which can be seen from Figure 13. All equipment operates in a coordinated manner to realize the energy efficiency optimization and economic system operation.

4.2. Impact of Confidence Level

In this section, the typical summer day case (PV-rich scenario) is taken as an example to analyze the influence of the confidence levels of PV power and effectiveness of IDR in the stochastic circumstances on the optimization-based operation.
The minimum configuration of IDR (expressed as a percentage) corresponding to the complete accommodation of PV at different confidence levels within the MEMG system is shown in Table 2. As shown in the Table 2, the higher the confidence level, the smaller the configuration of IDR, and hence there are lesser amounts of load shift and IDR cost. This is because by increasing the confidence level, available PV power obtained is decreasing according to the p-efficient point theory, which can be observed from Figure 5. The energy purchase cost and total cost of the MEMG system under different confidence levels are also shown in Table 2. With the increase of the confidence level, available PV power as well as the corresponding IDR configuration are reduced, which leads to the increase of energy purchase cost and total cost.
The results highlight the effectiveness of IDR in accommodating PV within the MEMG, as well as the improvement of energy efficiency and economic system operation. The study can provide a new way of thinking to implement IDR within a MEMG system in the condition that renewable energy resource penetration is high, which increases the correlation between renewable generation and electrical, cooling and heating loads.

5. Conclusions and Future Works

This paper proposes a model for the optimal operation of the multi-energy microgrid for buildings integrated with PV considering an integrated demand response and heterogeneous energy storage. In the developed optimization framework, PV power was considered uncertain and the p-efficient point method based on historical data was applied to handle the stochastic PV within the MEMG system. Integrated demand response was presented and formulated as a linear model based on the quantized flexibility interval of the system load demand. In addition, the effect of HES on the operational problem was taken into account. The main goal of the proposed model is to minimize the cost associated with energy consumption and IDR implementation through deploying the full potential of the cooperation of IDR, energy converters and HES, considering operational constraints. Extensive case studies are presented to validate the effectiveness of the proposed model and illustrate the benefits of the cooperation of IDR with respect to PV power accommodation, raising energy efficiency and reducing the energy consumption cost of the system. According to the obtained results, the proposed operation strategy can help the system operator to reduce the total energy costs by 5.44% on a typical summer day and 3.5% on a typical winter day through implementing IDR as well as utilizing energy conversion facilities and HES systems. It can also be seen that the proposed method is an effective way towards achieving 100% accommodation of uncertain PV power in MEMGs.
Noting that the proposed optimization model is established based on a steady-state analysis of the MEMG system, although it is valid and feasible for the daily scheduling and hourly operation of the MEMG system, the model is too rough to analyze the operation of MEMGs on a short-term time scale (minutes or tens of minutes), especially the model considering demand response. It is necessary to investigate the difference of response characteristics and dynamic change processes of different energies in response to short-term scheduling requirements at different time scales.
As for future works, there are several directions that can be further extended: (i) multi-time scale optimization strategy for MEMGs considering the difference of response characteristics and dynamic change processes of heterogeneous energy will be explored; (ii) the participation degree model for energy consumers to participate in integrated demand response will be investigated, and in this stage, the impact of electricity and natural gas prices will be taken into account; and (iii) the detailed models for user-oriented and comfort-constrained IDR will be developed and incorporated in the optimal operation of multi-energy microgrids.

Author Contributions

J.W.: conceptualization, methodology, software, data analysis and writing of the original draft; K.-J.L.: conceptualization and checking of the overall logic of this work; Y.L. and Z.J. thoroughly revised the paper. All authors have read and agreed to the published version of the manuscript.

Funding

This research was funded by the National Natural Science Foundation of China (NSFC), grant number 51777116.

Institutional Review Board Statement

Not applicable.

Informed Consent Statement

Not applicable.

Data Availability Statement

Data sharing is not applicable to this article.

Conflicts of Interest

The authors declare no conflict of interest.

References

  1. Rifkin, J. The Third Industrial Revolution: How Lateral Power is Transforming Energy, the Economy, and the World; Palgrave Macmillan Trade: New York, NY, USA, 2013; pp. 31–46. [Google Scholar]
  2. Wu, J.; Yan, J.; Jia, H.; Hatziargyriou, N.; Djilali, N.; Sun, H. Integrated energy systems. Appl. Energy 2016, 167, 155–157. [Google Scholar] [CrossRef]
  3. Ma, T.; Wu, J.; Hao, L. Energy flow modeling and optimal operation analysis of the micro energy grid based on energy hub. Energy Convers. Manag. 2017, 133, 292–306. [Google Scholar] [CrossRef]
  4. Zhang, Y.; Campana, P.E.; Lundlad, A.; Zheng, W.; Yan, J. Planning and operation of an integrated energy system in a Swedish building. Energy Convers. Manag. 2019, 199, 111920. [Google Scholar] [CrossRef]
  5. Mehrjerdi, H.; Hemmati, R.; Shafie-khah, M.; Catalao, J.P.S. Zero Energy Building by Multi-Carrier Energy Systems including Hydro, Wind, Solar and Hydrogen. IEEE Trans. Ind. Inform. 2020, 3034346. [Google Scholar] [CrossRef]
  6. Lia, J.; Xu, W.; Cui, P.; Qiao, B.; Feng, X.; Xue, H.; Wang, X.; Xiao, L. Optimization configuration of regional integrated energy system based on standard module. Energy Build. 2020, 229, 110485. [Google Scholar] [CrossRef]
  7. Mu, Y.; Chen, W.; Yu, X.; Jia, H.; Hou, K.; Wang, C.; Meng, X. A double-layer planning method for integrated community energy systems with varying energy conversion efficiencies. Appl. Energy 2020, 279, 115700. [Google Scholar] [CrossRef]
  8. Sun, J.; Ruze, N.; Zhang, J.; Shi, J.; Shen, B. Capacity Planning and Optimization for Integrated Energy System in Industrial Park Considering Environmental Externalities. Renew. Energy 2020, 167, 045. [Google Scholar]
  9. Yuan, J.; Li, Y.; Luo, X.; Zhang, Z. A new hybrid multi-criteria decision-making approach for developing integrated energy systems in industrial parks. J. Clean. Prod. 2020, 270, 122119. [Google Scholar] [CrossRef]
  10. Soroudi, A.; Amraee, T. Decision making under uncertainty in energy systems: State of the art. Renew. Sustain. Energy Rev. 2013, 28, 376–384. [Google Scholar] [CrossRef] [Green Version]
  11. REN21. Renewables 2019 Global Status Report. 2020. Available online: http://www.ren21.net/gsr-2019/ (accessed on 15 November 2020).
  12. Pazouki, S.; Haghifam, M.R. Optimal planning and scheduling of energy hub in presence of wind, storage and demand response under uncertainty. Int. J. Electr. Power 2016, 80, 219–239. [Google Scholar] [CrossRef]
  13. Dolatabadi, A.; Ivatloo, B.M. Stochastic Risk-constrained Scheduling of Smart Energy Hub in the Presence of Wind Power and Demand Response. Appl. Therm. Eng. 2017, 123, 40–49. [Google Scholar] [CrossRef]
  14. Jadidbonab, M.; Dolatabadi, A.; Ivatloo, B.M.; Abapour, M.; Asadi, S. Risk-constrained energy management of PV integrated smart energy hub in the presence of demand response program and compressed air energy storage. IET Renew. Power Gener. 2019, 13, 998–1008. [Google Scholar] [CrossRef]
  15. Li, Y.; Wang, K.; Gao, B.; Zhang, B.; Liu, X.; Chen, C. Interval optimization based operational strategy of integrated energy system under renewable energy resources and loads uncertainties. Int. J. Energy Res. 2020, 6009. [Google Scholar] [CrossRef]
  16. Li, Z.; Wang, C.; Ding, Y.; Yang, M.; Zhu, W. Probability-Interval-Based Optimal Planning of Integrated Energy System With Uncertain Wind Power. IEEE Trans. Ind. Appl. 2020, 56, 4–13. [Google Scholar] [CrossRef]
  17. Mirzaei, M.A.; Heris, M.N.; Ivatloo, B.M.; Zare, K.; Marzband, M.; Khah, M.S.; Moghaddam, A.A.; Catalão, J.P.S. Network-Constrained Joint Energy and Flexible Ramping Reserve Market Clearing of Power and Heat-Based Energy Systems: A Two-Stage Hybrid IGDT-Stochastic Framework. IEEE Syst. J. 2020, 99, 1–10. [Google Scholar]
  18. Afrashi, K.; Firouzi, B.B.; Nafar, M. IGDT-Based Robust Optimization for Multicarrier Energy System Management. Iran J. Sci. Technol. Trans. Electr. Eng. 2020. [Google Scholar] [CrossRef]
  19. Faqiry, M.N.; Edmonds, L.; Wu, H.; Pahwa, A. Distribution locational marginal price-based transactive day-ahead market with variable renewable generation. Appl. Energy 2020, 259, 114103. [Google Scholar] [CrossRef]
  20. Halstrup, D.; Schriever, M. The role of industrial energy storage solutions in a distributed energy system: Empirical findings and implications on cooperative ties. Int. J. SGCE 2018, 7, 53–63. [Google Scholar] [CrossRef]
  21. Gimelli, A.; Mottola, F.; Muccillo, M.; Proto, D.; Amoresano, A.; Andreotti, A.; Langella, G. Registered Optimal configuration of modular cogeneration plants integrated by a battery energy storage system providing peak shaving service. Appl. Energy 2019, 242, 974–993. [Google Scholar] [CrossRef]
  22. Ding, Y.; Xu, Q.; Yang, B. Optimal configuration of hybrid energy storage in integrated energy system. Energy Rep. 2020, 6, 739–744. [Google Scholar] [CrossRef]
  23. Sanjari, M.J.; Karamic, H. Optimal control strategy of battery-integrated energy system considering load demand uncertainty. Energy 2020, 210, 118525. [Google Scholar] [CrossRef]
  24. Aviles, D.A.; Sotomayor, D.; Proaño, J.L.; Guinjoan, F.; Marietta, M.P.; Pascual, J.L.; Marroyo, P.S. Fuzzy Energy Management Strategy Based on Microgrid Energy Rate-of-Change Applied to An Electro-Thermal Residential Microgrid. In Proceedings of the 2017 IEEE 26th International Symposium on Industrial Electronics (ISIE), Edinburgh, UK, 19–21 June 2017. [Google Scholar]
  25. Yu, L.; Lei, J.; Guo, X.; Li, P.; Li, C.; Song, G.; Wu, Y. Planning of Central Energy Station in Community Integrated Energy System with Electrical and Heat Storage Devices. In Proceedings of the 2019 IEEE Innovative Smart Grid Technologies—Asia (ISGT Asia), Chengdu, China, 21–24 May 2019. [Google Scholar]
  26. Heidari, A. Stochastic effects of ice storage on improvement of an energy hub optimal operation including demand response and renewable energies. Appl. Energy 2020, 261, 114393. [Google Scholar] [CrossRef]
  27. Li, Z.; Xu, Y.; Feng, X.; Wu, Q. Optimal Stochastic Deployment of Heterogeneous Energy Storage in a Residential Multi-Energy Microgrid with Demand-Side Management. IEEE Trans. Ind. Inform. 2020, 17, 991–1003. [Google Scholar] [CrossRef]
  28. Bukhsh, W.A.; Zhang, C.; Pinson, P. An Integrated Multiperiod OPF Model with Demand Response and Renewable Generation Uncertainty. IEEE Trans. Smart Grid 2016, 7, 1495–1503. [Google Scholar] [CrossRef] [Green Version]
  29. Bahrami, S.; Sheikhi, A. From demand response in smart grid toward integrated demandresponse in smart energy hub. IEEE Trans. Smart Grid 2015, 7, 650–658. [Google Scholar]
  30. Wang, J.; Zhong, H.; Ma, Z.; Xia, Q.; Kang, C. Review and prospect of integrated demand response in the multi-energy system. Appl. Energy 2017, 202, 772–782. [Google Scholar] [CrossRef]
  31. Lu, Y.; Yu, X.; Jin, X.; Jia, H.; Mu, Y. Bi-level Optimization Framework for Buildings to Heating Grid Integration in Integrated Community Energy Systems. IEEE Trans. Sustain. Energy 2020, 3023251. [Google Scholar] [CrossRef]
  32. Yongli, W.; Yuze, M.; Fuhao, S.; Yang, M.; Chengyuan, Q.; Feifei, H.; Juntai, X.; Fuwei, Z. Economic and efficient multi-objective operation optimization of integrated energy system considering electro-thermal demand response. Energy 2020, 205, 118022. [Google Scholar]
  33. Saatloo, A.M.; Rahvar, M.A.; Amin, M.; Behnam, M.; Mehdi, A.; Zare, K. Robust scheduling of hydrogen based smart micro energy hub with integrated demand response. J. Clean. Prod. 2020, 11, 122041. [Google Scholar] [CrossRef]
  34. Brusco, G.; Burgio, A.; Menniti, D.; Pinnarelli, A.; Sorrentino, N.; Scarcello, L. An Energy Box in a Cloud-Based Architecture for Autonomous Demand Response of Prosumers and Prosumages. Electronics 2017, 6, 98. [Google Scholar] [CrossRef] [Green Version]
  35. Salpakari, J.; Lund, P. Optimal and rule-based control strategies for energy flexibility in buildings with PV. Appl. Energy 2016, 161, 425–436. [Google Scholar] [CrossRef] [Green Version]
  36. Razmara, M.; Bharati, G.R.; Hanover, D.; Shahbakhti, M.; Paudyal, S.; Robinett, R.D. Building-to-grid predictive power flow control for demand response and demand flexibility programs. Appl. Energy 2017, 203, 128–141. [Google Scholar] [CrossRef]
  37. Daniel, A.; Amaral, L.R.; Laura, A.; Helder, G. Investigating the potential for energy flexibility in an office building with a vertical BIPV and a PV roof system. Renew. Energy 2019, 137, 189–197. [Google Scholar]
  38. Bloess, A.; Schill, W.P.; Zerrahn, A. Power-to-heat for renewable energy integration: A review of technologies, modeling approaches, and flexibility potentials. Appl. Energy 2018, 212, 1611–1626. [Google Scholar] [CrossRef]
  39. Kumar, A.V.; Sharma, S.; Verma, A. Optimal sizing and multi-energy management strategy for PV-biofuel-based off-grid systems. IET Smart Grid 2020, 3, 83–97. [Google Scholar]
  40. Lejeune, M.; Noyan, N. Mathematical programming approaches for generating p-efficient points. Eur. J. Oper. Res. 2010, 207, 590–600. [Google Scholar] [CrossRef] [Green Version]
  41. ILOG CPLEX, ILOG CPLEX Homepage. 2019. Available online: http://www.ilog.com (accessed on 21 October 2019).
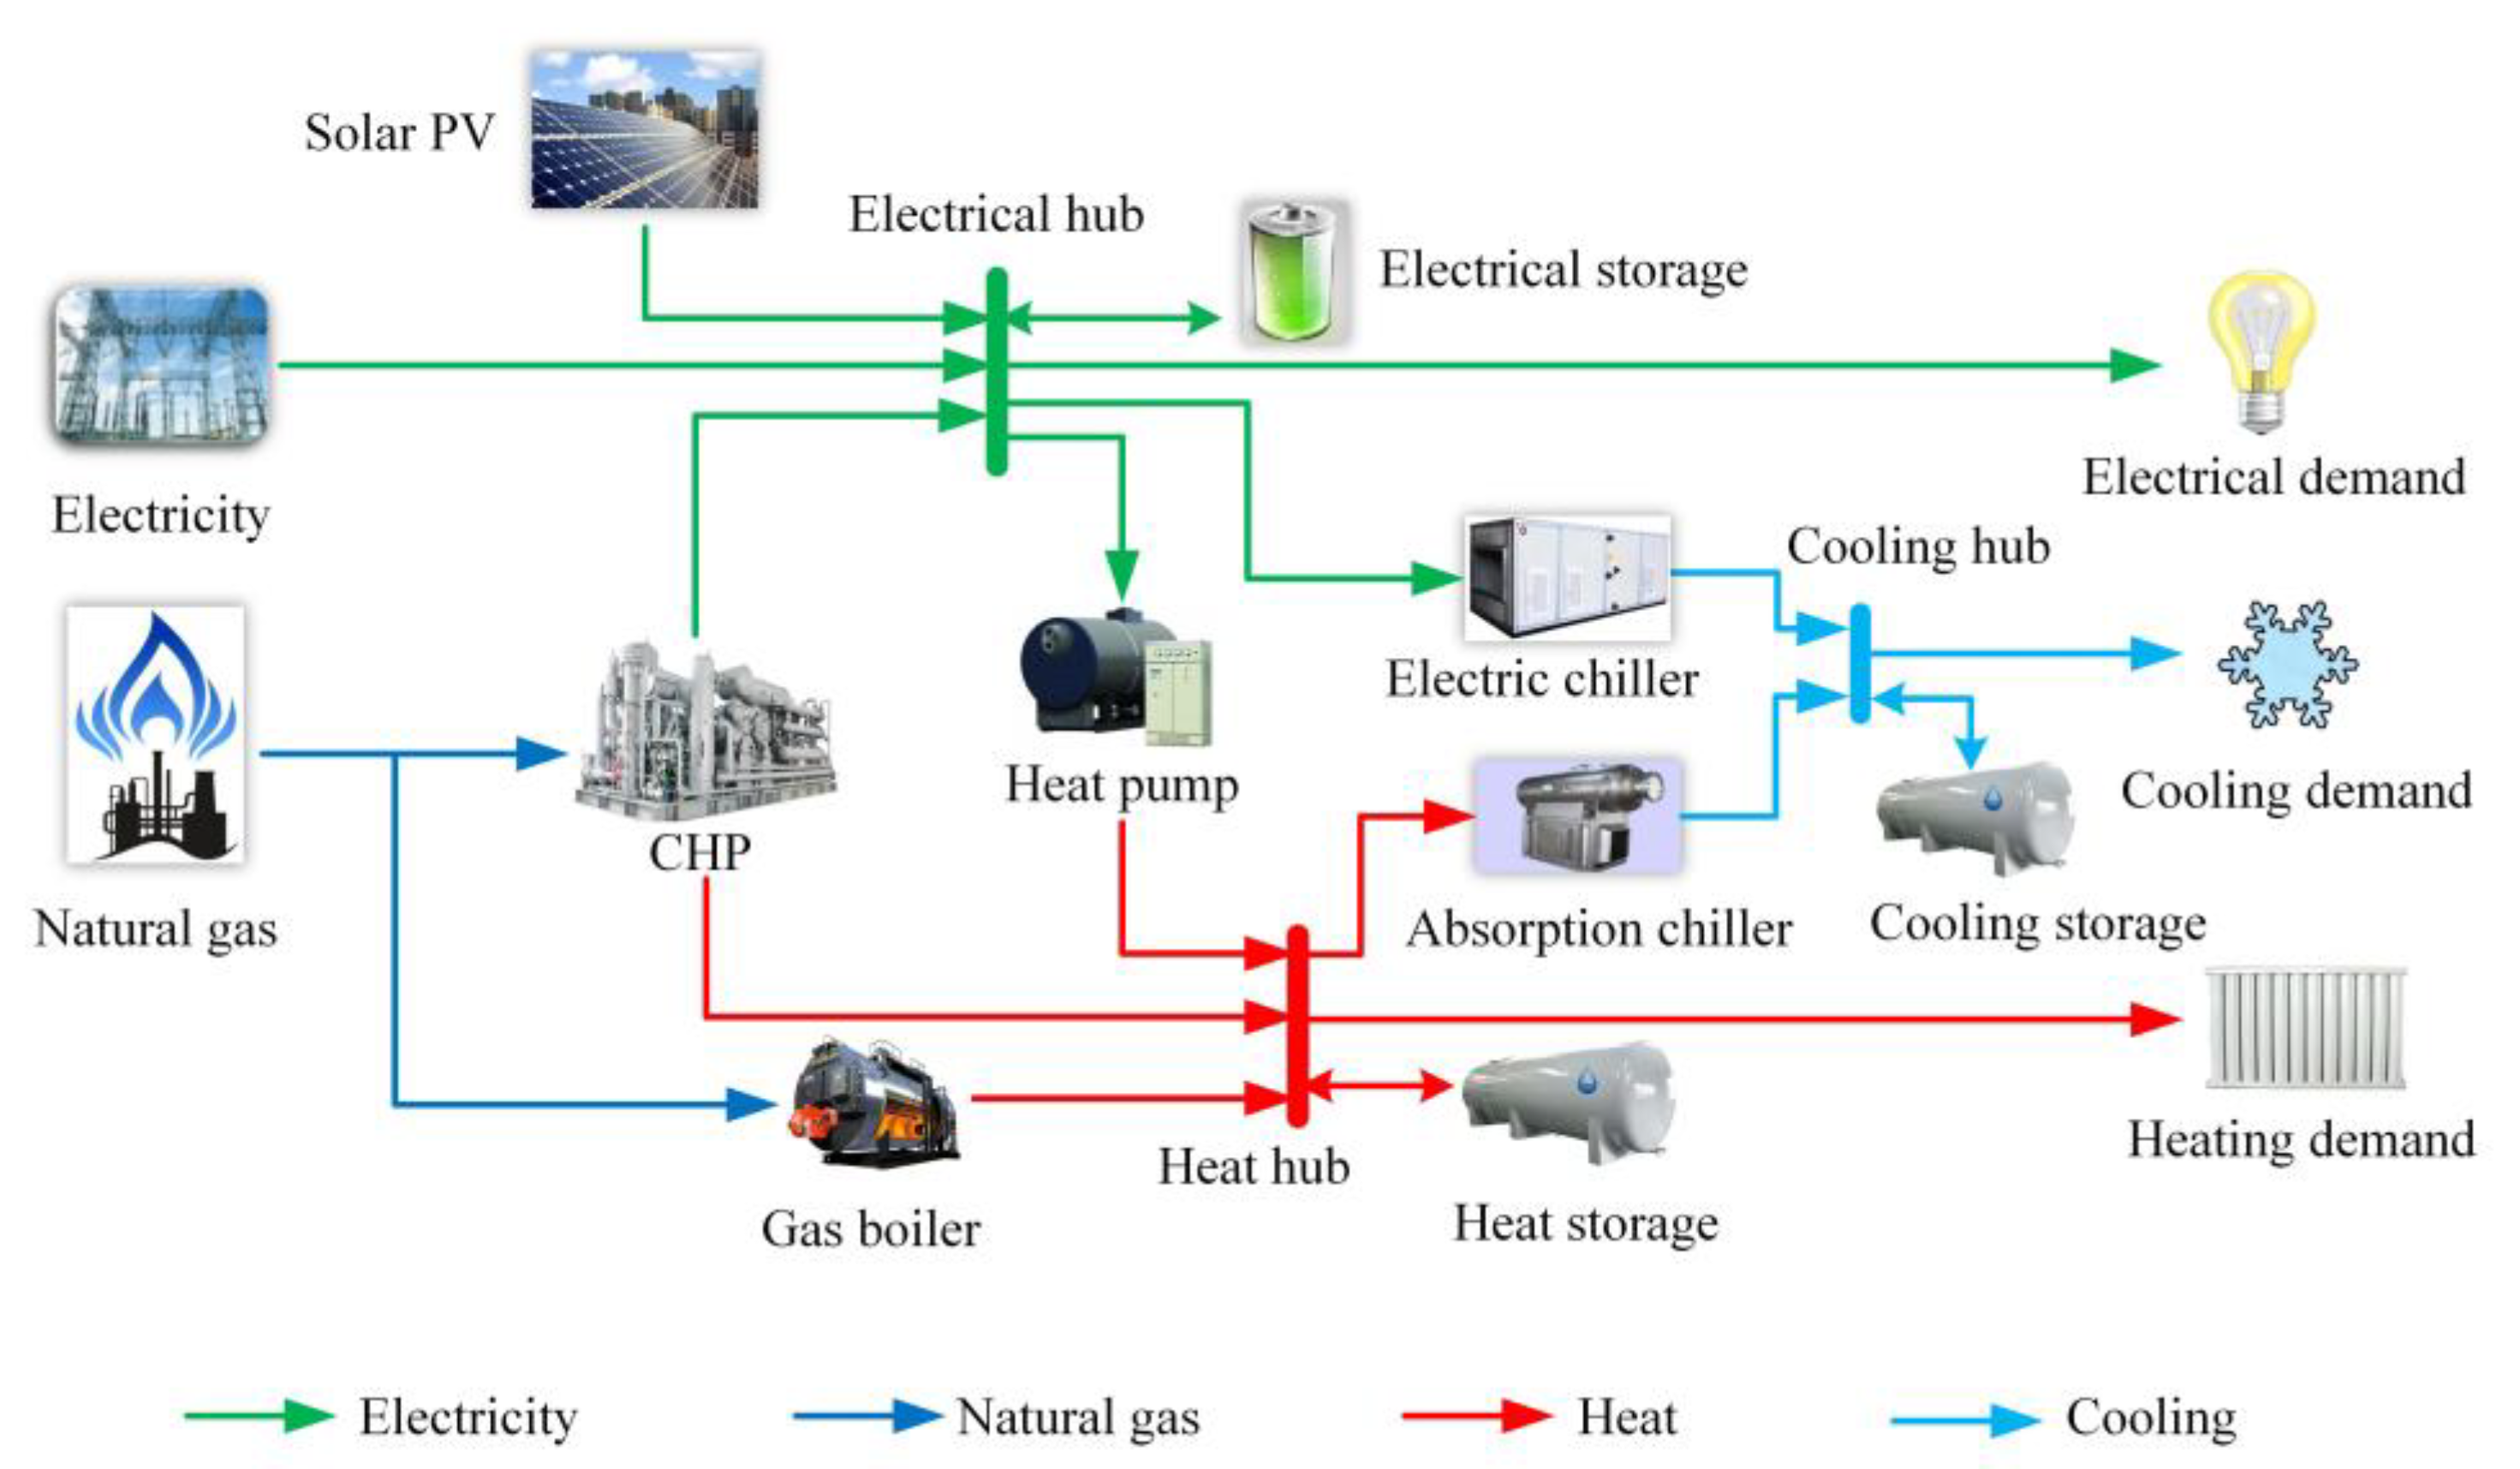
Figure 1. Structure of the studied MEMG system. CHP: combined heat and power; MEMG: multi-energy microgrids; PV: photovoltaics.
Applsci 11 01005 g001
Figure 2. Structure of the heat storage (HS) or cooling storage (CS) tank, where Su_I and Su_O represent the inlet and outlet switch for supply water, respectively; Re_I and Re_O represent the inlet and outlet switch for return water, respectively; VH and VC represent volume of hot and cold water, respectively; TH and TC represent temperature of supply and return water, respectively.
Applsci 11 01005 g002
Figure 3. Historical data of solar PV power used for the p-efficient point method: (a) the historical data for typical summer days; (b) the historical data for typical winter days.
Applsci 11 01005 g003
Figure 4. Electrical/cooling/heating load profiles for a typical summer day and electrical price curve.
Applsci 11 01005 g004
Figure 5. PV generation profiles for a typical summer day obtained by the p-efficient point method at different confidence levels.
Applsci 11 01005 g005
Figure 6. Multi-energy load profiles before and after integrated demand response (IDR) implementation on a typical summer day, respectively: (a) comparison of electrical, cooling and heating load profiles before and after IDR, respectively; (b) electrical, cooling and heating load shift amount at different times of the day, where the negative value indicates the amount of energy demand reduction and the positive value indicates the amount of energy demand increment.
Applsci 11 01005 g006
Figure 7. Operation state of energy conversion facilities on a typical summer day. CHP: combined heat and power; GB: gas boiler; EC: electric chiller; EHP: electrical heat pump; AC: absorption chiller.
Applsci 11 01005 g007
Figure 8. Scheduling of the electrical energy storage (ES), CS HS and the state of charge (SOC) of the ES, CS and HS on a typical summer day.
Applsci 11 01005 g008
Figure 9. Purchased energy and PV power accommodation on a typical summer day.
Applsci 11 01005 g009
Figure 10. Multi-energy load profiles and IDR implementation on a typical winter day: (a) Comparison in electrical, cooling and heating load profiles before and after implementing IDR, respectively, and available PV power at a confidence level of 0.85; (b) electrical and heat load shift amount at different times of the day, where the negative value indicates the amount of energy demand reduction and the positive value indicates the amount of energy demand increment.
Applsci 11 01005 g010
Figure 11. Purchased energy and PV power accommodation on a typical winter day.
Applsci 11 01005 g011
Figure 12. Operation state of energy conversion facilities on a typical winter day.
Applsci 11 01005 g012
Figure 13. Scheduling of the ES and HS and the SOC of the ES and HS on a typical winter day.
Applsci 11 01005 g013
Table 1. The equipment parameters for the test system.
ParametersValueParametersValue
η E C H P / η H C H P 0.35/0.45 P M a x CHP 55 kW
η H G B 0.85 P M a x GB 20 kW
ζ E H P 2.3 P M a x EHP 35 kW
ζ E C 2.9 P M a x EC 60 kW
ζ A C 0.8 P M a x AC 20 kW
η B , c h / η B , d i s 0.9 P B , c h max / P B , d i s max 20 kW
E B min 10 kWh E B m a x 90 kWh
η ϕ , c h / η ϕ , d i s 0.9 P ϕ , c h max / P ϕ , d i s max 10 kW
E ϕ min 0 E ϕ m ax 48 kWh
κ B 0.001 κ ϕ 0.001
CHP: combined heat and power; GB: gas boiler; EHP: electrical heat pump; EC: electric chiller; AC: absorption chiller; η E C H P / η H C H P : electrical/heat conversion efficiency; η H G B : conversion coefficient; ζ : coefficient of performance; P M a x : maximum power limit; η c h / η d i s : charging/discharging efficiency; B: battery; φ: heat storage or cooling storage tank; E min / E m a x : minimum and maximum energy stored in storage; P c h max / P d i s max : maximum charging/discharging power; κ : decay rate of storage.
Table 2. Impact of confidence level and effectiveness of IDR.
Confidence LevelIDR Configuration/%Amounts of Load Shift/kWhIDR Cost/¥Energy Cost/¥Total Cost/¥
0.958.982.3521.86898.54920.4
0.901090.7624.47881.3905.8
0.8510.695.4725.90865.11891.01
0.8013.5118.0630.51838.84869.34
0.7515.1132.6433.81817.86851.67
Publisher’s Note: MDPI stays neutral with regard to jurisdictional claims in published maps and institutional affiliations.