Article

Optimization of Extraction Conditions for Antioxidant Activity of Acer tegmentosum Using Response Surface Methodology

1
Research Center for Industrialization of Natural Nutraceuticals, Dankook University, Cheonan 31116, Korea
2
Department of Food Science and Nutrition, Dankook University, Cheonan 31116, Korea
*
Authors to whom correspondence should be addressed.
Appl. Sci. 2021, 11(3), 1134; https://doi.org/10.3390/app11031134
Submission received: 10 January 2021 / Revised: 22 January 2021 / Accepted: 22 January 2021 / Published: 26 January 2021
(This article belongs to the Section Applied Biosciences and Bioengineering)

Abstract

:
Extraction from edible plants is a highly important process that has various biological functions. To maximize biological activity, extraction methods should facilitate optimal extraction of functional phytochemicals. In this study, the optimal hydrothermal extraction conditions of Acer tegmentosum were determined using response surface methodology (RSM), and HepG2 cells were treated with optimized extract and hydrogen peroxide. In a central composition design, the independent variables were extraction temperature (X1: 70–90 °C), extraction time (X2: 2–6 h), and solvent-to-solid ratio (X3: 50–150). The maximum total phenolic contents (276.70 ± 10.11 mg GAE/g) and DPPH (2,2-diphenyl-1-pictylhydrazyl) activity (33.45 ± 2.20%) of A. tegmentosum were estimated at optimized extraction conditions, as follows: X1: 89.34 °C, X2: 7.36 h, X3: 184.09. Using the calculated extraction conditions, functional phytochemicals were extracted by hydrothermal extraction and freeze-dried. A. tegmentosum treatment (>10 μg/mL) of HepG2 cells remarkably attenuated hydrogen-peroxide-inducible hepatic cellular death and reactive oxygen species production in vitro.

1. Introduction

Oxidative stress is a state of electrical imbalance between reactive oxygen species (ROS) and cellular systems [1]. Disruption of the normal redox state in the cells may cause significant cellular toxicity via the production of superoxide anions, hydroxyl radicals, hydrogen peroxide (H2O2), and singlet oxygen in DNA, proteins, and lipids. Prolonged cellular oxidative stress may alter multiple cellular signals and cause DNA damage via strand-breaking [2]. The imbalance of biological electron systems caused by oxidative stress in mammals is considered a pathological developmental consequence of cancer, neurological disorders (Parkinson’s disease, Alzheimer’s disease, ADHD, and depression), cardiovascular diseases (atherosclerosis, myocardial infarction, and heart failure), and others [3].
Therefore, consumption of antioxidative compounds is necessary to increase longevity and prevent oxidative-stress-related pathological outcomes. In general, antioxidants reduce oxidation by providing free reactive radicals. Therefore, proper consumption of antioxidants is a highly recommended means to prevent cellular oxidative stress in humans. Antioxidants are abundant in natural edible plants that have numerous medicinal antioxidative components, such as vitamin C and polyphenols [4]. However, the extraction method is one of the key methods for isolating functional antioxidative components from raw materials. Extraction conditions such as extraction temperature, extraction time, and solvent-to-solid ratio significantly affect antioxidative capacities, including radical scavenging activities and total polyphenol content (TPC) [5].
Optimization of the extraction method is highly important when considering the elution rate of functional materials. Multiple extraction methods have been developed, including hot water extraction, Soxhlet extraction, microwave extraction, ultrasound-assisted extraction (UAE), and supercritical fluid extraction (SFE) [6]. These extraction methods directly affect the extraction rate and the application cost, and each method has different advantages.
Hot water extraction is an easily accessible, widely acceptable, and economical extraction method. Soxhlet extraction involves continuously extracting phytochemicals from raw materials and uses relatively less solvent than a general extraction method by circulating the solvent [7]. Microwave-assisted extraction generates heat via conduction by applying a microwave to both solvent and sample. UAE involves eluting the desired functional material by destroying the cell wall of the sample tissue with ultrasonic vibration. In addition, SFE, a method for extracting a substance, has also been developed; supercritical fluid passes the critical point at which liquid and gas share characteristics, which accelerates solvent extraction at high temperature and pressure.
Solvent is another factor that influences the extraction yield from raw materials. In simple extraction methods (maceration, infusion, decoction, and percolation), the elution yield is determined according to the polarity (polar solvent: methanol, ethanol, and water; nonpolar solvent: ethyl ester or chloroform) of the solvent and the substance [7]. When the solvent is determined by the extraction temperature and time, the solvent solubility, the ratio of the raw material, and the extraction solvent before extraction are important follow-up factors that should be harmonized. If the temperature during extraction is high, the elution rate of the functional material is accelerated; however, a high temperature may decrease the stability of the functional material. Similarly, a longer extraction time may increase the number of functional phytochemicals from the raw material, but it decreases the elution rate of functional substances after a certain time point, which may affect economic efficiency [8]. Acer tegmentosum is a maple tree distributed between Russia and Korea [9,10]. Over the past few decades, several studies have been conducted to determine the medicinal functions (i.e., antioxidative, anti-inflammatory, antigastric, antiadipogenic, antiosteoclastic, and anticancerous properties) of A. tegmentosum. In Korea, the leaf, branch, and bark of A. tegmentosum have been traditionally used for medical purposes, including treating hepatic and renal diseases [11,12,13]. The efficacy of A. tegmentosum has been reported in the aforementioned studies. However, the optimal extraction conditions and target substances have not been thoroughly investigated to date. In this study, we report the optimal extraction factors of A. tegmentosum using RSM; these factors include the extraction time, the extraction temperature, and the solvent-to-solid ratio.

2. Materials and Methods

2.1. Preparation of A. tegmentosum

A. tegmentosum was purchased from Nonghyup, Jechon-gun, Chungcheongbuk-do, Korea in June 2014, and all experiments were performed by September 2014. The bark and twigs of A. tegmentosum were cut into parts that were 1–1.5 cm in length and used for hydrothermal extraction. The cut A. tegmentosum samples were thoroughly washed with distilled water to remove foreign material and dried for 1 week at room temperature. Dried and cut A. tegmentosum was extracted with hot water, concentrated by evaporation, and freeze-dried for further experiments.

2.2. Chemicals and Materials

Gallic acid, quercetin, ascorbic acid, 2,2-diphenyl-1-pictylhydrazyl (DPPH), 2,2’-azobis(3-etheylbenzothiazoline-6-sulfonic acid) diammonium salt, Folin-Ciocalteu reagent, aluminum nitrate, potassium acetate, iron sulfate heptahydrate, nitroblue tetrazolium, 6-hydroxy-2,5,7,8,-tetramethylchroman-2-carboxylic acid, and 2,7-dichlorofluorescein diacetate (DCF-DA) were purchased from Sigma-Aldrich (St. Louis, MO, USA).

2.3. RSM

RSM was used to set the optimal conditions for the hot water extraction of A. tegmentosum. The optimal extraction conditions were determined by extraction time (X1; 0.64–7.36 h), extraction temperature (X2; 63.18–96.82 °C), and solvent-to-solid ratio (X3; 15.91–184.09) based on pre-extraction conditions using Minitab (v16, Minitab, Inc., State College, PA, USA). Twenty samples with six replicates for each sample were tested for the central composite design (CCD; Table 1). The experimental data followed the empirical second-order polynomial model, as represented in the equation:
Y = A 0 + i = 1 3 A i X i + i = 1 3 A i i X i 2 + i = 1 2 j = i + 1 3 A i j X i j + ε  

2.4. TPC

The TPC was measured using the method described by Singleton et al. [14], with minor modifications. In brief, 20 µL of the aqueous extract of A. tegmentosum was mixed with 1580 µL distilled water. Then, 10 µL Folin-Denis reagent (Sigma-Aldrich) was mixed with 160 µL of the aforementioned mixture for 8 min in 96-well plates. Then, 30 µL Na2CO3 solution (Showa Chemical Industry, Tokyo, Japan) was added to the mixture and incubated under light-proof conditions for 2 h at room temperature. After incubation, the absorbance of the samples was measured at 765 nm using a microplate reader (Spectramax M2 microplate reader, Molecular Devices, San Jose, CA, USA). The linearity of the standard curve of gallic acid solution (0–600 µg/mL) was acquired (R2 = 0.997), and the results are presented as milligrams of gallic acid equivalent (GAE).

2.5. DPPH Activity

The DPPH assay for antioxidant activity was measured by the method presented by Molyneux [15]. The extract (40 μL) was mixed with a 1.5 × 10⁻⁴ M DPPH methanol solution (160 μL) and then incubated in the dark for 30 min. The incubated mixture was transferred to a 96-well microplate, and the absorbance was measured at 517 nm using a microplate reader. A blank was prepared by substituting A. tegmentosum powder with distilled water. Ascorbic acid solutions (0.2–0.4 mg/mL) were used to generate an analytical curve (R2 = 0.997). The results are presented as milligrams of ascorbic acid equivalent per gram of A. tegmentosum powder (mg ACE/g).

2.6. Total Flavonoid Content

The total flavonoid content was measured using the method by Zhishen et al. [16], with some modifications. A. tegmentosum extract (40 μL) was mixed with 120 μL ethanol. The mixtures were combined with aluminum nitrate and potassium acetate and incubated for 40 min in a dark room. After incubation, the samples were placed in a 96-well plate, and their absorbance was measured using a microplate reader at 415 nm. Quercetin was used to generate a standard curve, and the results were presented as milligrams of quercetin equivalent/gram of A. tegmentosum powder (mg QE/g).

2.7. Ferric Reducing Antioxidant Power (FRAP)

FRAP was assessed using the method described by Langley-Evans [17]. Briefly, the working solution was prepared by mixing acetic acid buffer (pH 3.6, 300 mM). The following working solutions were mixed: A, 300 mM sodium acetate; B, 10 mM 2,4,6-tripytidyl-triazine in hydrochloric acid; C, 29 mM FeCl3∙6H2O. The working solution was mixed with 10 μL of the sample solution and incubated for 15 min in the dark. Absorbance was measured at 592 nm using a microplate reader.

2.8. Trolox Equivalent Antioxidant Capacity (TEAC)

Based on the TEAC method by Re et al. [18], 10 µL of the hot water extract of A. tegmentosum and 2400 µL 6-hydroxy-2,5,7,8-tetramethylchroman-2-carboxylic acid (ABTS) radical solution were mixed and incubated in the dark at 37 °C for 15 min. The absorbance was measured at 405 nm using a microplate reader. The reaction rate was calibrated using Trolox equivalent (TE). Assay results were expressed in g TE/mL. Absorbance was measured at 734 nm, and TEAC was expressed in units of mM Trolox equivalent/g.

2.9. Oxygen Radical Absorbance Capacity (ORAC)

The ORAC method reported by Cao et al. [19] was used to measure the samples using a mixture of sample solution (50 μL) and fluorescein sodium (150 μL). The mixture was incubated in a dark room for 10 min at 37 °C, followed by treatment with 2’-azobis (2-amidino propane) dihydrochloride (25 μL). Fluorescence was measured at 485 nm excitation and 535 nm emission wavelengths. The standard curve was set with Trolox, and the area under the curve of the sample was estimated with the standard.

2.10. High-Pressure Liquid Chromatography and Quadrupole Time-of-Flight Spectrometry

The identification of major compounds in 1 mg/mL A. tegmentosum was analyzed using high-pressure liquid chromatography (HPLC) with diode array detection. For the chromatographic separation of A. tegmentosum, we used an Infinity 1260 system (Agilent Technologies, Santa Clara, CA, USA) consisting of binary pumps, an on-line degasser, an autosampler, a diode array detector (DAD), and a column compartment equipped with a reverse-phase HPLC column (Acclaim 120 C18; 4.6 × 250 mm, 5 μm; Thermo, MA, USA). Chemstation software (Agilent Technologies) was used for data acquisition and processing. Mobile phases A and B were 2% acetic acid in distilled water and 0.1% formic acid in acetonitrile, respectively. The detailed running conditions of the mobile phases are listed in Table 2. The flow rate, injection volume, and column oven temperature were set to 1 mL/min, 10 µL, and 35 °C, respectively. The DAD detector was operated at a wavelength of 320 nm to monitor the major compounds. Quadrupole time-of-flight mass spectrometry (Q-TOF-MS) was performed using an iFunnel Q-TOF LC/MS 6550 (Agilent Technologies), and the detailed analytical conditions for the experiment are shown in Table 3.

2.11. Cell Culture

Liver hepatocellular adenocarcinoma (HepG2) cells from the Korean Cell Line Bank (KCLB, Seoul, Korea) were used in this study. Dulbecco’s modified Eagle’s medium (DMEM) was purchased from Thermo Fisher Scientific (Waltham, MA, USA). Fetal bovine serum (FBS) and penicillin–streptomycin was purchased from Welgene (Daegu, Korea). The mixture was incubated at 37 °C in a humid atmosphere of 5% CO2. For the cell viability and ROS formation assays, HepG2 cells were seeded at 5 × 10⁵ cells/mL and different concentrations of the extract (0, 10, 20, and 40 μg/mL), and the extract was dissolved in medium. Hydroperoxide was added after 1 h. The medium was changed every 3–4 days.

2.12. Cell Viability Assay and Assessment of ROS Formation in HepG2 Cells

The 3-(4, 5-dimethylthiazol-2-yl)-2,5-diphenyl tetrazolium bromide (MTT) assay was performed in HepG2 cells. After the aforementioned treatments, media were removed from the cultures and cells were washed with PBS three times. The MTT solution was added to each well and incubated for 4 h. After discarding the MTT solution from the cells, 100 μL DMSO was added to the cells, and absorbance was read at 540 nm using a microplate reader.
The ROS scavenging effect of A. tegmentosum against an H2O2 challenge in HepG2 cells was determined using DCF-DA. Cells were treated with A. tegmentosum and H2O2, as described above, and washed with PBS. Then, DCF-DA reagent (Thermo) was added, and cells were incubated in the dark at 37 °C for 40 min according to the manufacturer’s instructions. After incubation, fluorescence was determined using a microplate reader at 485 nm excitation and 530 nm emission wavelengths.

2.13. Statistical Analysis

Results are presented as the mean ± standard deviation (SD). Data were analyzed statistically using a one-way analysis of variance (ANOVA) with Duncan’s new multiple range test. p < 0.05 was considered statistically significant, and all statistical analyses were performed using Design-Export 12 (Trial version, State-Ease Inc., Minneapolis, MN, USA) except for predicted optimization with the condition using the response optimizer from Minitab (Minitab Inc., State College, PA, USA; v16.1.0).

3. Results

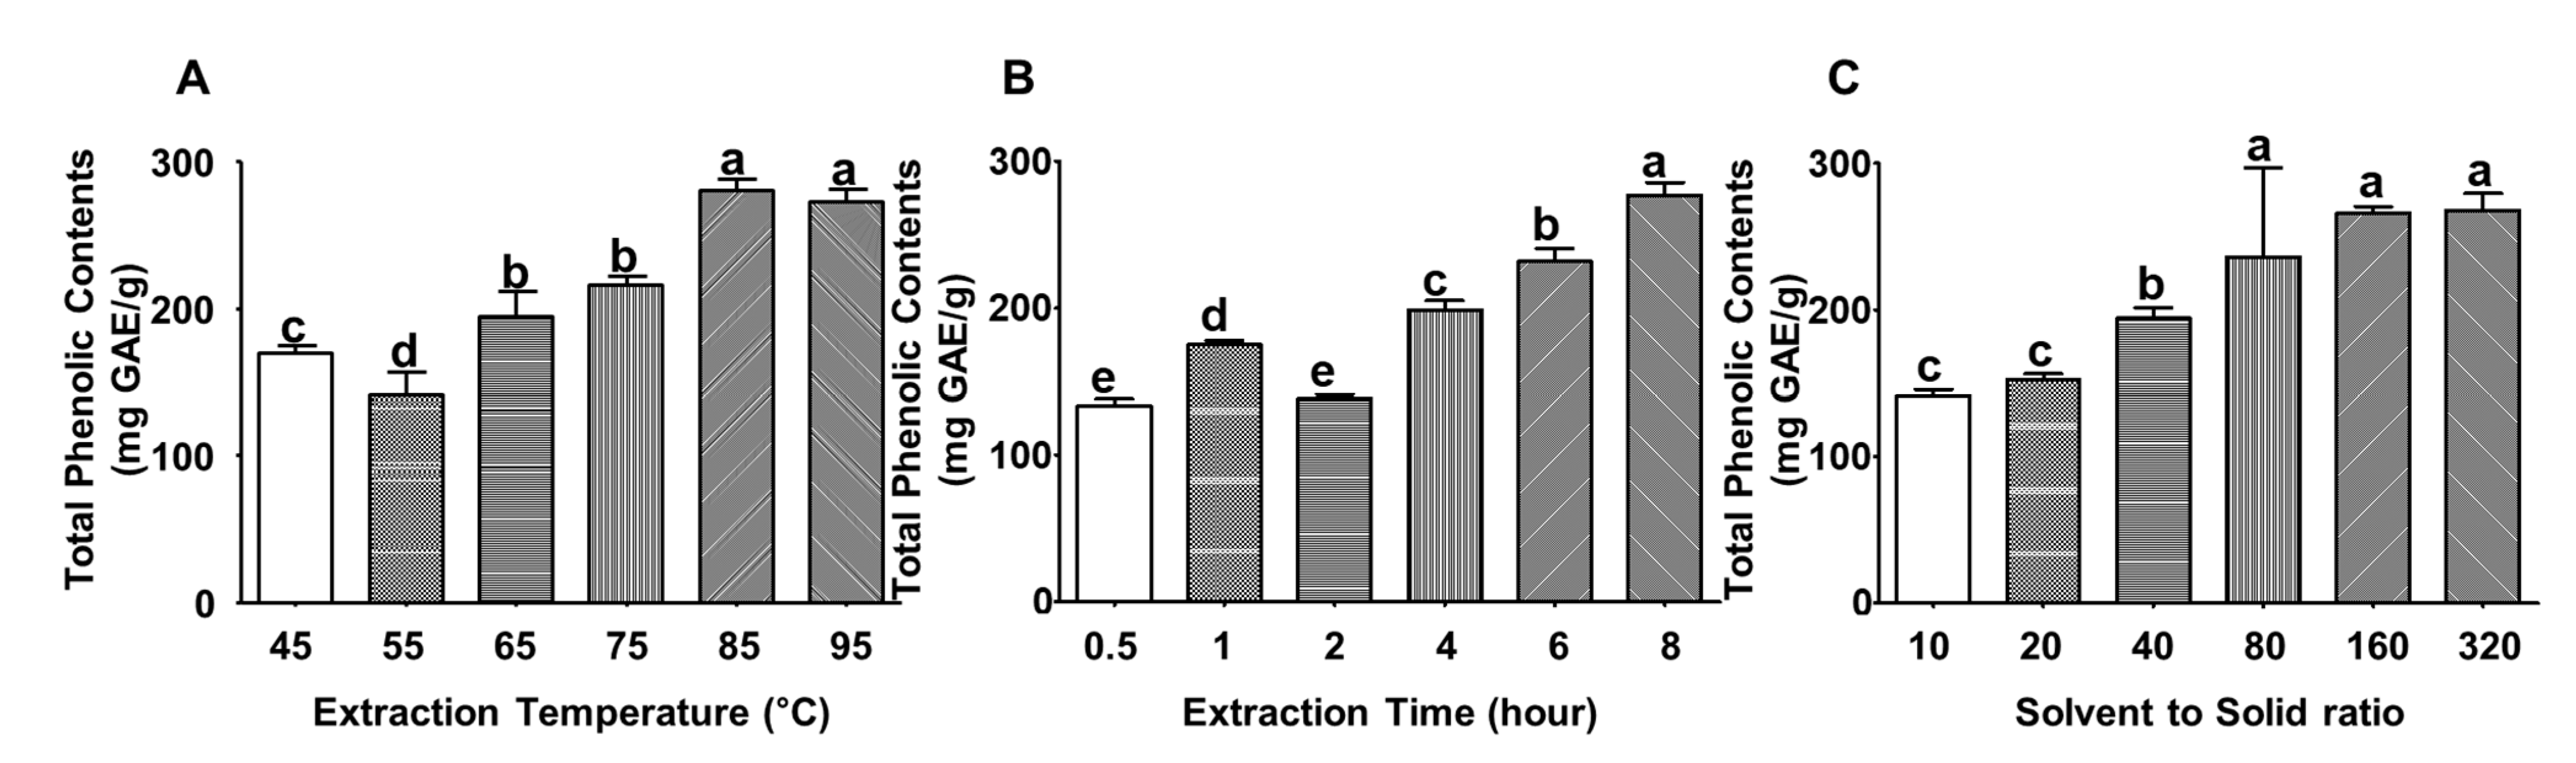
3.1. Determination of Experimental Conditions

The total phenolic content of A. tegmentosum varied according to the extraction temperature, the extraction time, and the solvent-to-solid ratio, as shown in Figure 1. To determine the optimal extraction temperature for A. tegmentosum, the extraction time (2 h) and the solvent-to-solid ratio (80) were fixed. The extraction temperature varied from 45–95 °C with every 10 °C gap. In general, as the extraction temperature increased, the TPC gradually increased in a temperature-dependent manner (Figure 1A). The best extraction condition from 45–95 °C was ≥85 °C, which yielded 276.95 ± 8.43 mg GAE/g. This was followed by temperatures of 85 and 75 °C. To understand the optimized extraction time (0.5–8 h), the extraction temperature and the solvent-to-solid ratio were fixed at 85 °C and 80, respectively. The optimal time to extract the TPC from A. tegmentosum (Figure 1B) was 6–8 h, followed by 2–4 h. To determine the optimal extraction conditions for the solvent-to-solid ratio of A. tegmentosum, the extraction temperature and the extraction time were fixed at 85 °C and 2 h, respectively. A solvent-to-solid ratio of 80–320 was the optimal range for extracting the TPC from A. tegmentosum (Figure 1C).
DPPH activities were determined under the experimental conditions shown in Figure 1. Again, the optimal extraction temperature was 95 °C when the extraction time and the solvent-to-solid ratio were fixed at 2 h and 80, respectively (Figure 2A). The extraction temperature of 95 °C exhibited 29.92% DPPH activity, and the extraction temperature gradually decreased the DPPH activity. The ideal extraction time also showed a similar pattern, as shown in Figure 1B. To identify the optimal extraction time, the extraction temperature and the solvent-to-solid ratio were fixed at 85 °C and 80, respectively. The optimal range for extracting A. tegmentosum was 6–8 h, which exhibited the highest DPPH activity (30.44–31.06%). However, by reducing the extraction time, DPPH activities decreased gradually (Figure 2B). To determine the optimal solvent-to-solid ratio, the extraction temperature and the extraction time of A. tegmentosum were controlled at 85 °C and 2 h, respectively. Solvent-to-solid ratios of 80 and 320 were the maximal conditions to facilitate higher DPPH activity (28.22–28.32%) from A. tegmentosum extraction. A solvent-to-solid ratio lower than 80 or 320 attenuated DPPH activities from A. tegmentosum extract (Figure 2C). Figure 2 shows the relationship between DPPH activity and the extraction conditions. The result of DPPH activity is the same as the total phenolic contents by setting conditions in six ranges. These ranges were based on an extraction time of 2 h, an extraction temperature of 85 °C, and a solvent-to-solid ratio of 80. After extraction, DPPH activity was measured. DPPH activity showed a maximum value at 8 h (31.05 ± 1.23%), but there was no significant difference between this and the extraction results for 6 h (30.44 ± 0.77%). The extraction temperature increased and reached a maximum value at 95 °C (29.92 ± 0.91%). The solvent-to-solid ratio showed the highest scavenging activity at 80 (28.32 ± 1.84%), followed by a significant decrease.

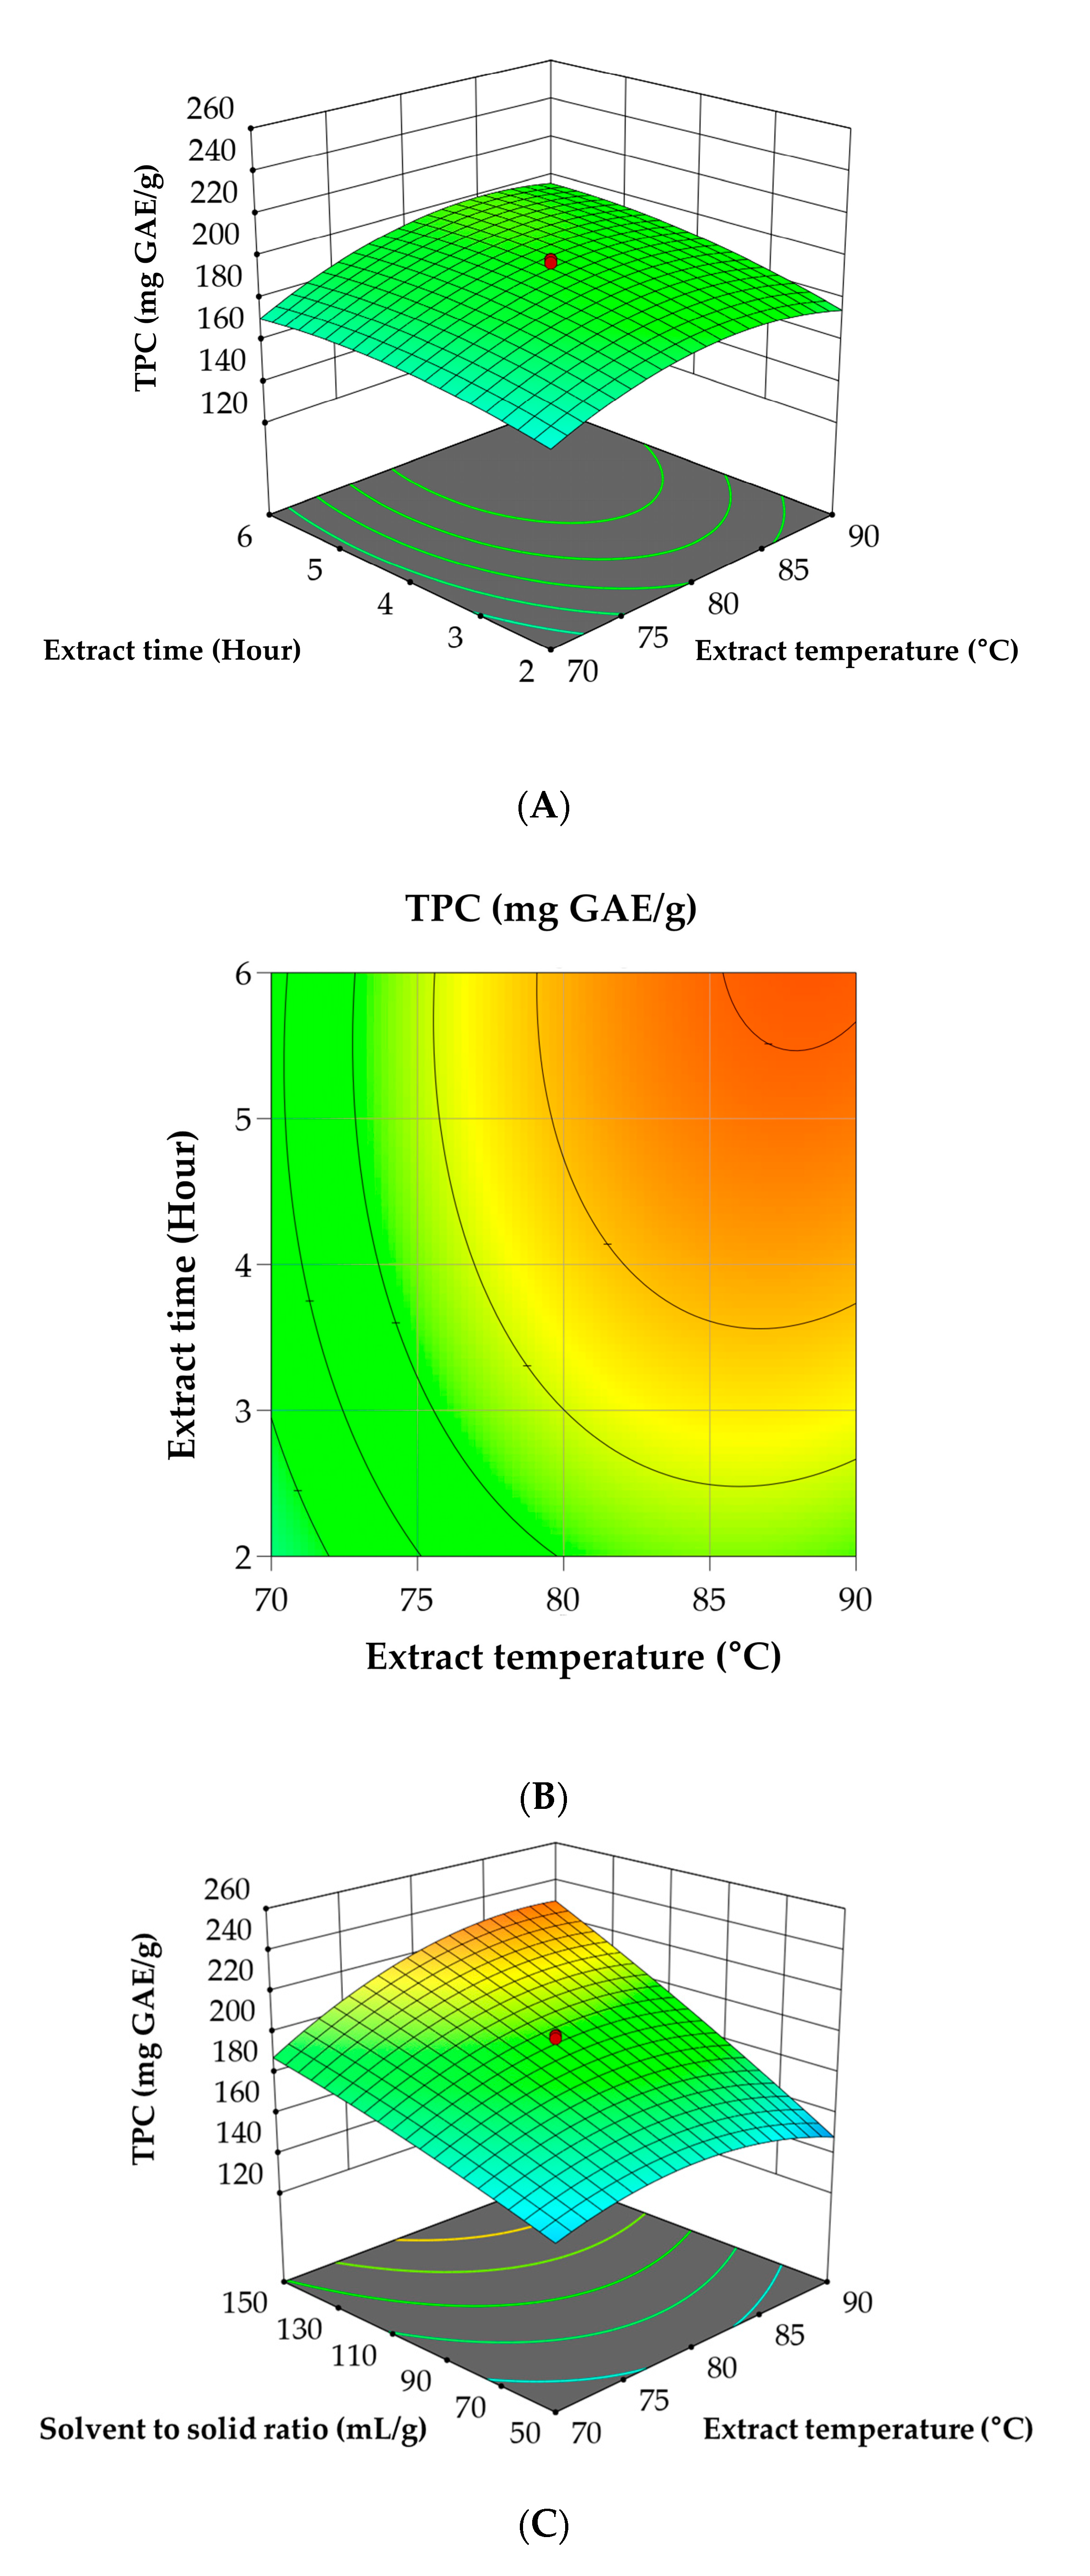
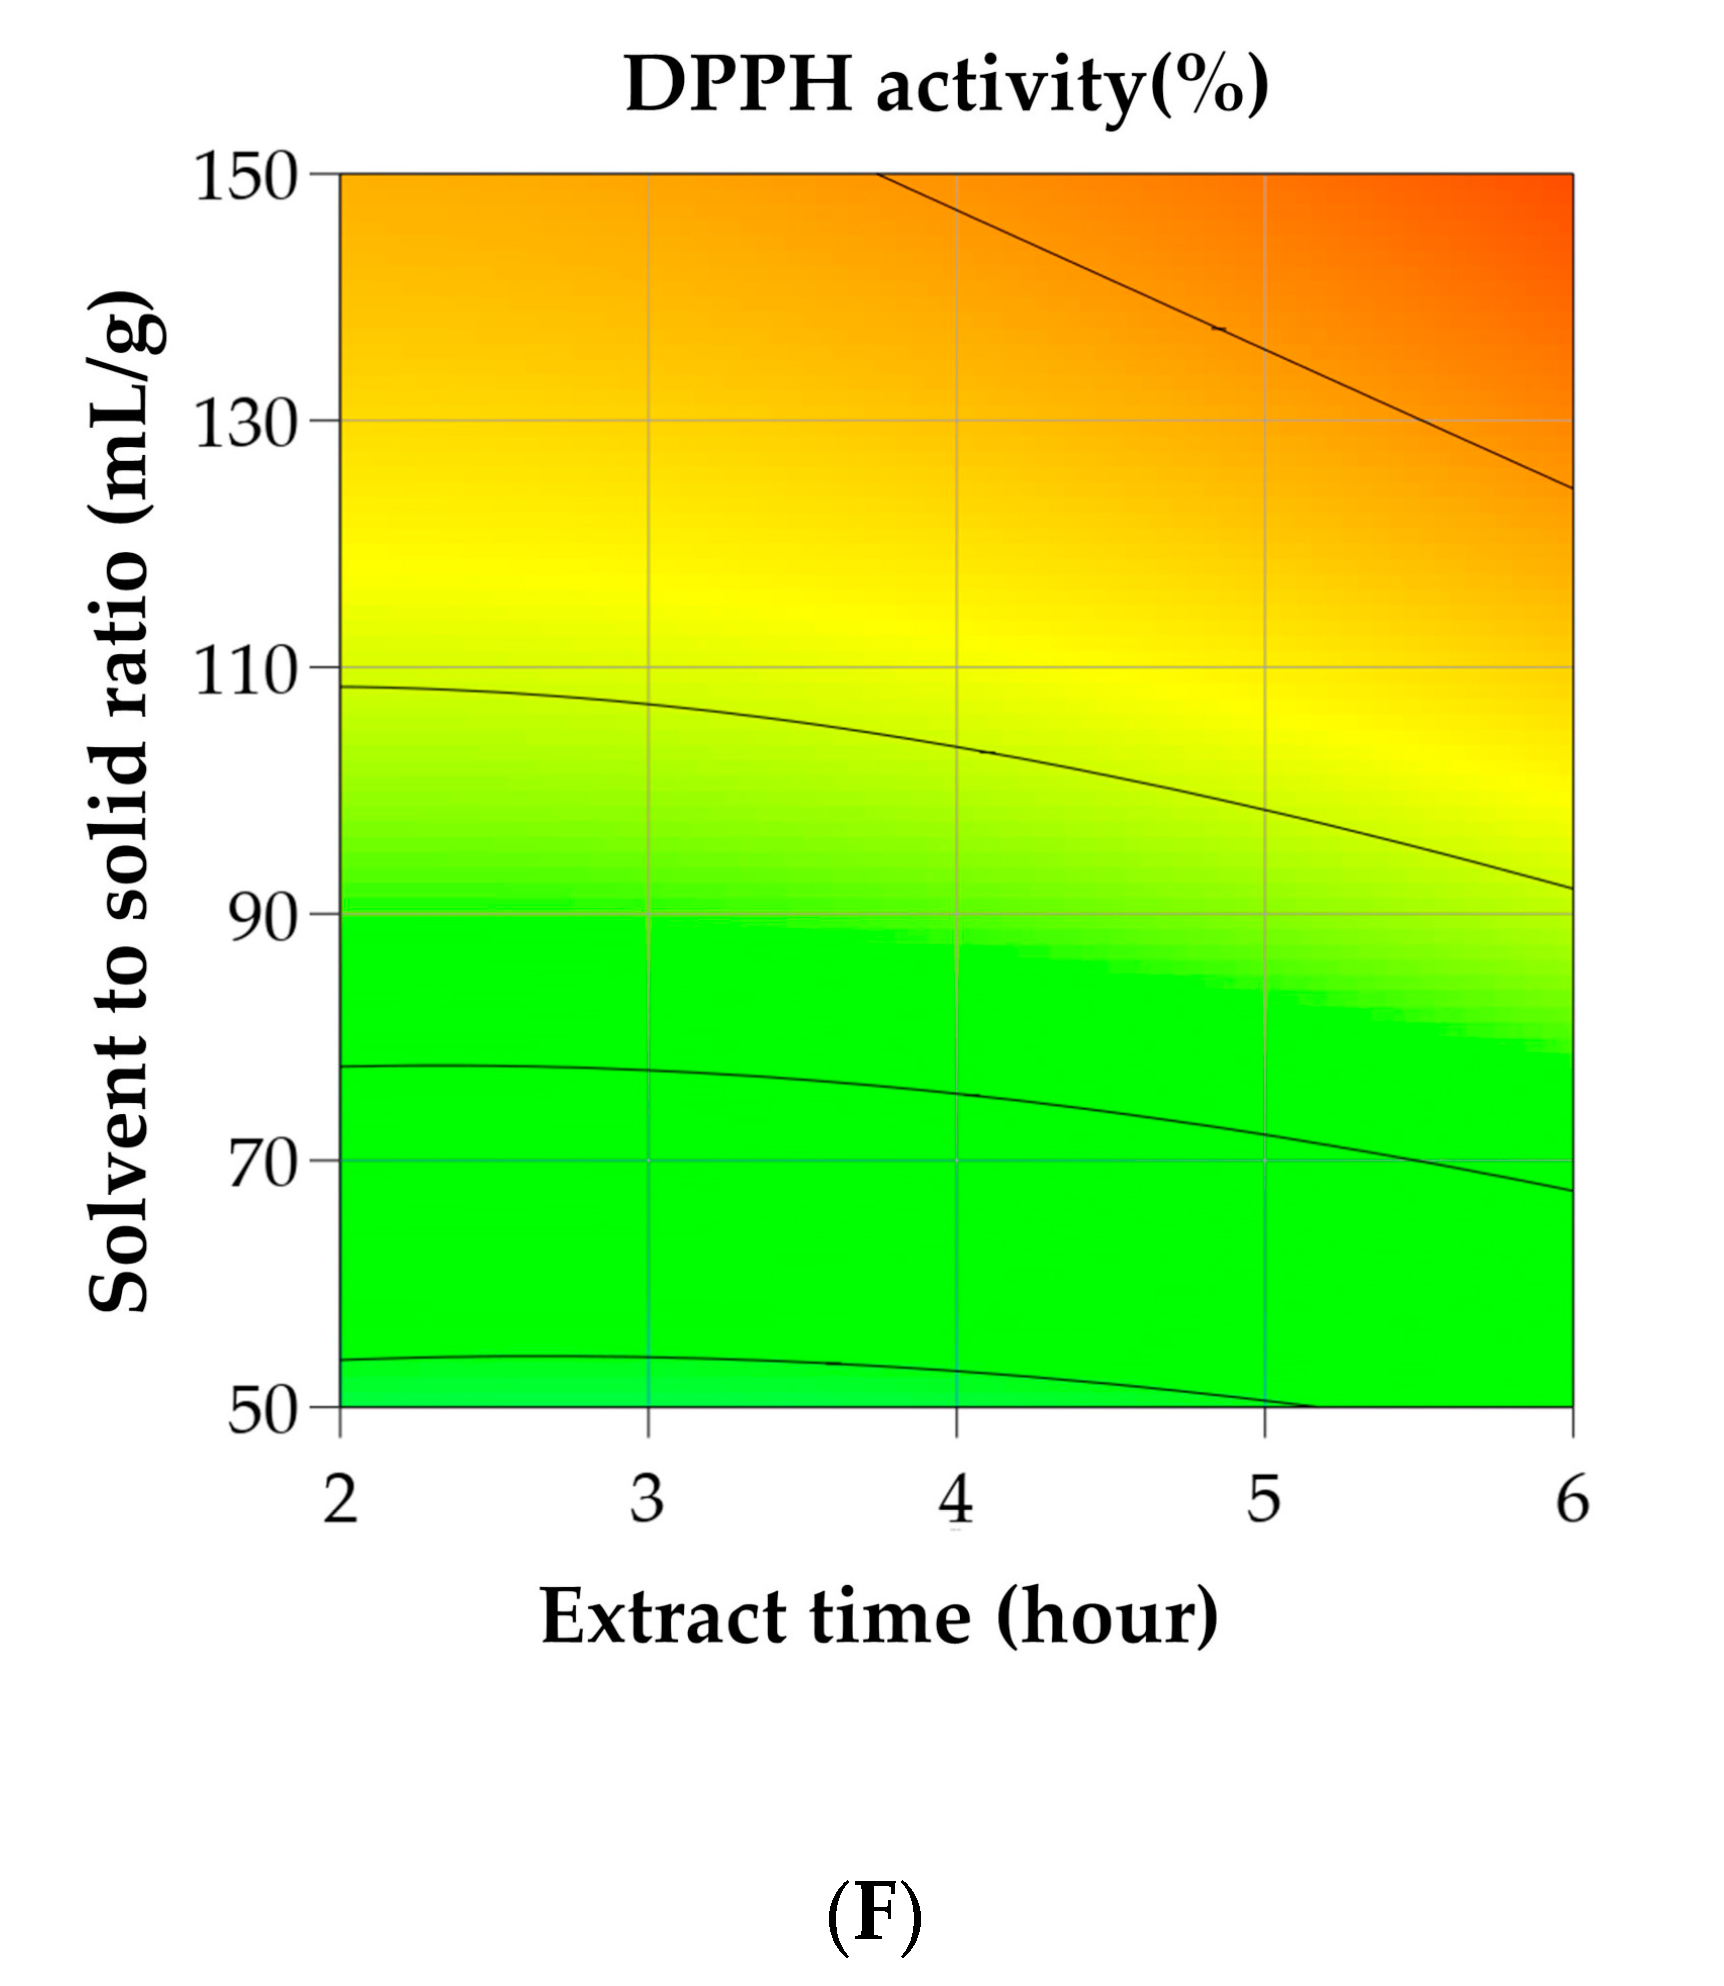
3.2. RSM for Optimization of A. tegmentosum

The goal of RSM is to establish the optimal conditions for extracting compounds with high antioxidant activities from A. tegmentosum. To establish optimal extraction conditions, the central point of the CCD was applied to the optimal values of 2 h (extraction time), 85 °C (extraction temperature), and 100 (solvent-to-solid ratio) based on the previously acquired results (Table 1). The independent variables of extraction temperature, extraction time, and solvent-to-solid ratio were set at 2–6 h, 63–97 °C, and 100 in the CCD range, respectively. Twenty experimental points were selected by Minitab and applied to the RSM design. The extraction conditions from the CCD consist of six central points, six axial points, and eight factorial designs. Each extract condition, the TPC, and the DPPH results are shown in Table 4. The three independent variables were as follows: X1, extraction temperature; X2, extraction time; X3, solvent-to-solid ratio. The RSM model for TPC estimation was calculated using the following equation:
TPC (mg GAE/g) = −570.0513 + 18.9147 X1 − 3.2803 X2 − 1.1768 X3 + 0.1692 X1 × X2 + 0.0022X1 × X3 + 0.0452 X2 × X3 − 0.1305 X12 − 1.3943 X22 − 0.0010 X32
The RSM plots for maximal TPC were calculated using three variables (Figure 3). Figure 3A–F were plotted based on the interactions between two variables (extraction time and temperature (Figure 3A/B), extraction temperature and solvent-to-solid ratio (Figure 3C/D), and extraction temperature and solvent-to-solid ratio (Figure 3E/F)). The TPC values showed significant interactions based on extraction temperature and time (Figure 3C/D). This result suggests that the TPC value is maximized by increasing the extraction time and temperature in the controlled experimental ranges. Among the extraction conditions of A. tegmentosum, the extraction temperature (X1, p = 0.034; X12, p = 0.003) and the solvent-to-solid ratio (X3, p < 0.001) significantly affected the TPC (Table 5). Therefore, the extraction temperature was within the tested conditions; however, the solvent-to-solid ratio was outside the experimental range. The extraction temperature and the solvent-to-solid ratio had significant effects on the TPC of A. tegmentosum (X1 × X3, p = 0.006; Table 5).
The maximal point of the TPC was not determined in the CCD range since the highest point existed under 90 °C. However, the highest point of the TPC was observed under the tested conditions (under 7.36 h; Figure 3A/B). The peaks of the solvent-to-solid ratio and the extraction time were not within the testable range; however, as the extraction time and the solvent-to-solid ratio increased, the probability of TPC also increased. The expected maximal point was 228.52 mg GAE/g, with a solvent-to-solid ratio of 150 at 90 °C. As the extraction time and the solvent-to-solid ratio increased, the TPC also increased; therefore, it was not possible to find the maximum point within the CCD measurement range. The highest TPC is expected under the following conditions: 239.42 mg GAE/g, a solvent-to-solid ratio of 150, and an extraction time of 6 h.
The DPPH activity is given in the following equation:
DPPH Activity (%) = −50.1413 + 1.7407 X1 + 0.3171 X2 − 0.0529 X3 − 0.0067 X1 × X2 + 0.0015X1 × X3 + 0.0009 X2 × X3 − 0.1101 X12 + 0.0326 X22 − 0.0001 X32
This equation was established based on the lack of fit and R2 values, which were 0.105 and 0.9664, respectively (Table 6). The results of the regression coefficients and the analysis of variance were used as the basis for the optimal extraction method for maximizing DPPH activities. RSM plots for DPPH activities related to the three independent variables are shown in Figure 4.
Among the extraction conditions of A. tegmentosum, the extraction temperature (X1, p < 0.001; X12, p < 0.001) and the solvent-to-solid ratio (X3, p < 0.001; X12, p = 0.072) significantly affected DPPH activity (Table 6). Therefore, both the extraction temperature and the solvent-to-solid ratio were included in our experimental conditions. Extraction temperature and solvent-to-solid ratio had significant effects on the DPPH activity of A. tegmentosum (X1 × X3, p = 0.002; Table 6). Despite the optimal extract temperature for DPPH activity being between 80–90 °C, an increased solvent-to-solid ratio and increased extraction time led to the best DPPH activity under the CCD conditions (24.99%). The tested response values for TPC and DPPH activity were 276.70 ± 10.11 mgGAE/g and 29.12 ± 4.57%, respectively, and the predicted response values for TPC (p = 0.217) and DPPH activity (p = 0.262) were 268.12 mgGAE/g and 25.04%.

3.3. Antioxidant Activities of Hydrothermal A. tegmentosum Extract

According to our results, the total flavonoid content in A. tegmentosum was 263.31 ± 3.54 mg QE/g (Table 7). For FRAP, the result was expressed as μmol of FeSO4 equivalent per gram of sample. The FRAP value of the extract was 2094 μmol FeSO4/g. The antioxidant activity of the extract was approximately 9-fold lower than that of ascorbic acid. As shown from the ORAC results, the antioxidant capacity of ascorbic acid was 2-fold higher than the capacity of the extract. The ORAC result was 3.80 for the extract and 4.2 for ascorbic acid. Interestingly, the results in Table 5 suggest that the extract showed a higher ORAC activity than the activity of other phytoextracts [20,21].

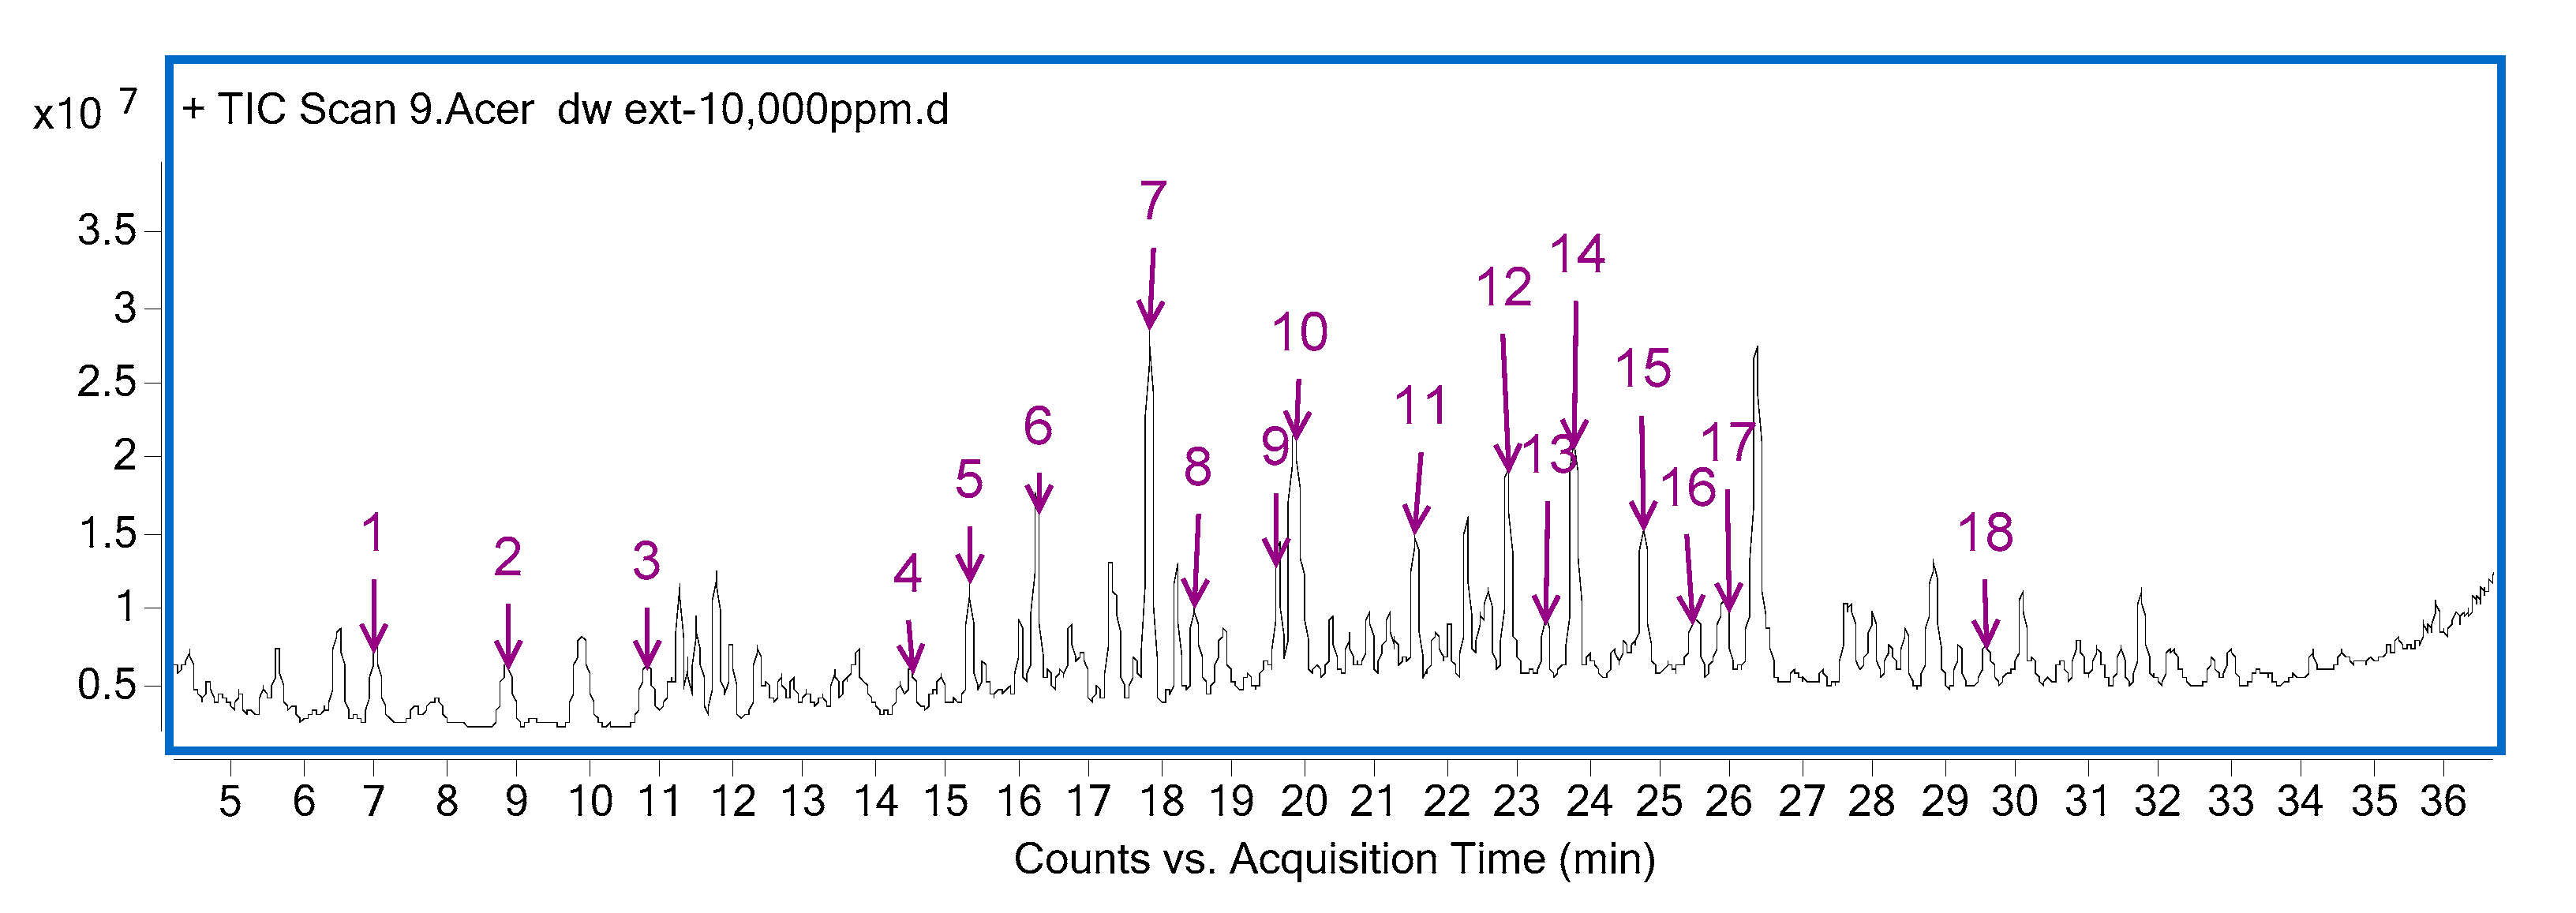
3.4. Identification of Functional Components in Hydrothermal A. tegmentosum Extract by HPLC-Q-TOF-MS

To characterize the functional antioxidative components of the optimized hydrothermal A. tegmentosum extract, the optimized extract was analyzed using HPLC-Q-TOF-MS. A representative chromatogram from the optimized extract is shown in Figure 5, and summarized lists of components are available in Table 8, as detected by Q-TOF-MS analysis. In total, 18 identifiable phytochemicals and 13 chemicals were compared with the LC-MS database of retention time (RT), UV spectrum, molecular weight, and m/z of molecules. Based on matching with an LC-MS library, the optimized hydrothermal method contained A. tegmentosum extract, p-methoxycinnamic acid, genipin, benzyl formate, D-(+)-3-phenyllactic acid, procyanidin B, 1, 6-digalloylglucose, tyrosol, dyhydrosinapyl alcohol, fraxetin, epicatechin, and 6-(2-methoxyvinyl). Benzo [1,3] dioxole-5-carboxylic acid, catechin-(4α->8)-epicatechin-3-O-gallate, and (-)-epicatechin-3-O-gallate appeared as gallate.

3.5. Antioxidant Activities of A. tegmentosum Extract in HepG2 Cells

To verify the antioxidative capacity of hydrothermal A. tegmentosum extract against H2O2, HepG2 cells were used. HepG2 cells were pretreated in the absence (sterile water) and presence of A. tegmentosum extract (0–40 µg/mL) for 1 h, and oxidative stress was induced by adding 1 mM H2O2 for 24 h. Hepatic cellular viability was determined using a 1-(4,5-dimethylthiazol-2-yl)-3,5-diphenylformazan assay. H2O2 treatment significantly attenuated cellular viability (>20%); however, in the presence of hydrothermal A. tegmentosum extract, the optimal extraction gradually protected against H2O2-inducible hepatic cell death in vitro (Figure 6A). Intriguingly, >20 µg/mL of hydrothermal A. tegmentosum extract fully protected the hepatic cells from H2O2-inducible cell death. Therefore, we extended our research question to postulate that the optimal hydrothermal A. tegmentosum extract would protect against H2O2-inducible cellular ROS production. Again, HepG2 cells were cultured, as described above, and ROS production was determined by the DCF-DA method (Figure 6B). Similar to the MTT assay results, H2O2 treatment remarkably elevated cellular ROS production; however, in the presence of >10 µg/mL hydrothermal A. tegmentosum extract, hepatic ROS production was decreased in a dose-dependent manner, and >20 µg/mL hydrothermal A. tegmentosum extract treatment showed no difference in ROS production compared to the control group.

4. Discussion

In this study, we focused on the optimal hydrothermal extraction conditions for A. tegmentosum to maintain maximal antioxidant activities in vitro. There are several reports on using hydrothermal extraction methods with A. tegmentosum for extracting phenolic compounds [22,23]; however, the optimal extraction methods are not clearly understood. Therefore, we determined the optimal hydrothermal extraction conditions for these individual extraction factors for A. tegmentosum.
Unlike the experiments that use one factor at a time, the extraction time and the solvent-to-solid ratio were set outside the setting range for our CCD experiment. In this case, the extraction temperature might be lower than the optimum range due to physical constraints; the conditions should be adjusted accordingly by increasing the extraction temperature or the solvent-to-solid ratio.
Increasing the extraction temperature provides physical energy to isolate functional compounds from the raw materials. Moreover, the elevation of the solvent-to-solid ratio also increases the extraction yield of functional compounds by increasing their surface area. The results of our CCD indicate a rough optimal hydrothermal extraction area for A. tegmentosum. If functional materials are altered by metabolism, decomposition, and/or oxidation after extraction, the CCD may not fully explain the optimal extraction conditions. Sushanta et al. [24] also used a CCD to determine optimal coal ash extraction conditions by altering the extraction temperature, the extraction time, and the solvent-to-solid ratio. In this study, the CCD solvent was the main factor affecting the extraction outcome; the extraction time and temperature did not have a significant effect on the outcome. Therefore, a CCD is a good indicator not only for determining optimal extraction conditions but also for understanding the extraction conditions that significantly affect the outcome. As shown in previous studies, many functional compounds are present in the Acer genus, such as phenolic compounds, including flavonoids, salidroside, gallic acid, and catechin [25,26,27].
LC-Q-TOF-MS analysis revealed the presence of three catechin families (epicatechin, catechin-(4α->8)-epicatechin-3-O-gallate, and (-)-epicatechin-3-O-gallate). Catechins are plant-based flavonoid materials that contain various functional ingredients in green tea and cocoa [24]. Catechins have been reported to have insulin-sensitizing and blood-lipid-lowering effects and protect against cardiovascular disease [3]. Moreover, epicatechin series such as epicatechin, epigallocatechin, and epigallocatechin gallate [28,29,30] are sometimes lost by heating; therefore, it is necessary to find the optimal extraction conditions for edible plants to maximize their functional properties [31].
Salidroside is another major functional compound in A. tegmentosum. Salidroside has a glucoside of tyrosol, which is generally soluble in nonpolar solvents such as methanol and ethanol. Salidroside has anti-inflammatory and antioxidative effects; therefore, hydrothermal extraction may extract other antioxidative compounds and compensate for the role of salidroside [6,26].
Salidroside can reportedly be extracted from members of the Acer genus using nonpolar solvents; however, based on our results, salidroside was not detectable by hydrothermal extraction. These results indicate that the optimal hydrothermal extract of A. tegmentosum possesses antioxidant capacities and polar functional compounds [9]. The antioxidant activities of hydrothermally extracted A. tegmentosum were determined by MTT assay and the DCF-DA method in HepG2 cells. In the presence of A. tegmentosum, peroxide-inducible hepatic cell death was prevented in a dose-dependent manner. In addition, A. tegmentosum treatment significantly prevented H2O2-induced ROS production in human hepatoma cells.
A. tegmentosum has functional ingredients, including phenolic compounds such as isoprenoids and flavonoids, in addition to anti-inflammatory and/or antioxidative materials [21]. Therefore, the acquisition of maximal functional bioactive compounds is a highly important issue. In this study, we focused on the hydrothermal extraction of A. tegmentosum using RSM and in vitro experiments. When A. tegmentosum was extracted with ethanol and used to treat HepG2 cells alongside H2O2, the same experimental scheme showed similar hepatic cellular viability by MTT assay [32]. Regardless of the extraction solvent, >10 μg/mL of A. tegmentosum extract remarkably protected against H2O2-inducible cellular death. Moreover, cells were protected against H2O2-treatment-induced cellular ROS production in the presence of >10 μg/mL of A. tegmentosum ethanol [27] or hydrothermal extract (Figure 6B). In general, the ethanol extract had higher antioxidative activities than the hot water extract, including DPPH activity, ABTS activity, and TPC. Meanwhile, the hydrothermal and ethanol extracts [33] showed almost equal antioxidative potencies. However, in the future, we may scrutinize which individual functional compounds play an antioxidative role, particularly since salidroside is a detectable component in ethanol extract but hydrothermal extraction did not yield salidroside.

5. Conclusions

This study demonstrates the optimal conditions for extracting compounds with high antioxidant activities from A. tegmentosum. The extraction conditions were established using CCD, a tool used in RSM. The dependent variables (extraction temperature and time, solvent-to-solid ratio) were used to achieve optimal extraction. In addition, the TPC, DPPH activity, and salidroside content of the extracts were measured to confirm the optimal conditions. Consequently, the results of this study show that these three variables comprise a suitable setting for the hydrothermal extraction of compounds with high antioxidant activities. Moreover, the results of this study could be useful for the development and improvement of industrial extraction processes.

Author Contributions

Conceptualization, I.K. and Y.J.; methodology, I.K.; software, I.K.; validation, I.K.; formal analysis, I.K.; investigation, J.-H.H. and Y.J.; resources, Y.J.; data curation, J.-H.H.; writing—original draft preparation, I.K., J.-H.H., and Y.J.; writing—review and editing, I.K., J.-H.H., and Y.J.; visualization, I.K.; supervision, J.-H.H. and Y.J.; project administration, J.-H.H. and Y.J.; funding acquisition, Y.J. All authors have read and agreed to the published version of the manuscript.

Funding

This work was supported by the Agriculture, Food, and Rural Affairs Convergence Technologies Program for Educating Creative Global Leader (714001-07), Korea.

Institutional Review Board Statement

Not applicable.

Informed Consent Statement

Not applicable.

Data Availability Statement

Not applicable.

Conflicts of Interest

The authors declare no conflict of interest.

References

  1. Schieber, M.; Chandel, N.S. ROS Function in Redox Signaling and Oxidative Stress. Curr. Biol. 2014, 24, R453–R462. [Google Scholar] [CrossRef] [PubMed] [Green Version]
  2. Nita, M.; Grzybowski, A. The Role of the Reactive Oxygen Species and Oxidative Stress in the Pathomechanism of the Age-Related Ocular Diseases and Other Pathologies of the Anterior and Posterior Eye Segments in Adults. Oxidative Med. Cell. Longev. 2016, 2016, 1–23. [Google Scholar] [CrossRef] [PubMed] [Green Version]
  3. Gupta, R.K.; Patel, A.K.; Shah, N.; Choudhary, A.K.; Jha, U.K.; Yadav, U.C.; Gupta, P.K.; Pakuwal, U. Oxidative Stress and Antioxidants in Disease and Cancer: A Review. Asian Pac. J. Cancer Prev. 2014, 15, 4405–4409. [Google Scholar] [CrossRef] [PubMed] [Green Version]
  4. Xu, D.P.; Li, Y.; Meng, X.; Zhou, T.; Zhou, Y.; Zheng, J.; Zhang, J.J.; Li, H.B. Natural Antioxidants in Foods and Medicinal Plants: Extraction, Assessment and Resources. Int. J. Mol. Sci. 2017, 18, 96. [Google Scholar] [CrossRef] [PubMed]
  5. Belwal, T.; Dhyani, P.; Bhatt, I.D.; Rawal, R.S.; Pande, V. Optimization Extraction Conditions for Improving Phenolic Content and Antioxidant Activity in Berberis asiatica Fruits Using Response Surface Methodology (RSM). Food Chem. 2016, 207, 115–124. [Google Scholar] [CrossRef] [PubMed]
  6. Osorio-Tobón, J.F. Recent Advances and Comparisons of Conventional and Alternative Extraction Techniques of Phenolic Compounds. J. Food Sci. Technol. 2020, 57, 4299–4315. [Google Scholar]
  7. Azwanida, N. A Review on the Extraction Methods Use in Medicinal Plants, Principle, Strength and Limitation. Med. Aromat. Plants 2015, 4, 1–6. [Google Scholar]
  8. Hong, B.K.; Eom, S.H.; Lee, C.O.; Lee, J.W.; Jeong, J.H.; Kim, J.K.; Cho, D.H.; Yu, C.Y.; Kwon, Y.S.; Kim, M.J. Biological Activities and Bioactive Compounds in the Extract of Acer tegmentosum Maxim. Stem. Korean J. Med. Crop Sci. 2007, 15, 296–303. [Google Scholar]
  9. Rhim, T.J. Anticytotoxic and Radical Scavenging Activities of Acer tegmentosum Maxim Stem Extracts. J. Environ. Sci. Int. 2015, 24, 1315–1329. [Google Scholar] [CrossRef]
  10. Ha, H.; Shim, K.S.; Kim, T.; An, H.; Lee, C.J.; Lee, K.J.; Ma, J.Y. Water Extract of Acer tegmentosum Reduces Bone Destruction by Inhibiting Osteoclast Differentiation and Function. Molecules 2014, 19, 3940–3954. [Google Scholar] [CrossRef]
  11. Liu, Q.; Shin, E.J.; Ahn, M.J.; Hwang, B.Y.; Lee, M.K. Anti-Adipogenic Activity of Acer tegmentosum and Its Constituent, Catechin in 3T3-L1 Cells. Nat. Prod. Sci. 2011, 17, 212–215. [Google Scholar]
  12. Yu, T.; Lee, J.; Lee, Y.G.; Byeon, S.E.; Kim, M.H.; Sohn, E.-H.; Lee, Y.J.; Lee, S.G.; Cho, J.Y. In Vitro and In Vivo Anti-Inflammatory Effects of Ethanol Extract from Acer tegmentosum. J. Ethnopharmacol. 2010, 128, 139–147. [Google Scholar] [CrossRef] [PubMed]
  13. Park, K.M.; Yang, M.C.; Lee, K.H.; Kim, K.R.; Choi, S.U.; Lee, K.R. Cytotoxic Phenolic Constituents of Acer tegmentosum Maxim. Arch. Pharmacal Res. 2006, 29, 1086–1090. [Google Scholar] [CrossRef] [PubMed]
  14. Singleton, V.L.; Orthofer, R.; Lamuela-Raventós, R.M. Analysis of Total Phenols and Other Oxidation Substrates and Antioxidants by Means of Folin-Ciocalteu Reagent. Methods Enzymol. 1999, 299, 152–178. [Google Scholar]
  15. Molyneux, P. The Use of the Stable Free Radical Diphenylpicrylhydrazyl (DPPH) for Estimating Antioxidant Activity. Songklanakarin J. Sci. Technol. 2004, 26, 211–219. [Google Scholar]
  16. Zhishen, J.; Mengcheng, T.; Jianming, W. The Determination of Flavonoid Contents in Mulberry and Their Scavenging Effects on Superoxide Radicals. Food Chem. 1999, 64, 555–559. [Google Scholar] [CrossRef]
  17. Langley-Evans, S.C. Antioxidant Potential of Green and Black Tea Determined Using the Ferric Reducing Power (FRAP) Assay. Int. J. Food Sci. Nutr. 2000, 51, 181–188. [Google Scholar] [CrossRef]
  18. Re, R.; Pellegrini, N.; Proteggente, A.; Pannala, A.; Yang, M.; Rice-Evans, C. Antioxidant Activity Applying an Improved ABTS Radical Cation Decolorization Assay. Free Radic. Biol. Med. 1999, 26, 1231–1237. [Google Scholar] [CrossRef]
  19. Cao, G.; Alessio, H.M.; Cutler, R.G. Oxygen-Radical Absorbance Capacity Assay for Antioxidants. Free Radic. Biol. Med. 1993, 14, 303–311. [Google Scholar] [CrossRef] [Green Version]
  20. Katiki, L.M.; Ferreira, J.F.; Gonzalez, J.M.; Zajac, A.M.; Lindsay, D.S.; Chagas, A.C.S.; Amarante, A.F. Anthelmintic Effect of Plant Extracts Containing Condensed and Hydrolyzable Tannins on Caenorhabditis elegans, and Their Antioxidant Capacity. Vet. Parasitol. 2013, 192, 218–227. [Google Scholar] [CrossRef]
  21. Kong, K.W.; Mat-Junit, S.; Aminudin, N.; Ismail, A.; Abdul-Aziz, A. Antioxidant Activities and Polyphenolics from the Shoots of Barringtonia racemosa (L.) Spreng in a Polar to Apolar Medium System. Food Chem. 2012, 134, 324–332. [Google Scholar] [CrossRef] [Green Version]
  22. Kim, M.Y.; Choi, S.W.; Chung, S.K. Antioxidative Flavonoids from the Garlic (Allium sativum L.) Shoot. Food Sci. Biotechnol. 2000, 9, 199–203. [Google Scholar]
  23. Dai, J.; Mumper, R.J. Plant Phenolics: Extraction, Analysis and Their Antioxidant and Anticancer Properties. Molecules 2010, 15, 7313–7352. [Google Scholar] [CrossRef] [PubMed]
  24. Behera, S.K.; Meena, H.; Chakraborty, S.; Meikap, B. Application of Response Surface Methodology (RSM) for Optimization of Leaching Parameters for Ash Reduction from Low-Grade Coal. Int. J. Min. Sci. Technol. 2018, 28, 621–629. [Google Scholar] [CrossRef]
  25. Yoo, Y.M.; Nam, J.H.; Kim, M.Y.; Choi, J.; Lee, K.T.; Park, H.J. Analgesic and Anti-Gastropathic Effects of Salidroside Isolated from Heartwood. Open Bioact. Compd. J. 2009, 2, 1–7. [Google Scholar] [CrossRef] [Green Version]
  26. Rice-Evans, C.A.; Miller, N.J.; Paganga, G. Structure-Antioxidant Activity Relationships of Flavonoids and Phenolic Acids. Free Radic. Biol. Med. 1996, 20, 933–956. [Google Scholar] [CrossRef]
  27. Park, H.S.; Jo, E.; Han, J.H.; Jung, S.H.; Lee, D.H.; Park, I.; Heo, K.S.; Na, M.; Myung, C.S. Hepatoprotective Effects of an Acer tegmentosum Maxim Extract Through Antioxidant Activity and the Regulation of Autophagy. J. Ethnopharmacol. 2019, 239, 111912. [Google Scholar] [CrossRef]
  28. Lee, S.R.; Park, Y.J.; Han, Y.B.; Lee, J.C.; Lee, S.; Park, H.-J.; Lee, H.-J.; Kim, K.H. Isoamericanoic Acid B from Acer tegmentosum as a Potential Phytoestrogen. Nutrients 2018, 10, 1915. [Google Scholar] [CrossRef] [Green Version]
  29. Borges, G.; Ottaviani, J.I.; van der Hooft, J.J.; Schroeter, H.; Crozier, A. Absorption, Metabolism, Distribution and Excretion of (−)-Epicatechin: A Review of Recent Findings. Mol. Asp. Med. 2018, 61, 18–30. [Google Scholar] [CrossRef]
  30. Ganeshpurkar, A.; Saluja, A. The Pharmacological Potential of Catechin. Indian J. Biochem. Biophys. 2020, 57, 505–511. [Google Scholar]
  31. Henning, S.M.; Fajardo-Lira, C.; Lee, H.W.; Youssefian, A.A.; Go, V.L.; Heber, D. Catechin Content of 18 Teas and a Green Tea Extract Supplement Correlates with the Antioxidant Capacity. Nutr. Cancer 2003, 45, 226–235. [Google Scholar] [CrossRef] [PubMed]
  32. Eo, H.J.; Park, G.H.; Kim, D.S.; Kang, Y.; Park, Y. Antioxidant and Anticancer Activities of Leaves Extracts from Acer tegmentosum. Korean J. Plant Res. 2020, 33, 551–557. [Google Scholar]
  33. Lee, C.-E.; Jeong, H.-H.; Cho, J.-A.; Ly, S.Y. In Vitro and In Vivo Anti-Oxidative and Anti-Inflammatory Activities of Acer tegmentosum Maxim Extracts. J. Korean Soc. Food Sci. Nutr. 2017, 46, 1–9. [Google Scholar] [CrossRef]
Figure 1. Measurement of total polyphenolic contents by changing the extraction time, the extraction temperature, and the solvent-to-solid ratio during hydrothermal extraction of Acer tegmentosum. (A) Extraction temperature varied from 45–95 °C, and extraction time and solvent-to-solid ratio were fixed at 2 h and 80, respectively. (B) Extraction time varied from 0.5–8 h, and extraction temperature and solvent-to-solid ratio were fixed at 85 °C and 80, respectively. (C) Solvent-to-solid ratio varied from 10–320, and extraction temperature and extraction time were fixed at 85 °C and 2 h, respectively. Data are presented as the mean ± standard deviation (n = 3). Labeled averages without a common letter differ. p < 0.05.
Applsci 11 01134 g001
Figure 2. Measurement of the DPPH (2,2-diphenyl-1-pictylhydrazyl) activity by changing the extraction time, the extraction temperature, and the solvent-to-solid ratio for hydrothermal extraction of Acer tegmentosum. (A) Extraction temperature varied from 45–95 °C, and extraction time and solvent-to-solid ratio were fixed at 2 h and 80, respectively. (B) Extraction time varied from 0.5–8 h, and extraction temperature and solvent-to-solid ratio were fixed at 85 °C and 80, respectively. (C) Solvent-to-solid ratio varied from 10–320, and extraction temperature and extraction time were fixed at 85 °C and 2 h, respectively. Data are presented as the mean ± standard deviation (n = 3). Labeled averages without a common letter differ. p < 0.05.
Applsci 11 01134 g002
Figure 3. Response surface and contour plots exhibit the effect of hydrothermal extraction temperature, time, and solvent-to-solid ratio on the total phenolic contents (TPC) from Acer tegmentosum. (A/B) Effect of extraction temperature and extraction time on the TPC as (A) a 3D response surface graph and (B) a contour plot. (C/D) Effect of extraction temperature and solvent-to-solid ratio on the TPC as (C) a 3D response surface graph and (D) a contour plot. (E/F) Effect of extraction time and solvent-to-solid ratio on the TPC as (E) a 3D response surface graph and (F) a contour plot.
Applsci 11 01134 g003aApplsci 11 01134 g003b
Figure 4. Response surface and contour plots exhibit the effect of hydrothermal extraction temperature, time, and solvent-to-solid ratio on the DPPH activities of Acer tegmentosum. (A/B) Effect of extraction temperature and time on DPPH activities as (A) a 3D response surface graph and (B) a contour plot. (C/D) Effect of extraction temperature and solvent-to-solid ratio on DPPH activities as (C) a 3D response surface graph and (D) a contour plot. (E/F) Effect of extraction time and solvent-to-solid ratio on DPPH activities as (E) a 3D response surface graph and (F) a contour plot.
Applsci 11 01134 g004aApplsci 11 01134 g004bApplsci 11 01134 g004c
Figure 5. A representative chromatogram in a hydrothermal extract of A. tegmentosum by Q-TOF-MS.
Applsci 11 01134 g005
Figure 6. Cell viability and reactive oxygen species (ROS) production in HepG2 cells were measured by 3-(4, 5-dimethylthiazol-2-yl)-2, 5-diphenyl tetrazolium bromide (MTT) assay and the 2,7-dichlorofluorescin diacetate (DCF-DA) method. The results are expressed as a percentage of the control (as 100%), and each bar graph represents the mean ± standard deviation (n = 3). HepG2 cells were pretreated in the absence (sterile water for control) and presence of A. tegmentosum extract (0–40 μg/mL) for 1 h, and 1 mM H2O2 was added for 24 h. (A) Hepatic cellular viability was measured by MTT assay, and (B) ROS production was assessed in cultures by the DCF-DA method. Data are presented as the mean ± standard deviation (n = 3). Labeled averages without a common letter differ. p < 0.05.
Applsci 11 01134 g006
Table 1. Central composition design of hydrothermal extraction of Acer tegmentosum.
Independent VariablesUnitsSymbolCoded Levels
−α−101α
Extraction temperature°CX163.1870809096.82
Extraction timehX20.642467.36
Solvent-to-solid ratiomL/gX415.9150100150184.09
Table 2. Running conditions of mobile phases.
Time (min)Flow Rate (μL/min)MP 1 A [2% Acetic Acid in DW 2 (v/v)]MP B [0.1% Formic Acid in ACN 3]Comment
0–51000100%0%Isocratic flow
5–301000100–75%0–25%Gradient flow
30–40100075–30%25–70%Gradient flow
40–41100030–0%70–100%Gradient flow
41–5010000%100%Isocratic flow
50–5110000–100%100–0%Gradient flow
51–601000100%0%Isocratic flow
1 MP, mobile phase; 2 DW, distilled water; 3 ACN, acetonitrile.
Table 3. Analytical conditions of the liquid chromatography quadrupole time-of-flight mass spectrometry (LC-Q-TOF-MS) system.
Acquisition Parameter
Source typeElectrospray ionization
Ion polarityPositive
Capillary voltage3500 V
Nozzle voltage1000 V
Fragmentor400 V
Skimmer65 V
OCT 1 RF Vpp750 V
Collision energy0 V
Nebulizer pressure45 psi
Sheath gas temperature350 °C
Sheath gas flow11 L/min
Drying gas (N2) temperature225 °C
Drying gas (N2) flow rate15 L/min
Table 4. The effect of three independent variables for total polyphenol content (TPC) and DPPH activities.
Experiment No.Independent VariablesDependent Variables
Temperature (°C)Time (h)Solvent-to-Solid Ratio (mL/g)TPC (mg GAE 1/g)DPPH 2 (%)
170.002.0050.00153.6819.82
290.002.0050.00136.3220.20
370.002.00150.00149.5220.25
490.002.00150.00159.2620.37
570.006.0050.00172.1721.24
690.006.0050.00212.8824.80
770.006.00150.00199.6622.32
890.006.00150.00240.3625.06
963.184.00100.00136.2817.73
1096.824.00100.00168.3720.91
1180.004.0015.91165.9322.33
1280.004.00184.09180.9923.30
1380.000.64100.00130.8218.59
1480.007.36100.00233.4823.82
1580.004.00100.00199.2023.08
1680.004.00100.00198.5822.30
1780.004.00100.00179.5623.23
1880.004.00100.00198.3123.01
1980.004.00100.00198.8723.02
2080.004.00100.00197.6022.73
1 GAE: gallic acid equivalent; 2 DPPH: activity.
Table 5. Analysis of variance and coefficient estimation for a second-order model using the extract of Acer tegumentosum.
SourceSum of SquaresDFMean SquareF-Valuep-Value
P17544.6791949.4123.79<0.0001
X11195.2511195.2514.580.0034
X2718.951718.958.770.0142
X311653.01111653.01142.18<0.0001
X1 × X291.64191.641.120.3152
X1 × X3990.691990.6912.090.006
X2 × X3163.741163.7420.1879
X122454.6812454.6829.950.0003
X22448.251448.255.470.0414
X3290.49190.491.10.3181
Residual error819.581081.96
Lack of fit518.925103.781.730.2819
Pure error300.66560.13
Correlation total18364.2419
R2: 0.9554; adjusted R2: 0.9152; predicted R2: 0.7548; X1, extraction temperature; X2, extraction time; X3, solvent-to-solid ratio.
Table 6. Analysis of variance and coefficient estimation for the second-order model using A. tegumentosum extract.
SourceSum of SquaresDFMean SquareF-Valuep-Value
Model70.4797.8331.94<0.0001
X110.8110.844.03<0.0001
X20.942610.94263.840.0783
X334.04134.04138.85<0.0001
X1 × X20.145610.14560.59380.4588
X1 × X34.214.217.120.002
X2 × X30.068910.06890.28110.6075
X1217.63117.6371.9<0.0001
X220.245510.245510.3406
X322.7812.7811.340.0072
Residual error2.45100.2452
Lack of fit1.8950.37773.350.1053
Pure error0.563650.1127
Correlation total72.9319
R2: 0.9664; adjusted R2: 0.9361; predicted R2: 0.7925; X1, extraction temperature; X2, extraction time; X3, solvent-to-solid ratio.
Table 7. Total flavonoid content and antioxidant activity of A. tegmentosum extract.
Total Flavonoid Content (mg QE/g)FRAP 1
(μmol FeSO4/g) 4
TEAC 2
(μmol TE/g) 5
ORAC 3
(mmol TE/g)
Acer tegmentosum263.31 ± 3.542094.39 ± 43.4389.31 ± 0.323.80 ± 0.50
Ascorbic acid-18,750 ± 391.90162.769 ± 5.714.20 ± 0.46
1 FRAP: ferric reducing antioxidant power; 2 TEAC: Trolox equivalent antioxidant capacity; 3 ORAC: oxygen radical absorbance capacity; 4 μmol FeSO4/g: μmol iron sulfate equivalent per 1 g sample; 5 μmol TE/g: μmol Trolox equivalent antioxidant capacity per 1 g sample. Each value represents the mean ± standard deviation of 3 independent experiments.
Table 8. Analytical results of a hydrothermal extract of A. tegmentosum using HPLC-Q-TOF-MS.
No.RTFormulaScoreDiff (MFG, ppm)[M + H]+Name
17.01C10H10O399.93−0.01179.07027p-Methoxycinnamic acid
28.82C13H14O999.750315.0711Unknown
310.81C11H14O596.733.47227.09065Genipin
414.53C10H12O599.730.49213.07567Unknown
515.34C8H10O499.111.17171.06496Unknown
616.28C8H8O298.692.66137.05934Benzyl formate
717.85C9H10O399.341.63167.06997D-(+)-3-Phenyllactic acid
818.48C9H10O599.320.46199.06001Unknown
919.66C30H26O1296.832.01579.14845Procyanidin B
1019.94C20H20O1498.181.47485.092021, 6-digalloylglucose
1121.58C7H6O399.242.46139.03862Tyrosol
1222.87C11H16O499.091.89213.11171Dyhydrosinapyl alcohol
1323.40C13H20O599.76−0.31257.13848Unknown
1423.81C10H8O599.360.54209.04434Fraxetin
1524.77C15H14O698.611.31291.0859Epicatechin
1625.50C11H10O599.8−0.07223.06016-(2-Methoxyvinyl)benzo[1,3]dioxole-5-carboxylic acid
1725.94C37H30O1698.121731.15984Catechin-(4α->8)-epicatechin-3-O-gallate
1829.56C22H18O1099.370.91443.09687(-)-Epicatechin-3-O-gallate
Publisher’s Note: MDPI stays neutral with regard to jurisdictional claims in published maps and institutional affiliations.

