Article

Cerebrovascular Reactivity Assessment during Carbon Dioxide Inhalation Using SPECT

1
Department of Neurology, Gil Medical Center, Gachon University College of Medicine, Incheon 21565, Korea
2
Neuroscience Research Institute, Gachon University, Incheon 21565, Korea
3
Department of Radiological Science, College of Health Science, Gachon University, Incheon 21936, Korea
*
Author to whom correspondence should be addressed.
Appl. Sci. 2021, 11(3), 1161; https://doi.org/10.3390/app11031161
Submission received: 14 December 2020 / Revised: 21 January 2021 / Accepted: 22 January 2021 / Published: 27 January 2021

Abstract

:
Background: Perfusion single-photon emission computed tomography (SPECT) using an acetazolamide is an important clinical tool used to assess cerebrovascular reactivity (CVR) in patients, but its use has been limited to clinical diagnostics. This study aimed to preliminarily evaluate the feasibility of perfusion SPECT using carbon dioxide (CO2). Methods: Ten healthy subjects participated in two consecutive SPECT scans using CO2 inhalation. To evaluate brain perfusion after preprocessing, the voxel-by-voxel CVR values were averaged in 13 subgroup regions of interest (ROIs) based on a template. Subsequently, averaged CVR values of each ROI were analyzed based on both cerebellar hemispheres. Results: CVR values in the eight subgroup ROIs, which included vermis, both insula/cingulate, and frontal cortices, showed significant changes (p < 0.05). CVR values were higher in vermis and right insula/cingulate by 3.34% and 3.15%, respectively. Conclusions: This study showed that quantitative SPECT with CO2 inhalation could be used to evaluate the voxel-based CVR in healthy subjects, which could be beneficial for elucidating induced hypercapnic states and for longitudinally investigating the healthy aging in brain vessels. Furthermore, the cerebrovascular hemodynamic parameters induced by CO2 could play an important role as a biomarker to evaluate treatment progress in patients with cerebrovascular disease.

1. Introduction

Brain perfusion imaging using technetium 99m-labeled hexamethyl-propyleneamine-oxime (99mTc-HMPAO) single-photon emission computed tomography (SPECT) is used as a standard technique for evaluating and diagnosing cerebrovascular reactivity (CVR) in patients with cerebrovascular disease (CVD) [1,2]. The rapid circulation of 99mTc-HMPAO passes entirely through the blood–brain barrier (BBB) and is converted into hydrophilic compounds that rarely return to the bloodstream [1,3]. Since the distribution pattern shows perfusion upon administration, this phenomenon occurs within a few minutes of intravenous 99mTc-HMPAO administration and is retained in the brain for hours [3]. Therefore, the extra accumulated absorption of 99mTc-HMPAO into the brain tissue can be calculated by subtracting it in a subsequent SPECT image. These properties apply to any condition that causes brain perfusion within a short time, such as carbon dioxide (CO2) inhalation.
Acetazolamide (ACZ) challenge via 99mTc-HMPAO SPECT has been commonly used as a clinical tool to evaluate various CVDs and estimate CVR [4,5]. Despite the common clinical use of this test, ACZ injections can sometimes cause side effects in the human body. CO2, however, is a potent vasodilator of cerebral blood vessels that induces a hypercapnic state in the brain, and regional cerebral blood flow (rCBF) reactivity to CO2 is one of the representative parameters of CVR assessment when using brain perfusion imaging [6,7]. The challenge of CVR to CO2 has been investigated in various CVD patients and healthy subjects following CO2 inhalation, and rCBF has been shown to increase significantly through various methods when CO2 is inhaled [7,8]. Therefore, inhalation of air with an appropriate CO2 concentration during a 99mTc-HMPAO SPECT may be a more valuable and relatively low-cost clinical technique compared to ACZ injection.
Previously, many techniques for CVR have been developed to quantify changes in blood flow, especially in the middle cerebral artery (MCA), through vasodilatory challenges such as hypercapnia, apnea, or ACZ administration [8,9]. In the clinical setting, the use of transcranial Doppler (TCD), positron emission tomography (PET), and blood oxygen level-dependent (BOLD) functional magnetic resonance imaging (fMRI) have been applied to evaluate CVR in healthy volunteers and patients [9,10,11]. Among others, a BOLD fMRI performed with CO2 inhalation as a task condition could potentially create a hypercapnic state that could predict both normal and abnormal hemispherical CVR [12,13]. Furthermore, various stimuli for vasodilation have been used to induce CVR, and several technologies for CVR have been variously introduced with suitable solutions [7,14]. Recently, a study was performed to conduct an effective diagnosis using multimodal imaging technologies including computer CT, MRI, and SPECT [15].
In contrast, SPECT for CVR evaluation has been considered a potential tool for studying brain function in vivo to determine CVD progression by identifying the magnitude and extent of damage to cerebral vascular flow and for predicting outcomes [16,17]. The presence and the degree of vasodilation associated with CVR have been significant prognostic indicators in chronic CVD patients with respect to perfusion SPECT. Although it is important to assess CVR using SPECT for a precise diagnosis, there are unresolved methodological concerns, for example, the qualitative and subjective assessment of regional CVR, which is significantly dependent on the examiner [18].
The purpose of this study was to determine the possible use of consecutive 99mTc-HMPAO SPECT imaging with 5% CO2 inhalation to evaluate CVR in healthy subjects and to calculate the voxel-based CVR values based on the automated anatomical labeling (AAL) template. Furthermore, we aimed to demonstrate the effects of CO2 on a healthy human brain by performing a subgroup region of interest (ROI) analysis using an automated program developed for the quantitative evaluation of CVR.

2. Materials and Methods

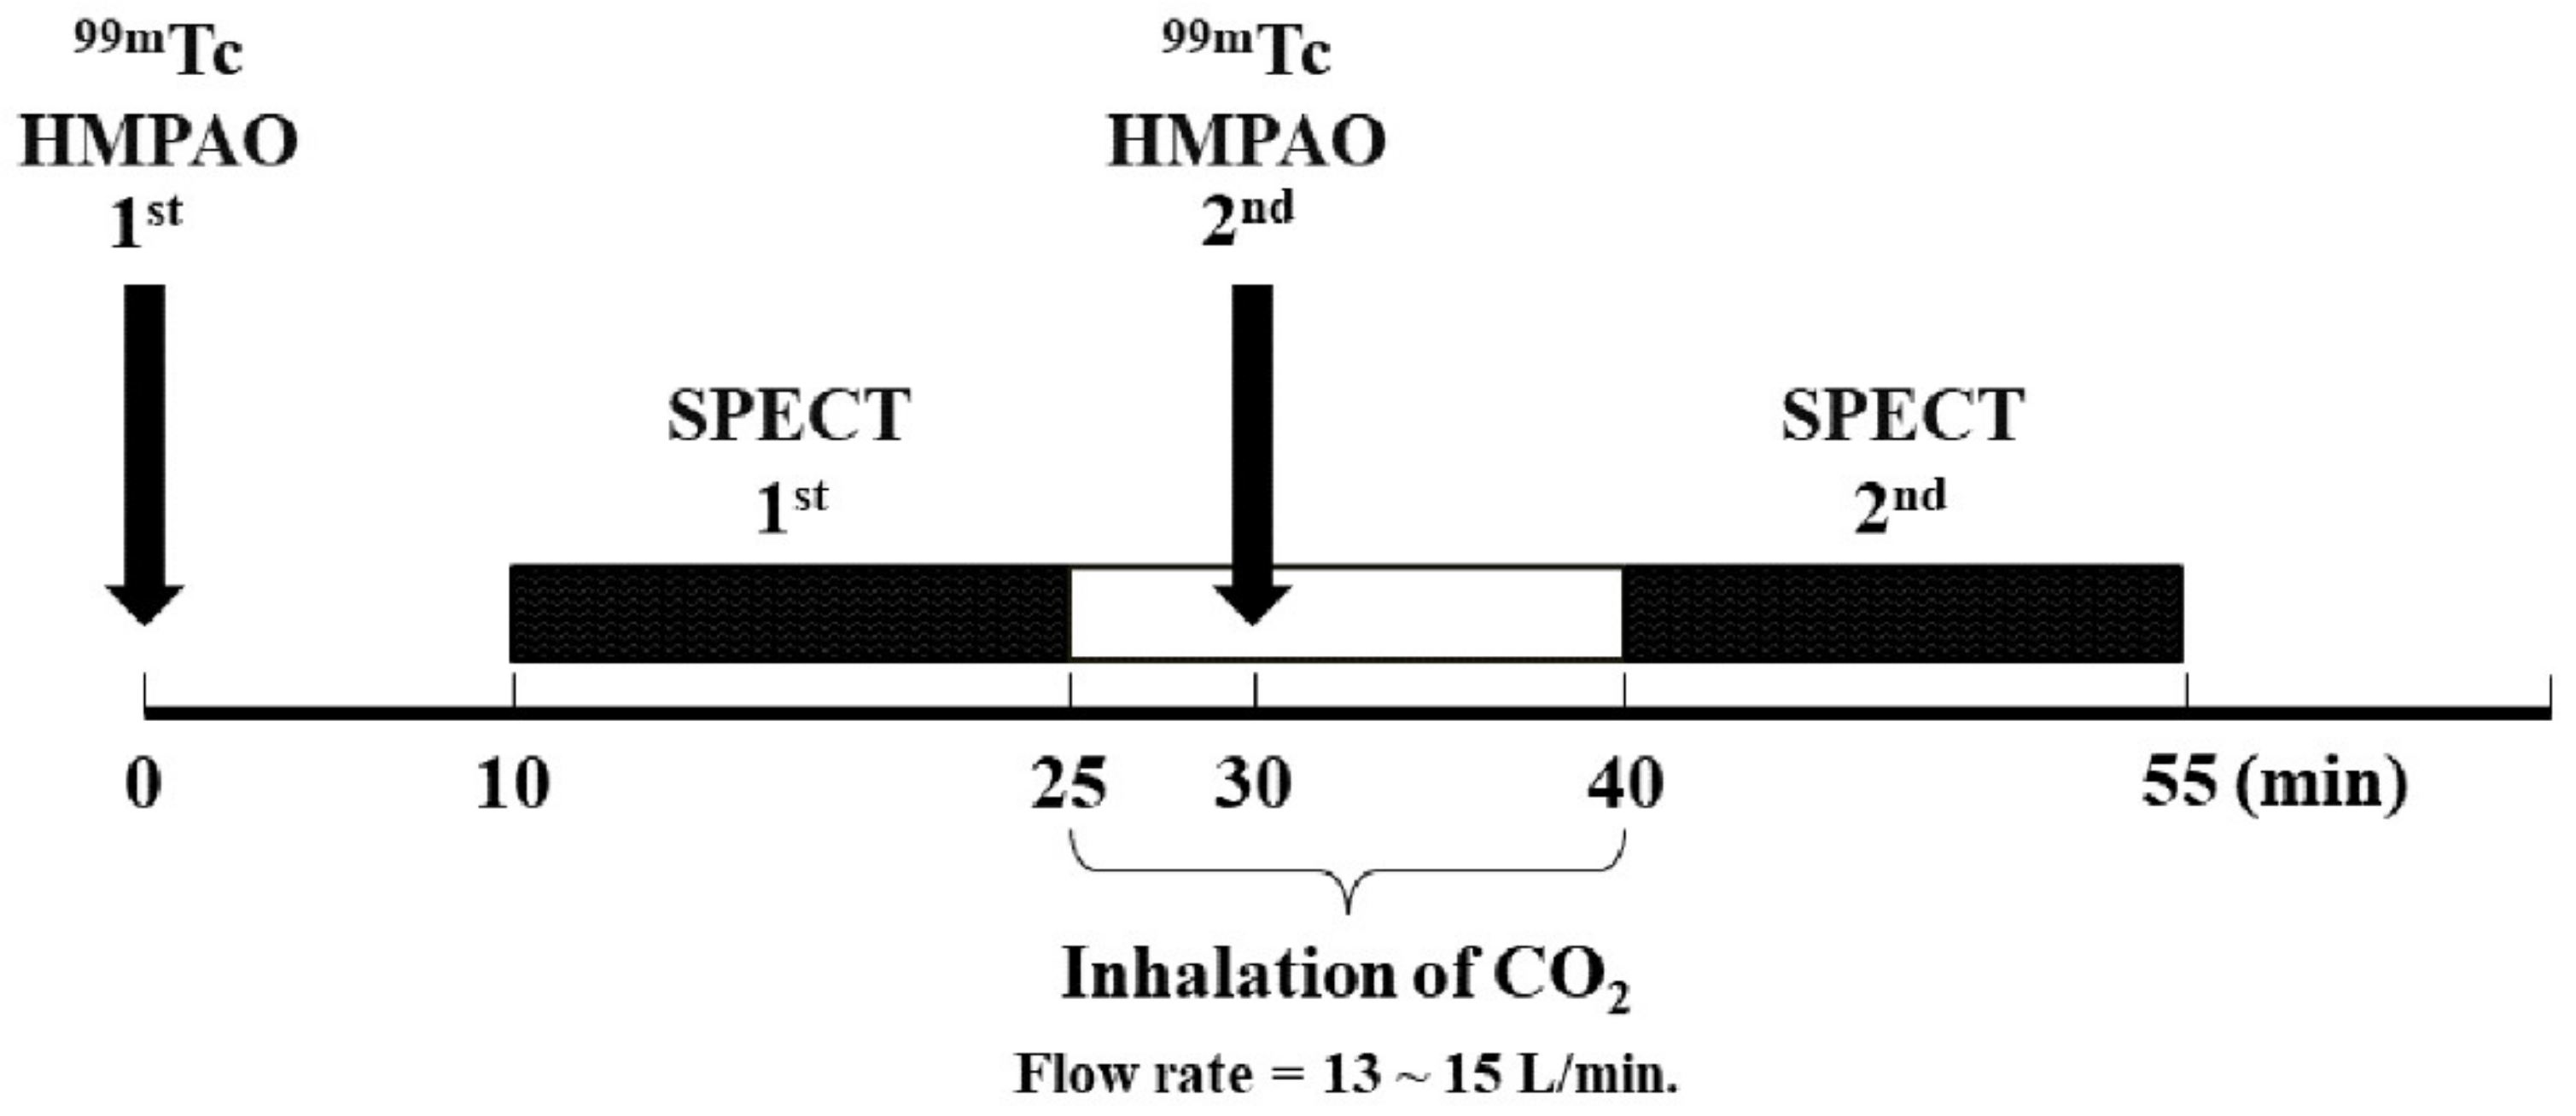
2.1. Subjects and SPECT Acquisition and Reconstruction

Ten healthy right-handed subjects (male:female = 7:3; age (mean ± standard deviation (SD)) = 23.8 ± 2.10 years) voluntarily participated in this study (see Table 1) after it was approved by the institutional review board (IRB) in Gil Medical Center, Gachon University College of Medicine (IRB number: GDIRB2018-308), and written informed consent was signed. None of the participants had any history of cerebrovascular, neurological, neuropsychiatric, or neuropsychological diseases that involved cognitive decline. The procedure was carried out in accordance with the approved guidelines.
A one-day protocol of two consecutive SPECT (1st and 2nd) images with the administration of 99mTc-HMPAO was conducted (Figure 1). Ten minutes after the first 20 mCi 99mTc-HMPAO injection, a 1st SPECT was performed for an imaging duration of 15 min. When the 1st SPECT was completed, a gas mixture containing about 5% CO2 was administered for 15 min through the subject’s nose at a flow rate of 13–15 L per minute, which was controlled by a gas regulator. The 2nd 40 mCi 99mTc-HMPAO for the 2nd SPECT was injected five minutes after the 1st SPECT was completed. Ten minutes after the 2nd 99mTc-HMPAO injection, the 2nd SPECT was performed for the same imaging duration as the 1st SPECT. SPECT imaging was performed using a dual-headed rotating gamma camera system (Symbia T16, Siemens Medical Solutions, Erlangen, Germany) equipped with a low-energy, high-resolution (LEHR) parallel-hole collimator. The projection data were collected with 32 views per camera head in a 128 × 128 matrix at 25 s per angle with a zoom factor of 1.45 in the step-and-shoot mode. This one-day protocol study took a total of about 55 min.
These SPECT images were reconstructed on a 128 × 128 matrix using Flash (Siemens) three-dimensional iterative reconstruction (eight iterations and four subsets) after Gaussian-filtering (full width at half maximum (FWHM) = 6.6 mm). After reconstruction of the trans-axial tomographic images parallel to the orbitomeatal line, attenuation correction using Chang’s method [19] was performed for each slice with a uniform attenuation coefficient of 0.11 cm, as shown in Figure 2.

2.2. SPECT CVR Processing

A quantitative analysis was performed using the attenuation corrected from the 1st and 2nd SPECT data with voxel-based calculations to generate a three-dimensional CVR map, which was performed using an automated processing pipeline comprising the following preprocessing steps: realignment, spatial normalization, decay correction (subtraction), count scaling, image intensity normalization, and spatial smoothing (Figure 2). In particular, the realignment, spatial normalization, and spatial smoothing steps were processed using algorithms in the Statistical Parametric Mapping (SPM) software package (Wellcome Trust Centre for Neuroimaging). In detail, first, since two images were acquired per day, image displacement may have occurred due to the movement of the subject’s head. To correct this, realignment was performed to estimate the rigid-body transformation of the 2nd SPECT image from the 1st SPECT image. Second, since all subjects had brains of different sizes, spatial normalization was performed to normalize the realigned SPECT image to the Montreal Neurological Institute (MNI) template space at 2 mm resolution. 99mTc-HMPAO was injected twice in total so that the first-injected 99mTc-HMPAO remained at the time of the second injection, causing a problem of reducing the sensitivity of the 2nd SPECT image. Third, therefore, the spatial-normalized image from the 1st SPECT image underwent radioactive decay signal correction (decay correction) to measure the amount of the 1st SPECT image signal. Then, the corrected image was obtained by subtracting the decay-corrected 1st SPECT image from the spatial-normalized 2nd SPECT image (subtraction) and correcting the signal intensity of the 2nd SPECT image due to residual radiation of the 1st SPECT. Fourth, count scaling was used to divide the signal intensity in each voxel in the spatial-normalized 2nd SPECT image by the ratio of radiation counts in each SPECT. Then, to solve the problem where 99mTc-HMPAO affects the increase or decrease in blood flow in the brain, the 1st and 2nd SPECT data were normalized to the average signal strength of the brain (image intensity normalization). Finally, the intensity-normalized SPECT data were smoothed with an isotropic three-dimensional Gaussian kernel of 8 mm in FWHM so that the error distribution of the given data was smoothed sufficiently for statistical inference (spatial smoothing).
The CVR value (%) was subsequently calculated from each voxel in each SPECT image as shown in Equation (1) and then estimated to generate a three-dimensional voxel-wise CVR map. The formula was described as follows:
CVR (%) = [(2nd − 1st)/1st] × 100
The positive CVR value could be derived from the site of normal perfusion pressure following the administration of a vasodilator such as CO2, whereas the negative CVR value could be derived from the site where blood flow decreased. The AAL template consisted of 116 ROIs covering cortical and subcortical structures of the entire brain (54 symmetrical ROIs for each hemisphere including the frontal, temporal, parietal, and occipital cortices; the insula; striatum; thalamus; cerebellum; and 8 vermis ROIs in the medial plane). This template has been recently used for SPECT analysis studies [20,21]. We reconstructed a voxel-based CVR map from the voxel-wise CVR map (Figure 3) to average the CVR values in all voxels in each ROI. Furthermore, 13 subgroup CVR ROIs (ROI #01: left temporal cortex; ROI #02: right temporal cortex; ROI #03: vermis, medial; ROI #04: left insula/cingulate; ROI #05: right insula/cingulate; ROI #06: left frontal cortex; ROI #07: right frontal cortex; ROI #08: left occipital cortex; ROI #09: right occipital cortex; ROI #10: left parietal cortex; ROI #11: right parietal cortex; ROI #12: left central cortex; and ROI #13: right central cortex) were obtained with the voxel averages for all subjects (Figure 4 and Table 2). The mean CVR value in the cerebellum was then calculated to obtain relative CVR values in the 13 subgroup ROIs.

2.3. Statistical Analysis

We performed statistical analyses using a statistical analysis package (IBM SPSS, version 25). The assumption of normality was tested using the Shapiro–Wilk test. The non-parametric Wilcoxon signed-rank test was used to test any difference in systolic and diastolic blood pressure, mean arterial pressure (MAP), and heart rate (HR) between pre- and post-scan measurements. To test the differences in all subgroup ROIs on a test value derived from the CVR values in the cerebellum region, a one-sample Wilcoxon signed-rank test was performed. A p-value of 0.05 was considered significant for the statistical analysis.

3. Results

The demographics and experimental results for all subjects are shown in Table 1. The MAP of all subjects ranged from 65–99.33 mmHg at pre-scan and 70–105.33 mmHg at post-scan. The MAP differed significantly from pre-scan to post-scan (p = 0.011), probably due to the hypercapnic stimulation via CO2 inhalation; however, the HR did not (p = 0.092). The maximum ratio of radiation counts was 3.69 and the minimum was 2.93 (Table 1). The mean (SD) end-tidal CO2 (Et-CO2) values were 26.96 (2.56) mmHg and 43.63 (2.48) mmHg before and during CO2 inhalation (N = 7), respectively.
The pre-processed first and second SPECT images of a representative subject are shown in Figure 3. In the second image, there was an increase in signal intensity in the frontal, temporal, and occipital cortices and the cerebellum compared to the first image. However, there were no specific values demonstrating increases in target ROIs between the first and second images. As shown in Figure 3c, there was a quantitative difference between the two SPECT images in a total of 116 ROIs on the voxel-based CVR map. The mean CVR value in the cerebellum was −2.28%, which was used for the relative CVR values in subgroup ROIs.
As shown in Table 2 and Figure 4, the CVR values in the following eight subgroup ROIs were significant: ROI #02 (right temporal cortex), ROI #03 (vermis, medial), ROI #04 (left insula/cingulate), ROI #05 (right insula/cingulate), ROI #06 (left frontal cortex), ROI #07 (right frontal cortex), ROI #10 (left parietal cortex), and ROI #12 (left central cortex) (p < 0.05). Specifically, the high relative mean CVR values were 3.337% in ROI #03 (vermis) and 3.148% in ROI #05 (right insula/cingulate). The low relative CVR values were 0.586% in ROI #08 (left occipital cortex) and 0.597% in ROI #09 (right occipital cortex), but they were not statistically significant.

4. Discussion

In this study, we assessed the feasibility of measuring CVR using a 99mTc-HMPAO SPECT with 5% CO2 inhalation in healthy subjects. Unlike previous studies, our voxel-wise CVR map was constructed based on an AAL brain template with 116 ROIs [20,22]. An automated processing program quantitatively measured the mean CVR value of voxels in each subgroup ROI to elucidate the effect of the hypercapnic state on a healthy human brain. We found that this quantitative CVR analysis of the subgroup ROIs could be used as an exploratory approach to assess vascular reactivity in healthy subjects [23,24].
The findings demonstrated that CO2 perfusion SPECT could provide evidence for the relationship between the reactive effect of CO2 and CBF in specific vascular territories. Using the CVR maps obtained from all the subjects, the relative CVR values in eight subgroup ROIs, including the right temporal cortex, vermis, left and right insula/cingulate, left and right frontal cortex, and left parietal and central cortex, showed significant changes (p < 0.05) relative to the CVR value in the cerebellum. The results showed high relative mean CVR values in the right and left insula/cingulate cortex (ROI #04 and #05, respectively) and in the cortical areas other than the vermis (ROI #03), and low relative mean CVR values in the right and left occipital cortex (ROI #08 and #09, respectively). According to previous studies, an increase in CO2 concentration in inspired air is known to cause vascular changes in the brain, including increased CBF and higher CO2 and O2 concentrations in the blood [25]. In the present study, the insula/cingulate cortex (anterior vascular territory), which receives blood through the anterior cerebral artery (ACA), and the occipital cortex (posterior vascular territory), which receives blood through the posterior cerebral artery (PCA), did not show significant changes like the cerebellum. This suggests that CO2 has various effects on vascular territories, which has been shown in several studies in which major cerebral arteries, such as the MCA, PCA, and ACA, undergo some changes after CO2 is applied in patients and healthy subjects [26,27].
In contrast to previous studies investigating the feasibility of CVR measurements using CO2 on patients, few studies using SPECT and CO2 inhalation have been conducted on healthy subjects [8,28]. CO2 has fewer side effects than ACZ, is more likely to cause blood flow changes, which allows researchers to evaluate CVR on healthy subjects as well as patients, and is commonly used in BOLD fMRI studies [12,13]. Furthermore, although SPECT is a standard tool for perfusion imaging in the clinical diagnosis of patients, it is not sufficiently used for quantitative evaluation and objective diagnosis. Therefore, the proposed quantitative CVR mapping technique in this study could provide the basis for the development of objective and clinical diagnostic methods in future SPECT CVR studies and for a direct comparison between SPECT and fMRI CVR measurements. Furthermore, this technique can be used as a medical check-up tool by analyzing the degree of change through follow-up tests which primarily prevent cerebrovascular disease, and it can be used to predict the penumbra area of patients with acute cerebral infarction, and to determine the degree of autoregulation damage or recovery of cerebral vessels [29]. Lastly, it can help determine the proper timing of vascular bypass operation for moyamoya disease, a rare cerebrovascular disease, without any vasodilation drug [30].
However, this study has some limitations. First, only a small number of young, healthy volunteers were included. Moreover, gender inequality with small groups can make it difficult to draw definitive conclusions. Further studies should examine optimal CO2 concentrations for providing reliable and reproducible CVR values [31]. Additionally, issues involved with the evaluation of therapeutic effects, follow-up assessments of patients, and/or vascular aging assessments using CVR measurements in healthy subjects via SPECT should be managed in future studies [32]. Nevertheless, follow-up assessments can be repetitively conducted with SPECT and CO2 for the different vascular reactivity in several diseases such as vascular dementia or Alzheimer’s dementia. Additionally, vascular reactivity according to the prevalence of hypertension, hyperlipidemia, and diabetes can be investigated and research on the auto-regulatory ability of blood vessels in the area of cerebral infarction in patients with acute cerebral infarction can be conducted [33]. Further studies can confirm the association between ageing and changes in vascular capacity [34].

5. Conclusions

In conclusion, two consecutive 99mTc-HMPAO SPECTs with 5% CO2 inhalation is a simple and feasible method for assessing CO2 reactivity as a substitute for ACZ, especially in healthy subjects and for clinical research purposes. The proposed quantitative CVR mapping technique for cerebral perfusion reserve may be an important basis for the development of objective and supplementary diagnostic methods for basic and clinical research. Importantly, this findings of this study regarding CO2 could provide the basis for the easy use of CO2 in perfusion studies on cerebrovascular ageing or various cerebral diseases on healthy people in the future. Although CVR research is actively underway in MRI, it is still limited in use as a clinical device for diagnosis. However, SPECT is used as a clinical device for diagnosis of cerebrovascular diseases, but the use of vasodilators is essential. Therefore, the purpose of this study was to find a way to complement the essential use of these contrast agents and maximize the effect of using SPECT.

Author Contributions

Conceptualization, C.-K.K. and Y.-B.L.; methodology, C.-K.K.; software, C.-K.K.; validation, C.-K.K. and Y.-B.L.; formal analysis, C.-K.K.; investigation, C.-K.K.; resources, C.-K.K.; data curation, C.-K.K.; writing—original draft preparation, writing—review and editing, visualization, supervision, project administration, and funding acquisition, C.-K.K. and Y.-B.L. All authors have read and agreed to the published version of the manuscript.

Funding

This work was supported by a grant of the Korea Health Technology R&D Project through the Korea Health Industry Development Institute (KHIDI) funded by the Ministry of Health & Welfare, Republic of Korea (No. HI17C0557) and the Bio & Medical Technology Development Program of the National Research Foundation (NRF) grant (2020M3A9E4104384).

Institutional Review Board Statement

The study was conducted according to the guidelines of the Declaration of Helsinki, and approved by the institutional review board (IRB) in Gil Medical Center, Gachon University College of Medicine (IRB number: GDIRB2018-308).

Informed Consent Statement

Informed consent was obtained from all subjects involved in the study.

Data Availability Statement

The data presented in this study are openly available in FigShare [dx.doi.org/10.6084/m9.figshare.13643324].

Acknowledgments

The authors thank all participants, especially the support staffs (M.G. Song and C.A. Park) in Gachon University.

Conflicts of Interest

The authors declare no conflict of interest.

References

  1. Neirinckx, R.; Canning, L.; Piper, I.; Nowotnik, D.; Pickett, R.; Holmes, R.; Volkert, W.; Forster, A.; Weisner, P.; Marriott, J. Technetium-99m d,l-HM-PAO: A New Radiopharmaceutical for SPECT Imaging of Regional Cerebral Blood Perfusion. J. Nucl. Med. Off. Publ. Soc. Nucl. Med. 1987, 28, 191–202. [Google Scholar]
  2. Anderson, A.R. 99mTc-D,L-Hexamethylene-Propyleneamine Oxime (99mTc-HMPAO): Basic Kinetic Studies of a Tracer of Cerebral Blood Flow. Cerebrovasc. Brain Metab. Rev. 1989, 1, 288–318. [Google Scholar]
  3. Abdel-Dayem, H.M.; Sadek, S.A.; Sayed, M.E.; Higazi, E. Technetium-99m HM-PAO Images (Planar and SPECT) of the Human Brain. Clin. Nucl. Med. 1988, 13, 139–143. [Google Scholar] [CrossRef]
  4. Burbridge, M.A.; Jaffe, R.A. Paradoxical Critical Hyperkalemia After Acetazolamide for Cerebrovascular Reactivity Study: A Case Report. A A Pract. 2019, 14, 69–71. [Google Scholar] [CrossRef] [PubMed]
  5. Vagal, A.S.; Leach, J.L.; Fernandez-Ulloa, M.; Zuccarello, M. The Acetazolamide Challenge: Techniques and Applications in the Evaluation of Chronic Cerebral Ischemia. Am. J. Neuroradiol. 2009, 30, 876–884. [Google Scholar] [CrossRef] [PubMed]
  6. Li, J.; Zhang, G.; Holtby, H.; Bissonnette, B.; Wang, G.; Redington, A.N.; Van Arsdell, G.S. Carbon Dioxide—A Complex Gas in a Complex Circulation: Its Effects on Systemic Hemodynamics and Oxygen Transport, Cerebral, and Splanchnic Circulation in Neonates after the Norwood Procedure. J. Thorac. Cardiovasc. Surg. 2008, 136, 1207–1214. [Google Scholar] [CrossRef] [Green Version]
  7. Juttukonda, M.R.; Donahue, M.J. Neuroimaging of Vascular Reserve in Patients with Cerebrovascular Diseases. NeuroImage 2019, 187, 192–208. [Google Scholar] [CrossRef] [PubMed]
  8. Oku, N.; Matsumoto, M.; Hashikawa, K.; Moriwaki, H.; Okazaki, Y.; Seike, Y.; Handa, N.; Uehara, T.; Kamada, T.; Nishimura, T. Carbon Dioxide Reactivity by Consecutive Technetium-99m-HMPAO SPECT in Patients with a Chronically Obstructed Major Cerebral Artery. J. Nucl. Med. Off. Publ. Soc. Nucl. Med. 1994, 35, 32–40. [Google Scholar]
  9. Acker, G.; Lange, C.; Schatka, I.; Pfeifer, A.; Czabanka, M.A.; Vajkoczy, P.; Buchert, R. Brain Perfusion Imaging Under Acetazolamide Challenge for Detection of Impaired Cerebrovascular Reserve Capacity: Positive Findings with 15 O-Water PET in Patients with Negative 99mTc-HMPAO SPECT Findings. J. Nucl. Med. 2018, 59, 294–298. [Google Scholar] [CrossRef] [PubMed] [Green Version]
  10. McDonnell, M.N.; Berry, N.M.; Cutting, M.A.; Keage, H.A.; Buckley, J.D.; Howe, P.R.C. Transcranial Doppler Ultrasound to Assess Cerebrovascular Reactivity: Reliability, Reproducibility and Effect of Posture. PeerJ 2013, 1, e65. [Google Scholar] [CrossRef]
  11. Sobczyk, O.; Crawley, A.P.; Poublanc, J.; Sam, K.; Mandell, D.M.; Mikulis, D.J.; Duffin, J.; Fisher, J.A. Identifying Significant Changes in Cerebrovascular Reactivity to Carbon Dioxide. Am. J. Neuroradiol. 2016, 37, 818–824. [Google Scholar] [CrossRef] [Green Version]
  12. Liu, P.; De Vis, J.B.; Lu, H. Cerebrovascular Reactivity (CVR) MRI with CO2 Challenge: A Technical Review. NeuroImage 2019, 187, 104–115. [Google Scholar] [CrossRef]
  13. Hou, X.; Liu, P.; Li, Y.; Jiang, D.; De Vis, J.B.; Lin, Z.; Sur, S.; Baker, Z.; Mao, D.; Ravi, H.; et al. The Association between BOLD-Based Cerebrovascular Reactivity (CVR) and End-Tidal CO2 in Healthy Subjects. NeuroImage 2020, 207, 116365. [Google Scholar] [CrossRef]
  14. Chan, S.; Evans, K.C.; Song, T.; Selb, J.; van der Kouwe, A.; Rosen, B.R.; Zheng, Y.; Ahn, A.; Kwong, K.K. Cerebrovascular Reactivity Assessment with O2-CO2 Exchange Ratio under Brief Breath Hold Challenge. PLoS ONE 2020, 15, e0225915. [Google Scholar] [CrossRef] [Green Version]
  15. Xiao, Z. Measurement of Cerebrovascular Reserve by Multimodal Imaging for Cerebral Arterial Occlusion or Stenosis Patients: Protocol of a Prospective, Randomized, Controlled Clinical Study. Trials 2020, 21, 49. [Google Scholar] [CrossRef] [PubMed]
  16. Mountz, J.M.; Liu, H.-G.; Deutsch, G. Neuroimaging in Cerebrovascular Disorders: Measurement of Cerebral Physiology after Stroke and Assessment of Stroke Recovery. Semin. Nucl. Med. 2003, 33, 56–76. [Google Scholar] [CrossRef] [PubMed]
  17. Wong, T.H.; Shagera, Q.A.; Ryoo, H.G.; Ha, S.; Lee, D.S. Basal and Acetazolamide Brain Perfusion SPECT in Internal Carotid Artery Stenosis. Nucl. Med. Mol. Imaging 2020, 54, 9–27. [Google Scholar] [CrossRef] [PubMed]
  18. Choi, H.; Yoo, M.Y.; Cheon, G.J.; Kang, K.W.; Chung, J.-K.; Lee, D.S. Parametric Cerebrovascular Reserve Images Using Acetazolamide 99mTc-HMPAO SPECT: A Feasibility Study of Quantitative Assessment. Nucl. Med. Mol. Imaging 2013, 47, 188–195. [Google Scholar] [CrossRef] [PubMed] [Green Version]
  19. Chang, L.-T. A Method for Attenuation Correction in Radionuclide Computed Tomography. IEEE Trans. Nucl. Sci. 1978, 25, 638–643. [Google Scholar] [CrossRef]
  20. Takeuchi, R.; Yonekura, Y.; Matsuda, H.; Konishi, J. Usefulness of a Three-Dimensional Stereotaxic ROI Template on Anatomically Standardised 99mTc-ECD SPET. Eur. J. Nucl. Med. Mol. Imaging 2002, 29, 331–341. [Google Scholar] [CrossRef]
  21. Imabayashi, E.; Soma, T.; Sone, D.; Tsukamoto, T.; Kimura, Y.; Sato, N.; Murata, M.; Matsuda, H. Validation of the Cingulate Island Sign with Optimized Ratios for Discriminating Dementia with Lewy Bodies from Alzheimer’s Disease Using Brain Perfusion SPECT. Ann. Nucl. Med. 2017, 31, 536–543. [Google Scholar] [CrossRef]
  22. Kunieda, T.; Miyake, K.; Sakamoto, H.; Iwasaki, Y.; Iida, S.; Morise, S.; Fujita, K.; Nakamura, M.; Kaneko, S.; Kusaka, H. Leptomeningeal Collaterals Strongly Correlate with Reduced Cerebrovascular Reactivity Measured by Acetazolamide-Challenged Single-Photon Emission Computed Tomography Using a Stereotactic Extraction Estimation Analysis in Patients with Unilateral Internal Carotid Artery Stenosis. Intern. Med. 2017, 56, 2857–2863. [Google Scholar] [CrossRef] [PubMed] [Green Version]
  23. Golestani, A.M.; Wei, L.L.; Chen, J.J. Quantitative Mapping of Cerebrovascular Reactivity Using Resting-State BOLD FMRI: Validation in Healthy Adults. NeuroImage 2016, 138, 147–163. [Google Scholar] [CrossRef] [PubMed] [Green Version]
  24. Ito, H.; Kanno, I.; Ibaraki, M.; Hatazawa, J.; Miura, S. Changes in Human Cerebral Blood Flow and Cerebral Blood Volume during Hypercapnia and Hypocapnia Measured by Positron Emission Tomography. J. Cereb. Blood Flow Metab. 2003, 23, 665–670. [Google Scholar] [CrossRef] [PubMed] [Green Version]
  25. Ainslie, P.N.; Duffin, J. Integration of Cerebrovascular CO2 Reactivity and Chemoreflex Control of Breathing: Mechanisms of Regulation, Measurement, and Interpretation. Am. J. Physiol.-Regul. Integr. Comp. Physiol. 2009, 296, R1473–R1495. [Google Scholar] [CrossRef] [PubMed] [Green Version]
  26. Battisti-Charbonney, A.; Fisher, J.; Duffin, J. The Cerebrovascular Response to Carbon Dioxide in Humans: Cerebrovascular Response to CO2. J. Physiol. 2011, 589, 3039–3048. [Google Scholar] [CrossRef]
  27. Bisschops, R.H.C.; Klijn, C.J.M.; Kappelle, L.J.; van Huffelen, A.C.; van der Grond, J. Association Between Impaired Carbon Dioxide Reactivity and Ischemic Lesions in Arterial Border Zone Territories in Patients with Unilateral Internal Carotid Artery Occlusion. Arch. Neurol. 2003, 60, 229. [Google Scholar] [CrossRef] [Green Version]
  28. Chen, D.-W.; Zheng, J.; Shi, J.; Yin, Y.; Song, C.; Yang, F.; Zhang, Y.-Q.; Ma, L.-N. Assessment of the Cerebral Hemodynamic Benefits of Carotid Artery Stenting for Patients with Preoperative Hemodynamic Impairment Using Cerebral Single Photon Emission Computed Tomography (SPECT) and Carbon Dioxide Inhalation. Med. Sci. Monit. 2018, 24, 5398–5404. [Google Scholar] [CrossRef]
  29. Wilson, L.C.; Cotter, J.D.; Fan, J.-L.; Lucas, R.A.I.; Thomas, K.N.; Ainslie, P.N. Cerebrovascular Reactivity and Dynamic Autoregulation in Tetraplegia. Am. J. Physiol.-Regul. Integr. Comp. Physiol. 2010, 298, R1035–R1042. [Google Scholar] [CrossRef]
  30. Yun, T.J.; Paeng, J.C.; Sohn, C.-H.; Kim, J.E.; Kang, H.-S.; Yoon, B.-W.; Choi, S.H.; Kim, J.; Lee, H.-Y.; Han, M.H.; et al. Monitoring Cerebrovascular Reactivity through the Use of Arterial Spin Labeling in Patients with Moyamoya Disease. Radiology 2016, 278, 205–213. [Google Scholar] [CrossRef]
  31. Xia, Y.; Shikii, S.; Shimomura, Y. Determining How Different Levels of Indoor Carbon Dioxide Affect Human Monotonous Task Performance and Their Effects on Human Activation States Using a Lab Experiment: A Tracking Task. Ergonomics 2020, 63, 1350–1358. [Google Scholar] [CrossRef] [PubMed]
  32. Swartz, J.R.; Lesser, I.M.; Boone, K.B.; Miller, B.L.; Mena, I. Cerebral Blood Flow Changes in Normal Aging: Spect Measurements. Int. J. Geriatr. Psychiatry 1995, 10, 437–446. [Google Scholar] [CrossRef]
  33. Stefanidis, K.B.; Askew, C.D.; Klein, T.; Lagopoulos, J.; Summers, M.J. Healthy Aging Affects Cerebrovascular Reactivity and Pressure-Flow Responses, but Not Neurovascular Coupling: A Cross-Sectional Study. PLoS ONE 2019, 14, e0217082. [Google Scholar] [CrossRef] [PubMed] [Green Version]
  34. Miller, K.B.; Howery, A.J.; Rivera-Rivera, L.A.; Johnson, S.C.; Rowley, H.A.; Wieben, O.; Barnes, J.N. Age-Related Reductions in Cerebrovascular Reactivity Using 4D Flow MRI. Front. Aging Neurosci. 2019, 11, 281. [Google Scholar] [CrossRef] [PubMed] [Green Version]
Figure 1. The acquisition protocol for the same day (one-day) consecutive first (20 mCi) and second (40 mCi) technetium 99m-labeled hexamethyl-propyleneamine-oxime (99mTc-HMPAO) single-photon emission computed tomography (SPECT) imaging. A gas mixture including about 5% CO2 gas was administered through each subject’s nose. The flow rate, controlled by a gas regulator, was 13–15 L per minute during approximately 15 min. Each scan time was 15 min (25 s × 32 steps, step-and-shoot mode) for each first and second SPECT.
Applsci 11 01161 g001
Figure 2. Diagram representing SPECT cerebrovascular reactivity (CVR) processing using the first and second SPECT data.
Applsci 11 01161 g002
Figure 3. Standardized display supporting the assessment of the SPECT images obtained, including (a) first, (b) second, and (c) voxel-based CVR Map of a representative subject. The colored bars indicate the signal intensity in both (a) and (b), and the CVR (%) value in (c), respectively. Abbreviations: L, left; R, right.
Applsci 11 01161 g003
Figure 4. Graph of relative mean voxel-based CVR across 10 subjects in each of the 13 subgroup regions of interest (ROIs) according to a mean reference CVR value. ROI #01: left temporal cortex; ROI #02: right temporal cortex; ROI #03: vermis, medial; ROI #04: left insula/cingulate; ROI #05: right insula/cingulate; ROI #06: left frontal cortex; ROI #07: right frontal cortex; ROI #08: left occipital cortex; ROI #09: right occipital cortex; ROI #10: left parietal cortex; ROI #11: right parietal cortex; ROI #12: left central cortex; and ROI #13: right central cortex (see Table 2). Abbreviations: L, left; R, right; A, anterior; P, posterior; * indicates statistically significance (p < 0.05).
Applsci 11 01161 g004
Table 1. Demographic information (N = 10).
NumberSexAgePre-ScanPost-ScanCount
SBPDBPMAPHRSBPDBPMAPHR1st Scan2nd ScanRatio
#01M251165978871259510584359310,5992.95
#02M231166582601316788.3367385411,2872.93
#03F22995670.3365114668271522315,4402.96
#04M231196079.67601226785.3356355512,2723.45
#05M251348299.337013690105.3377354310,4532.95
#06M261436993.6761153669562339010,2793.03
#07M271237389.67631227590.6762422212,9633.07
#08F2191526551986072.6761348612,8763.69
#09F21946071.337096577075444113,6963.08
#10M251236785.6765130769466433513,3273.07
Mean ± SD23.80 ± 2.10115.80 ± 16.8664.30 ± 8.8581.47 ± 10.8965.20 ± 9.43122.70 ± 17.07 *71.90 ± 12.3 *88.83 ± 11.92 *68.10 ± 8.603964.20 ± 583.9612,319.20 ± 1668.233.12 ± 0.25
Abbreviations: SBP, systolic blood pressure; DBP, diastolic blood pressure; MAP, mean arterial pressure; HR, heart rate; SD, standard deviation. * p < 0.05 and it was analyzed with non-parametric Wilcoxon signed-rank test.
Table 2. The relative mean voxel-based CVR values and statistical p-values for non-parametric one-sample Wilcoxon t-test with a mean reference CVR value of −2.28% in 13 subgroup ROIs.
ROI NumberRegion NameHemisphere# of ROIsRelative Mean Voxel Based CVR Value (%)p-Value
ROI #01TemporalL100.7560.285
ROI #02TemporalR101.8490.047 *
ROI #03VermisM83.3370.007 *
ROI #04Insula, CingulateL42.7450.005 *
ROI #05Insula, CingulateR43.1480.007 *
ROI #06FrontalL151.8620.005 *
ROI #07FrontalR152.1270.007 *
ROI #08OccipitalL60.5860.508
ROI #09OccipitalR60.5970.285
ROI #10ParietalL62.2740.017 *
ROI #11ParietalR61.2310.059
ROI #12CentralL42.5150.007 *
ROI #13CentralR41.4630.285
Abbreviations: L, left; R, right; M, medial; ROI, region of interest. * p < 0.05.
Publisher’s Note: MDPI stays neutral with regard to jurisdictional claims in published maps and institutional affiliations.

