Article

Concentrations of Inorganic and Organic Pollutants in Forest Soils as an Archive of Anthropogenic Inputs in the State of Brandenburg, Germany

1
Faculty of Forest and Environment, Eberswalde, University for Sustainable Development, 16225 Eberswalde, Germany
2
Landesbetrieb Forst Brandenburg, 16225 Eberswalde, Germany
3
German Environment Agency, 06844 Dessau-Roßlau, Germany
*
Author to whom correspondence should be addressed.
Appl. Sci. 2021, 11(3), 1189; https://doi.org/10.3390/app11031189
Submission received: 14 December 2020 / Revised: 20 January 2021 / Accepted: 21 January 2021 / Published: 28 January 2021
(This article belongs to the Special Issue Forest Soil Monitoring)

Abstract

:
An important component of the National Forest Soils Inventory (NFSI) is the investigation of inorganic and organic pollutants. Forests are able to filter out large quantities of these substances from the atmosphere and incorporate them into the soil for a long time. The aim of this study was the integrative evaluation of organic and inorganic pollutant concentrations in forest soils in the state of Brandenburg, Germany. With the help of principle component analysis, the pollutant concentrations can essentially be explained by three significant environmental components, which explain 76% of the total variance of all pollutants examined within the scope of the NFSI. The first component characterizes the extent of the atmospheric pollution caused by flue gases and fly ash from lignite combustion in the 1970s and 1980s and is mainly charged by the organic pollutants HCB and PAH, and the elements arsenic and chromium. This component shows positive relation to both spatially interpolated calcium-deposition data from the 1980s (as an indicator for the dust emission from coal combustion) and crown defoliation data of pine stands from the forest condition survey in the early 1990s. The depositions of zinc and cadmium from industrial sources, vehicle traffic and the use of fertilizers in agriculture mainly characterize the second principle component. The use of the pesticides DDT and lindane in the early 1980s and the associated pollutants input into the forest soils are expressed by the third component. In expanding the term archiving function of soils, the results illustrate their particular importance for the long-term archiving of anthropogenic inputs and the associated potential stress factors for forests.

1. Introduction

Soils have several functions in ecosystems; e.g., they include a habitat for biological activity and water and nutrient cycles. Moreover, soils show specific site histories and also have, therefore, an archiving function. At a large scale, the specific soil properties are reflections of the natural and cultural history of a region [1,2,3,4]. This aspect can also be transferred to the pollutants stored in the soil resulting from anthropogenic factors. Thus, the regional extent and significance of anthropogenic substance inputs in the past can be examined from corresponding indicator substances in soils and in peat bogs and fluviatile or limnic sediments [5,6,7,8,9,10,11,12,13,14,15].
An important component of the National Forest Soils Inventory (NFSI) as a part of the forest monitoring in Germany is the investigation of inorganic and organic pollutants [16]. Forests are able to filter out these substances from the atmosphere and incorporate them in the soil for a long time. In the NFSI, both inorganic [17] and organic pollutants [18] of forest soils were examined for the first time at one and the same survey plots of a Germany-wide, large-scale and site-representative monitoring system using uniform methods.
In particular, little was known about the pollution of forest soils with organic pollutants until the second forest soil condition survey was carried out in the period from 2006 to 2008. In the NFSI, the focus was on the so-called persistent organic pollutants (POPs), which are only broken down very slowly in the environment and accumulate in organisms, and are ecotoxic [18]. Although some of the organic pollutants such as polycyclic aromatic hydrocarbons can arise naturally under certain conditions (e.g., in forest fires), these occurrences are negligibly small in comparison to the technogenically induced inputs. Most of the pollutants were deposited in forests through the air, or they got directly onto the forest floor as a result of the use of pesticides. In detail, it concerns the following substances:
Polycyclic aromatic hydrocarbons (PAH) arise from incomplete combustion processes of organic substances, e.g., in power plants and by motor vehicles, but also in forest fires [19,20,21]. Polychlorinated biphenyls (PCB) have a wide range of technical applications, e.g., as components of plastics. They mainly reached the soil via atmospheric deposition and they can also be transported over long distances [1]. PCB were banned worldwide by the Stockholm Convention (UNEP 2001). A special group of organic pollutants are plant protection products, to which various chemical pesticides and herbicides belong. The following substance classes were examined within the framework of the NFSI: dieldrin, hexachlorobenzene (HCB), hexachlorocyclohexane ( α -HCH, β -HCH, γ -HCH) and dichlorodiphenyltrichloroethane (DDT) and its metabolites DDx (2,4 -DDT; 4,4 -DDT; 2,4 -DDE; 4,4 -DDE; 2,4 -DDD; 4,4 -DDD).
Dieldrin is a pesticide that has not been used in Germany since 1971 [22]. Different sources are discussed for HCB [18]. In addition to its role as fungicide and the possible degradation product of γ -HCH (lindane, see below), there is also the possibility that HCB is released from chlorine-containing substances from industrial manufacturing processes and incomplete combustion processes. HCH are chemical compounds from the group of halogenated hydrocarbons. The most common is γ -HCH, which was used as an insecticide and is known under the name lindane. In the forest protection sector in Brandenburg, lindane preparations were used in combination with DDT applications in the early 1980s. In the former German Democratic Republic DDT was used until 1988, whereas its use in the old federal states was discontinued in 1972 [23]. The widespread use in the forests between 1982 and 1984 to combat nun moths (Lymantria monacha) and companion species (pine beauty moth (Panolis flammea), European pine shoot moth (Rhyacionia buoliana), bark beetle (Scolytinae), etc.) is particularly relevant here.
The concentrations of inorganic pollutants, such as heavy metals like lead (Pb), cadmium (Cd), chromium (Cr), copper (Cu), nickel (Ni), zinc (Zn) and the metalloid arsenic (As), in the soil depends not only on the parent material and the soil-forming processes, but also on the anthropogenic inputs, especially caused by industrial emissions and car exhaust. In the humus layer and topsoil in particular, the inputs from the air can exceed the natural basic contents of the soil [17].
In many respects the NFSI sample from the state of Brandenburg is particularly suitable for an integrative study with regard to the significance of anthropogenic soil impact factors: A characteristic of this study area is that the natural geogenically determined levels of inorganic pollutants are particularly low due to the Pleistocene loose rock cover and, moreover, so far, no forest liming has been carried out in Brandenburg that would have affected the binding capacity for heavy metals [17]. Importantly, there was a high level of air pollution in the past. Particularly in southern Brandenburg high dust depositions (unfiltered fly ashes from brown coal-fired power plants) enriched the forest soils with base cations and various pollutants in the 1970s and 1980s [24,25,26,27,28,29,30]. Until the first NFSI carried out in 1992, southern Brandenburg was one of the regions of central Europe most influenced by atmospheric immissions. This has changed dramatically after the reunification during the early 1990s [31,32], when the atmospheric deposition strongly decreased due to decommissioning of industrial plants, introduction of flue gas cleaning systems and the use of low-emission energy sources. Although the pollutant emissions have been severely restricted by environmental policy measures for decades, they were accumulated in forest soils and are still detectable. Hence, the inorganic and organic pollutants in soils are suitable as an indicator of the general extent of the regional pollution situation in former times.
Extensive evaluations of the NFSI data have already been carried out both nationwide and for the federal states of Germany separately for heavy metals [17,33,34,35,36] and organic pollutants [18,22,37]. Key target figures of these evaluations were the frequency of exceeding ecological effectiveness thresholds, regional patterns and the derivation of background values. The aim of this study is to present for the first time an integrative evaluation of both organic and inorganic pollutant concentrations in forest soils exemplary of the federal state of Brandenburg.

2. Material and Methods

2.1. National Forest Soil Inventory (NFSI)

The NFSI in the federal state of Brandenburg comprises a total of 322 inventory plots, which are distributed on two 8x8km-inventory grids over the entire forest area [38]. On a sub-sample of 50 plots, which are located in a 16 × 16 km-grid, investigations of persistent organic pollutants were carried out in addition to the inorganic elements. The inventory plots were sampled in 1992 (NFSI-1), 2006 (NFSI-2) and 2009 (NFSI-2a) for inorganic pollutants and 2006 for organic pollutants. The location of the sampling plots is shown in the map in Figure 1.
The nationwide standardized field methodology of the NFSI is described by Wellbrock et al. [39]. In the state of Brandenburg, from each inventory plot eight satellite samples were taken in a radius of 10 m around a central soil pit and combined to form a mixed sample for the humus layer and the depths of 0–5 cm and 5–10 cm. The depths of 10–30 cm, 30–60 cm, 60–90 cm and 90–140 cm were sampled from the central soil pit. In this paper, the term “humus layer” is used for the organic layer on top of the mineral soil. The information on the examined soil depths, however, always relate to the mineral soil.

2.2. Description of the Investigation Area

The German state Brandenburg is located in a transition zone between oceanic and continental temperate climate. A climatic gradient ranges from North-West to South-East towards an increasing continentality. The annual average temperature varies regionally between 8.6 °C and 9.3 °C. The annual climatic water balance ranges from minimum values of about −82 mm in central Brandenburg to maximum values of about +36 mm in the northern parts of the investigation area [38].
The parent materials in the state of Brandenburg are quaternary sediments. In the topsoil mainly glacial cover sands (60% of the inventory sites), glacial fluvial sand (17%), aeolian dune sand (10%) and glacial loam (5% in 10 cm depth; 10% in 100 cm depth) occur. Glacial marl appears in the subsoil of less than 5% of the sites.
The most common soil type is the podzolic Brown-earth (WRB: Spodic Arenosol, according to FAO and IUSS [40] with a share of 64% of all samples. The brown-earths differ in various degrees of the development of the spodic horizon. In addition, Podzols occur on some nutrient-poor dune sands (7%), Albic Luvisols on glacial loam (8%), and soils under the influence of groundwater (Gleysols) are found in areas of glacial valleys and floodplains (7%). 14% of the sample are Regosols, Cambisols, Anthrosols and Histosols.
The NFSI-inventory sample consists of 78% pine, 4% oak and 6% beech stands; 8% are other deciduous stands and 4% other coniferous stands (stocking type according to Wellbrock et al. [39]). This corresponds roughly to the surface percentages of the tree species in the total forest area.

2.3. Soil Analysis

Analytical methods of the NFSI are documented in detail in Wellbrock et al. [39] and GAFA [41]. For the present study pH(KCl)-value, effective cation exchange capacity (CECeff), organic carbon and clay content and the elements As, Pb, Cd, Cr, Cu, Ni and Zn were considered. These elements were determined in the NFSI-2(a) in the humus layer and in all sampled mineral soil depths. In the NFSI-1, only the heavy metals of the humus layer were analyzed. The elements mentioned were extracted from the soil with a strong acid (“aqua regia”) [41]. All information on heavy metal concentrations is therefore aqua regia extractable contents. The CECeff was determined by percolation of the dried and sieved samples with 1 M NH4Cl solution and subsequent measurement of the cations in the extract. The organic carbon was determined by elemental analyses with elemental analyser. Clay content (fraction < 2 μ m) was determined by the pipette method (sedimentation) [39,41]. Explanations of the analysis methods for organic pollutants can be found in Aichner et al. [22], Aichner et al. [37] and Marx et al. [18]. The data on PAH16, PCB6, Dieldrin, HCB, HCH, and DDx taken into account in this study are available for the humus layer and the mineral soil depth increments 0–5 cm and 5–10 cm.

2.4. Forest Condition Data

For 40 of the NFSI plots in the state of Brandenburg for which organic and inorganic pollutants were examined, data from the official forest condition survey for recording forest damage according to a nationwide standardized procedure [42,43,44] from the 1990s is available. In the present analysis, the three-year mean values of the percentage of needle loss from pine stands for which at least 15 individual crown assessments were carried out in the years 1991–1993, were used [35]. Based on the defoliation classification at that time, a distinction was made between pine stands with 0–25% mean needle loss (damage level 1–2: slightly healthy or slightly damaged) and pine stands with >25% needle loss (damage level 3–5: moderately damaged, severely damaged or dead). In addition, the sample was stratified into stands with a stand age < 40 years (15 inventory plots in damage level 1–2 and 4 plots in damage level 3–5) and age older than 40 years (12 plots in damage level 1–2 and 9 plots in damage level 3–5). The reference year for the stand age was 1991.

2.5. Statistical Analyses

We used the Principle Component Analyses (PCA) to analyze relationships between the individual organic and inorganic pollutants. Here the dimension of the original dataset is reduced by transforming it to a new set of variables, that are linear functions of those in the original dataset [45]. These so-called principal components possibly can be interpreted in terms of the different sources of the soil contamination. The statistical analyses were performed with SPSS 25 (Statistical Package for Social Science, IBM®). The number of principle components to be extracted was determined using the Kaiser criterion [46,47], which is the one most widely used since it does not require visual inspection of eigenvalue plots and is easily computerized [48,49]. A varimax rotation [46,50] was performed to facilitate interpretation of the result. The component values were calculated using regression.
We used geostatistical methods to obtain estimates of historical atmospheric deposition rates of calcium. Isotropic variogram analysis and ordinary point kriging were employed to convey available legacy data, that was measured within a former ecological monitoring network (ÖWK = ecological forest condition control), to the current NFSI plots. All geostatistics were conducted according to Webster and Oliver [51]. Computations were performed using SPSS’s matrix programs and nonlinear parameter estimations routines [52].
Furthermore, standard statistical methods such as nonparametric test statistics (Mann-Whitney U test), correlation analysis and multiple linear regression analysis and the LOESS method [53] implemented in SPSS for determining and visualizing regression curves were carried out. The correlation matrices presented in this paper refer to the Spearman correlation coefficient. Multiple linear regression analyzes were carried out using the stepwise method, which is a combination of both the forward selection and backward elimination method [54]. Residual values were examined for heteroscedasticity and autocorrelation in scatter plots and were additionally tested with the Durbin–Watson statistic for the latter. We also calculated the F-statistic (F). The following levels of significance were used: * significant (p < 0.05) and ** highly significant (p < 0.01).
Distributions of soil data were examined by histogram analyses with regard to the occurrence of outliers. In the regression analyses in Section 3.1 peat soils were excluded from the sample, and 4 plots with extremely high element concentrations, in order to prevent individual outliers from leading to statistical bias and faking high coefficients of determination. For the excluded plots with extreme values of the pollutant concentration, local causes of the contamination could be determined in all cases; e.g., non-local (contaminated) soil material for road construction or garbage deposits in the immediate vicinity of the soil samples taken. The regression relationships described in Section 3.1 are therefore valid for the following ranges of the parameters related to the mineral topsoil (0–5 cm, 5–10 cm):
  • As < 5.34 mg/kg
  • Cd < 0.31 mg/kg
  • Cr < 8.63 mg/kg
  • Cu < 7.70 mg/kg
  • Ni < 5.14 mg/kg
  • Pb < 39.23 mg/kg
  • Zn < 35.47 mg/kg
  • pH(KCl) < 6.0
  • Organic carbon content (Corg) < 15%
  • Clay content < 10%
  • Cation exchange capacity (CECeff) < 120 mmolc/kg

3. Results

3.1. Inorganic Pollutants

Compared to the Germany-wide NFSI data, the peak values of inorganic pollutants in Brandenburg are far below those in other regions in Germany due to the low geogenic base concentrations [17,35]. For the levels of inorganic pollutants found in the mineral topsoil, in addition to the atmospheric pollution from supra-regional and local emitters, the current chemical soil condition also plays a decisive role.
The scatter diagrams in Figure 2 exemplify the univariate dependencies of the element concentration on the CECeff. Of all the potentially influencing variables considered, CECeff shows the closest relationship to the concentrations of the examined trace elements. The CECeff expresses the quantity of clay minerals, hydroxides and oxides, the content of organic soil colloids and—due to the partially pH-dependent charges—also the soil reaction. These soil properties are crucial for the binding of heavy metals in the mineral topsoil and delay their leaching into subsoil. This also applies to the partially anionically bound trace elements such as As and Cr, although in these cases the relationship to the CECeff is of an indirect nature, because top soils with high anion exchange capacity usually also have high cation exchange capacity.
For each element, two regression models were calculated. The pH value is considered in both models. In addition, the logarithmized organic carbon content and the clay content were considered in the first model approach and the logarithmized effective cation exchange capacity in the second approach. For the logarithmized CECeff or Corg content values, the correlations were somewhat better than using the non-logarithmic values, so that a non-linear relationship was generally assumed here. The results of the regression analyses are shown in Table 1.
T r a c e e l e m e n t [ m g / k g ] = a l o g ( C E C e f f ) [ m o l c / k g ] + b p H ( K C l ) + c
T r a c e e l e m e n t [ m g / k g ] = a l o g ( C o r g ) [ ] + b c l a y c o n t e n t [ % ] + c p H ( K C l ) + d
The concentrations of all trace elements increase with increasing values of CECeff, Corg and clay content. By comparing the standardized regression coefficients, it can be seen for the individual trace substances whether the organic colloids (Corg content) or the clay minerals are more important for the binding. The picture is quite clear: The clay content only plays a very subordinate role in binding Cd. The standardized regression coefficient of the Corg content exceeds that of the clay content by about 30 times. For the elements Cu and Pb, the standardized regression coefficients of the Corg content exceed those of the clay content by 6 times and for Zn and As by two times. The clay content, however, is more important for the binding of the elements Cr and Ni. Here the standardized regression coefficients of the clay content are slightly higher than those of the Corg content.
The effect of the pH value is positive for the elements Cd, Cr, Cu, Ni and Zn in all regression equations. As the pH value decreases, these elements are mobilized and leached out. Pb, on the other hand, is very strongly fixed right into the very acidic pH range. No influence of the pH value can be determined for the element As.
For the humus layer there are only very weak or no significant correlations between heavy metal concentrations and other soil chemical properties. Only the element Pb shows a weakly significant negative relationship to the pH value and for the elements Zn and Cu a weakly positive one to the Corg content.

3.2. Relationships between Inorganic and Organic Pollutants

3.2.1. Polycyclic Aromatic Hydrocarbons (PAH)

There are more or less close relationships between the levels of inorganic and organic pollutants in the humus layer, which suggest common emission sources (Table 2, Figure 3). For the mineral soil (0–5 cm depth) these relationships either hardly exist or are not present at all. Here the deposited heavy metal quantities are obviously influenced to a large extent by the current soil chemical properties and their effects on mobilization processes (see Section 3.1).
The closest relationship between the PAH16 values in the humus layer is to the As content (Figure 3). As can also be seen for the element Pb, the scatter diagram for As indicates that the best-fit curve runs almost through the origin of the XY-axis, so that for these trace elements (and for PAH) only anthropogenic input sources can be assumed. With regard to the correlation coefficients, the relationships to the heavy metal concentrations of the NFSI-1 are similar to those of the NFSI-2. With a coefficient of determination of R2 = 0.64, PAH16 can be estimated based on the As and Cr concentrations in the humus layer. The corresponding regression equation is:
P A H 16 [ n g / g ] = 367.3 A s [ m g / k g ] + 291.0 C r [ m g / k g ] 382.4
Looking at the correlation matrix of the PAH16 individual analytes and the inorganic pollutants in the humus layer, it becomes evident that As and Cr are closely associated especially to the low-molecular weight PAH with two or three aromatic rings (Table 3). The correlation coefficients for As and Cr decrease significantly from the low molecular weight substances with a maximum of R for naphtalin (2 aromatic rings) and fluoren (3 aromatic rings) to the high molecular weight substances with a minimum of R for benzo(a)pyren (5 aromatic rings). In contrast, for the elements Pb and Cu, there are significantly closer relationships to the higher molecular weight PAHs than to the lower molecular weight ones.

3.2.2. Polychlorinated Biphenyls (PCB)

The correlation of the PCB6 with the heavy metal concentration of the humus layer is overall lower than that of the PAH16 (Table 4). In both the NFSI-1 and the NFSI-2 sample, there is the closest relationship to the Pb levels. Since no significant source of PCB emissions is seen in motor vehicle traffic, this could be an indirect connection, according to which Pb pollution is increased in areas close to settlements, where PCB emitters may also be of greater importance.

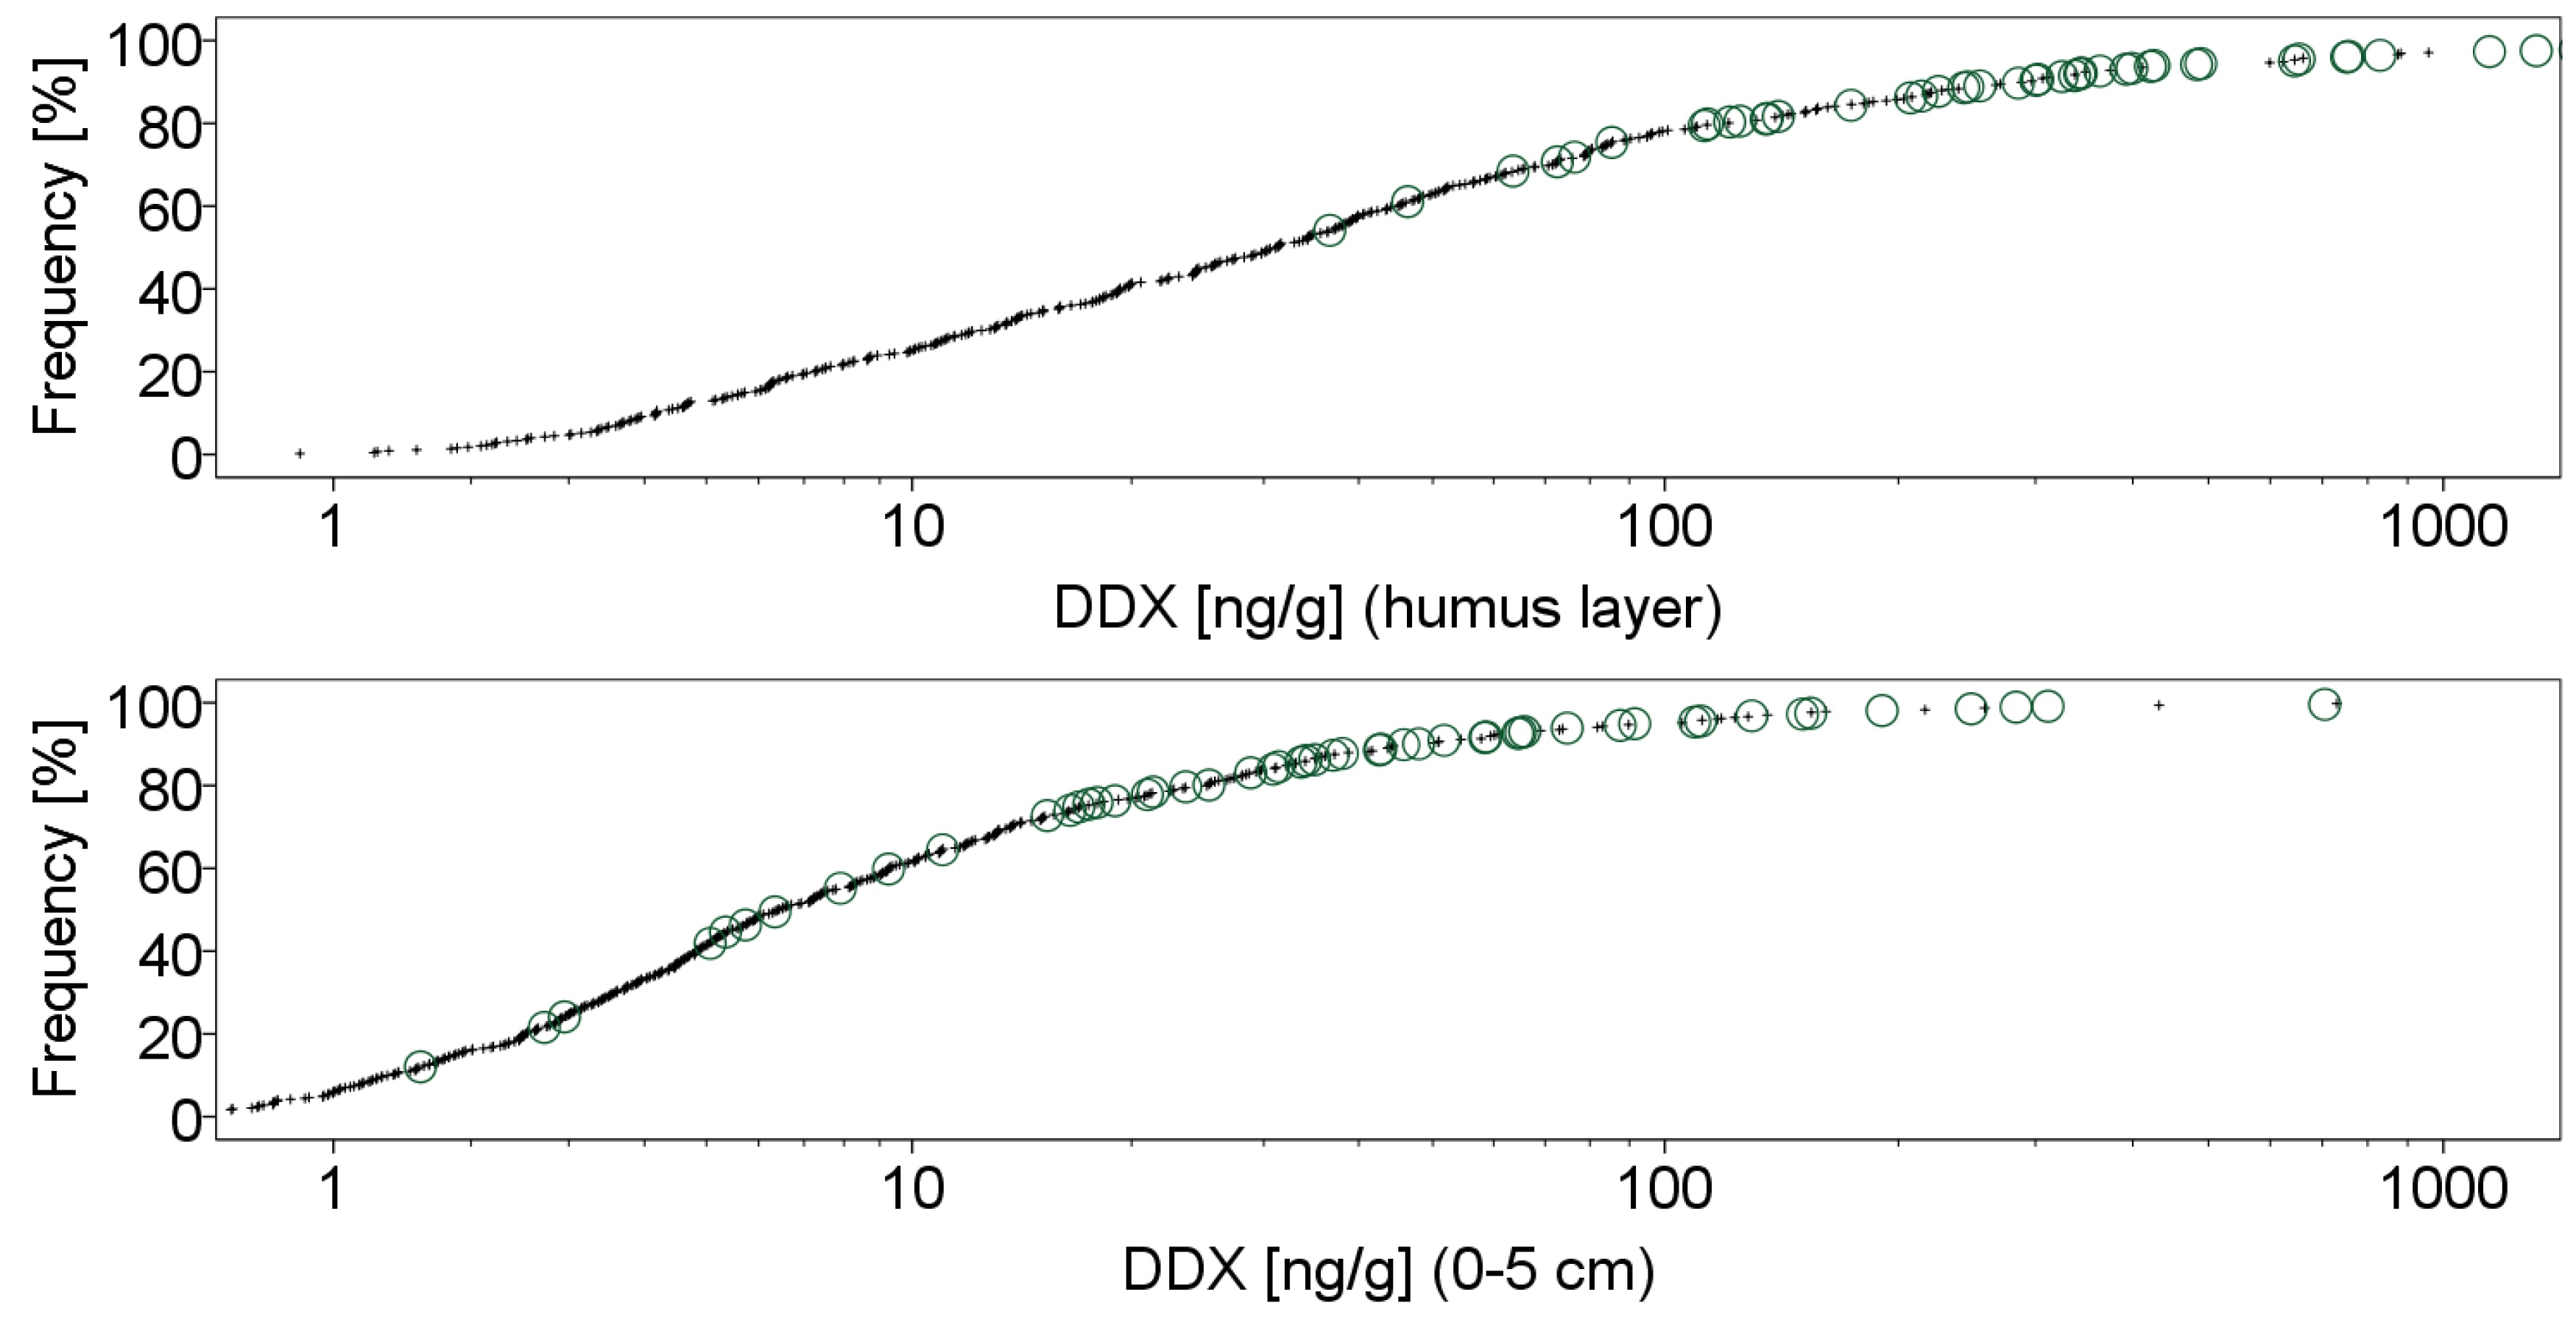
3.2.3. Chemical Pesticides and Herbicides

There are no significant relationships between Dieldrin and the inorganic pollutants in both the NFSI-1 and the NFSI-2 (Table 5). This seems plausible, since the use of pesticides is less of a causal factor for the heavy metal concentration in the soil, but rather technogenic sources.
The relatively close relationships between HCB with inorganic pollutants (Table 6) point in particular to the importance of the technogenic origin of HCB in the state Brandenburg. The corresponding correlation coefficients in the NFSI-2 data set are only slightly below those determined for PAHs (Table 2) and, like these—with the exception of the element Zn—are all highly significant. With a coefficient of determination of R² = 0.63, HCB can be estimated from the As and Cr contents in the humus layer. The corresponding regression equation is:
H C B [ n g / g ] = 0.541 A s [ m g / k g ] + 0.559 C r [ m g / k g ] + 0.471
α -, β - and γ -HCH and their sum value are significantly higher at the Brandenburg NFSI plots compared to the Germany-wide NFSI sample [35]. The percentage cumulative frequency distribution in Figure 4 shows that the majority of the Brandenburg values are between the 70 and 100 percentile of the nationwide sample and that the particularly high values (>90 percentile) are mostly found in Brandenburg. In the mineral topsoil, the majority of the measured values are below the detection limit and there is no significant difference between the nationwide and Brandenburg sample.
With the exception of Cr, there are no significant relationships to the inorganic pollutants of the NFSI-2. In contrast, significant relationships exist for the NFSI-1 sample for the elements Cr, Cu, Ni, and Pb. However, the correlation coefficients are mostly at a comparatively low level (Table 7).
The most noticeable median differences between the nationwide and Brandenburg-wide NFSI samples can be found for DDT and its metabolites. For these substances, the Brandenburg medians, both in the humus layer and in the mineral soil, are very clearly above the nationwide ones. Figure 5 shows the cumulative frequency distribution for the DDx sum values (DDT and metabolites). Hence, the majority of the Brandenburg NFSI plots are above the 80 percentile of the federal sample for the humus layer and above the 70 percentile for the mineral soil. There are no or only weak relationships to the heavy metal concentrations (Table 8), although the relationship in some cases is highly significant (p < 0.01).

3.3. Principle Component Analysis (PCA) of the Organic and Inorganic Pollutants

In the present evaluation, the parameters listed in Table 9 were used as input variables for the principle component analysis. As a result of the PCA, three principle components were extracted, the rotated charges of which are shown in Table 9. Principle component 1 already explains 37% of the total variance. Principle component 2 explains another 20% and principle component 3 another 19%. In total, 76% of the total variance of all the parameters considered is explained.
Table 9 shows that principle component 1 is mainly charged by the organic pollutants HCB and PAH and the elements As and Cr. In addition, there are weaker relationships, especially with Ni, Pb and Cu. PCB and HCH are of minor importance and the pesticides DDx and Dieldrin play no role. In contrast, principle component 2 primarily represents the Zn and Cd concentration and, to a lesser extent, Cu, Pb, Ni, and PCB. Principle component 3 is significantly charged by the pesticides DDx and Dieldrin. In addition, it receives a weak charge from PCB and HCH, and the Pb concentration also shows a positive relationship to this principle component. Thus, all three principle components are influenced to the same extent by the Pb concentration and PCB concentrations. Their accumulation is therefore rather unspecific and can occur on all sites contaminated in any way by anthropogenic inputs.

3.4. Relationship to Historical Forest Condition Data

The ecological effectiveness of the pollutants examined can be traced using data from the forest condition survey [35]. For four age defoliation groups, the Figure 6, Figure 7 and Figure 8 show the level of the pollutants in the humus layer considered in the present paper. Due to the small sample sizes, only tendencies can be derived from the graphical representations in Figure 6, Figure 7 and Figure 8. With the help of the Mann-Whitney U test, significant median differences (p < 0.05) can only be determined for Dieldrin, HCH, Cd, and Pb in the young pine stands and DDx (DDT and metabolites), As and Cr in the old stands.
However, the box plots show that in old stands, for almost all the substances examined, higher levels of the examined pollutants can be found than in young stands. This age effect is very likely due to the higher surface roughness and possibly longer exposure of the old pine stands. Increased levels of organic pollutants that can be traced back to the use of pesticides, such as Dieldrin and DDx, are found in the group of young stands with increased needle losses. It can be assumed that damage caused by insect pests in these stocks was primarily combated with pesticides.
With regard to the indicators for the influence of fly ash and flue gases from lignite combustion (principle component 1, Section 3.3), it should be emphasized that in old stands with increased needle loss there are usually greater variances and strongly right-skewed frequency distributions. This mainly affects the organic pollutants HCB and low molecular weight PAH16 individual analytes (naphthalene, acenaphthylene, fluorene, phenanthrene, anthracene, fluoranthene and pyrene). Of the inorganic pollutants, As, and Cr are increased with higher needle loss in old pine stands.

4. Discussion

The concentration of organic and inorganic pollutants in the soil can be used as a chemical fingerprint to identify the historical pollution of the NFSI plots by anthropogenic influences. The results of the present study make clear that inorganic pollutants in the mineral top soil depend to a large extent on the respective current soil chemical properties, which significantly influence their binding and mobilization behavior. The pollutant concentrations in the humus layer, however, show relationships that suggest common sources of input. The close relationship between low molecular weight PAH and the elements As and Cr is particularly noticeable. It confirms that the low molecular weight PAHs in particular were released on a large scale through the combustion of coal, as is also assumed for As [55,56]. Khalili et al. [57] associate high levels of low molecular weight PAHs (especially naphthalene and phenanthrene) with coal mining. In the Germany-wide analysis of NFSI data, Aichner et al. [37] found relationships between high concentrations of two- and three-ring PAHs in the soil and the emissions released from lignite opencast mining and (brown) coal-fired power plants, especially in eastern Germany.
In the second half of the last century, the entire forest area of Brandenburg was heavily affected by atmospheric emissions from flue gases and fly ash from lignite combustion. In southern Brandenburg, even at the time of the second NFSI (2007-2009), the Brandenburg-wide highest base cation stocks were found in naturally nutrient-poor early Pleistocene sandy soils, which can be attributed to the cumulative input of basic (i.e., Ca, Mg, K-containing) dusts from the atmospheric deposition [27,38,58]. It can be assumed that, together with these nutrients, which had a rather beneficial effect on the trees’ growth, a wide variety of pollutants, such as heavy metals and organic pollutants, were also deposited with the fly ash [59]. In the long term, these have changed the properties of the affected soils and might have had a destabilizing effect on the forest ecosystems [60].
The principal component analyses (PCA) is particularly suitable for the characterization of pollutants in the soil with regard to their origin and historical allocation [61]. Inorganic and persistent organic pollutants in soils or sediments were also evaluated by Zimmer et al. [12], Lasota and Błońska [62] and Morillo et al. [63] with the help of the PCA and by Bonelli and Manni [64] additionally with geostatic methods in order to analyze correlation patterns, to group sites according to the degree of their overall pollution and to identify regional emission sources. Overall, close relationships between the organic and inorganic substance groups could always be observed in these studies, which suggests common origins.
In the present study, both principle component 1 and principle component 2 represent the influence of technogenically induced inputs into the soil. The principle component 1 shows, that specific organic substances, such as polycyclic aromatic hydrocarbons and the compound hexachlorobenzene, which can be attributed to emissions [37], are closely associated with As and Cr. This component thus expresses the technogenic pollutant inputs, as they result above all from the burning of lignite and possibly other industrial plants. The element As in the humus layer seems to be suitable for indicating depositions from the former lignite combustion. Due to the anionic occurrence, the fixation of As to the soil colloids increases with a decreasing pH-value, so that due to the predominantly acidic soil conditions, the element apparently remained stably integrated in the humus for decades and still shows regionally differentiated the influence of lignite combustion in the 1970s and 1980s. The element Cr has similar indicator properties if it is anionic in oxidation state VI. Technogenic sources are also most likely responsible for the level of principle component 2, which is significantly charged by the heavy metals Zn and Cd. Metal-processing industries and power plants and emissions from motor vehicle traffic, in particular from tire abrasion and combustion residues, are possible. Furthermore, agricultural emission sources in the form of fertilizers could also be important for the level of principle component 2. However, it is also possible that it only expresses the similar mobility behavior of Zn and Cd in the soil.
It is noteworthy that the deposited substances are obviously largely retained in the organic matter of the humus layer and have been fixed in such large quantities that they can still be detected even after several decades. With the help of magnetic susceptibility measurements also Klose and Makeschin [65] found that fly ash is mainly accumulated in the humus layer of the forest soils. According to Klose et al. [66] ferromagnetic components of fly ash are mainly accumulated in the Oe and Oa horizons. The authors considered these horizons as specific diagnostic horizons because they show indicative properties for detection of atmospheric lignite-derived deposition into forest soils. In this context, Lasota and Błońska [62] point out that the pollutants originating from the same sources and accumulated in the soil depend on the humus form and that the highest concentration of PAHs and heavy metals can be recorded in mor humus type.
After the end of the Second World War, lignite production in the area of the former German Democratic Republic (GDR) was 85.2 million tons and in the mid-1980s it reached a maximum of 312.2 million tons [67]. The use of lignite in power plants grew steadily until the year 1989. It was increasingly burned as raw brown coal in the industrial agglomeration areas of the GDR. The emitted dusts were partly deposited in the vicinity of emission sources and due to emission with high chimneys also transported over long distances settling particularly at forest ecosystems because of their high surface roughness. On the basis of deposition measurements since the 1960s [68,69,70] and extensive analyses of bark samples on the grid of the forest condition survey of the former GDR (691 inventory plots) in the years 1985 to 1988 [71,72], spatial distribution of the calcium deposition of pine stands were roughly calculated [38]. According to these estimations approximately 50 kg/ha/year of Ca was deposited on average into pine stands in the state of Brandenburg at the time of the highest incidence of atmospheric pollution in the 1980s [38].
The spatial distribution of the Ca loads is derived from the calculated values at the survey plots of the former ecological forest condition control (Figure 9). Both the lignite-fired power stations in the south of Brandenburg and the lignite use for domestic fires, especially in Berlin, are responsible for the regional pattern of the pollution. Figure 9 makes clear that the deposition was strongly concentrated in the south of Brandenburg and was about four times higher than in the north. It is noteworthy that the Ca loads in northern Brandenburg also exceed today’s loads by five times. The regional pattern coincides with descriptions by Heinsdorf et al. [73] and with the results of Wellbrock et al. [26], who derived different types of deposition for the reference year 1989 with the help of multivariate analysis of regionalized deposition rates. Accordingly, a very high deposition of sulphur together with base cations from flue ash such as Ca, Mg and Na represents the south of Brandenburg. The corresponding deposition type is dominated by emissions from the combustion of lignite in eastern Germany up to the beginning of the 1990s. The evaluations also show that the deposition situation and the spatial distribution patterns of the deposition rates were completely different after 1990 than in the 1980s [26,74].
The estimated Ca deposition at the plots of the former forest condition survey was transferred to the NFSI plots by ordinary point kriging. A combined variogram model (nugget + exponential) adequately fitted the observed sample variogram (R2 = 0.95). The results of a leave-one-out cross-validation (R2 = 0.63) suggested, that the kriging estimates obtained for the NFSI plots were reliable. The kriging estimates can thus be correlated to the principle components derived in Section 3.3 (Table 9). As a result, there is a close relationship with the principle component 1; the principle components 2 and 3 show no relationship with the atmospheric Ca deposition. Accordingly, there are also significant relationships to the inorganic and organic pollutants that have high charges on principle component 1 (Table 10). In the case of inorganic trace substances, the closest relationships exist with As and Cr, which, according to Bonelli and Manni [64], are closely associated with the dust emissions from carbon combustion plants. The individual analytes of PAH16 tend to show higher correlation coefficients to the low molecular weight compounds with a maximum of R = 0.65 for fluorine and phenanthren (3 aromatic rings) (Table 11).

5. Conclusions

The present evaluation suggests that, especially together with the dust input from lignite combustion, large amounts of potentially toxic pollutants were deposited into the forest ecosystems and accumulated in the soil. Potential effects on the soil organisms and the roots of the plants can hardly be assessed retrospectively. In this article, therefore, no specific ecological assessment of the pollutants accumulated in the soil can be carried out, but rather the function of the soil as “memory” for the overall historical pollution and its corresponding indicator suitability should be examined. It became clear that large-scale, methodologically comparable data sets, such as those obtained by the NFSI in the context of forest environmental monitoring, are well suited for recording pollutants originating from decades ago. The data provide information on the extent of past, not-directly-visible influences of human activity on forest ecosystems and their spatial distribution.
Up until the beginning of the 1990s, the forest’s soil condition in the study area was considered to be influenced to a high degree by atmospheric substances, which increasingly began to have a negative impact on the vitality of the trees and the ecosystem balance [75,76]. The main focus was on the effects of nitrogen, acid and base cation inputs. The role of inorganic and organic pollutants as harmful factors was not explicitly taken into account. The present retrospective evaluations give indications that the “novel forest damages” at that time were actually linked to immission and deposition processes and can be interpreted as a complex ecosystemic disease triggered by cumulative stress from increasing air pollution.

Author Contributions

Conceptualization, W.R.; methodology, W.R. and A.R.; validation, W.R., A.R. and M.M.; formal analysis, W.R. and A.R.; investigation, W.R. and A.R.; resources, W.R.; data curation, A.R. and W.R.; writing—original draft preparation, W.R.; writing—review and editing, W.R., A.R. and M.M.; visualization, W.R.; supervision, W.R.; project administration, W.R.; funding acquisition, W.R. All authors have read and agreed to the published version of the manuscript.

Funding

This research received no external funding.

Data Availability Statement

The data presented in this study are available on request from Landesbetrieb Forst Brandenburg.

Acknowledgments

We thank all colleagues who were involved in field sampling and laboratory measurements. We thank Daniel Ziche for GIS-related services.

Conflicts of Interest

The authors declare no conflict of interest.

References

  1. Blume, H.P.; Brümmer, G.W.; Fleige, H.; Horn, R.; Kandeler, E.; Kögel-Knabner, I.; Kretzschmar, R.; Stahr, K.; Wilke, B.M. Scheffer/Schachtschabel Soil Science; Springer: Berlin/Heidelberg, Germany, 2016. [Google Scholar] [CrossRef]
  2. Walkington, H. Soil Science Applications in Archaeological Contexts: A Review of Key Challenges. Earth-Sci. Rev. 2010, 103, 122–134. [Google Scholar] [CrossRef]
  3. Küster, M.; Fülling, A.; Kaiser, K.; Ulrich, J. Aeolian Sands and Buried Soils in the Mecklenburg Lake District, NE Germany: Holocene Land-Use History and Pedo-Geomorphic Response. Geomorphology 2014, 211, 64–76. [Google Scholar] [CrossRef]
  4. Lehmann, A.; Stahr, K. Nature and Significance of Anthropogenic Urban Soils. J. Soils Sediments 2007, 7, 247–260. [Google Scholar] [CrossRef]
  5. Norton, S.A. Atmospheric Metal Pollutants-Archives, Methods, and History. Water Air Soil Pollut. Focus 2007, 7, 93–98. [Google Scholar] [CrossRef]
  6. Klaminder, J.; Bindler, R.; Rydberg, J.; Renberg, I. Is There a Chronological Record of Atmospheric Mercury and Lead Deposition Preserved in the Mor Layer (O-Horizon) of Boreal Forest Soils? Geochim. Cosmochim. Acta 2008, 72, 703–712. [Google Scholar] [CrossRef]
  7. Heim, S.; Schwarzbauer, J. Pollution History Revealed by Sedimentary Records: A Review. Environ. Chem. Lett. 2013, 11, 255–270. [Google Scholar] [CrossRef]
  8. Steinnes, E.; Friedland, A.J. Metal Contamination of Natural Surface Soils from Long-Range Atmospheric Transport: Existing and Missing Knowledge. Environ. Rev. 2006, 14, 169–186. [Google Scholar] [CrossRef]
  9. Santschi, P.H.; Presley, B.J.; Wade, T.L.; Garcia-Romero, B.; Baskaran, M. Historical Contamination of PAHs, PCBs, DDTs, and Heavy Metals in Mississippi River Delta, Galveston Bay and Tampa Bay Sediment Cores. Mar. Environ. Res. 2001, 52, 51–79. [Google Scholar] [CrossRef]
  10. Thuens, S.; Blodau, C.; Radke, M. How Suitable Are Peat Cores to Study Historical Deposition of PAHs? Sci. Total Environ. 2013, 450–451, 271–279. [Google Scholar] [CrossRef]
  11. Bohdálková, L.; Bohdálek, P.; Břízová, E.; Pacherová, P.; Kuběna, A.A. Atmospheric Metal Pollution Records in the Kovářská Bog (Czech Republic) as an Indicator of Anthropogenic Activities over the Last Three Millennia. Sci. Total Environ. 2018, 633, 857–874. [Google Scholar] [CrossRef]
  12. Zimmer, D.; Kiersch, K.; Jandl, G.; Meissner, R.; Kolomiytsev, N.; Leinweber, P. Status Quo of Soil Contamination with Inorganic and Organic Pollutants of the River Oka Floodplains (Russia). Water Air Soil Pollut. 2010, 211, 299–312. [Google Scholar] [CrossRef]
  13. Wang, G.; Mielke, H.W.; van Quach, C.G.; Zhang, Q. Determination of Polycyclic Aromatic Hydrocarbons and Trace Metals in New Orleans Soils and Sediments. Soil Sediment Contam. Int. J. 2004, 13, 1–15. [Google Scholar] [CrossRef]
  14. Fabietti, G.; Biasioli, M.; Barberis, R.; Ajmone-Marsan, F. Soil Contamination by Organic and Inorganic Pollutants at the Regional Scale: The Case of Piedmont, Italy. J. Soils Sediments 2010, 10, 290–300. [Google Scholar] [CrossRef]
  15. Görres, M.; Frenzel, B. Ash and Metal Concentrations in Peat Bogs as Indicators of Anthropogenic Activity. Water Air Soil Pollut. 1997, 100, 355–365. [Google Scholar] [CrossRef]
  16. Wellbrock, N.; Ahrends, B.; Bögelein, R.; Bolte, A.; Eickenscheidt, N.; Grüneberg, E.; König, N.; Schmitz, A.; Fleck, S.; Ziche, D. Concept and Methodology of the National Forest Soil Inventory. In Status and Dynamics of Forests in Germany: Results of the National Forest Monitoring; Wellbrock, N., Bolte, A., Eds.; Ecological Studies; Springer International Publishing: Cham, Switzerland, 2019; pp. 1–28. [Google Scholar] [CrossRef] [Green Version]
  17. Utermann, J.; Aydın, C.T.; Bischoff, N.; Böttcher, J.; Eickenscheidt, N.; Gehrmann, J.; König, N.; Scheler, B.; Stange, F.; Wellbrock, N. Heavy Metal Stocks and Concentrations in Forest Soils. In Status and Dynamics of Forests in Germany: Results of the National Forest Monitoring; Wellbrock, N., Bolte, A., Eds.; Ecological Studies; Springer International Publishing: Cham, Switzerland, 2019; Volume 237, pp. 199–230. [Google Scholar] [CrossRef] [Green Version]
  18. Marx, M.; Ackermann, J.; Schmidt, S.; Utermann, J.; Bussian, B.M. Occurrence and Spatial Distribution of Selected Organic Substances in Germany’s Forest Soils. In Status and Dynamics of Forests in Germany: Results of the National Forest Monitoring; Wellbrock, N., Bolte, A., Eds.; Ecological Studies; Springer International Publishing: Cham, Switzerland, 2019; Volume 237, pp. 231–260. [Google Scholar] [CrossRef] [Green Version]
  19. Ravindra, K.; Sokhi, R.; Grieken, R.V. Atmospheric Polycyclic Aromatic Hydrocarbons: Source Attribution, Emission Factors and Regulation. Atmos. Environ. 2008, 42, 2895–2921. [Google Scholar] [CrossRef] [Green Version]
  20. Srogi, K. Monitoring of Environmental Exposure to Polycyclic Aromatic Hydrocarbons: A Review. Environ. Chem. Lett. 2007, 5, 169–195. [Google Scholar] [CrossRef] [Green Version]
  21. Meij, R.; te Winkel, H. The Emissions of Heavy Metals and Persistent Organic Pollutants from Modern Coal-Fired Power Stations. Atmos. Environ. 2007, 41, 9262–9272. [Google Scholar] [CrossRef]
  22. Aichner, B.; Bussian, B.; Lehnik-Habrink, P.; Hein, S. Levels and Spatial Distribution of Persistent Organic Pollutants in the Environment: A Case Study of German Forest Soils. Environ. Sci. Technol. 2013, 47, 12703–12714. [Google Scholar] [CrossRef]
  23. Heinisch, E.; Kettrup, A.; Bergheim, W.; Martens, D.; Wenzel, S. Persistent Chlorinated Hydrocarbons (PCHC), Source-Oriented Monitoring in Aquatic Media 2. The Insecticide DDT, Constituents, Metabolites. Fresenius Environ. Bull. 2005, 14, 68–85. [Google Scholar]
  24. Heinsdorf, D.; Branse, C.; Heisterberg, B. Charakterisierung der Fremdstoffbelastung in Kiefernökosystemen über die Erfassung von Boden- und Ernährungskundlichen Kenndaten und unter Besonderer Berücksichtigung der Waldrandproblematik Sowie der Entwicklung der Bodenvegetation; Forschungsbericht der Forstlichen Forschungsanstalt Eberswalde, e.V.: Eberswalde, Germany, 1994. [Google Scholar]
  25. Hüttl, R.F.; Bellmann, K. (Eds.) Changes of Atmospheric Chemistry and Effects on Forest Ecosystems: A Roof Experiment without Roof; Number v. 3 in Nutrients in Ecosystems; Springer: Berlin/Heidelberg, Germany; New York, NY, USA, 1999. [Google Scholar]
  26. Wellbrock, N.; Riek, W.; Wolff, B. Characterisation of and Changes in the Atmospheric Deposition Situation in German Forest Ecosystems Using Multivariate Statistics. Eur. J. For. Res. 2005, 124, 161–172. [Google Scholar] [CrossRef]
  27. Riek, W.; Russ, A.; Martin, J. Soil Acidification and Nutrient Sustainability of Forest Ecosystems in the Northeastern German Lowlands - Results of the National Forest Soil Inventory. Folia For. Pol. Ser. A 2012, 54, 187–195. [Google Scholar] [CrossRef]
  28. Fürst, C.; Makeschin, F. Forest Ecosystem Development under a Changing Environment and Conclusions for Forest Management. In Forestry in Achieving Millenium Goals; Institute of Lowland Forestry and Environment: Novi Sad, Serbia, 2009; pp. 47–55. [Google Scholar]
  29. Fürst, C.; Lorz, C.; Abiy, M.; Makeschin, F. Fly Ash Deposition in North Eastern Germany 628 and Consequences for Forest Management. In Contributions to Forest Sciences; Fürst, C., Janecek, V., Lorz, C., Makeschin, F., Podraszky, V., Vacik, H., Eds.; Future-Oriented Concepts, Tools and Methods for Forest Management and Forest Research Crossing European Borders; Ulmer: Stuttgart, Germany, 2006; Volume 28, pp. 50–62. [Google Scholar]
  30. Fürst, C.; Abiy, M.; Makeschin, F. Forest Ecosystem Development after Heavy Deposition Loads–Case Study Dübener Heide. In AIR POLLUTION 2008; Volume Air Pollution XVI; WIT Transactions on Ecology and the Environment: Skiathos, Greece, 2008; pp. 571–584. [Google Scholar] [CrossRef] [Green Version]
  31. Bellmann, K.; Grote, R. Introduction to the SANA-Project (SANA: Regeneration of the Atmosphere above the New States of Germany — Effects on Forest Ecosystems). In Changes of Atmospheric Chemistry and Effects on Forest Ecosystems: A Roof Experiment without a Roof; Hüttl, R.F., Bellmann, K., Eds.; Nutrients in Ecosystems; Springer: Dordrecht, The Netherlands, 1998; pp. 1–15. [Google Scholar] [CrossRef]
  32. Erhard, M.; Flechsig, M. A Landscape Model for the Investigation of Atmogenic Pollution Effects on the Dynamics of Scots Pine Ecosystems. In Changes of Atmospheric Chemistry and Effects on Forest Ecosystems: A Roof Experiment without a Roof; Hüttl, R.F., Bellmann, K., Eds.; Nutrients in Ecosystems; Springer: Dordrecht, The Netherlands, 1998; pp. 283–312. [Google Scholar] [CrossRef]
  33. Block, J.; Gauer, J. Waldbodenzustand in Rheinland–Pfalz: Ergebnisse der zweiten landesweiten Bodenzustandserhebung BZE II; Forschungsanst. für Waldökologie und Forstwirtschaft Rheinland-Pfalz: Trippstadt, Germany, 2012; Volume 70/12. [Google Scholar]
  34. Hartmann, P.M.; Buberl, H.G.; Puhlmann, H.; Schäffer, J.; Trefz-Malcher, G.; Zirlewagen, D.; von Wilpert, K. Waldböden Südwestdeutschlands: Ergebnisse der Bodenzustandserhebungen im Wald von 1989–1992 und 2006–2008; Verlag Kessel: Remagen-Oberwinter, Germany, 2016. [Google Scholar]
  35. Riek, W.; Russ, A. Waldbodenbericht Brandenburg. Weitere Ergebnisse der Landesweiten Bodenzustandserhebungen und Folgerungen für die nachhaltige Waldnutzung; Eberswalder Forstliche Schriftenreihe; Landesbetrieb Forst Brandenburg, Landeskompetenzzentrum Forst Eberswalde: Eberswalde, Germany, 2019; Volume 68. [Google Scholar]
  36. Russ, A.; Riek, W.; Martin, J. Zustand und Wandel der Waldböden Mecklenburg-Vorpommerns—Ergebnisse der zweiten Bundesweiten Bodenzustandserhebung in Mecklenburg-Vorpommern; Mitteilungen aus dem Forstlichen Versuchswesen Mecklenburg-Vorpommern; Landesforst Mecklenburg-Vorpommern: Schwerin, Germany, 2011; Volume 9. [Google Scholar]
  37. Aichner, B.; Bussian, B.M.; Lehnik-Habrink, P.; Hein, S. Regionalized Concentrations and Fingerprints of Polycyclic Aromatic Hydrocarbons (PAHs) in German Forest Soils. Environ. Pollut. 2015, 203, 31–39. [Google Scholar] [CrossRef] [PubMed]
  38. Riek, W.; Russ, A.; Kuehn, D. Waldbodenbericht Brandenburg–Zustand und Entwicklung der brandenburgischen Waldböden. Ergebnisse der landesweiten Bodenzustandserhebungen BZE-2 und BZE-2a.; Eberswalder Forstliche Schriftenreihe, Landesbetrieb Forst Brandenburg, Landeskompetenzzentrum Forst Eberswalde: Eberswalde, Germany, 2015; Volume 60. [Google Scholar]
  39. Wellbrock, N.; Aydin, C.T.; Block, J.; Bussian, B.; Deckert, M.; Diekmann, O.; Evers, J.; Fetzer, K.D.; Gauer, J.; Gehrmann, J.; et al. Bodenzustandserhebung im Wald (BZE II). Arbeitsanleitung für die Außenaufnahmen; BMELV: Berlin, Germany, 2006. [Google Scholar]
  40. FAO; IUSS. World Reference Base for Soil Resources 2014: International Soil Classification System for Naming Soils and Creating Legends for Soil Maps—Update 2015, Working Group WRB. International Soil Classification System for Naming Soils and Creating Legends for Soil Maps; Number No. 106 in World Soil Resources Reports; FAO: Rome, Italy, 2015. [Google Scholar]
  41. GAFA. Handbuch Forstliche Analytik - Eine Loseblatt-Sammlung der Analysemethoden im Forstbereich; Bundesministerium für Verbraucherschutz, Ernährung und Landwirtschaft: Bonn, Germany, 2005. [Google Scholar]
  42. ICP. Visual Assessment of Crown Condition and Damaging Agents; Number 4 in ICP Forests Manual–Manual on Methods and Criteria for Harmonized Sampling, Assessment, Monitoring and Analysis of the Effects of Air Pollution on Forests; ICP Forests: Hamburg, Germany, 2006. [Google Scholar]
  43. Wellbrock, N.; Riek, W.; Wolff, B.; Schröder, W. Waldschäden. In Waldschäden; Fränzle, O., Müller, F., Schröder, W., Eds.; Handbuch der Umweltwissenschaften: Grundlagen und Anwendungen der Ökosystemforschung—Ökosystemare Analyse anthropogener Störungen; Ecomed-Verlag: Landsberg am Lech, Germany, 2003; Volume Kap. VI-2.3, pp. 1–28. [Google Scholar]
  44. Eickenscheidt, N.; Puhlmann, H.; Riek, W.; Schmidt-Walter, P.; Augustin, N.; Wellbrock, N. Spatial Response Patterns in Biotic Reactions of Forest Trees and Their Associations with Environmental Variables in Germany. In Status and Dynamics of Forests in Germany: Results of the National Forest Monitoring; Wellbrock, N., Bolte, A., Eds.; Ecological Studies; Springer International Publishing: Cham, Switzerland, 2019; Volume 237, pp. 311–354. [Google Scholar] [CrossRef] [Green Version]
  45. Jolliffe, I.T.; Cadima, J. Principal component analysis: A review and recent developments. Philos. Trans. R. Soc. A Math. Phys. Eng. Sci. 2016, 374, 20150202. [Google Scholar] [CrossRef] [PubMed]
  46. Kaiser, H.F. The Varimax Criterion for Analytic Rotation in Factor Analysis. Psychometrika 1958, 23, 187–200. [Google Scholar] [CrossRef]
  47. Überla, K. Faktorenanalyse; Springer: Berlin/Heidelberg, Germany; New York, NY, USA, 2013. [Google Scholar]
  48. Hair, J.; Anderson, R.; Tatham, R.; Black, W. Multivariate Data Analyses; Prentice Hall: Upper Sadle River, NJ, USA, 2013. [Google Scholar]
  49. Stevens, J. Applied Multivariate Statistics for the Social Sciences; Lawrence Erlbaum Associates: Mahwah, NJ, USA, 2009. [Google Scholar]
  50. Ringnér, M. What Is Principal Component Analysis? Nat. Biotechnol. 2008, 26, 303–304. [Google Scholar] [CrossRef]
  51. Webster, R.; Oliver, M. Geostatistics for Environmental Scientists, 2nd ed.; Statistics in Practice; John Wiley & Sons, Ltd.: Chichester, UK, 2007. [Google Scholar]
  52. Marquardt, D.W. An Algorithm for Least-Squares Estimation of Nonlinear Parameters. J. Soc. Ind. Appl. Math. 1963, 11, 431–441. [Google Scholar] [CrossRef]
  53. Jacoby, W.G. Loess:: A Nonparametric, Graphical Tool for Depicting Relationships between Variables. Elect. Stud. 2000, 19, 577–613. [Google Scholar] [CrossRef]
  54. SPSS. SPSS 17.0 Command Syntax Reference. 2007. Available online: http://www.spss.com (accessed on 27 July 2019).
  55. Wang, C.; Liu, H.; Zhang, Y.; Zou, C.; Anthony, E.J. Review of Arsenic Behavior during Coal Combustion: Volatilization, Transformation, Emission and Removal Technologies. Prog. Energy Combust. Sci. 2018, 68, 1–28. [Google Scholar] [CrossRef] [Green Version]
  56. Yudovich, Y.E.; Ketris, M.P. Arsenic in Coal: A Review. Int. J. Coal Geol. 2005, 61, 141–196. [Google Scholar] [CrossRef]
  57. Khalili, N.R.; Scheff, P.A.; Holsen, T.M. PAH Source Fingerprints for Coke Ovens, Diesel and, Gasoline Engines, Highway Tunnels, and Wood Combustion Emissions. Atmos. Environ. 1995, 29, 533–542. [Google Scholar] [CrossRef]
  58. Meesenburg, H.; Riek, W.; Ahrends, B.; Eickenscheidt, N.; Grüneberg, E.; Evers, J.; Fortmann, H.; König, N.; Lauer, A.; Meiwes, K.J.; et al. Soil Acidification in German Forest Soils. In Status and Dynamics of Forests in Germany: Results of the National Forest Monitoring; Wellbrock, N., Bolte, A., Eds.; Ecological Studies; Springer International Publishing: Cham, Switzerland, 2019; Volume 237, pp. 93–122. [Google Scholar] [CrossRef] [Green Version]
  59. Ariese, F.; Swart, K.; Morabito, R.; Brunori, C.; Balzamo, S.; Slobodnik, J.; Korenková, E.; Janoš, P.; Wildnerova, M.; Hlavay, J.; et al. Leaching Studies of Inorganic and Organic Compounds from Fly Ash. Int. J. Environ. Anal. Chem. 2002, 82, 751–770. [Google Scholar] [CrossRef]
  60. Klose, S.; Makeschin, F. Chemical Properties of Forest Soils along a Fly-Ash Deposition Gradient in Eastern Germany. Eur. J. For. Res. 2005, 123, 3–11. [Google Scholar] [CrossRef]
  61. Škrbić, B.; Đurišić-Mladenović, N. Principal Component Analysis for Soil Contamination with Organochlorine Compounds. Chemosphere 2007, 68, 2144–2152. [Google Scholar] [CrossRef] [PubMed]
  62. Lasota, J.; Błońska, E. Polycyclic Aromatic Hydrocarbons Content in Contaminated Forest Soils with Different Humus Types. Water, Air, Soil Pollut. 2018, 229, 204. [Google Scholar] [CrossRef] [PubMed] [Green Version]
  63. Morillo, E.; Romero, A.S.; Madrid, L.; Villaverde, J.; Maqueda, C. Characterization and Sources of PAHs and Potentially Toxic Metals in Urban Environments of Sevilla (Southern Spain). Water Air Soil Pollut. 2008, 187, 41–51. [Google Scholar] [CrossRef]
  64. Bonelli, M.G.; Manni, A. Principal Components Analysis and Spatial Analysis Integration for Enhanced Assessment of Pollution Emission Sources. IOP Conf. Ser. Earth Environ. Sci. 2019, 227. [Google Scholar] [CrossRef]
  65. Klose, S.; Makeschin, F. Effects of Past Fly Ash Deposition on the Forest Floor Humus Chemistry of Pine Stands in Northeastern Germany. For. Ecol. Manag. 2003, 183, 113–126. [Google Scholar] [CrossRef]
  66. Klose, S.; Koch, J.; Bäucker, E.; Makeschin, F. Indicative Properties of Fly-Ash Affected Forest Soils in Northeastern Germany. J. Plant Nutr. Soil Sci. 2001, 164, 561–568. [Google Scholar] [CrossRef]
  67. Buck, H.F. Umweltpolitik und Umweltbelastung. In Die Wirtschaftliche und Ökologische Situation der DDR in den 80er Jahren; Kuhrt, E., Buck, H.F., Holzweißig, G., Eds.; Am Ende des realen Sozialismus; Leske + Budrich: Opladen, Germany, 1996; Volume 2, pp. 223–258. [Google Scholar] [CrossRef]
  68. Möller, D. Deposition Atmosphärischer Spurenstoffe in der Ehemaligen DDR bis 1990—Methoden und Meßergebnisse; Schriftenreihe der Kommission Reinhaltung Luft im VDI und DIN; VDI: Düsseldorf, Germany, 1992; Volume 18. [Google Scholar]
  69. Simon, K.; Westendorff, K. Stoffeinträge mit dem Niederschlag in Kiefernbestände des nordostdeutschen Tieflandes in den Jahren 1985–1989. Beitr. Forstwirtsch. 1991, 25, 177–180. [Google Scholar]
  70. Westendorff, K.; Simon, K. Depositionsuntersuchungen in Forstökosystemen (Tiefland). In Deposition atmosphärischer Spurenstoffe in der ehemaligen DDR bis 1990—Methoden und Ergebnisse; Möller, D., Lux, H., Eds.; Schriftenreihe der Kommission Reinhaltung Luft im VDI und DIN; VDI: Düsseldorf, Germany, 1992; Volume 18, pp. 223–233. [Google Scholar]
  71. Stöcker, G.; Gluch, W. Depositionscharakterisierung auf der Grundlage der Borkenindikation (Biomonitoring). In Deposition atmosphärischer Spurenstoffe in der ehemaligen DDR bis 1990—Methoden und Ergebnisse; Möller, D., Lux, H., Eds.; Schriftenreihe der Kommission Reinhaltung Luft im VDI und DIN; VDI: Düsseldorf, Germany, 1992; Volume 18, pp. 272–287. [Google Scholar]
  72. Kallweit, R.; Kaatzsch, S.; Strube, M.; Keller, E. Bioindikation über Kiefern und Fichtenborken; ZUG Umweltlabor: Wittenberg, Germany, 1985; (Unpublished Report). [Google Scholar]
  73. Heinsdorf, D.; Einert, P.; Fennert, A.; Schneider, R. Charakterisierung des atmogenen Fremdstoffeintrages in Kiefernökosysteme des Norddeutschen Tieflandes. Beitr. Forstwirtsch. Landschaftsökol 1992, 6, 24–29. [Google Scholar]
  74. Wellbrock, N.; Eickenscheidt, N.; Grüneberg, E.; Bögelein, R. Environmental Settings and Their Changes in the Last Decades. In Status and Dynamics of Forests in Germany; Wellbrock, N., Bolte, A., Eds.; Springer International Publishing: Cham, Switzerland, 2019; Volume 237, pp. 29–54. [Google Scholar] [CrossRef] [Green Version]
  75. Kopp, D.; Kirschner, G. Fremdstoffbedingter Standortswandel aus periodischer Kartierung des Standortszustandes in den Wäldern des Nordostdeutschen Tieflandes nach Ergebnissen der Standortserkundung. Beitr. Forstwirtsch. Landschaftsökol 1992, 26, 62–71. [Google Scholar]
  76. Hofmann, G.; Anders, S.; Beck, W.; Chrzon, S.; Matthes, B. Buchenwälder und ihr Vitalitätszustand in Ostdeutschland. Beitr. Forstwirtsch. 1991, 25, 157–168. [Google Scholar]
Figure 1. Map of the plots for investigation in the state of Brandenburg; NFSI 1,2 (POP) = sub-sample of the NFSI with analysis data on persistent organic pollutants.
Applsci 11 01189 g001
Figure 2. Scatterplots of the As, Cd, Cr, Cu, Ni, Pb and Zn concentrations and the effective cation exchange capacity (CECeff) at 0–5 cm and 5–10 cm soil depth, and smoothed adaption function (LOESS smoothing).
Applsci 11 01189 g002
Figure 3. Scatter diagrams of the PAH16 concentrations and As, Cd, Cr, Cu, Ni, Pb and Zn concentrations in the humus layer of NFSI sites in Brandenburg (NFSI-2), and regression function.
Applsci 11 01189 g003
Figure 4. Percentage cumulative frequency distribution of the HCH concentrations (sum of α -HCH, β -HCH, γ -HCH) of the nationwide NFSI sample in the humus layer; plots of the NFSI in Brandenburg are indicated by green circles.
Applsci 11 01189 g004
Figure 5. Percentage cumulative frequency distribution of the DDx concentrations (DDT and metabolites) of the nationwide NFSI sample in humus layer and 0–5 cm depth; plots of the NFSI in Brandenburg are indicated by green circles.
Applsci 11 01189 g005
Figure 6. Box plots of the contents of HCB, PAH16, PCB6, HCH, DDx and Dieldrin in the humus layers of pine stands differentiated according to stand age and crown condition (percentage needle loss); ° outliers, * extreme values.
Applsci 11 01189 g006
Figure 7. Box plots of the content of the PAH16 from individual analytes in the humus layer of pine stands differentiated according to stand age and crown condition (percentage needle loss); ° outliers, * extreme values.
Applsci 11 01189 g007
Figure 8. Box plots of the contents of As, Cd, Cr, Ci, Ni, Pb and Zn in the humus layers of pine stands differentiated according to stand age and crown condition (percentage needle loss).
Applsci 11 01189 g008
Figure 9. Calculated throughfall inputs of calcium for 1988 on the basis of pine bark samples on the grid of the forest condition survey of the former GDR (from: Riek et al. [38]).
Applsci 11 01189 g009
Table 1. Parameters of the multiple regression equations for the estimation of As, Cd, Cr, Cu, Ni, Pb and Zn concentrations in the topsoil (0–5 cm, 5–10 cm depth) from CECeff, pH(KCl), Corg and clay content; significance: * p < 0.05, ** p < 0.01.
Equation (1)
abcRF
As2.120 **-−0.798 *0.34**50.0
Cd0.160 **0.054 **−0.369 **0.65 **105.0
Cr3.280 **0.873 **−3.866 **0.49**44.8
Cu4.394 **0.489 **−6.121 **0.62 **179.0
Ni2.325 **0.929 **−4.406 **0.49 **45.7
Pb24.197 **−2.054 **−13.334 **0.65 **207.2
Zn18.633 **7.126 **−40.608 **0.60 **155.9
Equation (2)
abcdRF
As1.191 **0.096 *-0.598 *0.38 **24.0
Cd0.091 **0.0035 **0.061 *−0.278 **0.64 **65.8
Cr1.336 **0.342 **0.787 **−1.369 *0.50 **30.5
Cu2.566 **0.093 **0.453 **−2.741 **0.62 **119.2
Ni0.998 **0.222 **0.833 **−2.541 **0.54 **37.6
Pb15.56 **0.692 **−1.344 *−0.1500.70 **174.3
Zn9.778 **0.911 **6.448 **−24.513 **0.61 **107.7
Table 2. Correlation coefficients between PAH16 concentration and the As, Cd, Cr, Cu, Ni, Pb and Zn concentrations in the humus layers of Brandenburg NFSI sites differentiated for data from NFSI-1 (n = 36) and NFSI-2 (n = 50); significance: ** p < 0.01.
PAH16AsCdCrCuNiPbZn
NFSI-1 0.65 **0.69 **0.69 **0.74 **0.70 **0.54 **
NFSI-20.81 **0.52 **0.75 **0.71 **0.64 **0.71 **0.12
Table 3. Correlation coefficients between PAH16 indicators and inorganic pollutants in the humus layer; significance: * p < 0.05, ** p < 0.01.
 Aromatic RingsAsCdCrCuNiPbZn
Naphtalin20.81 **0.49 **0.76 **0.70 **0.59 **0.65 **0.04
Acenaphthylen30.78 **0.48 **0.76 **0.70 **0.58 **0.64 **0.08
Acenaphthen30.77 **0.52 **0.71 **0.69 **0.65 **0.71 **0.18
Fluoren30.81 **0.47 **0.78 **0.72 **0.62 **0.67 **0.07
Phenanthren30.80 **0.49 **0.74 **0.69 **0.61 **0.67 **0.10
Anthracen30.79 **0.51 **0.75 **0.73 **0.62 **0.70 **0.14
Fluoranthen30.80 **0.53 **0.74 **0.72 **0.64 **0.73 **0.17
Pyren40.80 **0.50 **0.74 **0.71 **0.62 **0.72 **0.17
Benz(a)anthracen40.75 **0.49 **0.68 **0.73 **0.65 **0.78 **0.25
Chrysen40.76 **0.58 **0.69 **0.77 **0.69 **0.79 **0.31 *
Benzo(b)fluoroanthen50.75 **0.54 **0.66 **0.74 **0.69 **0.80 **0.26
Benzo(k)fluoroanthen50.75 **0.53 **0.68 **0.75 **0.68 **0.78 **0.28 *
Benzo(a)pyren50.69 **0.50 **0.63 **0.73 **0.63 **0.76 **0.26
Indeno(1,2,3-cd)pyren60.73 **0.51 **0.64 **0.71 **0.61 **0.72 **0.30 *
Dibenz(a,h)anthracen60.73 **0.52 **0.64 **0.72 **0.64 **0.76 **0.30 *
Benzo(g,h,i)perylen60.74 **0.51 **0.65 **0.73 **0.64 **0.77 **0.29 *
mean 0.770.510.700.720.640.730.20
Table 4. Correlation coefficients between PCB6 concentration and the As, Cd, Cr, Cu, Ni, Pb and Zn concentrations in the humus layer of Brandenburg NFSI sites, differentiated for data from NFSI-1 (n = 36) and NFSI-2 (n = 50); significance: ** p < 0.01.
PCB6AsCdCrCuNiPbZn
NFSI-1 0.71 **0.56 **0.64 **0.66 **0.78 **0.70 **
NFSI-20.72 **0.53 **0.68 **0.70 **0.72 **0.84 **0.24
Table 5. Correlation coefficients between Dieldrin concentration and the As, Cd, Cr, Cu, Ni, Pb and Zn concentrations in the humus layers of Brandenburg NFSI sites differentiated for data from NFSI-1 (n = 36) and NFSI-2 (n = 50).
DieldrinAsCdCrCuNiPbZn
NFSI-1 0.110.120.13−0.010.010.15
NFSI-20.02−0.060.140.150.070.15−0.07
Table 6. Correlation coefficients between HCB concentration and the As, Cd, Cr, Cu, Ni, Pb and Zn concentrations in the humus layers of Brandenburg NFSI sites differentiated for data from NFSI-1 (n = 36) and NFSI-2 (n = 50); significance: * p < 0.05, ** p < 0.01.
HCBAsCdCrCuNiPbZn
NFSI-1 0.35 *0.67 **0.61 **0.64 **0.54 **0.29
NFSI-20.80 **0.48 **0.72 **0.62 **0.57 **0.65 **0.01
Table 7. Correlation coefficients between HCH concentrations (sum of α -HCH, β -HCH, γ -HCH) and the As, Cd, Cr, Cu, Ni, Pb and Zn concentrations in the humus layers from Brandenburg NFSI plots differentiated for data from NFSI-1 (n = 36) and NFSI-2 (n = 50); significance: ** p < 0.01.
HCHAsCdCrCuNiPbZn
NFSI-1 0.180.61 **0.58 **0.57 **0.54 **0.27
NFSI-20.300.010.36 **0.230.250.26−0.13
Table 8. Correlation coefficients between DDx concentrations (sum of DDT and its metabolites) and the As, Cd, Cr, Cu, Ni, Pb and Zn concentrations in the humus layer of the Brandenburg NFSI locations differentiated for data of NFSI-1 (n = 36) and NFSI-2 (n = 50); significance: * p < 0.05, ** p < 0.01.
DDxAsCdCrCuNiPbZn
NFSI-1 0.320.40 *0.51 **0.46 **0.59 **0.45 **
NFSI-20.240.280.39 *0.38 *0.40 *0.54 **0.03
Table 9. Correlation coefficients between organic and inorganic pollutants in the humus layer and the first three factors resulting from principle component analysis after Varimax rotation with Kaiser normalization (NFSI-2, n = 50).
Parameter Principle Component
123
HCB [ng/g]0.90  
As [ppm]0.89  
Cr [ppm]0.86  
PAH16 [ng/g]0.82  
Ni [ppm]0.690.52 
Pb [ppm]0.560.530.44
Zn [ppm] 0.82 
Cd [ppm]0.490.74 
Cu [ppm]0.600.61 
DDx [ng/g]  0.80
Dieldrin [ng/g]  0.70
PCB6 [ng/g]0.410.480.64
HCH [ng/g]0.45 0.58
Table 10. Correlation coefficients between the pollutant concentration of the humus layer and the estimated Ca deposition from the NFSI plots for the reference year 1988 (kg/ha/a); significance: * p < 0.05, ** p < 0.01.
Parameter of the Humus LayerCorrelation Coefficient
Principle component 1 (cf. Table 9)0.60 **
Principle component 2 (cf. Table 9)−0.05
Principle component 3 (cf. Table 9)0.15
As [ppm]0.48 **
Cd [ppm]0.18
Cr [ppm]0.54 **
Cu [ppm]0.43 **
Ni [ppm]0.30 *
Pb [ppm]0.25
Zn [ppm]−0.04
HCB [ng/g]0.56 **
PAH16 [ng/g]0.59 **
PCB6 [ng/g]0.39 **
HCH ( α -, β -, γ -HCH) [ng/g]0.51 **
Table 11. Correlation coefficients between 16 PAH indicators in the humus layer and estimated Ca deposition at the NFSI plots for the reference year 1988 (kg/ha/a); significance: * p < 0.05, ** p < 0.01.
PAH16 [ng/g] in Humus LayerCorrelation Coefficient
Naphtalin0.63 **
Acenaphthylen0.64 **
Acenaphthen0.64 **
Fluoren0.65 **
Phenanthren0.65 **
Anthracen0.62 **
Fluoranthen0.57 **
Pyren0.58 **
Benz(a)anthracen0.49 **
Chrysen0.45 **
Benzo(b)fluoroanthen0.41 **
Benzo(k)fluoroanthen0.44 **
Benzo(a)pyren0.46 **
Indeno(1,2,3-cd)pyren0.41 **
Dibenz(a,h)anthracen0.43 **
Benzo(g,h,i)perylen0.44 **
Publisher’s Note: MDPI stays neutral with regard to jurisdictional claims in published maps and institutional affiliations.

