1. Introduction
Analysis of workload execution and identification of software and hardware performance barriers provide critical engineering benefit; these include guidance on software optimization, hardware design tradeoffs, configuration tuning, and comparative assessments for platforms. In this paper, we describe the microarchitecture performance analysis of Primate Lab’s mobile performance evaluation workload, called Geekbench. This analysis can explain the weaknesses of the experimental workload. For example, it can easily achieve the maximum performance on certain devices with only bigger cache sizes which are not actually needed in most real-world cases. This means that the change of data set size directly impacts performance score significantly in some systems and will ruin the fairness of the CPU benchmark. Some devices will get the benefit without overall system enhancements.
Geekbench is one of the most well-known CPU-intensive cross-platform benchmarks. Geekbench ver. 5 is Primate Labs’ latest version which generates comparable performance numbers on various architectures (e.g., x86, ARM, and Apple) in relatively fair implementation, with a scoring system that separates single-core and multi-core performance. Most of Geekbench’s workloads are synthetic but some workloads aim to simulate real-world runtime scenarios.
As one of the most popular mobile software platforms, Android provides a development environment for Android developers to develop Android applications. Additionally, to have maximum performance, Android NDK is provided. It is a C/C++ compiler for multi-platforms including ARM architecture-based platforms. The NDK uses the Clang compiler to compile C/C [
1]. The Android version of Geekbench has been compiled in NDK to get maximum performance.
Unlike performance studies on desktops or servers, mobile performance studies on common workloads have not been widely researched. In particular, it is hard to find microarchitecture studies in mobile devices since hardware-supported performance profile features are generally hidden when the devices are released commercially. In our study, we have enabled the performance monitoring unit (PMU) register counters of a Samsung Exynos9820 for profiling on Geekbench. Exynos9820 is a mobile device system on chip (SoC) with tri-cluster architecture. Each cluster consists of two big cores, two medium cores, and four little cores.
PMU counters have been widely used in x86 architectures. However, in mobile SoCs, such a study has not been performed since the SoC vendors should enable the PMU counters. However, many of them are disabled when they provide them to the end customers. Our study experimented with enabled PMU counters and used a customized DS5 profile tool.
The main part of this paper describes the common performance metrics for characterizing Geekbench’s performance behavior. The hardware profile uses PMU registers. PMUs are hardware performance counters which are built-in microprocessors to store the counts of hardware-related activities within systems. With the collected PMU data, the explained characteristics include instructions per cycle (IPC), cache-related counters, branch prediction-related counters, translation look aside buffer (TLB)-related counters, and other performance-related counters. All these counters are strongly related to runtime performance.
ARM DS5 is used for collecting PMU events. In DS5, a Streamline profiler provides source-level analysis on Android platforms. It uses hardware performance counters to present detailed aspects of program performance. In our experiment, sampling data of PMU events are collected through the gator daemon, which enables us to gather PMU register values.
For evaluating the performance, key performance metrics are described. First, runtime instruction distribution is explained. It gives the overall characteristics of Geekbench. Second, measured IPC numbers are described. Some high IPC numbers come from Geekbench’s synthetic characteristics. Third, cache studies are explained in detail. Cache subsystem efficiency can impact the Geekbench score significantly. Next, branch performance is discussed. Many object-oriented programs (OOPs) struggle with branch implementation since a large number of branch invocations characteristic of OOPs.
The remainder of this paper is organized as follows.
Section 2 explains the details of related works and the motivation.
Section 3 introduces Samsung’s custom Exynos9820 SoC.
Section 4 briefly describes the most popular mobile workloads.
Section 5 covers the tools and experiments in detail. In
Section 6, experimental data are summarized and discussed. The last section presents the conclusion of this paper.
2. Motivation
From the performance perspective, the current architectural roadmap for smartphone platforms has largely followed its desktop predecessors—cramming more and more architectural features, such as branch predictors or cache prefetchers, and putting more and more cores on the same die [
2]. However, there are only a few studies of the performance effects on decent mobile microarchitectures. Microarchitecture analysis is a key performance enhancement process that identifies inefficient performance bottlenecks.
We use Geekbench ver. 5 as an experimental workload. Geekbench is a well-known mobile SoC performance benchmark. There is currently no detailed performance study on version 5. However, in a previous study, a test was performed on non-mobile architecture. It was tested under x86 platforms. For collecting microarchitecture events, this study uses Intel’s performance profiler called VTune for collecting microarchitecture PMU events on Windows 10. For Linux, Linux provides a VTune-relevant tool called Perf. This is a command-line tool that has more flexibility to build automated profiling scripts [
3].
The presented performance metrics explain the architectural behavior of Geekbench during runtime. This will help mobile benchmark developers to design workloads more carefully with the studied architectural characteristics. It will also help to prevent developing for a specific favored architecture design.
3. Tested Device
In the experiment, we select a Samsung Galaxy 10+ with Exynos9820 (8nm) as the target device to analyze mobile behavior on Geekbench 5. Exynos9820 is Samsung’s ARM v8 architecture compatible mobile SoC. All the Hardware (HW) features can be enabled including PMUs. This is the main reason why we choose the Exynos9820 device as the experimental device. Recently, Exynos9820 was placed on Samsung’s S10 premium smartphones. The hardware specification of the test device is shown in
Table 1 [
4].
4. Mobile Device Workloads
This paper describes a detailed analysis of a mobile performance benchmark. Benchmarking is a method of measuring performance against a standard or given set of standards. Processor performance depends on the types of workload used, and designers typically use benchmark suites with the initial assumption that the workloads they provide are representative of user programs [
5]. In the field of benchmarking, there are three types of benchmark to in general [
6,
7]:
- -
Synthetic benchmarks (e.g., Whetstone Benchmark, Dhrystone Benchmark, etc.) developed to measure system-specific parameters (by CPU, compiler, and so on).
- -
Application-based benchmarks (“real-world” benchmarks) developed to compare different system architectures in the same real application fields.
- -
Algorithm-based benchmarks (a compromise between the first and the second type) developed to compare different system architectures in special (synthetic) fields of application.
In mobile worlds, there are many performance benchmarks but only a few are accepted as industrial standard benchmarks. Among them, Geekbench is a commonly referenced workload. Geekbench is mainly focused on CPU. It also provides GPU workloads but it is located in a separate space. It is called compute benchmark.
Geekbench is a CPU-centric Primate Labs benchmark. It is widely used in mobile contexts for evaluating CPU performance. Cross-platform compatibility is a key reason for its wide usability. The covered platforms are Linux, Windows, iOS, macOS, and Android [
8]. Geekbench’s binary size is relatively small since most workloads are synthetically designed with small size code. Its runtime is about 90 s on premium devices (e.g., Galaxy S10+). As the most recent version, Geekbench ver. 5 is divided into two categories: CPU benchmark and compute benchmark for GPU. In this paper, we will focus only on the CPU benchmark of Geekbench ver. 5. Geekbench’s CPU benchmark contains a single-core test and multi-core test and each consists of 21 workloads sorted by crypto, integer, and floating-point workload. The details are in
Table 2.
The overall performance score consists of three sections. Each section has its weight which is decided by Primate Labs, but the weight allocation logic is not clear. The scoring weights are crypto 5%, integer 65%, and floating point 30%. The weights have been changed from the previously released official versions. This might be an issue since the competitive scores are directly affected by the designed weights.
5. Tool
To collect profiling data, there are choices for analyzing tools, including Google’s Simpleperf and ARM’s DS5 Streamline Performance Analyzer. Simpleperf is a light and simple open-source tool. Google introduced Simpleperf as a native CPU profiling tool for Android. It can be used to profile both Android applications and native processes running on Android. However, we have chosen ARM DS5 since it provides more professional features and Simpleperf has limitations when gathering events in the Samsung custom-built Exyno9820 SoC. In our experiment, we used a Samsung Galaxy 10+ with Exynos9820 SoC since we can enable all hardware profile features as required. This is not allowed for public users. Additionally, ARM provides special features for Samsung custom SoCs in DS5.
DS5 is a microarchitecture profile capable tool for ARM architectures. Common mobile devices are equipped with ARM instruction set architecture (ISA)-compatible SoCs. DS5 provides more detailed functions, such as time- and event-based sampling, performance counter monitoring, functional call graph, and kernel level analysis. In our experiment, sampling data of PMU events are collected through the gator daemon, which is connected to the kernel. The one of reasons for using DS5 is filtering that can set the exact range from the entire execution.
In most previous microarchitecture studies on common workloads, Intel’s VTune performance profiler has been used. Intel
® VTune™ Profiler collects key profiling data and presents it with an interface that simplifies their analysis and interpretation [
3].
DS5 gathers performance events more precisely compared to open-source tools. It provides the capability of setting an accurate range of the target runtime with several view options: live view, timeline view and table view. With the table view, we can analyze functional hotspots. DS5 counts the number of invocations of targeted PMU events and displays charts of the data during the capture session in the live view and timeline view, which provides additional information in a panel [
9]. To enable the profiling on the target device, it needs a gator daemon to communicate with the kernel of the target system. Streamline application in DS5 provides a pre-built gator, but a user can also build a customized gator daemon by modifying the .xml file. After the gator daemon is ready, root privilege is required on the target device and then the gator daemon can detect defined PMU events.
Table 3 lists collected PMU events and explanations. In
Table 4, the key performance index (KPI) is listed with formulas.
6. Experiment
This paper mainly discusses the single-core behavior of the CPU benchmark on Geekbench ver. 5. We only consider the single-core test for a clear understanding of the analysis. Unlike for desktop, mobile multi-core execution is not aiming for maximum multithread performance as the primary goal. In general, it tries to allocate low utilized tasks into low-frequency CPU cores, called mid-core or little core. The main concern is the power consumption rather than the peak performance. Geekbench is the most referenced mobile performance benchmark but its multi-core implementation is too synthetic. There is no such a multi-core behavior in real-world scenarios. That is a reason why we exclude the multi-core section from the experiment.
Additionally, the multi-core test may cause blended results due to the scheduler, multi-core parallelism, and others according to the design strategy [
10]. In other words, the single-core test would be a clearer approach to follow up the mobile device behavior of Geekbench. In our experiment, the single-core test is only considered for a big core in an SoC since the running thread of a single core workload is allocated to a big core. All the presented data in the paper are from the big core PMU events.
In the experiment, the customized gator was used for the test for enabling the profile daemon. A limitation of the tool is that the target device can collect only six PMU counters at a time. To extract reasonable data, the test examines three criteria: (1) the active thread is monitored to decide the proper range to collect data in the graph; (2) the score gap between individual command line run and overall Android application package (APK) run. If the gap is larger than the run-to-run variation, we need to reconsider the use of collected data. There would be thermal throttling impact during the run; (3) clock count is also used to know whether it is the right one.
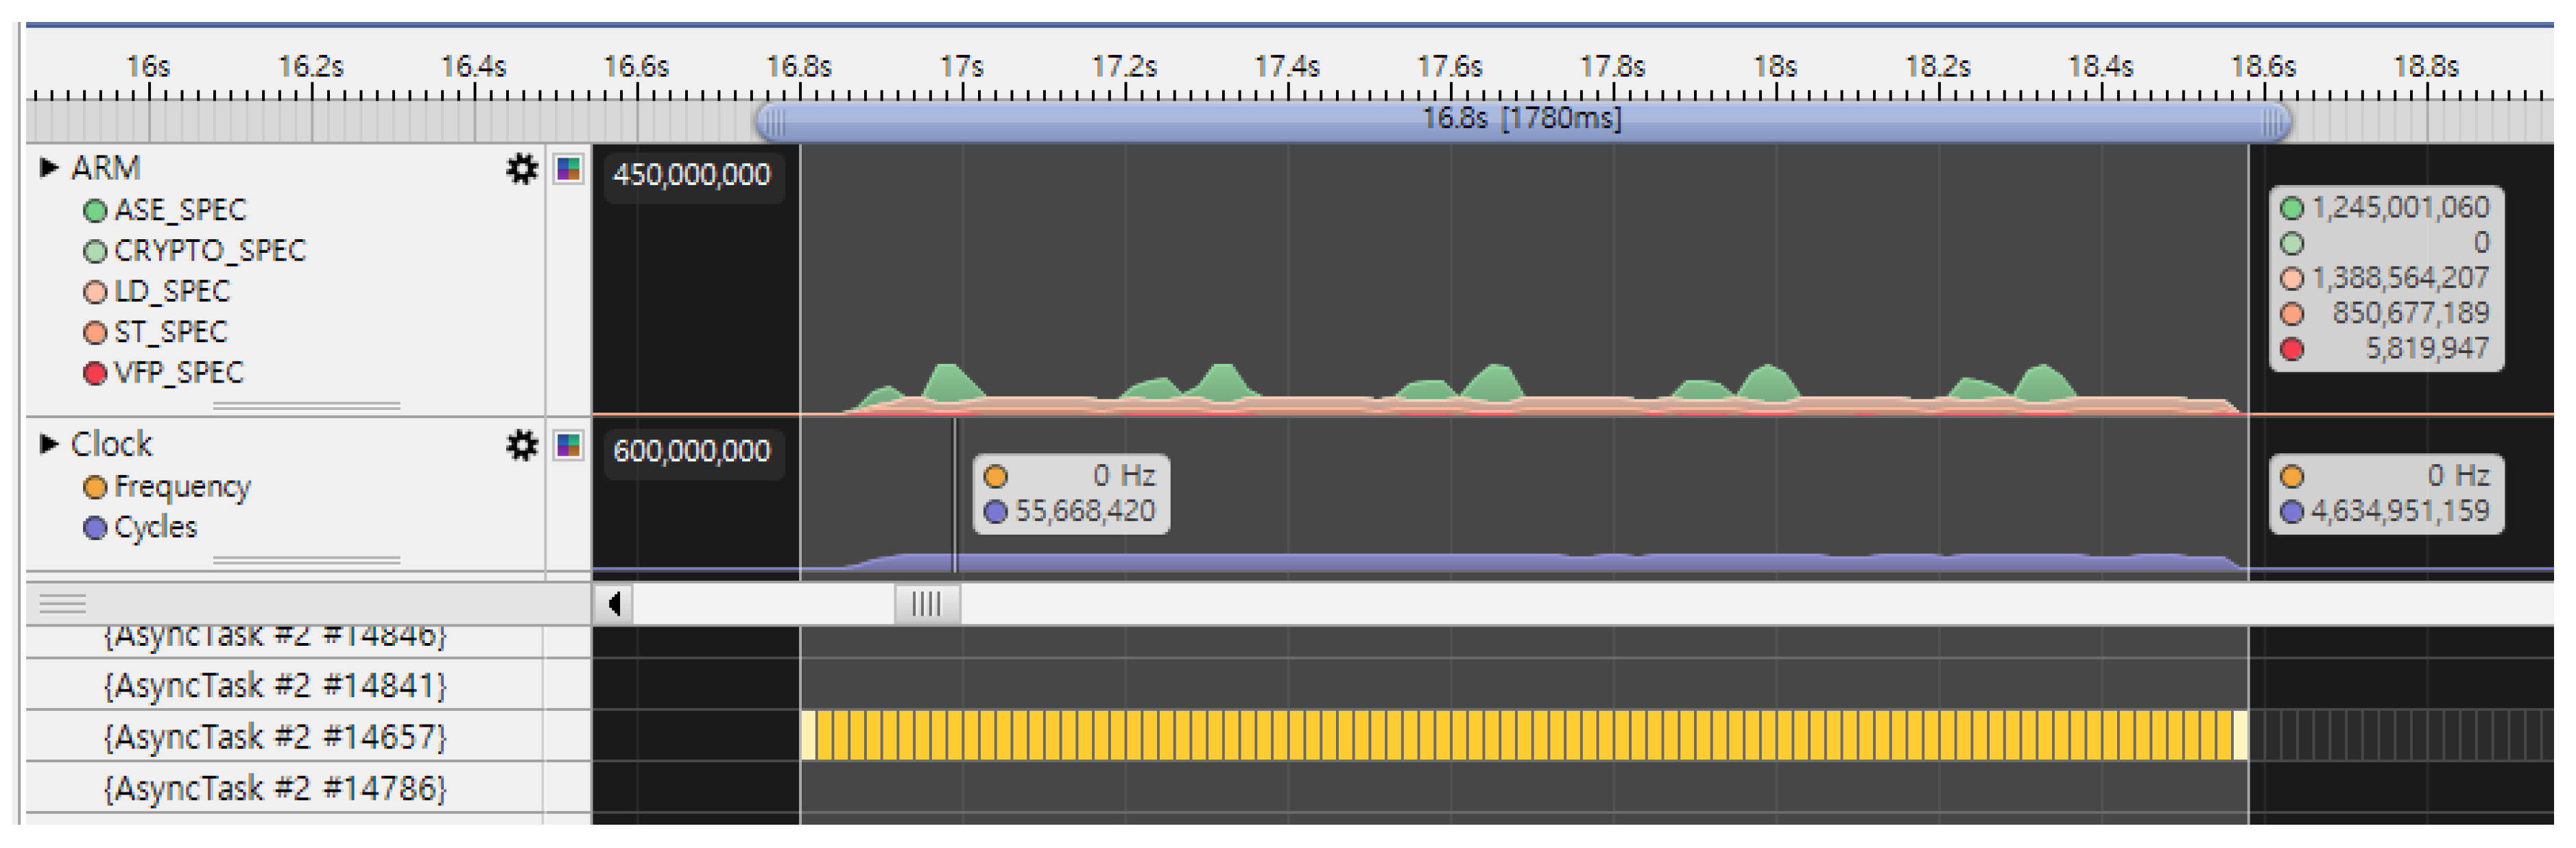
Geekbench generates a primary running thread for every workload in the single-core test. We examine the thread as the first criterion to distinguish the start point and the end point of the tested area. The DS5 tool adopts a sampling method for minimizing the runtime load when it collects profile data. The sampling method does not make it possible to collect identical data on every run. However, the characteristics are the same in common cases.
Figure 1 shows the main running thread (yellow bar) in image compression as an example.
We tried to collect reliable microarchitecture data by upholding the above three standards. The detailed experimental results are discussed in the following sections.
7. Results
Our experiment gathers events in the sampling method as explained. The sampling period specifies the number of such events that are allowed to occur between two samples. In this experiment, we set 10 ms as the default. After several trials of the test, the experimental results are close to reliable data.
Table 5 shows the summarized result of instruction mix, cache performance, IPC, branch performance, and bus access. The instruction mix explains instruction-level stress. Here, we can see that integer instructions are the most executed operations. L1, L2, and L3 cache performances are also described. However, the overall cache performance is not quite meaningful since there are three distinct sections in Geekbench 5. For IPC, if the IPC number is high (bigger than 1.5), this means the workload is more likely to be a synthetic workload or highly optimized workload. In real-world apps, IPCs are generally from 0.5~1 based on our previous study. We also studied the overall branch impact. The experimental result explains that the branch performance impact is minimal. However, some low branch performance workloads need to consider branch improvement.
In the following sections, we describe the details of microarchitecture analysis, which includes instruction mix, IPC, cache, branch, and other performance-related events.
7.1. Instruction Mix
Table 6 shows the instruction mix of individual workloads in crypto, integer, and float. In crypto (AES-XTS), the crypto instruction occupies 20% but the major operation is integer (25%). In the integer section, the integer instruction consumes up to 83% of the total executed instructions. In particular, in text compression, it mostly computes integer numbers and a few loads/stores.
As one of Geekbench’s synthetic runtimes, float workloads force float computation load to SIMD and vector floating point (VFP). Even in this case, it still requires significant integer operations. It occupies up to 70% of total instruction distribution. Compared to other CPU benchmarks, we can hardly say that Geekbench ver. 5 float workloads are a well-presented floating operation. Some workloads invoke more integer operations rather than float operations. Face detection, horizon detection, structure of motion, image inpainting, and speech recognition show higher instruction mix proportions in integer.
We have studied microarchitecture behavior on common mobile benchmarks and real-world apps. For profiling float operations, heavy float point invocation workloads are hardly seen in real-world apps. Geekbench ver. 5 float workloads generate continuous float computation loads on the float section. This occupies up to 50% of total instruction executions. However, some workloads are lower than 20%. In particular, speech recognition only consumes 13% of float instructions whereas 67% of runtime is integer operation. For this case, we may suggest that speech recognition should be located in the integer section.
7.2. IPC
IPC is a critical performance metric in common microprocessors. It analyzes execution time as a product of instruction count. It evaluates the level of instruction-level parallelism. Without instruction-level parallelism, a processor can only issue less than one instruction per clock cycle (IPC < 1) [
11].
Figure 2 is the IPC for Geekbench workloads. In general, a CPU-centric benchmark’s IPC number tends to bigger than one. Similarly, Geekbench 5 shows an average of 2.0 IPC. In
Figure 2, the highest number is 3.4 IPC on high dynamic range (HDR). It means that HDR runtime seems to be highly optimized. To have a high IPC number, key microarchitecture performances are required to be good, including cache and branch. HDR’s L1 D-cache miss rate is less than 1.2% and the misses per kilo-instruction (MPKI) number is only 2.5. Additionally, there is minimum branch performance impact. Branch MPKI is about 0.1.
There are four workloads (text compression, navigation, N-body physics, and speech recognition) that have IPC lower than 1. These workloads are memory subsystem dependent. It implies that cache performance is critical to maximizing the benchmark score. In our study, N-body physics occupies 37% of memory operations from the entire execution. The L1 D-cache miss ratio is up to 13% in the experiment. There was no such behavior in the previous CPU benchmark study [
12]. This experiment implies that the size of input data contributes to the performance score significantly due to cache efficiency. If benchmark vendors ignore the impact of cache sensitivity on CPU benchmarks, a specific architecture may be favored (e.g., large cache architecture CPU).
7.3. Cache Performance
Data in traditional “caching” data systems reside in secondary storage and are read into the main memory only when operated on. This limits system performance. Main memory data stores with data always in the main memory are much faster. For this, we analyze the cache subsystem impact on Geekbench 5. The major key metrics of the cache are miss ratio and cache MPKI. Previously, there were studies on cache performance with PMU analysis but mostly on desktop or server systems. The commonly tested benchmark is SPEC CPU (current version is 2017). The SPEC CPU
® 2017 benchmark package contains SPEC’s next-generation, CPU-intensive suites for measuring and comparing intensive computation performance, memory subsystem, and compiler, and stressing a system’s processor [
13].
In a published SPEC2017 study, the average L1, L2, and L3 cache miss rates are 3%, 2%, and 14%, respectively. In SPEC2017, the integer section exhibits higher cache miss rates than the float section [
12]. In most SPEC2017 workloads, the cache subsystem performance impact is minimal.
Figure 3 is L1D cache MPKI and miss ratio.
Overall, the L2 cache miss ratio is about 18% and MPKI is 36. Cache performance on L2 and L3 is correlated with L1 performance. N-body physics (301), Gaussian blur (303), and speech recognition (312) show low performance on L2 and L3 as well as on L1. In this case, a workload performance score is varied with input data set size since the tested devices’ cache subsystem architectures are not the same. The L2 and L3 details are in
Figure 4,
Figure 5,
Figure 6 and
Figure 7.
7.4. Branch
As a feature of object-oriented programming in common mobile platforms, branch predictors have a major role to improve the instruction pipeline’s efficiency. The branch prediction accuracy is critical for this. Inefficient branch prediction performance may cause serious wasting of clock cycles.
After the branch prediction performance study on Geekbench 5, we could conclude that branch performance impact is not as critical as cache. The measured branch MPKI is up to 15 and its average is 2.7. The average branch prediction hit ratio is about 98%. In common cases, we may need to consider branch performance if MPKI is higher than 20.
Figure 8 displays the measured data.
In the study, the relatively high MPKI workloads are text compression (201), navigation (203), N-body physics (301), and speech recognition (312). Among them, text compression (201) shows the lowest branch prediction performance. However, the improvement of branch performance does not help much in improving performance scores. Mostly, it would be less than 1%.
7.5. Other Performance Metrics
Along with the above performance-critical PMUs, cache translation lookaside buffer (TLB) misses and bus access per clock cycle (BAPCC) were measured to provide additional information.
A TLB stores the recent translations of virtual memory to physical memory and can be called an address translation cache [
14]. The location of the TLB is between the CPU and the CPU cache. The access of the TLB is essential in modern architecture to perform optimized parallel lookup with cache access. If a TLB miss occurs, it requires a page table check. This causes additional run cycles in the system. In Geekbench 5, the average L1 data cache TLB hit ratio is 99.4%. This means that the TLB is not a component to be enhanced.
The number of BAPCC implies whether the tested workload is back-end bound. N-body physics, Gaussian blur, inpainting, and speech recognition generate relatively high BAPCC (range 0.16–0.19). The cache performances of those workloads are low (range 33–68).
8. Conclusions
In this paper, Geekbench ver. 5 microarchitecture has been studied thoroughly. The experimental characteristics include instruction mix, IPC, cache, branch, and other performance-related PMUs. Previously, there were limited studies on desktops or servers with non-mobile workloads (e.g., SPEC CPU). The tested platforms are mostly Intel’s x86 architecture. In our study, we thoroughly analyze a mobile device microarchitecture with Geekbench 5 as a CPU-intensive benchmark.
The presented tables and figures compare the characteristics of Geekbench 5’s workload. We began the study by analyzing the instruction distribution. Overall, integer operations are the major invocation. Even in the float section, the integer operations are significant. After we thoroughly studied Geekbench 5, we understood the brittleness of workloads, especially in the cache sub-system. It means that the change of data set size directly and significantly impacts performance scores in some systems.
Our experiment was done on Geekbench 5’s single-core workloads. We know that a multi-core study would be worth it. However, Geekbench 5’s multi-core workloads can be easily optimized to have maximum performance. As in our experiment, a simple round-robin thread scheduler can achieve maximum performance. However, most multi-core runtime cases require energy aware scheduling (EAS). It means that power consumption should be primarily considered as for real-world use cases.
There are studies about minimizing the multi-core energy consumption in a heterogeneous system like Exynos9820. They present power consumption, response time, and energy consumption models for mobile platforms. Using these models, the energy consumption of baseline platforms under power, response time, and thermal constraints was optimized with and without introducing new resources [
15].
The next planned experiment will be on an integrated test benchmark that does not test only the CPU but also other components, like memories, Input Output (IOs), and Graphics Processing Unit (GPUs). After the comparative study is completed, users will understand more about the mobile architecture behavior, and this will help to evaluate which benchmark is preferable for fair performance comparisons. This will challenge the appropriateness of the benchmark in mobile worlds.


