Article

Design of a Coplanar Interlayer Gapped Microstrips Arrangement for Multi-Nuclei (1H, 19F, 31P, and 23Na) Applications in 7T MRI

Department of Biomedical Engineering, Medical Campus, Gachon University, Incheon 21936, Korea
Appl. Sci. 2021, 11(3), 957; https://doi.org/10.3390/app11030957
Submission received: 24 December 2020 / Revised: 15 January 2021 / Accepted: 19 January 2021 / Published: 21 January 2021
(This article belongs to the Section Applied Biosciences and Bioengineering)

Abstract

:
Seven Tesla Magnetic Resonance (MR) systems can obtain high quality anatomical images using protons (1H) and can be used for multinuclear imaging and MR spectroscopy. These imaging modes can also obtain images and metabolic information using other nuclei, such as 19F, 31P, and 23Na. Here, we present an RF coil unit using a microstrip capable of resonating at four frequencies: 300 (1H), 280 (19F), 121 (31P), and 78 (23Na) MHz. The RF unit consists of a single feeding port and four lines that resonate and run a current at their respective frequency. We used the gapped microstrip concept to isolate each conducting line and interleaved the dielectric materials used for each line, thereby reducing the coupling between them. We also analyzed this design using electromagnetic (EM) simulations, and found that the quad tuned arrangement produced low coupling between adjacent current lines and achieved a uniform |B1| field in the z-y plane.

1. Introduction

1.1. Multinuclear MRI

Magnetic resonance imaging (MRI) systems with a strong main magnetic field, B0, such as 7T MRI scanners, can produce highly detailed anatomical images [1,2,3,4]. The increase in B0 not only affects the number of spins available for excitation, but also the Larmor’s frequency at which the spins enter into resonance [5,6,7]. This increase in the Larmor frequency and the number of spins for excitation also allows additional nuclei besides protons (1H) to be used for acquiring MR images; this phenomenon is referred to as multi-nuclei MR imaging [8,9,10,11,12,13] or X-nuclei MRI. As X-nuclei MRI can be used for diagnosing early stage cancers, tumors, lesions, and pathogens, it has become a widely studied technique in recent years. Sodium 23Na, phosphorus 31P, and fluorine 19F are among the most used nuclei for X-nuclei imaging.
Various applications have been proposed for X-nuclei MRI and MRI spectroscopy (MRIS). Several studies have shown that 23Na imaging can be used to examine multiple sclerosis, cartilage degradation, strokes, and tumors [14,15,16,17,18]. It is most commonly applied to the brain and knee regions; in addition, some studies have also been done in kidneys due to the high local 23Na concentrations [19]. Reports have shown that 31P MR spectroscopy can be used to study metabolism in the human body [20], including the biochemistry of cells such as adenosine triphosphate (ATP), adenosine diphosphate (ADP), and phospohocreatine. 31P MRIS has been applied to the heart [21,22], brain [23,24,25], breast [26], neck [27], and even to small animals [28]. While the concentration of 19F in the body is limited, there are some applications for these nuclei when used in combination with MRI. For instance, 19F has been used to study tumors in mice, monitor inflammation after cardiac and cerebral ischemia, image the gastrointestinal system, and track stem cells [29,30,31].

1.2. X-Nuclei RF Coils

To perform multinuclear MRI, RF coils that can operate at the required frequencies must be designed [32]. In general, the RF coils in MR must be capable of transmitting uniform RF fields and exhibit strong field intensity. The use of multiple elements tuned at different frequencies is restricted by the geometry of the coil. Coil elements located close to the subject exhibit stronger field intensity in their relationship to the input power, while coil elements positioned far from the subject have lower field intensity. Field distribution is also affected by the geometry and position of the coil elements [33,34]. For this reason, the coil elements should ideally be located in the same plane, and it is desirable to have a single structure capable of resonate and generating uniform |B1| fields at different frequencies.

1.3. Microstrip Coils in MRI

The use of microstrips in MRI has been proposed and utilized by many researchers [35,36,37,38]. The use of stronger magnets requires operation at higher frequencies, which in turn reduces the electrical wavelength, making it possible to use microstrip technology. For microstrips to be used in MRI applications, they must be able to transmit magnetic fields with uniform distributions along the geometry of the coil [39]. The element should also operate at the resonant frequency. The field intensity and field penetration are also important. For this reason, microstrip elements for MRI must be designed with optimized geometry and by taking the wavelength limitation into consideration. The wavelength of the microstrip is proportional to its geometry and effective dielectric constant.
In this work, we analyzed and designed a single structure capable of resonating at different frequencies based on an interleaved gapped microstrip arrangement that consists of four strip lines. Each of the lines were tuned to a specific frequency corresponding to the Larmor frequency of an X-nuclei and proton, namely 1H, 23Na, 31P, and 19F. The corresponding frequencies at 7T are 300, 280, 121, and 78 MHz, respectively. The microstrip arrangement consisted of interleaving dielectric materials with low relative permittivity for the lines operating at higher frequencies, and high relative permittivity for the low frequencies lines. The lines and dielectric materials were placed in an interleaving manner to reduce coupling between the frequencies. Each line was tuned with a loading capacitor. The goal was to obtain a uniform longitudinal |B1| field at the respective frequencies. The coupling between the lines was reduced by leaving a gap between the excitation line and the current line.
The proposed design has the capability to operate at four different frequencies; consequently, it can be used for proton and X-nuclei imaging with magnetic resonance. The design of coplanar elements is not in the same plane, which is an advantage over traditional multiple frequency RF coils, in which the coils are located at different distances or layers. The proposed design also has the potential to be used in simultaneous multinuclear MRI acquisition.

2. Materials and Methods

The use of microstrips as transmission lines has been well studied for almost half a century, making them useful for new applications. The goal of this work was to design a single microstrip arrangement that is capable of operating at four frequencies. The initial idea was to arrange the four strips on top of a dielectric material; however, given that the strip lines would be in close proximity, high levels of coupling could be expected. Further, the tuning of the strip lines would become complicated, as multiple resonance modes would occur. Therefore, we chose to find a way to isolate each line as a function of the frequency. A gap was introduced between the source and the strip line; the gap, in combination with the dielectric constant and the loading capacitance, made it possible to run the current at the specified frequency. In order to reduce the coupling between the lines, we placed the strip lines with similar frequencies far from one another. From left to right, the operation frequencies were 300, 121, 280, and 78 MHz. The dielectric material was also split into four areas. The two dielectrics with the lower relative permittivity were placed under the strip lines that operated at higher frequencies, while the two with high relative permittivity were located under the strip lines that operated at low frequencies. By using this arrangement, we were able to reduce the coupling and obtain a uniform field distribution, or propagation constant along the strip lines.

2.1. Gapped Microstrips

The use of gapped microstrips has previously been proposed [40,41,42], including demonstrations of the analytical method and use in several applications. In a study by Minoru Maeda [43], a theoretical expression for the equivalent circuit’s parameters was proposed by solving a Green function. The circuit equivalence of a gapped microstrip can be expressed using a pi circuit, where the Ca is the shunt capacitor and the Cb is the series capacitance produced by the coupling effect between nearby strip lines. The equivalent circuit is given by:
C e = C a + 2 C b ;   C m = C a
where the subscript e and m indicate the precedence of an electric and magnetic wall in the middle of the gap, respectively. The solution for the capacitance in the strip line was found by solving the Green’s equations. A more common approach to solve the capacitance has also been proposed [44,45,46], which also describes the problem as two conductor lines with open ends and a series coupled capacitance between them, as shown in Figure 1a. The circuit representation is also a Pi network (Figure 1b), Cs is the gap capacitance, and Cp1 and Cp2 are the shunt capacitors. The solution to the capacitors is given by:
C s = 500   h exp 1.86 s h Q 1 1 + 4.19 1 exp 0.785 h W 1 W 2 W 1
C P 1 = C 1 Q 2 + Q 3 Q 2 + 1
C p 2 = C 2 Q 2 + Q 4 Q 2 + 1
where W1 and W2 are the width of the conductor lines, h is the height of the dielectric material, and s is the size of the gap between the lines. The coefficients Q1 to Q5 are given in Reference [47], which are in relationship the width W1 and W2 of each gap, the height and the effective relative permittivity of the dielectric material, the length of the microstrip and the open capacitance of the microstrip.
The previous analysis and theory showed that gapped microstrips are viable, and could be used for our final design. Further, the series capacitance could be used in combination with the loading capacitance to ensure the microstrip lines operated at a specific frequency.
A gapped microstrip line can be used in MRI applications if the line resonates at the respective frequency and has a uniform field along the line (y-z plane). The size and position of the gap can determine the performance of the microstrip by fulfilling the previously stated conditions. A large gap prevents the flow of current along the line and can affect the uniformity of the produced magnetic field. With this in mind, we needed to find the optimal position and size of the gap. To this end, we performed numerical analysis using EM simulations to determine the effects of the gap. The simulations showing the effects of gaps in the microstrip were done by modeling a microstrip, as shown in Figure 1c. The length of the strip line was 225 mm and the width was 5 mm. The strip line was placed above a dielectric material of 5 mm height, resulting in a total width and length of 40 × 225 mm, respectively, for the ground plane. The dielectric material was assigned as Rogers RT/duroid 6006 with a relative permittivity of 6.45, and a capacitor of 1 pF was set as the loading condition to make the microstrip resonate at 300 MHz. The microstrip was excited with a Gaussian pulse with a central frequency of 300 Mhz and bandwidth of 350 MHz. The grid size was 48 × 48 × 82 for a total 188.928 k cells; this resolution was enough to ensure the model and the computational model were accurate.
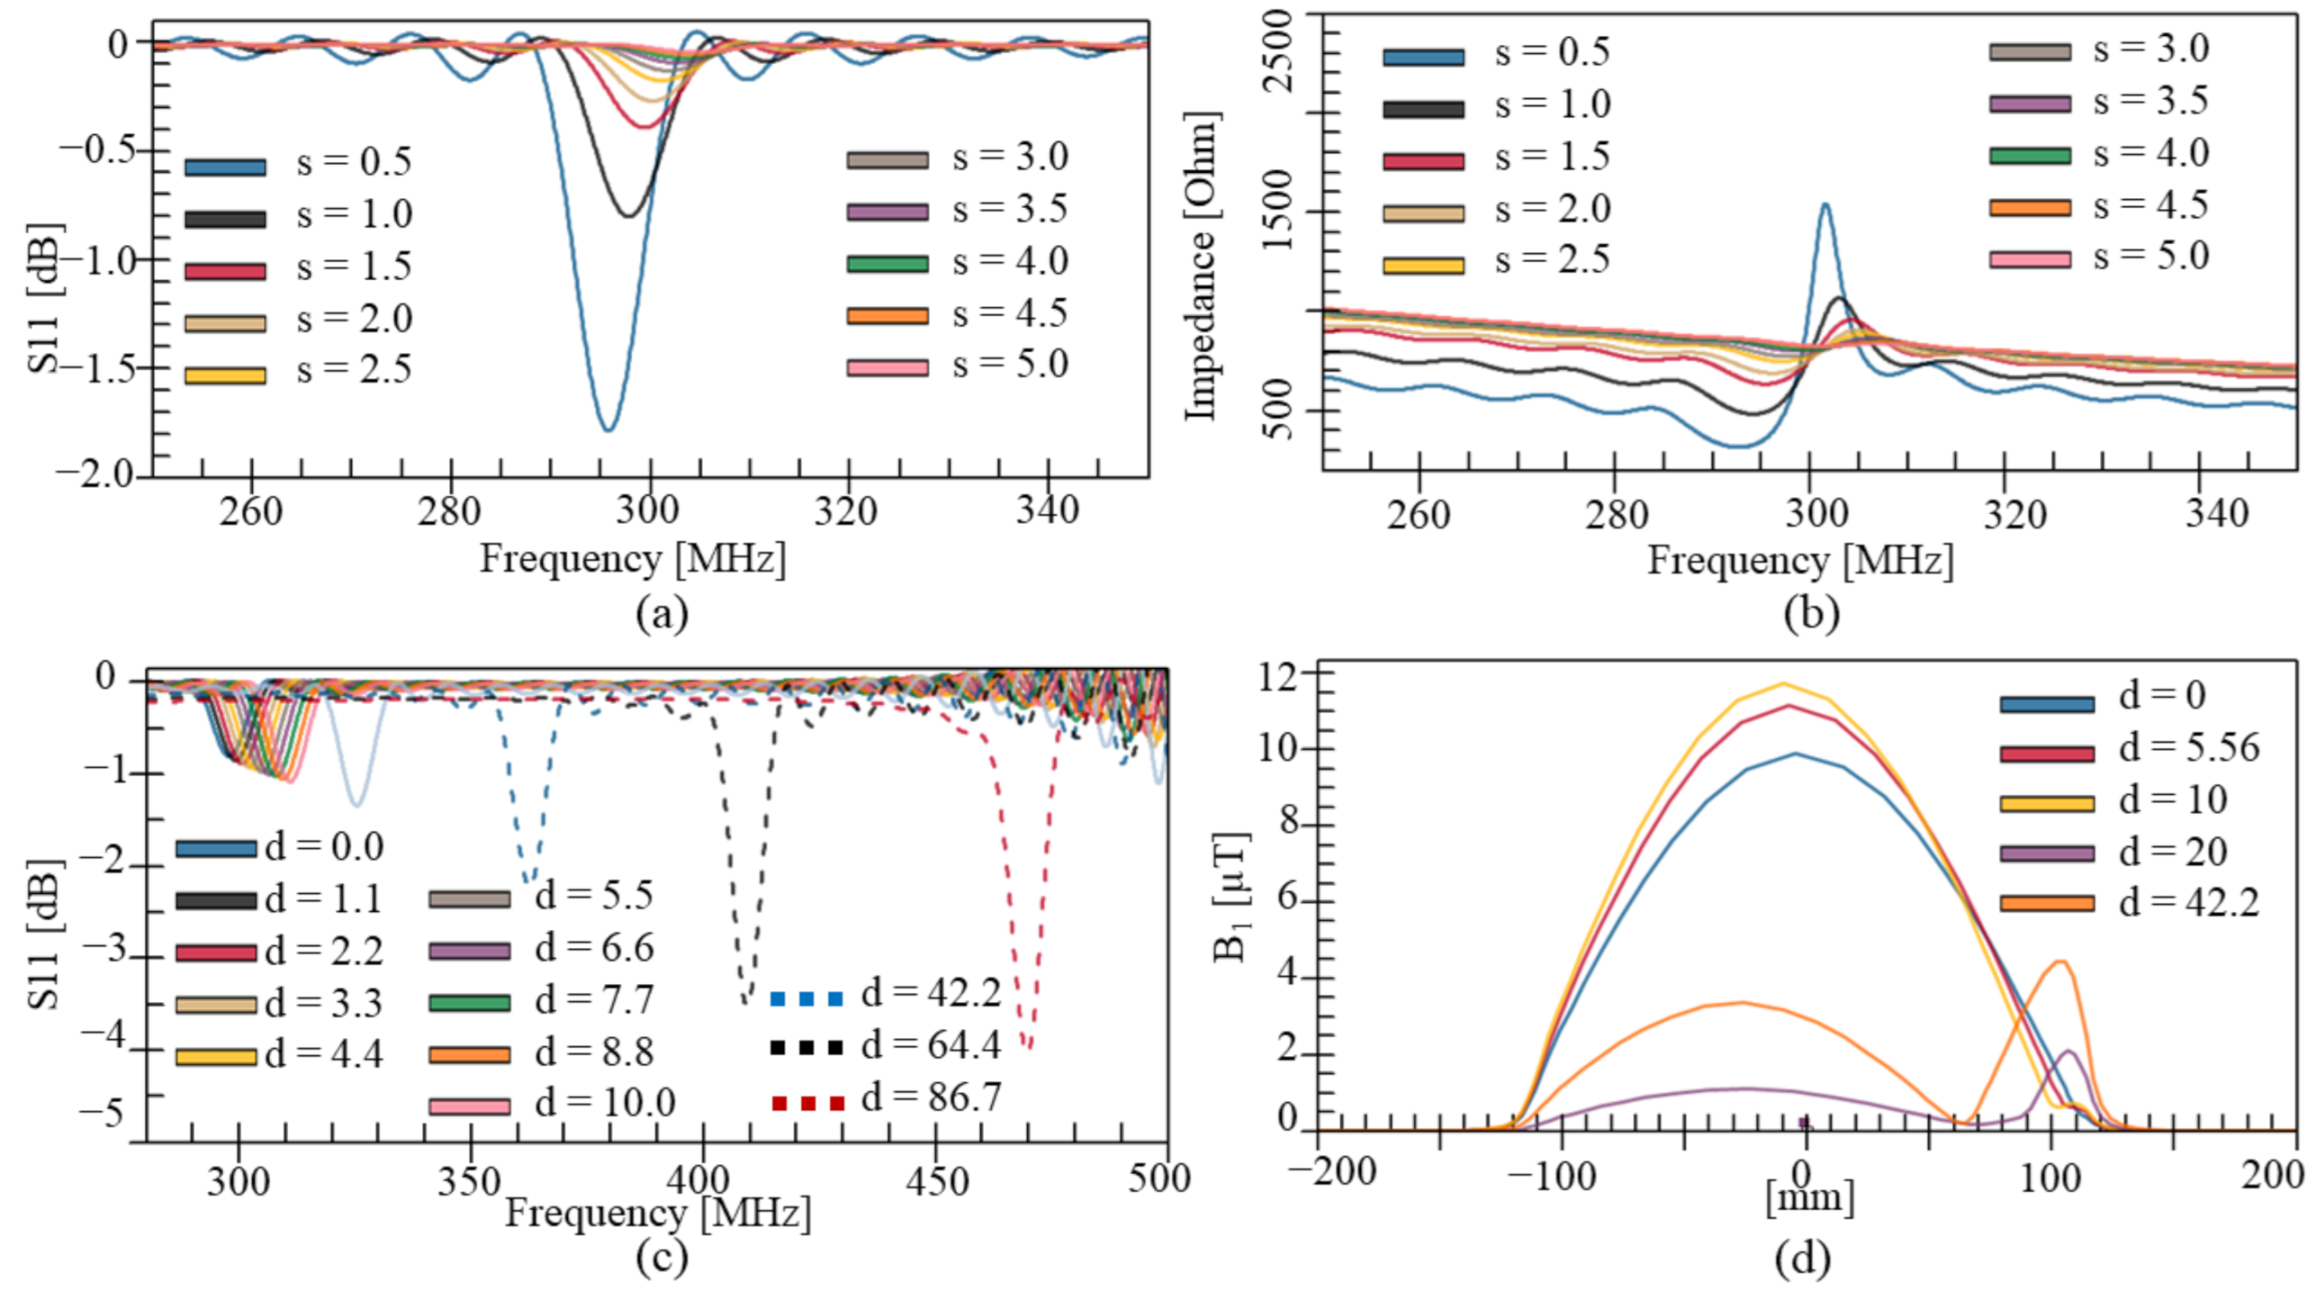
The first analysis involved changing the size of the gap from 0.5 to 5 mm, in steps of 0.5 mm each. A microstrip line for analysis purposes was designed, and the S11 parameters and impedance values were extracted. Figure 1c shows the microstrip model used for this analysis, with the close-up area showing the gap size s and the distance d. The size of the gap was changed from 0.5 to 5 mm in intervals of 0.5 mm, while the distance from the gap to the source point was maintained at 2 mm. We extracted the reflection coefficients and impedance values, as shown in Figure 2a,b, respectively. From the reflection coefficient S11 parameters, it can be seen that the gap length influences the resonance frequency. It is expected from Equations (2)–(4) that the series capacitance decreases as the gap size increases, and the resonance frequency is then shifted toward higher frequencies.
A second consideration for our application in MRI is that the |B1| field should be uniform along the y-z plane, which is important for producing uniform images. For this purpose, we used the microstrip model in Figure 1c to move the position of the gap d along the strip line. The position d of the gap was changed at two different rates; for the first rate, the position was moved from 0 to 10 mm in 10 steps and for the second, the position was moved from 20 to 86.7 mm in another four steps. For this analysis, we extracted the S11 parameters and the |B1| field profile at the center of the line along the y-z axis.
Figure 2c shows the S11 parameters of the microstrip line when the gap is moved at different positions along the line. In this case, the resonance frequencies shifted to higher frequencies when the gap was moved to the end of the line. This can be used for further tuning the microstrip to the desired frequency. However, the field uniformity is affected by the discontinuity of the gap, as show in Figure 2d, which plots the |B1| field profiles at the center of the conducting line and along the z-y plane. We only included selected plots of the distance in order to provide a better visualization. As shown in Figure 2d, the field is distorted as the gap is moved further into the line. Based on this analysis, we chose to use a gap size of 0.5 mm, with the gap as close to the source as possible.

2.2. Coplanar Interleaved Dielectric Materials

The coupling between microstrip lines has also been widely studied [48,49,50,51], and the coupling coefficient between two microstrip lines, as shown in Figure 3a, is given by:
k = 1 2 Γ e Γ o 1 0.5   Γ g Γ e + Γ o
where the Γe and Γo are the even and odd mode reflection coefficients, respectively, and the Γg is the reflection coefficient at the receiver element. The coupled impedance is given by:
Z 0 e = 60 π ε r 1 C e / ε 0 ε r
Z 0 o = 60 π ε r 1 C o / ε 0 ε r
where εr is the relative permittivity of the dielectric material, and Ce and Co are the even and odd capacitance, respectively. The even mode is related to a magnetic wall between the microstrip lines, and the odd mode has an electric wall. The coupling is dependent on the wave propagation constant and the type of loading. For the proposed arrangement, the frequencies, and therefore the wavelength, differ, which will reduce the coupling between the lines. Notice that the mutual capacitances are also dependent on the relative dielectric material [52].
We applied EM simulations for an analysis of two microstrip lines to determine the coupling between them in different scenarios, following the models shown in Figure 3. For this analysis, we modeled two microstrips with similar lengths and strip widths. The analysis consisted of checking the effects of the gap size and dielectric material. The first case used a uniform dielectric material for both lines, consisting of two straight lines (uniform-DSL), one straight line, one gapped line (uniform-OSLOGL), or two gapped lines (uniform-DGL). The second case used interleaved dielectric materials, for which one line had a dielectric material with lower relative permittivity than the other. In this case, the line structure was that same as before, with two straight lines (interleaved-DSL), one straight line and one gapped line (interleaved-OSLOGL), or two gapped lines (interleaved-DGL). The models for this analysis are shown in Figure 3b–g. The separation between the microstrips was 20 mm. The materials used for the simulations were ε1 Rogers RT/duroid 6006 and ε2 Rogers RT/duroid 6010.2LM, with a relative permittivity of 6.45 and 10.7, respectively. The S21 parameters and coupling parameters are shown in Figure 4. These results indicate that the best decoupling was achieved by using the double gapped and interleaved dielectric material, as compared to the double straight lines, which showed higher coupling than the other configurations.

2.3. Four Lines Microstrip Arrangement

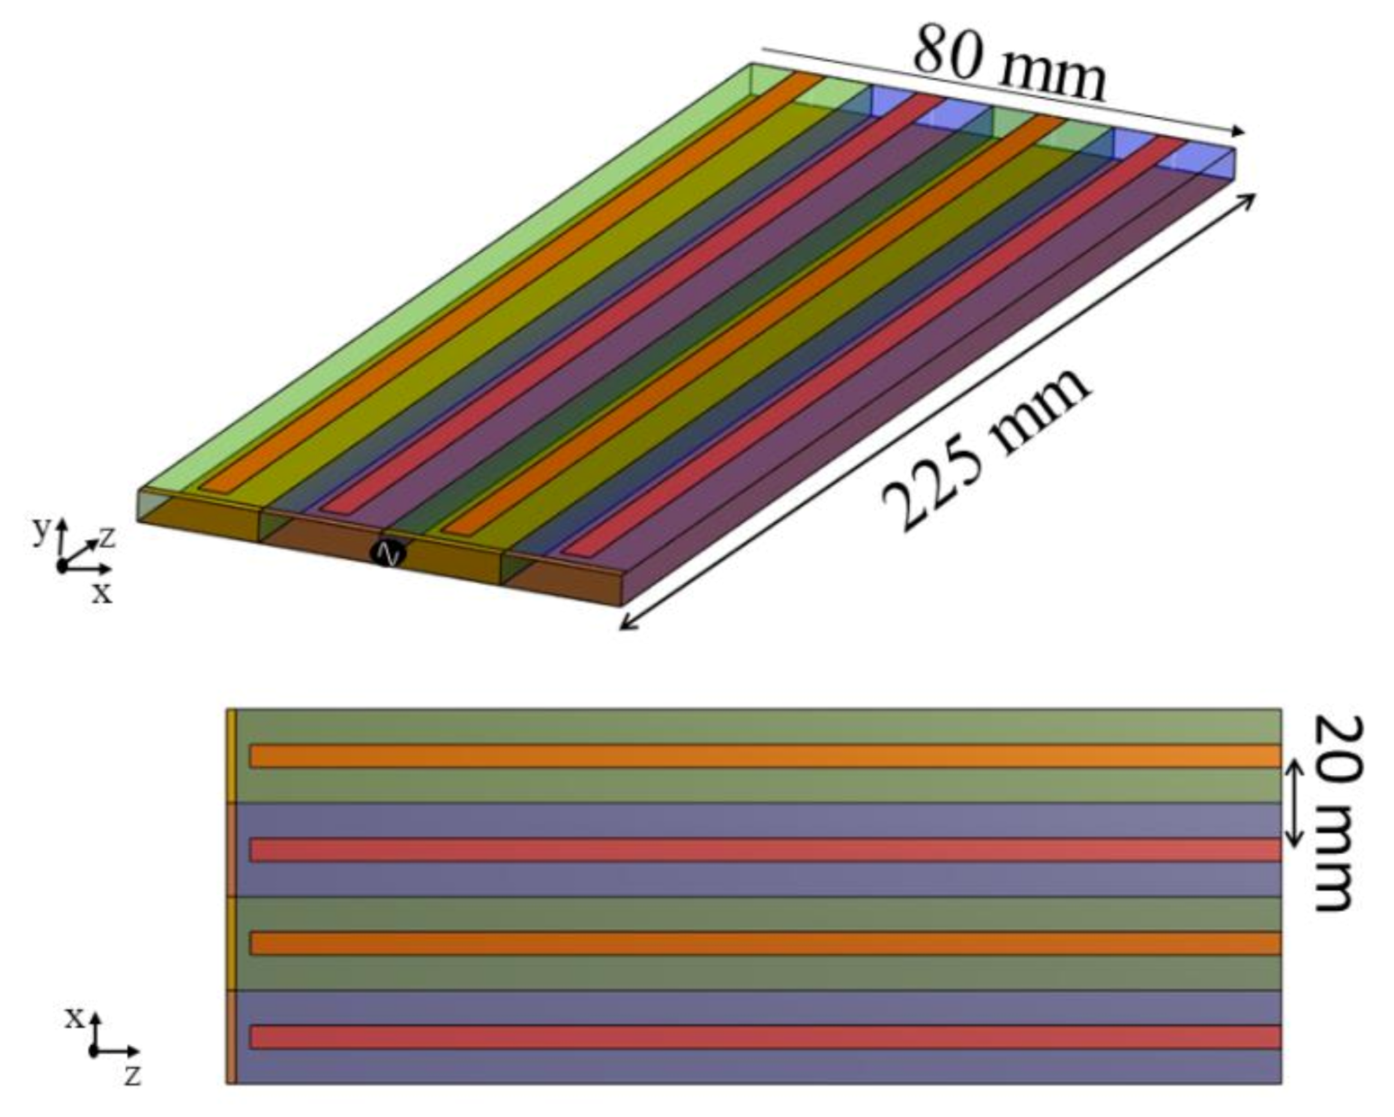
The proposed arrangement of the quadruple frequency microstrip consists of a current conductor surface that dove into four lines, with a coplanar interleaved dielectric material between the conductor line and the ground plane (Figure 5). The total size of the arrangement is 80 mm in width and 225 mm long, with a dielectric height of 5 mm. Two types of dielectric materials were used, each with a width of 20 mm and 225 mm length. The strip conductor lines were placed at the centers of each. Each of the four strip lines were fed by a single current source connected to a perpendicular line. The base feeding line had a width of 80 mm and a length of 2 mm. The four strip lines had a width and length of 5 and 222.5 mm, respectively. Each line was separated by 20 mm. A loading capacitor was added at the end of the microstrip to tune it to the right frequency.
Each line was set to operate at a different frequency of either 300, 280, 121, or 78 MHz. We opted to interleave the lines between high and low frequency, so that the frequencies were positioned in the order 300, 121, 280, and finally 78 MHz. This configuration was expected to reduce the coupling between the lines. In addition, we designed the arrangement so that the lines operating at high frequencies were placed over dielectric materials with lower relative permittivity, and the lines operating at low frequencies were placed over dielectric materials with higher relative permittivity.

3. Results

For all the EM simulations, we used the commercial FDTD software Sim4Life (Zurich, Switzerland) [53]. All simulations were performed with the conducting surface set as a perfect electric conductor with 0 mm thickness; the database for materials provided by the software was set to match the electric properties of the dielectric materials.
EM simulations were performed with the design shown in Figure 5. The arrangement had a width and length of 80 and 225 mm, respectively. The dielectric material had a thickness of 5 mm. The excitation source was attached to a base line perpendicular to the strip lines, and this base was used to apply the current to the strip lines. The dimensions of the base were 80 by 2 mm, and the source was placed at the center of the base. The microstrip arrangement was excited with a voltage source, having a Gaussian pulse with a frequency centered at 210 MHz and bandwidth of 500 MHz in order to cover all the frequencies of interest.
The goal of the design was to achieve tuning frequencies at 300, 280, 121, and 78 MHz. The dielectric material for the lower frequency lines (121 and 78 MHz) was set as Rogers RT/duroid 6010.2LM with a relative permittivity of 10.7 and conductivity of 0.00128. The dielectric material for the high frequency lines (280 and 300 MHz) was set as Rogers RT/duroid 6002 with a relative permittivity of 2.94 and conductivity of 0.000668. Each dielectric material had a width of 20 mm and length of 225 mm. The conductor strip lines were set at the centers of each substrate. The separation between the lines was 20 mm, and the dielectric materials were interleaved so that one strip line operating at low frequency was positioned next to a line operating at high frequency.
The loading condition was set with parallel capacitors. From line 1 to line 4, the corresponding capacitors were 80, 11, 100, and 15 pF. In addition, we added a parallel capacitor at the beginning of the strip lines operating at lower frequencies, allowing them to be tuned at such low frequencies, and the values of the capacitors were 65 and 18 pF. Table 1 shows a summary of the dielectric materials and the capacitor values for each of the lines operating at the corresponding frequencies.
The simulated S11 parameters for the arrangement are shown in Figure 6, with the resonance at the desired frequencies of 300, 280, 121, and 78 MHz, for the frequency response before and after applying matching circuits.
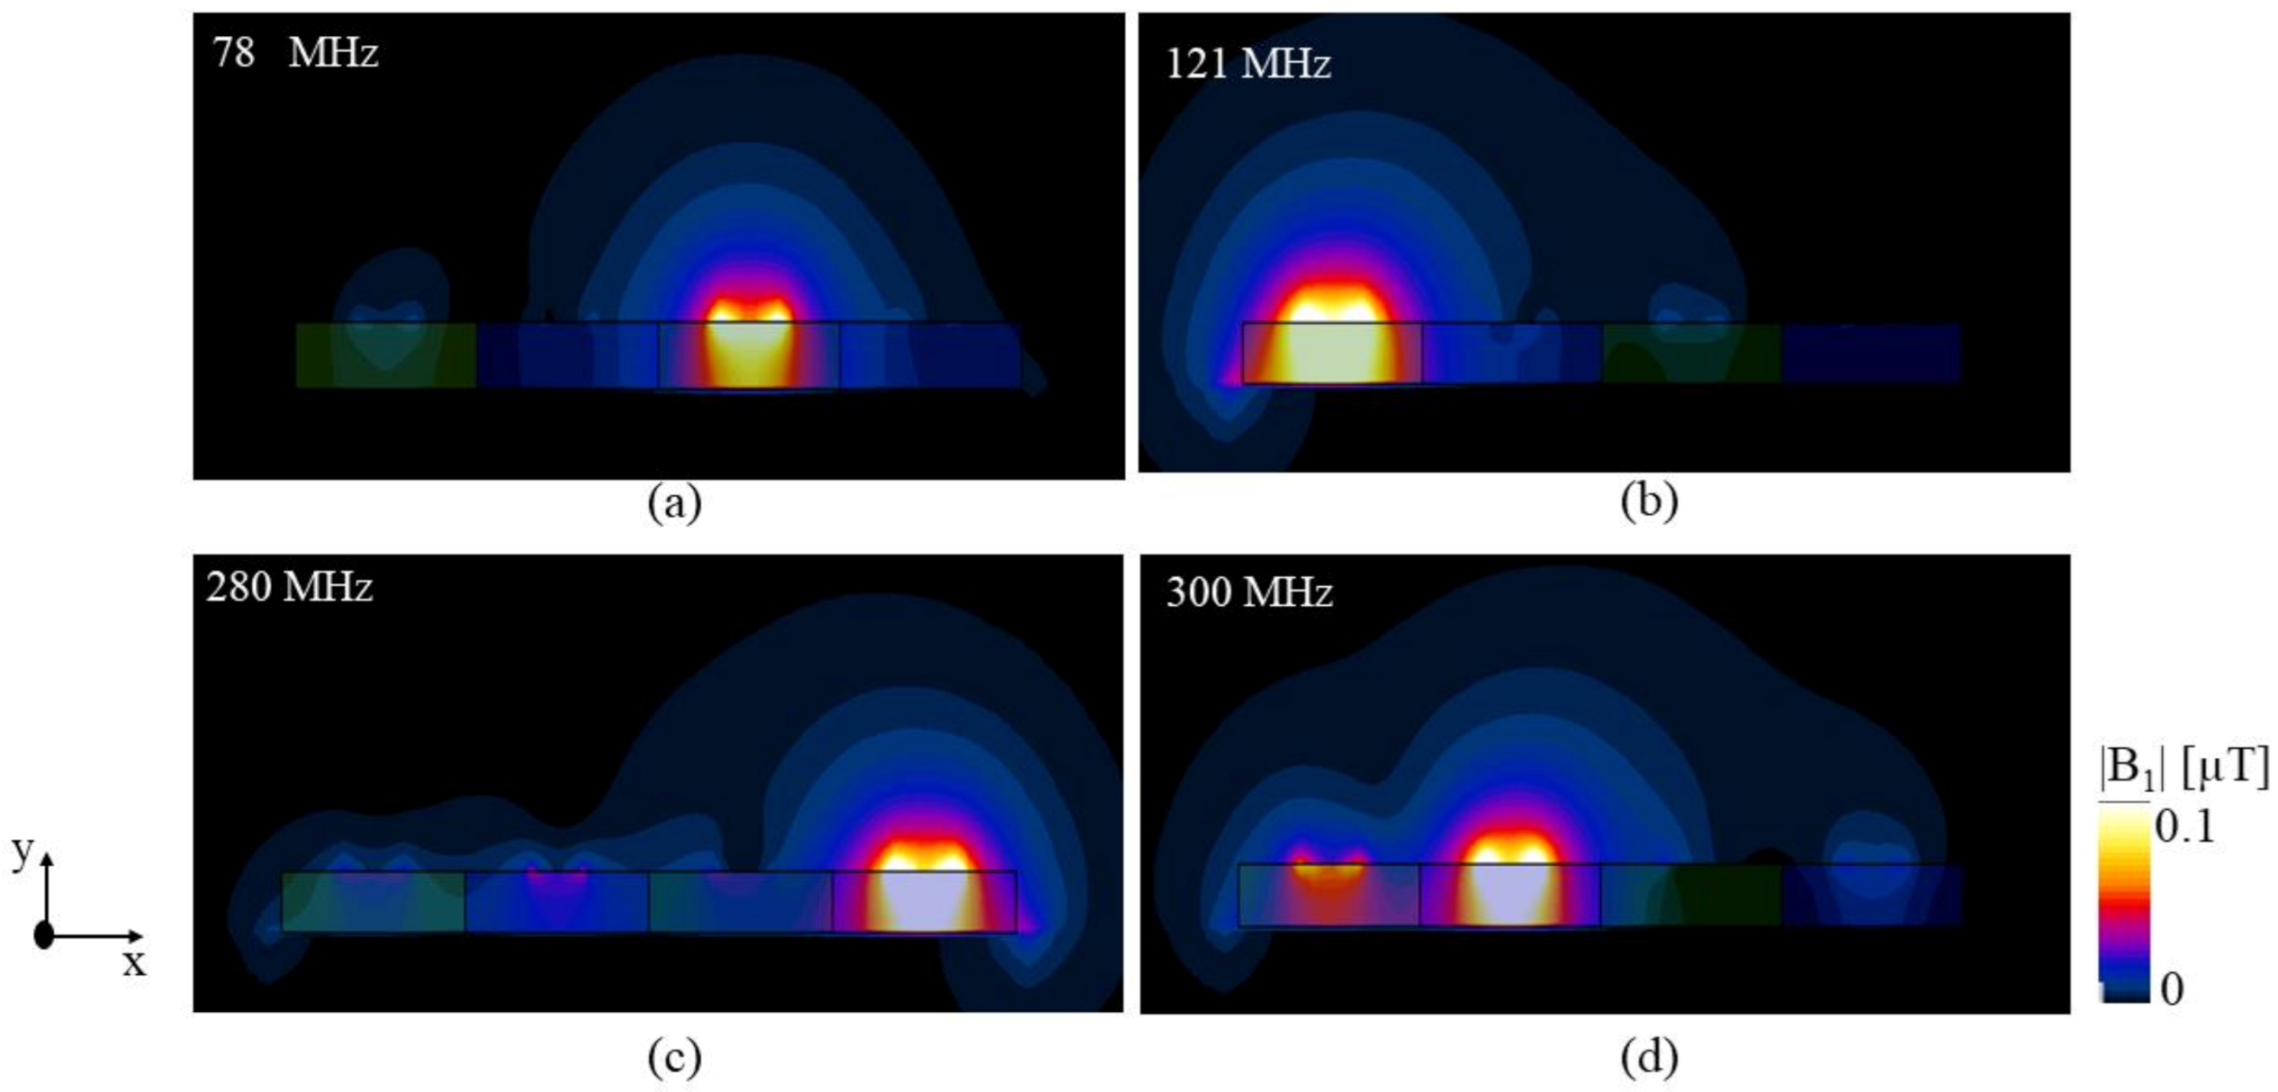
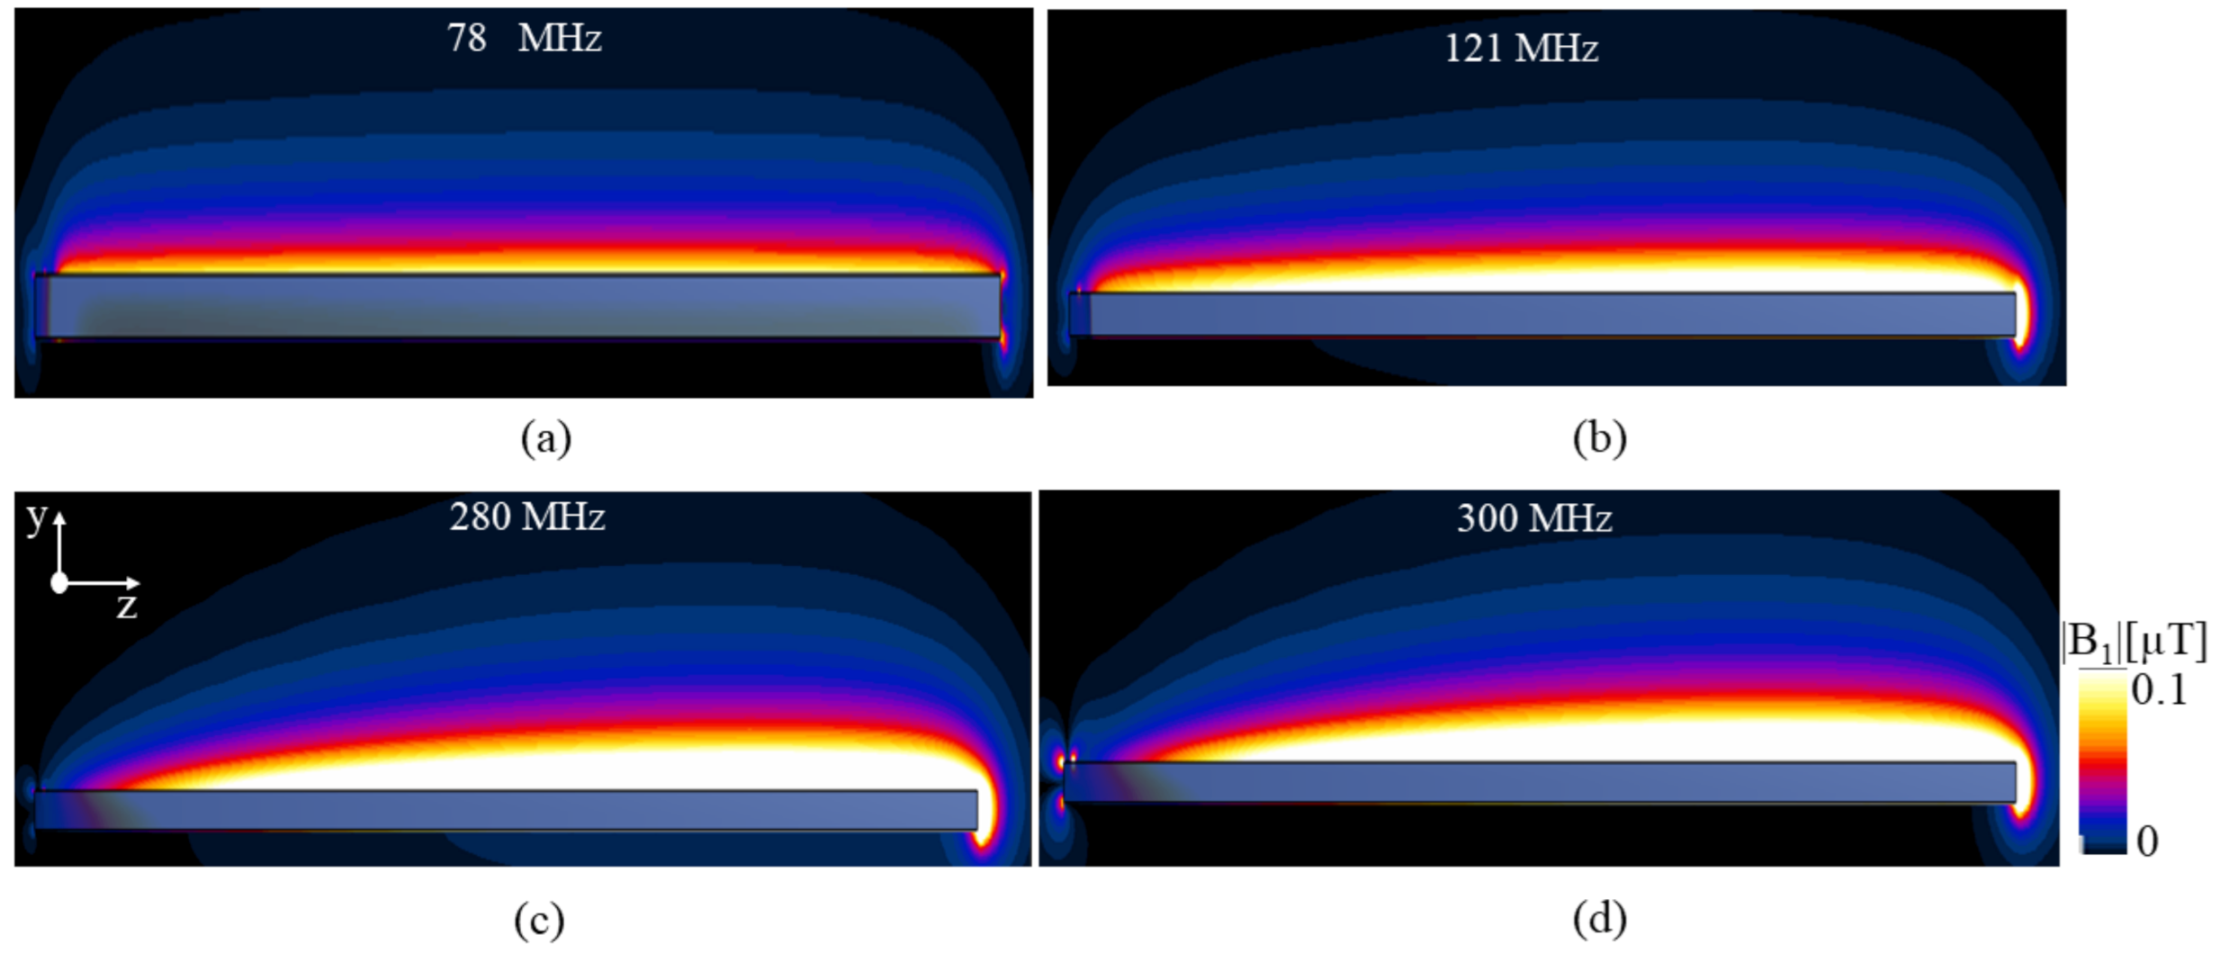
For MR applications, it is necessary to have a uniform magnetic field, especially in the z-y axis. For this reason, the |B1| fields were extracted at the corresponding strip lines. Figure 7 and Figure 8 show the axial and sagittal view field maps at each frequency. The magnetic field showed a uniform distribution with similar performance between the frequencies. The maximum and average field intensities across the different frequencies were of the same order. The maximum |B1| field was computed as 0.2, 0.4, 0.6, and 0.9 µT and the average was computed as 0.03, 0.06, 0.10, and 0.08 µT for 78, 121, 280, and 300 MHz, respectively.
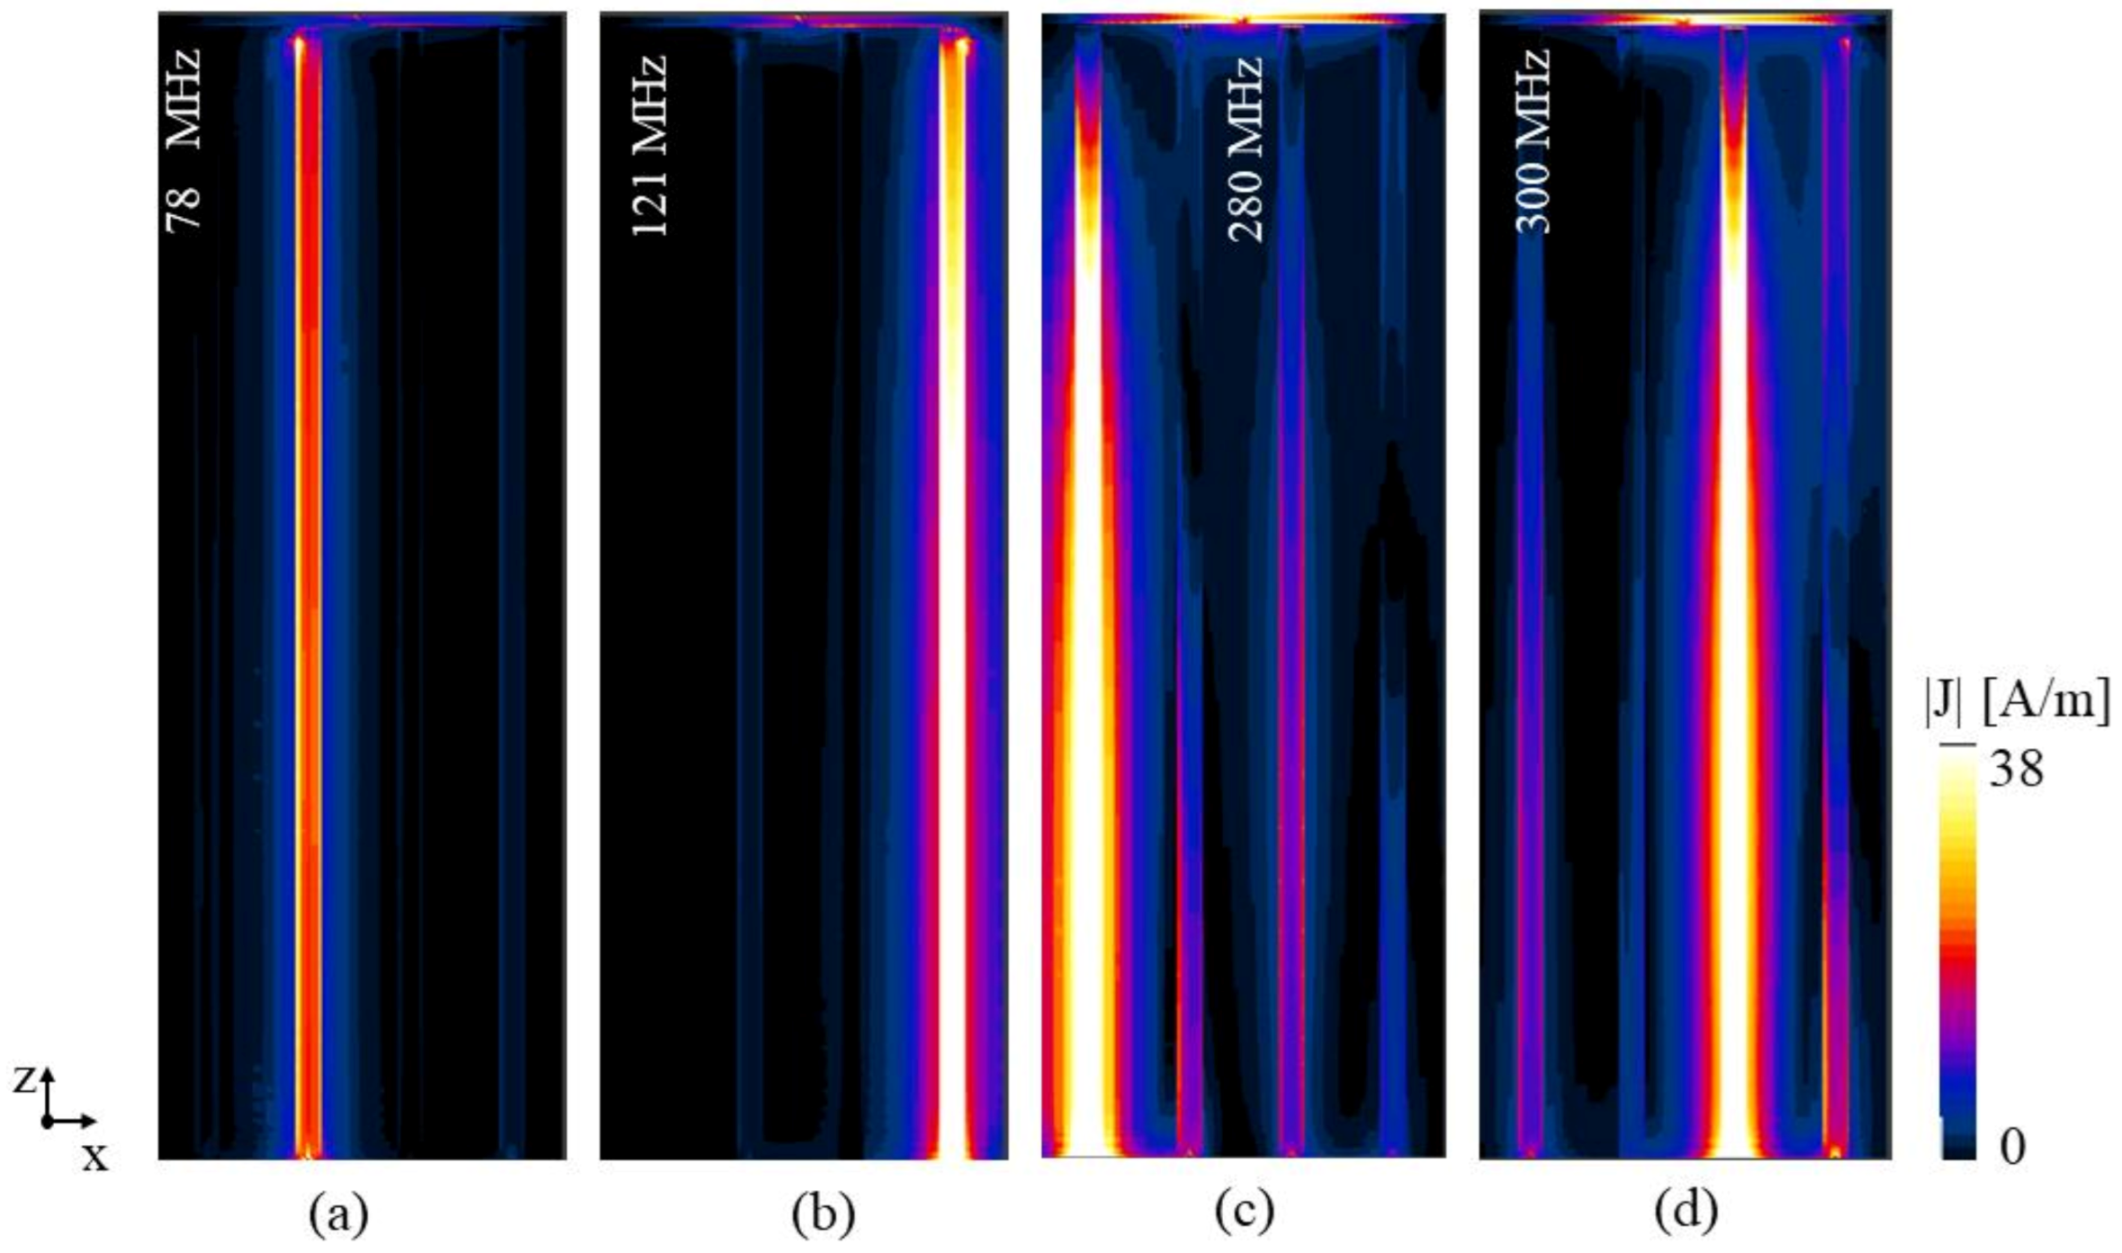
To visualize the operation of the arrangement, we also included the surface current density for each frequency in Figure 9. Each line operates at the respective frequency, while maintaining low coupling with the neighboring lines. From Figure 9, it can be noticed that the current waveform is less uniform for the case of the 300 and 280 MHz lines. This is the result of the combination of the four frequencies, which affects the optimization of the wavelength at these frequencies. However, the effectiveness of the designs still holds, as shown in the axial view in Figure 7.

4. Discussion

In this work, we present the detailed design for a microstrip capable of resonating at four different frequencies for X-nuclei MRI. We additionally provide an analysis of this tool using EM simulations. The target frequencies were set to obtain images with a 7T MR system for multi-nuclei MR, namely 1H, 19F, 31P, and 23Na, with the corresponding frequencies of 300, 280, 121, and 78 MHz, respectively.
The proposed arrangement is based on a microstrip with a dielectric material placed between the ground plane and the conductor strip. In our design, the conducting line was split into four lines separated by 20 mm, with a gap between the feeding point and the strip line. The gap is considered to be a series capacitor, which helps to adjust the tuning frequency and also to reduce the coupling between adjacent lines. In addition, the dielectric material under each of the conducting strip lines was interleaved between high and low relative permittivity. The quad strip line arrangement with coplanar interleaved dielectric materials was able to produce a uniform magnetic field at each of the target resonance frequencies.
We also presented an analysis of each of the concepts included in the final design. We first performed EM simulations showing the effects of the size of the gap in the microstrip. This analysis showed that there was a reduction in the coupling series capacitance when the gap size was increased. We also demonstrated how the field uniformity was affected by the position of the gap along the strip line. While the frequency could be modified by altering the position of the gap, this produced discontinuities in the field distribution, which would greatly affect its performance for MRI applications. Finally, we analyzed the coupling between two microstrip lines, comparing different configurations of straight lines and gapped lines, and the use of coplanar interleaved dielectric materials with different relative permittivity. The use of interleaved substrates was important in our design, as it helped achieve the resonance frequencies and reduce the coupling between lines.
The proposed method has the advantage that it can resonate at four different frequencies, and it is capable of acquiring MR images of multiple nuclei. As this design can multi resonant frequencies in a single element, this arrangement of microstrip can be applied in future works on simultaneous multinuclear imaging methods. In addition, the resonant lines are in the same plane or layer, whereas, in the conventional multinuclear RF coils, elements with different frequencies are placed in different layers, making it difficult to optimize the geometric positioning of each element.

Funding

This research was funded by the National Research Foundation of Korea under Grant NRF-2017M3C7A104722821 and by the Gachon University Gil Medical Center (Grant number: FRD 2020-15).

Institutional Review Board Statement

Not applicable.

Informed Consent Statement

Not applicable.

Data Availability Statement

No new data were created or analyzed in this study. Data sharing is not applicable to this article.

Acknowledgments

The author would like to thank Kyoung-Nam Kim and Hyunwoo Song.

Conflicts of Interest

No conflicts of interest.

References

  1. Edlow, B.L.; Mareyam, A.; Horn, A.; Polimeni, J.R.; Witzel, T.; Tisdall, M.D.; Augustinack, J.C.; Stockmann, J.P.; Diamond, B.R.; Stevens, A.; et al. 7 Tesla MRI of the ex vivo human brain at 100 micron resolution. Sci. Data 2019, 6, 1–10. [Google Scholar] [CrossRef] [Green Version]
  2. Laader, A.; Beiderwellen, K.; Kraff, O.; Maderwald, S.; Wrede, K.; Ladd, M.E.; Lauenstein, T.C.; Forsting, M.; Quick, H.H.; Nassenstein, K.; et al. 1.5 versus 3 versus 7 Tesla in abdominal MRI: A comparative study. PLoS ONE 2017, 12, e0187528. [Google Scholar] [CrossRef] [PubMed] [Green Version]
  3. Van der Kolk, A.G.; Hendrikse, J.; Zwanenburg, J.J.; Visser, F.; Luijten, P.R. Clinical applications of 7 T MRI in the brain. Eur. J. Radiol. 2013, 82, 708–718. [Google Scholar] [CrossRef] [PubMed] [Green Version]
  4. Veersema, T.J.; Ferrier, C.H.; van Eijsden, P.; Gosselaar, P.H.; Aronica, E.; Visser, F.; Zwanenburg, J.M.; de Kort, G.A.; Hendrikse, J.; Luijten, P.R.; et al. Seven tesla MRI improves detection of focal cortical dysplasia in patients with refractory focal epilepsy. Epilepsia Open 2017, 2, 162–171. [Google Scholar] [CrossRef] [PubMed]
  5. Berthier, C.; Horvatić, M.; Julien, M.H.; Mayaffre, H.; Krämer, S. Nuclear magnetic resonance in high magnetic field: Application to condensed matter physics. Comptes Rendus Phys. 2017, 18, 331–348. [Google Scholar] [CrossRef]
  6. Redpath, T.W. Signal-to-noise ratio in MRI. Br. J. Radiol. 1998, 71, 704–707. [Google Scholar] [CrossRef] [PubMed]
  7. Marzola, P.; Osculati, F.; Sbarbati, A. High field MRI in preclinical research. Eur. J. Radiol. 2003, 48, 165–170. [Google Scholar] [CrossRef]
  8. Kraff, O.; Fischer, A.; Nagel, A.M.; Mönninghoff, C.; Ladd, M.E. MRI at 7 Tesla and above: Demonstrated and potential capabilities. J. Magn. Reson. Imaging 2015, 41, 13–33. [Google Scholar] [CrossRef]
  9. Meyerspeer, M.; Magill, A.W.; Kuehne, A.; Gruetter, R.; Moser, E.; Schmid, A.I. Simultaneous and interleaved acquisition of NMR signals from different nuclei with a clinical MRI scanner. Magn. Reson. Med. 2016, 76, 1636–1641. [Google Scholar] [CrossRef] [Green Version]
  10. A Hybrid Sodium/Proton Double-Resonant Transceiver Array for 9.4 T MRI. Available online: https://ieeexplore.ieee.org/abstract/document/6756178 (accessed on 21 January 2021).
  11. Niesporek, S.C.; Nagel, A.M.; Platt, T. Multinuclear MRI at Ultrahigh Fields. Top. Magn. Reson. Imaging 2019, 28, 173–188. [Google Scholar] [CrossRef]
  12. Anisimov, N.; Gulyaev, M.; Pavlova, O.; Volkov, D.; Gervits, L.; Pirogov, Y. Multinuclear magnetic resonance imaging in biomedical experiments. J. Phys. Conf. Ser. 2017, 886, 012006. [Google Scholar] [CrossRef] [Green Version]
  13. Hu, R.; Kleimaier, D.; Malzacher, M.; Hoesl, M.A.; Paschke, N.K.; Schad, L.R. X-nuclei imaging: Current state, technical challenges, and future directions. J. Magn. Reson. Imaging 2020, 51, 355–376. [Google Scholar] [CrossRef] [PubMed]
  14. Madelin, G.; Regatte, R.R. Biomedical applications of sodium MRI in vivo. J. Magn. Reson. Imaging 2013, 38, 511–529. [Google Scholar] [CrossRef] [PubMed] [Green Version]
  15. Nagel, A.M.; Bock, M.; Hartmann, C.; Gerigk, L.; Neumann, J.O.; Weber, M.A.; Bendszus, M.; Radbruch, A.; Wick, W.; Schlemmer, H.P.; et al. The potential of relaxation-weighted sodium magnetic resonance imaging as demonstrated on brain tumors. Investig. Radiol. 2011, 46, 539–547. [Google Scholar] [CrossRef] [PubMed]
  16. Ouwerkerk, R.; Bleich, K.B.; Gillen, J.S.; Pomper, M.G.; Bottomley, P.A. Tissue sodium concentration in human brain tumors as measured with 23Na MR imaging. Radiology 2003, 227, 529–537. [Google Scholar] [CrossRef]
  17. Petracca, M.; Fleysher, L.; Oesingmann, N.; Inglese, M. Sodium MRI of multiple sclerosis. NMR Biomed. 2016, 29, 153–161. [Google Scholar] [CrossRef] [Green Version]
  18. Hussain, M.S.; Stobbe, R.W.; Bhagat, Y.A.; Emery, D.; Butcher, K.S.; Manawadu, D.; Rizvi, N.; Maheshwari, P.; Scozzafava, J.; Shuaib, A.; et al. Sodium imaging intensity increases with time after human ischemic stroke. Ann. Neurol. 2009, 66, 55–62. [Google Scholar] [CrossRef]
  19. Maril, N.; Rosen, Y.; Reynolds, G.H.; Ivanishev, A.; Ngo, L.; Lenkinski, R.E. Sodium MRI of the human kidney at 3 Tesla. Magn. Reson. Med. 2006, 56, 1229–1234. [Google Scholar] [CrossRef]
  20. Valkovič, L.; Chmelík, M.; Krššák, M. In-vivo 31P-MRS of skeletal muscle and liver: A way for non-invasive assessment of their metabolism. Anal. Biochem. 2017, 529, 193–215. [Google Scholar]
  21. Bakermans, A.J.; Bazil, J.N.; Nederveen, A.J.; Strijkers, G.J.; Boekholdt, S.M.; Beard, D.A.; Jeneson, J.A. Human cardiac 31P-MR spectroscopy at 3 Tesla cannot detect failing myocardial energy homeostasis during exercise. Front. Physiol. 2017, 8, 939. [Google Scholar] [CrossRef]
  22. Rodgers, C.T.; Clarke, W.T.; Snyder, C.; Vaughan, J.T.; Neubauer, S.; Robson, M.D. Human cardiac 31P magnetic resonance spectroscopy at 7 Tesla. Magn. Reson. Med. 2014, 72, 304–315. [Google Scholar] [CrossRef] [PubMed]
  23. Ha, D.H.; Choi, S.; Oh, J.Y.; Yoon, S.K.; Kang, M.J.; Kim, K.U. Application of 31P MR spectroscopy to the brain tumors. Korean J. Radiol. 2013, 14, 477–486. [Google Scholar] [CrossRef] [PubMed] [Green Version]
  24. Novak, J.; Wilson, M.; MacPherson, L.; Arvanitis, T.N.; Davies, N.P.; Peet, A.C. Clinical protocols for 31P MRS of the brain and their use in evaluating optic pathway gliomas in children. Eur. J. Radiol. 2014, 83, e106–e112. [Google Scholar] [CrossRef] [PubMed] [Green Version]
  25. Ren, J.; Sherry, A.D.; Malloy, C.R. 31P-MRS of healthy human brain: ATP synthesis, metabolite concentrations, pH, and T1 relaxation times. NMR Biomed. 2015, 28, 1455–1462. [Google Scholar] [CrossRef] [PubMed] [Green Version]
  26. Klomp, D.W.; van de Bank, B.L.; Raaijmakers, A.; Korteweg, M.A.; Possanzini, C.; Boer, V.O.; van de Berg, C.A.; van de Bosch, M.A.; Luijten, P.R. 31P MRSI and 1H MRS at 7 T: Initial results in human breast cancer. NMR Biomed. 2011, 24, 1337–1342. [Google Scholar] [CrossRef]
  27. Liu, Y.; Gu, Y.; Yu, X. Assessing tissue metabolism by phosphorous-31 magnetic resonance spectroscopy and imaging: A methodology review. Quant. Imaging Med. Surg. 2017, 7, 707. [Google Scholar] [CrossRef] [Green Version]
  28. Lee, D.; Marcinek, D. Noninvasive In Vivo Small Animal MRI and MRS: Basic Experimental Procedures. JOVE 2009, 32, 1592. [Google Scholar] [CrossRef]
  29. Srinivas, M.; Heerschap, A.; Ahrens, E.T.; Figdor, C.G.; de Vries, I.J.M. 19F MRI for quantitative in vivo cell tracking. Trends Biotechnol. 2010, 28, 363–370. [Google Scholar] [CrossRef] [Green Version]
  30. Schwarz, R.; Schuurmans, M.; Seelig, J.; Künnecke, B. 19F-MRI of perfluorononane as a novel contrast modality for gastrointestinal imaging. Magn. Reson. Med. 1999, 41, 80–86. [Google Scholar] [CrossRef]
  31. Ratner, A.V.; Hurd, R.; Muller, H.H.; Bradley-Simpson, B.; Pitts, W.; Shibata, J.D.; Sotak, C.; Young, S.W. 19F magnetic resonance imaging of the reticuloendothelial system. Magn. Reson. Med. 1987, 5, 548–554. [Google Scholar] [CrossRef]
  32. Han, S.D.; Heo, P.; Kim, H.J.; Song, H.; Kim, D.; Seo, J.H.; Ryu, Y.; Noh, Y.; Kim, K.N. Double-layered dual-tuned RF coil using frequency-selectable PIN-diode control at 7-T MRI. Concepts Magn. Reson. B 2017, 47, e21363. [Google Scholar] [CrossRef]
  33. Barker, G.J.; Simmons, A.; Arridge, S.R.; Tofts, P.S. A simple method for investigating the effects of non-uniformity of radiofrequency transmission and radiofrequency reception in MRI. Br. J. Radiol. 1998, 71, 59–67. [Google Scholar] [CrossRef]
  34. Effects of Tuning Condition, Head Size and Position on the SAR of MRI Dual-Row Transmit Arrays. EuMC. Available online: https://ieeexplore.ieee.org/document/6686754 (accessed on 21 January 2021).
  35. Zhang, X.; Ugurbil, K.; Chen, W. Microstrip RF surface coil design for extremely high-field MRI and spectroscopy. Magn. Reson. Med. 2001, 46, 443–450. [Google Scholar] [CrossRef]
  36. Mahendra, A.; Rahardjo, E.T. Numerical Design of Dual Resonant Microstrip Surface RF Coil for MRI Application. In Proceedings of the 2019 IEEE Conference on Antenna Measurements & Applications (CAMA), Bali, Indonesia, 23–25 October 2019; pp. 1–3. [Google Scholar]
  37. Aliane, K.; Benahmed, N.; Bouhmidi, R.; Meriah, S.M.; Bendimerad, F.T.; Benabdallah, N. Analysis and Design of a 12-Element Coupled-Microstrip-Line quasi-TEM Resonator for MRI. In Proceedings of the 2012 Spring Congress on Engineering and Technology, Xi’an, China, 27–30 May 2012; pp. 1–4. [Google Scholar]
  38. Zhang, X.; Ugurbil, K.; Chen, W. A microstrip transmission line volume coil for human head MR imaging at 4 T. J. Magn. Reson. 2003, 161, 242–251. [Google Scholar] [CrossRef]
  39. Gruber, B.; Froeling, M.; Leiner, T.; Klomp, D.W. RF coils: A practical guide for nonphysicists. J. Magn. Reson. Imaging 2018, 48, 590–604. [Google Scholar] [CrossRef] [PubMed]
  40. Naghed, M.; Wolff, I.N.G.O. Equivalent capacitances of coplanar waveguide discontinuities and interdigitated capacitors using a three-dimensional finite difference method. IEEE Trans. Microw. Theory Tech. 1990, 38, 1808–1815. [Google Scholar] [CrossRef]
  41. Martel, J.; Medina, F.; Boix, R.R.; Horno, M. Comparison between theoretical and measured microstrip gap parameters involving anisotropic substrates. IEEE Trans. Microw. Theory Tech. 1998, 46, 198–201. [Google Scholar] [CrossRef]
  42. Kompa, G. Practical Microstrip Design and Applications; Artech House: London, UK, 2005. [Google Scholar]
  43. Maeda, M. An analysis of gap in microstrip transmission lines. IEEE Trans. Microw. Theory Tech. 1972, 20, 390–396. [Google Scholar] [CrossRef]
  44. Kirschning, M. Entwicklung von Näherungsmodellen für den Rechnergestützten Entwurf von Hybriden und Monolithischen Schaltungen in Mikrostreifenleitungstechnik. Ph.D. Thesis, Universität Duisburg, Duisburg, Germany, 1984. [Google Scholar]
  45. Kirschning, M.; Jansen, R.H.; Koster, N.H.L. Measurement and computer-aided modeling of microstrip discontinuities by an improved resonator method. IEEE MTT-S Int. Microw. Symp. Dig. 1983, 1983, 495–497. [Google Scholar]
  46. Quite Universal Circuit Simulator. Available online: http://qucs.sourceforge.net/index.html (accessed on 8 October 2020).
  47. Kirschning, M.; Jansen, R.H.; Koster, N.H.L. Accurate model for open end effect of microstrip lines. Electron. Lett. 1981, 17, 123–125. [Google Scholar] [CrossRef]
  48. Ponchak, G.E.; Dalton, E.; Tentzeris, M.M.; Papapolymerou, J. Coupling between microstrip lines with finite width ground plane embedded in thin-film circuits. IEEE Trans. Adv. Packag. 2005, 28, 320–327. [Google Scholar] [CrossRef]
  49. Bryant, T.G.; Weiss, J.A. Parameters of microstrip transmission lines and of coupled pairs of microstrip lines. IEEE Trans. Microw. Theory Tech. 1968, 16, 1021–1027. [Google Scholar] [CrossRef]
  50. Matsunaga, M.; Katayama, M.; Yasumoto, K. Coupled-mode analysis of line parameters of coupled microstrip lines. Prog. Electromagn. Res. 1999, 24, 1–17. [Google Scholar] [CrossRef] [Green Version]
  51. Lee, R.F.; Westgate, C.R.; Weiss, R.G.; Newman, D.C.; Bottomley, P.A. Planar strip array (PSA) for MRI. Magn. Reson. Med. 2001, 45, 673–683. [Google Scholar] [CrossRef] [Green Version]
  52. Nishiyama, H.; Nakazoe, J. Efficient calculation of interconnect capacitance and characteristic impedance for coupled pairs of microstrip-like transmission lines. Electron. Commun. Jpn. 1997, 80, 17–26. [Google Scholar] [CrossRef]
  53. Sim4Life by ZMT. Available online: www.zurichmedtech.com (accessed on 6 October 2020).
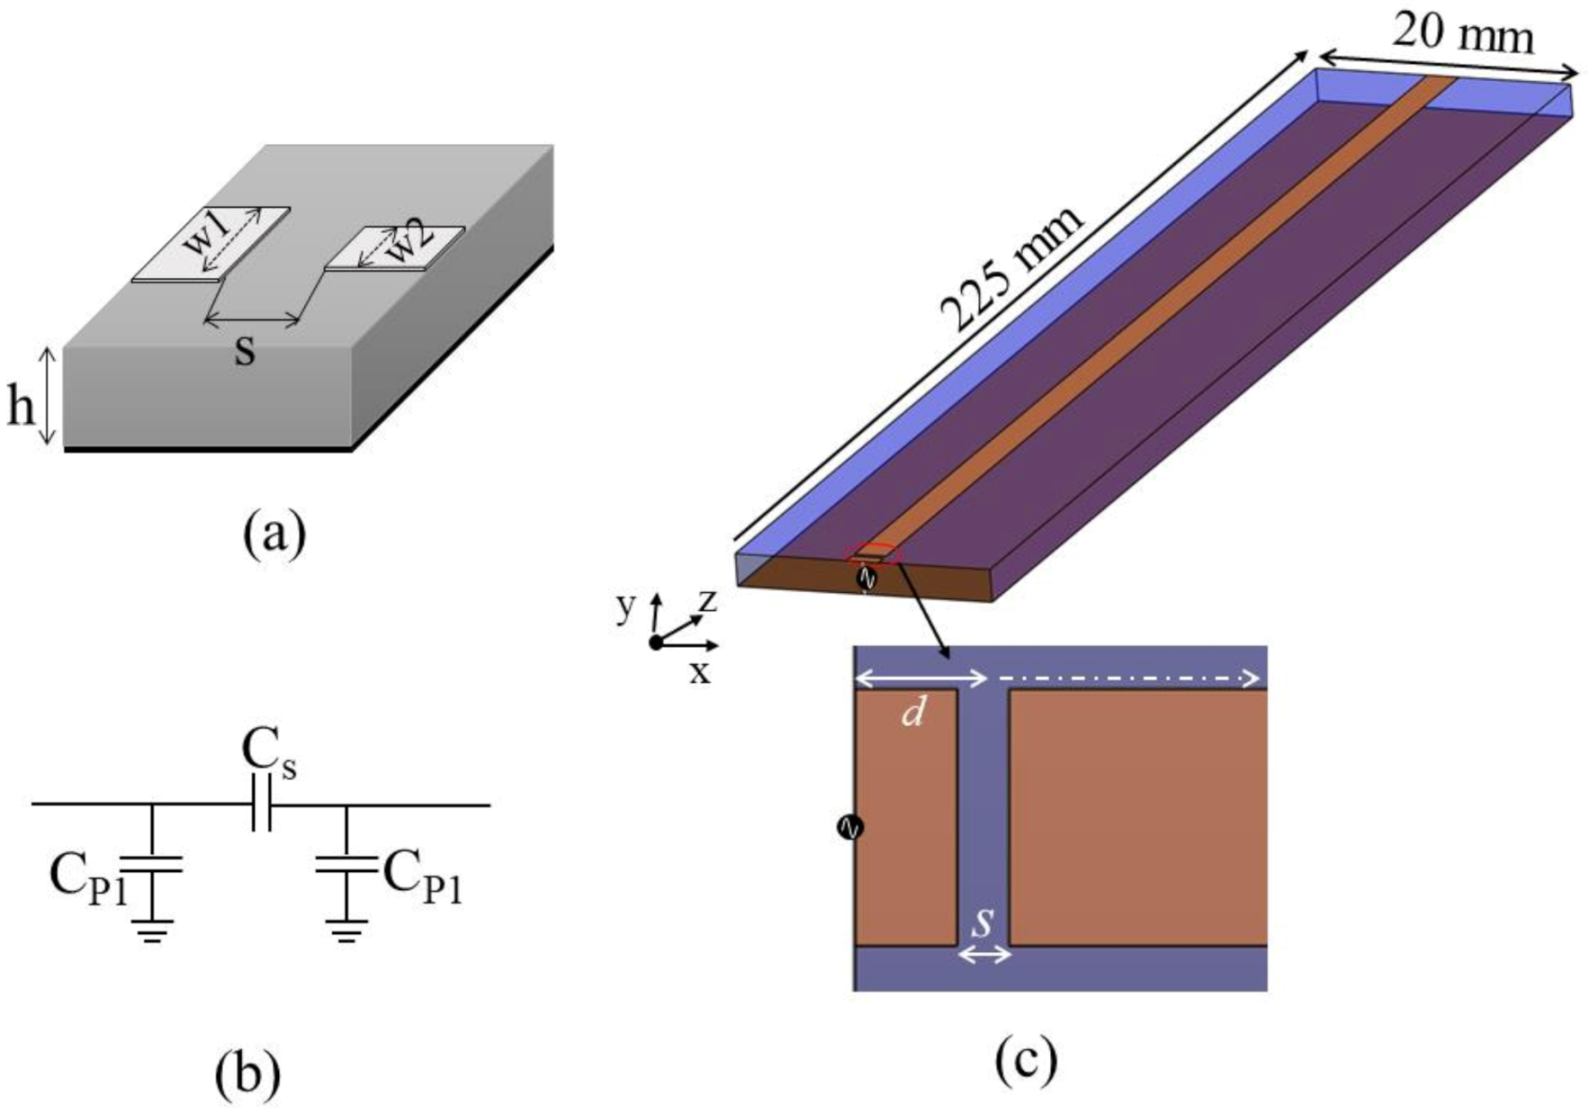
Figure 1. The model for the analysis (a) of gapped microstrips, (b) the circuit representation of the gapped microstrip, (c) the model of a gapped microstrip used for analysis of the effect of size and distance of the gap; the close-up image shows the variables s and d.
Applsci 11 00957 g001
Figure 2. The effects of the microstrip line to different gap size, (a) the S11 parameters and (b) the impedance. The effects of moving the gap along the microstrip, (c) the S11 parameters and (d) the |B1| field profile along the microstrip.
Applsci 11 00957 g002
Figure 3. (a) The models for analyzing the coupling between two microstrips depending on the dielectric material and line type, for a uniform dielectric material (b) double straight line (uniform-DSL), (c) one straight line and one gap line (uniform-OSLOGL), (d) double gapped lines (uniform-DGL), (e) (interleaved-DSL), (f) (interleaved-OSLOGL) and (g) (interleaved-DGL).
Applsci 11 00957 g003
Figure 4. The S21 parameters reflecting the coupling between two microstrips for different configurations.
Applsci 11 00957 g004
Figure 5. The proposed design of the coplanar interleaved gapped microstrips consisting of four conducting lines.
Applsci 11 00957 g005
Figure 6. The S11 parameters of the proposed microstrip arrangement, showing the respective resonance frequencies, (a) before matching circuit, and (b) after using matching circuit.
Applsci 11 00957 g006
Figure 7. The x-y plane |B1| field and localization at each line for (a) 78, (b) 121, (c) 280, and (d) 300 MHz.
Applsci 11 00957 g007
Figure 8. The y-z plane |B1| field and localization at each line for (a) 78, (b) 121, (c) 280, and (d) 300 MHz.
Applsci 11 00957 g008
Figure 9. The surface current density distribution of the z-x plane at (a) 78, (b) 121, (c) 280 and (d) 300 MHz.
Applsci 11 00957 g009
Table 1. The composition of the dielectric materials and capacitors for each conducting line.
Line
Number
Frequency
[MHz]
Dielectric
Permittivity
Loading
Capacitor
[pF]
Parallel
Capacitor
[pF]
112110.78018
23002.9411-
37810.710065
42802.9415-
Publisher’s Note: MDPI stays neutral with regard to jurisdictional claims in published maps and institutional affiliations.