5.1. Experimental Results
This section presents the experimental results for different environmental conditions and how these conditions affect PV array performance. Wind speed, temperature, solar irradiance, and PV production data were sampled in five-minute increments during the months in which there was no snow coverage on the array. Data were collected and analyzed from June 2018 to October 2018 and from March 2019 to November 2019 with the exception of April 2019 and July 2019 due to missing data for both months. Hourly averages were computed each day from 5 a.m. to 6 p.m., excluding the early mornings and evening hours when uncertainty in solar irradiance is high.
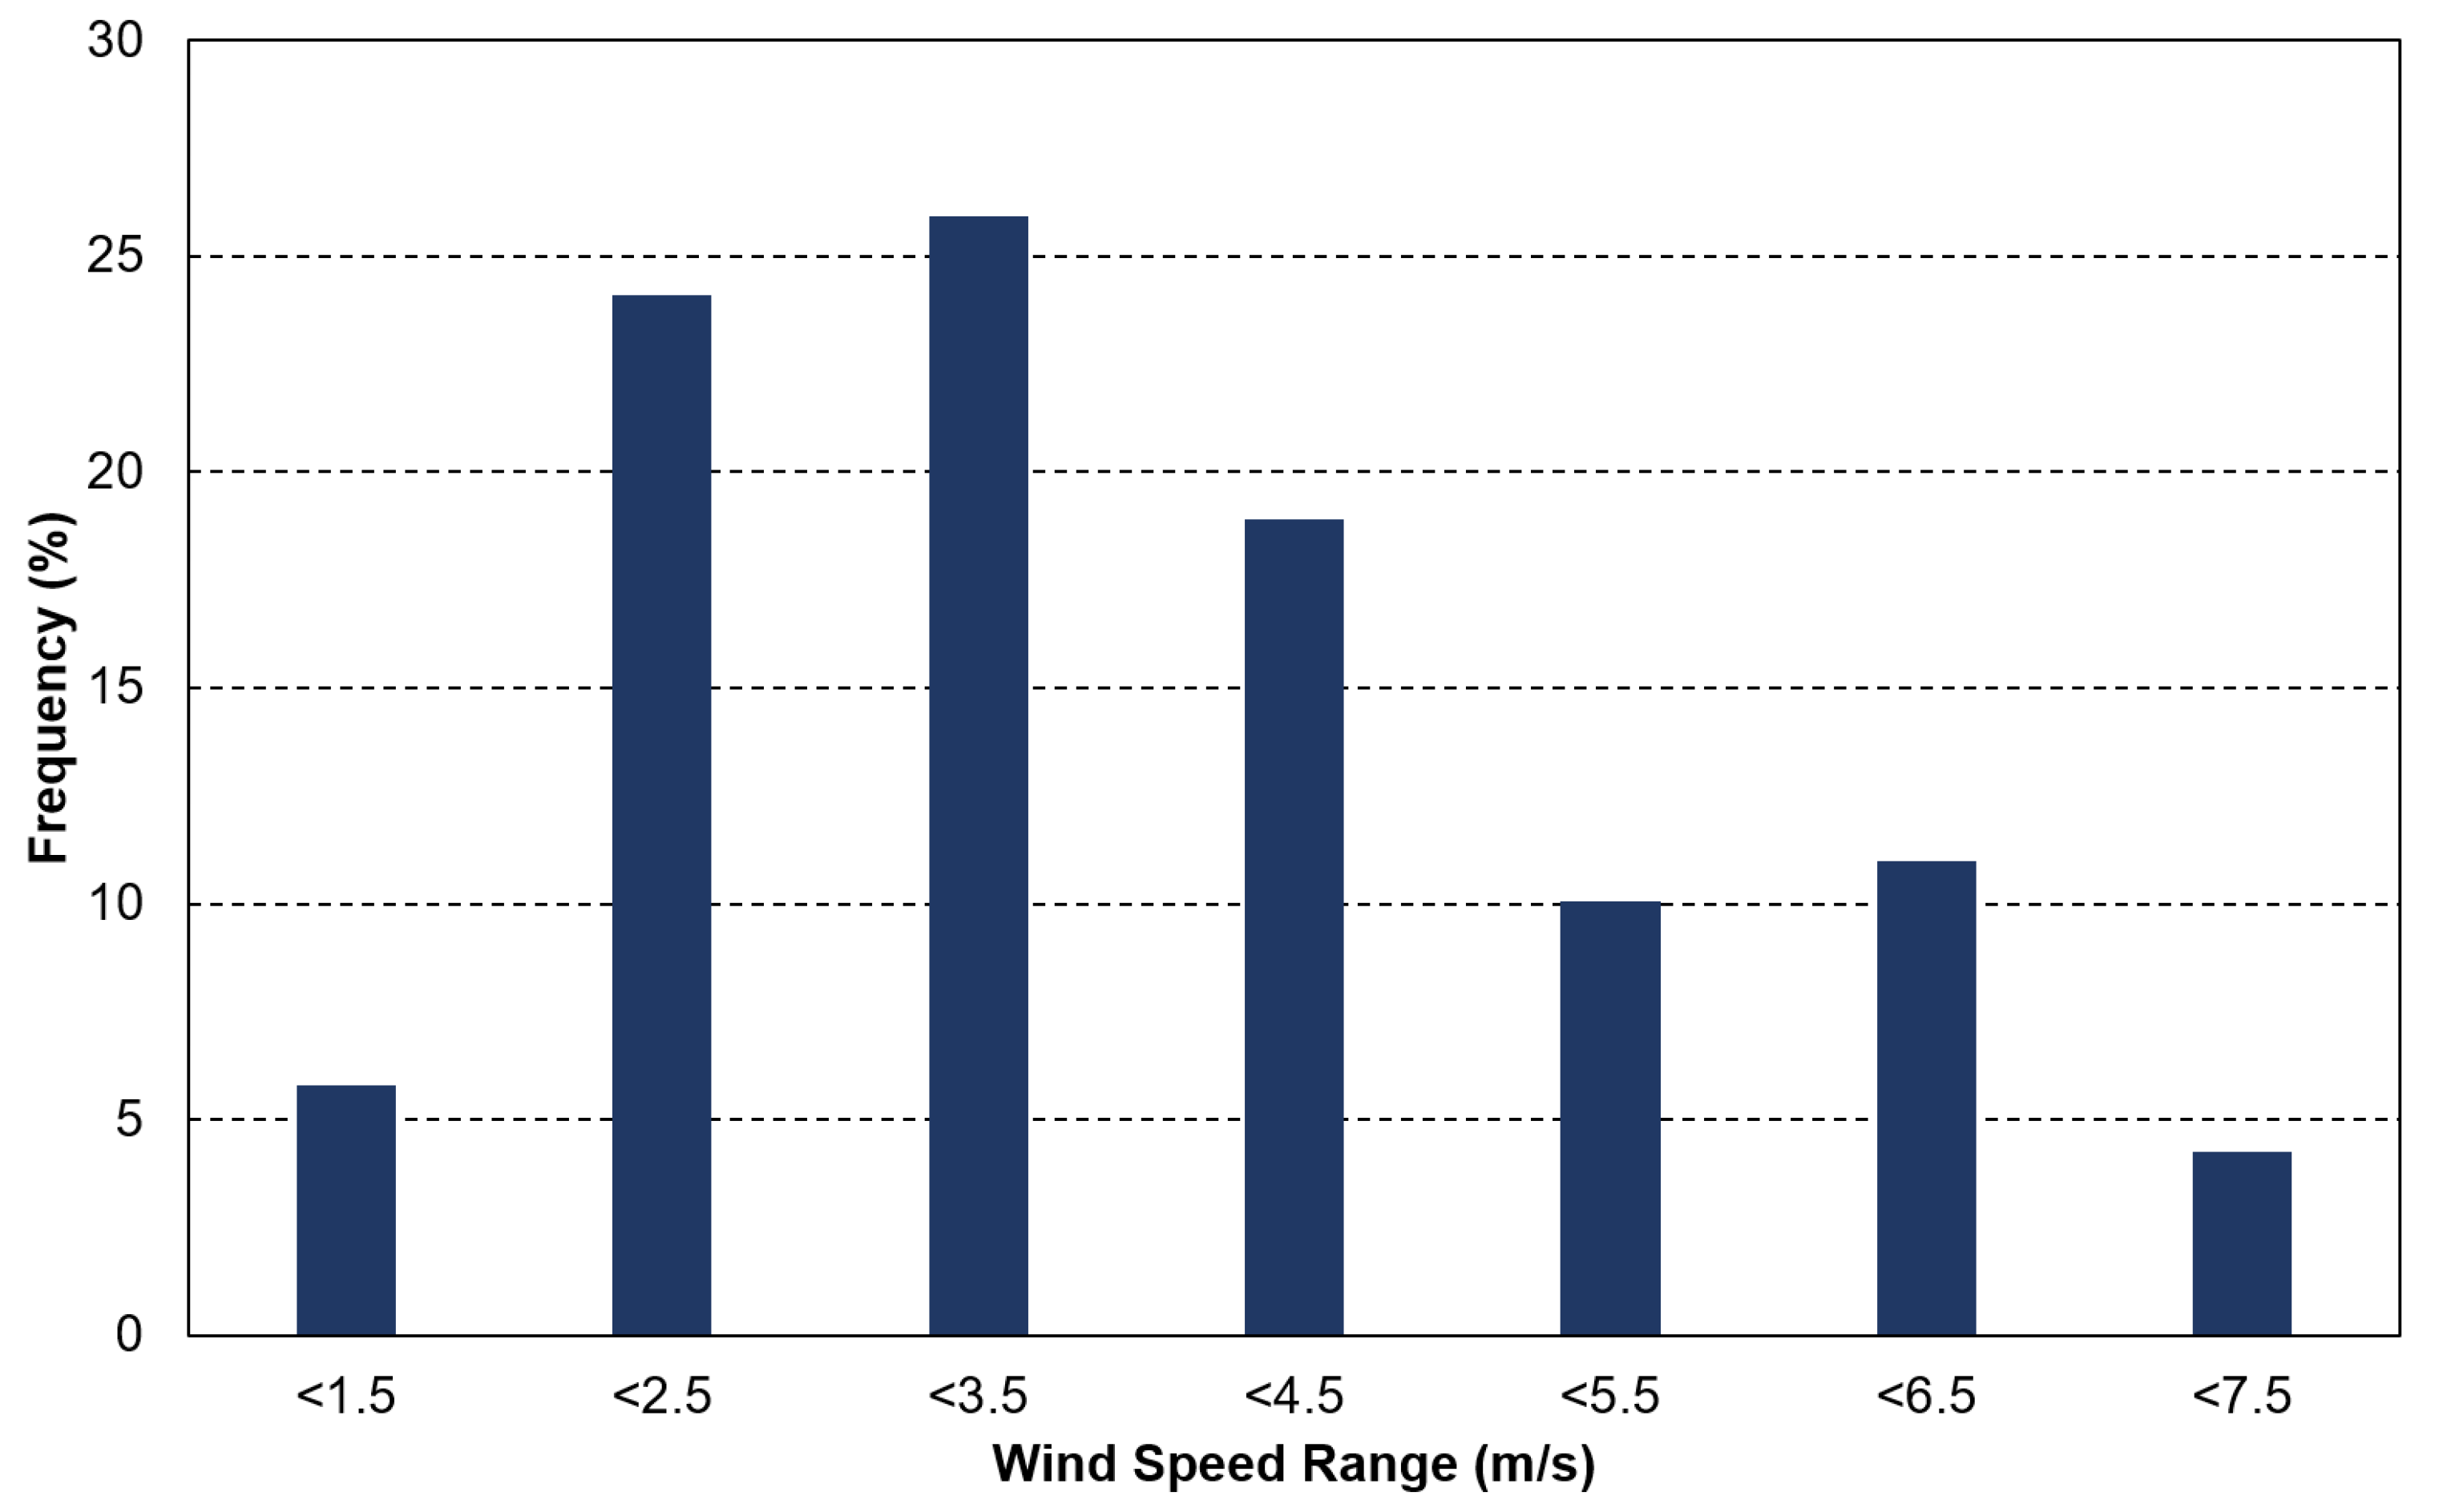
The histogram shown in
Figure 4 displays the frequency distribution of wind speeds in which wind data were collected. It can be seen that during this period, most of the wind speeds fall between 1.5 and 4.5 m/s.
Figure 5 illustrates the histogram for temperature in the months of interest. As we are focused on the months without snowfall and from dawn to dusk, recorded temperatures lie between 15 and 35 °C. It is well known that ambient temperature has a significant effect on array temperature, which in turn affects PV performance, and the data collected in this work are used to quantify the effects of array efficiency and ambient temperatures.
Figure 6 shows the electrical conversion efficiency vs. array temperature. Efficiency is determined using measured AC power outputs and plane of array irradiance. In controlled laboratory experiments, PV efficiency decreases linearly with temperature. Every point in
Figure 6a shows the hourly average value for efficiency and temperature during the period of interest. There is a clear general trend that, as array temperature decreases, the efficiency increases. However, as the temperature drops below 10 °C, we noticed a significant drop in efficiency; this is due to weather events such as rain. We then divided the level of solar irradiance into three levels, low (
Figure 6b, 100 to 399 W/m
2), medium (
Figure 6c, 400 to 699 W/m
2), and high (
Figure 6d, 700 to 1100 W/m
2). This grouping allows us to isolate sunny weather in order to study the effects of wind on power production. In all three groupings, we observe near-linear trends between array temperature and efficiency. The red line is the efficiency line provided by the manufacturer, using an efficiency of 15.23% at an ambient temperature of 25 °C, using
%/°C. However, as shown in
Figure 6d, efficiency reported by the manufacturer does not match closely with data measured in the field.
It is noteworthy that measuring AC output power encompasses a variety of system losses in addition to temperature effects that will reduce power output. These include AC and DC wiring resistive losses, power mismatch between modules and strings, inverter conversion efficiency loss from DC to AC (dependent on array operating power point), partial shading, dust accumulation, and reflection from the glass. Furthermore, DC to AC inverter conversion efficiency depends on the DC voltage and AC output power. Depending on light levels seen by the array, conversion efficiency losses will change. Under low-light conditions, conversion losses will be larger. However, since we are focused on higher solar irradiance levels, we expect a CEC (California Energy Commission) weighted efficiency of approximately 96%. Thus, the trends reported are expected to be consistent with a small offset due to conversion losses.
The temperature difference between array temperature and ambient has been reported as a function of wind speed, wind direction, solar irradiance, and ambient temperature [
21].
Figure 7 presents the temperature difference between the array and ambient air as a function of wind speed. Furthermore, looking at the energy balance shown in Equation (
2), the rate at which heat is lost to the environment is directly proportional to the temperature difference between the array temperature and ambient temperature. As wind velocity increases, the temperature difference decreases, somewhat linearly. It also illustrates the importance of air flow in producing a change in temperature difference, which will significantly affect array efficiency.
In addition to wind speed, wind direction has been shown in previous work [
13,
14,
24] as an important variable of interest in PV cooling. We compiled experimental data and plotted array and ambient temperature difference with wind direction in
Figure 8. It shows that for this case, wind direction does not significantly affect heat transfer and does not affect the overall performance of the array. Thus, it is a fair assumption to neglect wind direction in determining the thermal loss factor/heat transfer coefficient.
It is well known that ambient temperature has a significant effect on PV performance, and this is shown in
Figure 9. As ambient temperature becomes warmer, the efficiency declines.
Figure 10 shows the relationship between electrical efficiency and ambient temperatures at wind speeds of 0, 3, 4, and 5 m/s. These speeds were chosen due to completeness of data, and these plots illustrate the variation in efficiency at ambient temperatures between 6 and 35 °C. We can clearly observe the dependence of PV efficiency with ambient temperature in all wind speeds, with increasing ambient temperature, leading to decreasing PV efficiency. At 0 m/s, the mean efficiency is between 13.2% and 14.1% in the range of 15 and 28 °C, or
%/°C. At 3 m/s, the mean efficiency lies between 12.7% and 14.3% in the range of 13 and 35 °C, or
%/°C. At 4 m/s, the mean efficiency lies between 13.5% and 14.7% in the range of 7 and 33 °C, or
%/°C. At 5 m/s, the mean efficiency lies between 13.4% and 14% in the range of 18 and 30 °C, or
%/°C. This means that, as wind speed increases, we observe that the average slope of efficiency and ambient temperature decreases. Additionally, when wind speed increases, the thermal loss factor/heat transfer coefficient increases, and the temperature difference between array and ambient decreases.
The PV efficiency data were also compiled and plotted against wind speed, shown in
Figure 11 as a box plot. As velocity increases from <1.5 to 5.5 m/s, we see the mean efficiency increase from 13.2% to 13.8%, or approximately a 5% increase in relative efficiency. Thus, wind effects should be part of the design consideration. Based on these observations, it is important to note that interactions between building structures and wind can significantly affect the air flow. Thus, PV engineers should take these effects into account when selecting the location of PV array, similar to that of a small wind turbine site assessment. Onsite wind resource measurements should be conducted for a minimum of one year using anemometers, wind vanes, and temperature sensors that are mounted as close to the location where PV arrays will be placed [
25,
26].
5.2. CFD Results
CFD simulations were conducted to study the influence of wind speed on thermal loss factor/heat transfer coefficient, temperature distribution, and modes of heat transfer.
Figure 12 shows CFD simulation and experimental measurement of thermal loss factor/heat transfer coefficient as a function of wind speed for a heat flux of 800 W/m
2. Heat transfer coefficients/thermal loss factors were calculated using Equation (
2), where temperature and solar irradiance data were obtained from experiments. The efficiency values were calculated based on power production and solar irradiance. Simulations were also conducted for 600, 800, and 1100 W/m
2; however, the results are very similar, so the data for 800 W/m
2 were chosen to be presented in this work. The CFD and experimental results match closely with a similar trend. Their suggestion was that the heat transfer coefficient increases nearly linearly with wind speed, as assumed by the PVsyst model in Equation (
3). However, the free-standing thermal loss factor values suggested from PVsyst,
W/m
2·K and
W/m
2·K/(m/s), do not produce comparable results with that of experimental and CFD simulations. However, it is interesting to note that at low wind speeds (<4 m/s), the suggested values from PVsyst do fall within the range seen in our experimental data. Based on our empirical results, we recommend a new range of values for
and
for free-standing PV, listed in
Table 5.
As wind speed increases, the relative importance of radiation and convective heat transfer also changes, as seen in
Figure 13. At 1 m/s, convection only contributes to 35% of total heat transfer, while at 9 m/s, the share increases to approximately 75%. At greater than 3 m/s, the convective heat transfer process becomes the dominant mode. Furthermore, wind speed also significantly affects the temperature profile along the PV array. Looking at
Figure 14, at a lower wind speed of 1 m/s, we see as much as a 25 °C difference in temperature in the array, while at higher winds, the temperature becomes more uniform. This thermal cycling can affect the longevity of the PV array [
27,
28].


